1. Introduction
Electrification of transport is identified by legislators, governments, vehicle manufacturers and customers as vital to decrease the emission levels from the transport sector [
1,
2]. Sales of battery electric cars are increasing rapidly [
3], in some countries already representing close to 50% of new vehicle sales [
4]. Sales of new combustion engine vehicles are in some countries prohibited already from 2025 [
5,
6]. However, more challenges arise when it comes to electrifying the heavy transport sector. Fully electric city buses do exist and charging mainly occurs at the end stops of the specific route or at night time. The same can be, and is, applied to certain distribution of goods. Regional buses and long haul truck transport, however, has yet to see the shift to fully electric propulsion. The main challenge to resolve is the limited energy storage conventional batteries can supply. The cost and payload penalty of batteries is still a challenge for full electric heavy duty trucks. The other challenge is the charging of said battery, and the charging infrastructure is not at the level at which it could supply the needed power and energy to all the vehicles.
A solution to this problem can be electric road systems (ERSs) where electric power can be fed to the vehicle while in motion. This can reduce battery capacity requirement and thereby the cost of the battery and the whole vehicle [
7]. Electric road systems can be either conductive or inductive and a number of solutions are being tested at different levels of readiness [
8]. Conductive and inductive ERS solutions have a number of advantages and disadvantages over one another. The main advantage conductive has over inductive is that higher power (hundreds of kW) is achieved with relative ease, whereas the inductive charging by nature galvanically isolates the vehicle from the supply, which is an important safety feature. With regards to safety, the conductive approach to energy transfer is more challenging than the inductive approach as exposed live parts are inevitable. Part of the solution to this can be to either install the supplying rails so that only a bespoke current collector can reach it or by segmenting the rails so that only the parts beneath the vehicle are live at any given instance. Other disadvantages to conductive dynamic energy transfer is that it is more exposed to the elements than an inductive solution can be and also the mechanical wear which implies a certain degree of maintenance is required.
This study focuses on conductive ERS since this solution, as of current development, seems more likely to be a viable option for the high power needed by heavy transport. As mentioned above, the safety aspect must be addressed to a larger extent when considering conductive ERS than inductive. When transferring power from a conductive ERS, a connection to protective earth cannot be guaranteed meaning that should an isolation fault occur on board the vehicle the chassis could be put on dangerous electric potential with respect to ground. In order to minimise the risk of this occurring, one can either (1) doubly isolate all of the high voltage components on board the vehicle or (2) galvanically isolate the supplying voltage system and the on board voltage system, for example by means of an isolated DC-DC converter or other means that provide the same functionality.
One important challenge with the implementation of ERS, conductive or inductive, is the localisation of the ERS sections since it is not necessary nor feasible to cover every meter of every road with ERS. Several aspects need to be taken into account when deciding where the ERS sections should be placed, like traffic volume, grid power availability, power needed by the vehicles, and total energy consumption to name a few. This study investigates the influence on energy consumption and battery degradation with regard to two different approaches to placing the ERS sections. In the first approach, the sections are equally long and placed at a certain constant distance from each other, here called the EQU method. In the second approach, the localisation of the sections is adapted to where high traction power is needed by the vehicles, here called the ADA method. The motivation for investigating the ADA is that the overall energy consumption might be lowered if the ERS sections are placed where the power need is high, compared to the first approach where the sections are placed ‘blindly’ with no regard to the power need of the vehicles as with the EQU method.
The evaluation is performed by simulating a city bus and a long haul truck, on one, for the vehicle type, representative drive cycle. Furthermore, three different powertrain topologies are investigated, each with a different approach to energy transfer from an ERS. As the electrical powertrain on-board, the vehicle is responsible for energy transfer to both the traction drives as well as the battery, and the powertrain is referred to as a ‘Energy Transfer System’ (ETS). The ETSs presented in this paper are also presented in [
9], where emphasis is put on the modelling of the systems and where no consideration to an adaptive philosophy to localise the ERS is put.
It is shown that the energy consumption can be lowered if the ERS sections are localised with the ADA method rather than the EQU method. The degradation of the battery is also found to be decreased, under certain circumstances, with the ADA localisation method.
2. Related Work and Contribution
This paper contributes with knowledge regarding the impact of the conductive ERS localisation on energy consumption and battery ageing of the vehicle in conjunction with three different on-board ETSs. In literature, publications related to dynamic energy transfer of electric vehicles mostly concern wireless, inductive, methods. Several of these, References [
10,
11,
12], investigate and optimize the size, layout, and shape of the sending and receiving coils of the inductive charging system. Reference [
13] does propose a method of placing the sending coils (the ERS) based on a stochastical method in order to increase the probability of a vehicle to be able to utilise the ERS. In [
14], a method of placing the (inductive) ERS sections is proposed in order to optimize battery life. Considerations to energy consumption of the vehicle and dynamic behaviour of the drive cycle are however largely left out.
Publications related to
conductive dynamic energy transfer include [
15] where a summary of systems under development is listed. Refs. [
16,
17] present a validated system for transferring high electrical power at high vehicle speed. None of these elaborate on the impact of ERS localisation nor the on-board ETS on the energy consumption and battery ageing.
One of the on-board energy transfer systems included in this study features
integrated charging capability. Publications regarding
static integrated charging have been published extensively, and Ref. [
18] presents a comprehensive rundown of integrated chargers published in recent literature. It is obvious that the vast majority of integrated chargers published are either low power of non-isolated, as in this case a high power, isolated system suited for dynamic charging is required. Some publications propose solutions to high power, isolated (static) charging [
18,
19,
20,
21], albeit with the potential drawback of requiring a six-phase machine and/or converter or equipment to be able to rearrange the motor windings.
A few of the charger topologies presented in [
18] could most likely be adapted for dynamic charging, although it is not the original intention of those solutions. Those somewhat suited dynamic integrated charging are those featuring two separate electric machines or one machine with two separate sets of three-phase windings. By feeding each pair of three-phase windings with a separate converter, each DC-link can be galvanically separated whilst capable of transferring energy as long as the machines (if two separate) are mechanically connected. Connecting one DC-link to the battery and one to the supply, the ERS enables transfer of electrical power in the range of the rated traction power of the vehicle. Adaption of the topologies in [
18] for dynamic energy transfer is not elaborated on. This is due to the fact that the scientific and engineering field of road-bound conductive energy transfer is very young.
This paper presents high power energy transfer solutions with galvanic isolation for conductive electric roads combined with two different methods of ERS localisation.
3. Energy Transfer System for Conductive Electric Roads
Three different ETSs are evaluated in this study. All of them feature the capability to transfer energy from an ERS with galvanic isolation between the ERS and the traction voltage system (TVS). In order to further minimise differences between the ETSs which may affect the final result, all of them feature two traction drives (converter and machine), though it is only required by the ETS featuring integrated charging, as is shown below.
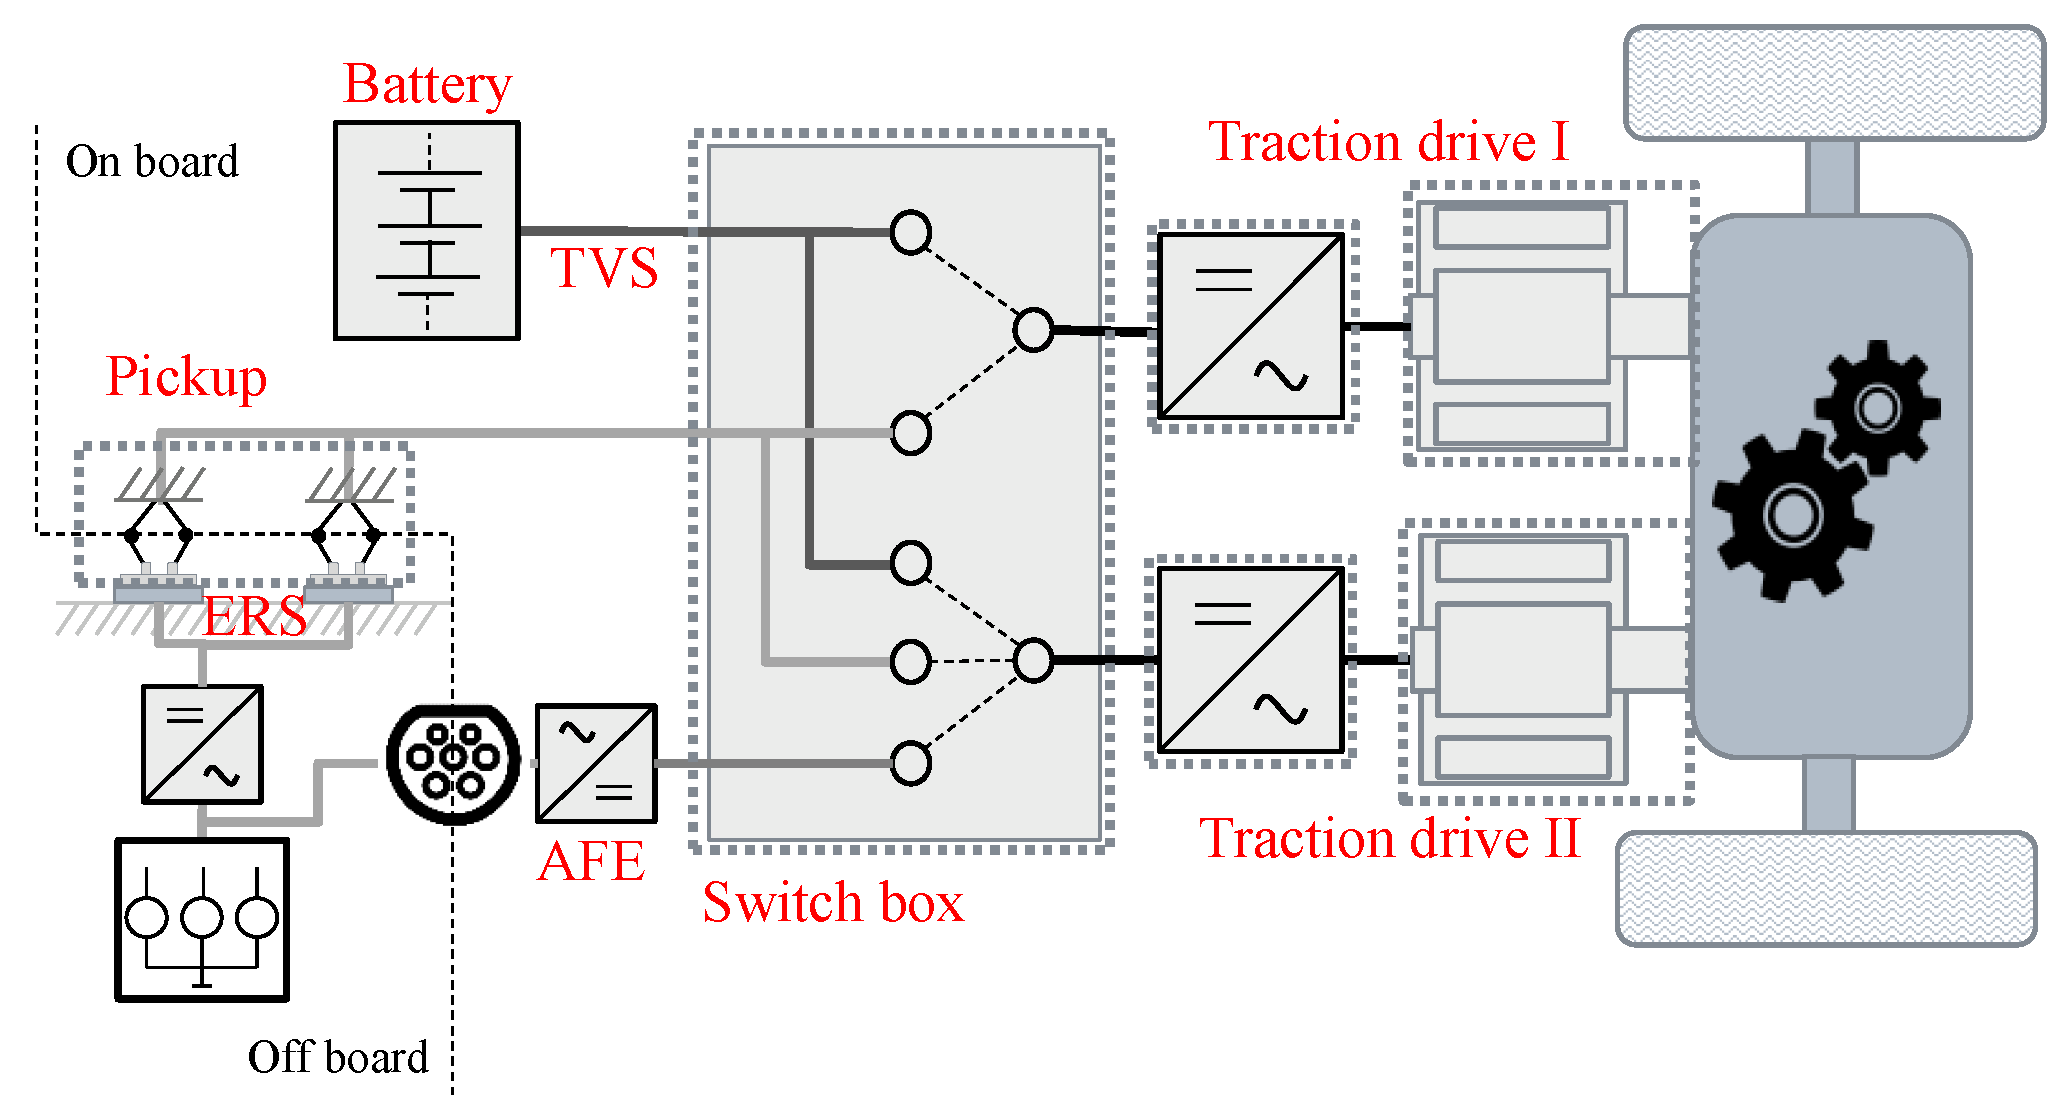
3.1. Fully Integrated ETS (FIETS)
The ETS featuring integrated charging is shown in
Figure 1, where a switch box is added in between the traction drives and the ERS supply and battery. The switch box enables each of the traction drives to independently connect to either of the supplies. The two traction machines are used as an isolation interface between the ERS supply and TVS, creating the galvanic isolation for connection to a conductive ERS. However, since each of the traction converters independently can connect directly to the ERS, double isolation is required of all of the TVS components except those directly connected to the same DC link as the traction battery. When charging, one of the machines is connected to the ERS whilst operating in motoring mode, whereas the other-connected to the battery-operates in generating mode, providing power to the battery from the transmission. When the vehicle is in motion, charging is possible as long as the required traction torque is less than what one machine alone can supply. In this case, a higher power reference is sent to the ERS connected traction drive whilst a negative power is fed to the battery connected traction drive; in essence subtracting the surplus power so that only the required power for traction reaches the gearbox and wheels. Should the required traction power exceed what one machine alone can provide, both machines will operate in motor mode, disabling the charging possibility. Disregarding the potential need of traction power, the available charging power is limited by the rated power of each of the electric machines with inverters.
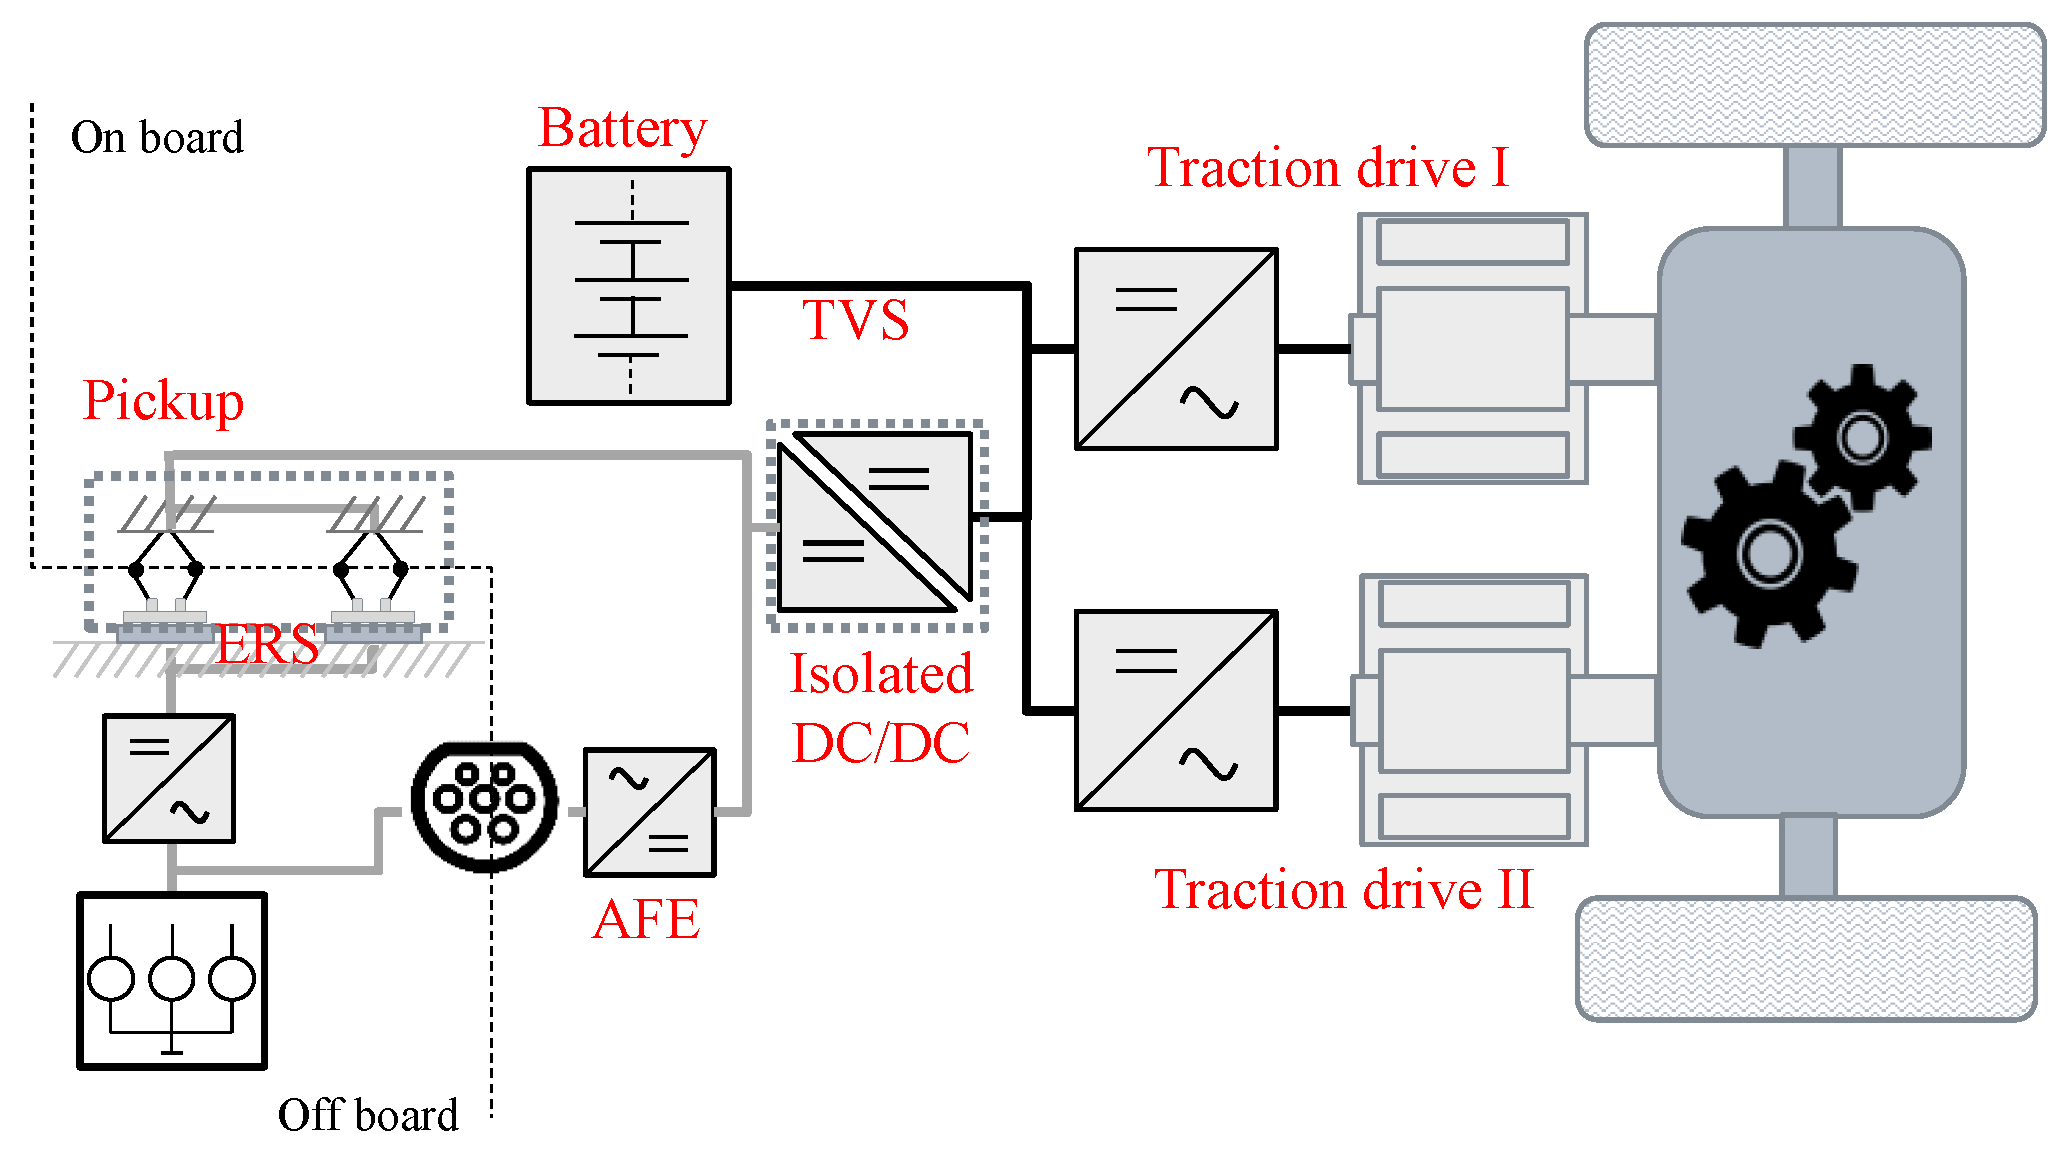
3.2. High Power Separate ETS (HSETS)
An arguably more conventional way of receiving power from the ERS is via a doubly and galvanically isolated DC-DC converter, see
Figure 2. The double and galvanic isolation within the DC-DC converter removes the need of double isolation of the rest of the TVS. In this case, all the power provided by the ERS must be fed through the DC-DC converter, requiring the rated power of this to be substantial, on par with the average traction power divided by the ERS-factor,
, see
Section 4.5.
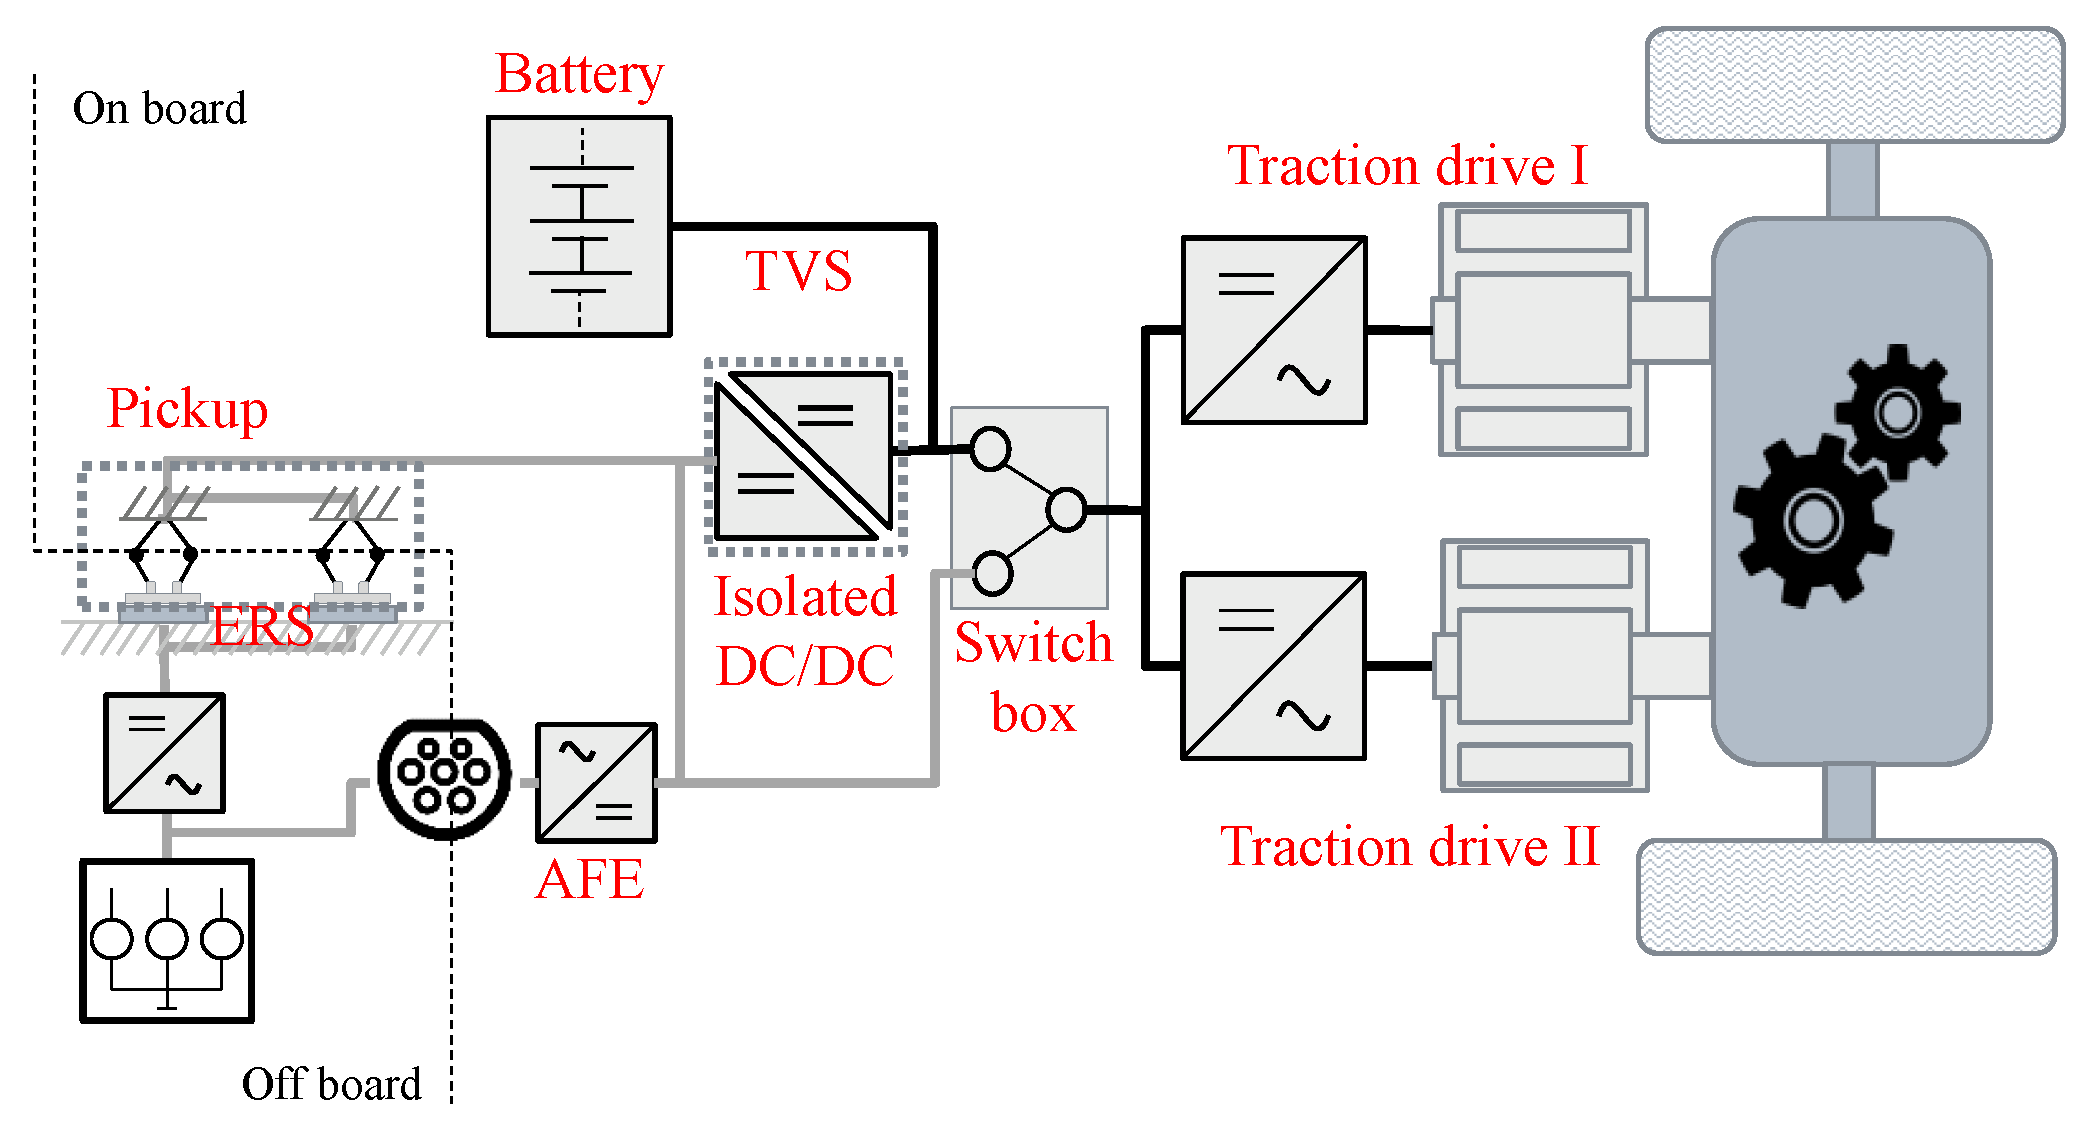
3.3. Low Power Separate ETS (LSETS)
The powertrain shown in
Figure 3 features both a (low power) doubly and galvanically isolated DC-DC converter as well as a switch box of less complexity compared to the one shown in
Figure 1. Charging of the battery is achieved by the DC-DC converter at all times. However, when an ERS is present and the vehicle speed is above a certain level, the traction machines are directly fed from the ERS. The safety requirements are fulfilled since, when the vehicle is travelling at low speed, then the machines are connected to the battery (and DC-DC converter) even though an ERS might be present. The motivation is that, at low speed, a person might get in physical contact with the vehicle and galvanic isolation with respect to ground is required. At high speed, however, the risk of person coming in physical contact with the vehicle is deemed so unlikely that the vehicle can operate directly from the ERS without galvanic isolation nor double isolation of components.
4. Method
The modelling of the vehicles and sub systems are elaborated on in detail in [
9], a shorter version follows here where the results of the modelling are presented. A City Bus is run through the City Bus Cycle called CBR85, recorded from the quite demanding Bus line 85 (no longer in use) in Gothenburg. The drive cycle (A to B and return to A) is repeated three times in order to emulate one shift’s worth of work. The characteristics correspond well to the drive cycles compiled in [
22], validating the legitimacy of the drive cycle utilised in this study. The parameter ‘aggressiveness’ is defined as in [
22]. The long haul truck is run through a long haul drive cycle which features high average speed, long distance and a great deal of up hills and down hills, creating a challenging situation with regard to traction power and energy consumption. The drive cycle is run from A to B and back to A, emulating a scenario of two shifts worth of work. Data of the drive cycles are shown in
Table 1.
Details of the components related to energy transfer from the ERS to the wheels and/or energy storage follow below, i.e., electrical machines and their converters, DC-DC converter and battery. It is important to note that the absolute accuracy of the modelled components is of lesser importance in this study since it is the relative comparison of energy consumption and battery ageing between ETS topology and ERS placement that is of main interest.
4.1. Traction Converter and Machine and Mechanical Transmission
The efficiency map of the traction drive, i.e., electrical machine and its converter, is shown in
Figure 4. The efficiency map is based on experimental measurements of a laboratory setup of the FIETS [
23], whilst the process of post processing the measurement result into the final efficiency map is presented in [
9]. In the subsequent modelling, when an electrical machine and converter of a different level of rated power is required, as opposed to the rated power of the experimentally verified, the torque axis is altered to match the required rated power. The speed axis is left unaltered as well as the actual efficiency map.
4.2. DC/DC Converter Model and Battery Model
The DC/DC converter, regardless of rated power, is modelled as a power dependent efficiency as shown in
Figure 5. The efficiency characteristics of this model is based on literature [
24,
25,
26].
The efficiency of a 200 kWh battery is shown in
Figure 6. As different levels of battery capacity are evaluated in this study, a specific efficiency map at each desired capacity level is created. The internal resistance is dependent on the state of charge (SOC) but not dependent on the temperature of the battery as presented in [
27,
28]. In common, with regard to efficiency, at different levels of capacity is that the highest amount of losses is generated at high levels of SOC combined with high charging power. Due to this fact, the charging power is limited above 65% SOC where the C-rate is tapered off, from a maximum of C = 2 (below 65%) to C = 0.2 at 100% SOC.
The limited accuracy of the battery and DC-DC converter models is considered acceptable since the study is a comparison of different ETS solutions and that the slight inaccuracy of the models does not affect the comparative result.
Each drive cycle simulation creates a number of time series of data, where the SOC is one of them. This is used in order to evaluate to what extent the battery is aged by the drive cycle. A rainflow algorithm [
29] is used to count the number of cycles of a specific depth of discharge (DoD).
Figure 7 shows the number of cycles as a function of DoD a Li-Ion battery can be cycled through before it reaches 80% of its initial capacity [
30]. The rainflow algorithm outputs the number of cycles at specific DoDs. Using these data together with
Figure 7, an estimate on how much of the battery’s life is consumed can be established.
4.3. Vehicle Dynamics
The vehicle, regardless of bus or long haul truck, is modelled as a point mass, moving along one dimension subjected to rolling and air resistance forces as well as a force related to the slope of the road, see [
9] for details. The vehicle data are shown in
Table 2.
The city bus is assumed to be a heavily loaded, articulated bus which in Sweden is associated with a maximum weight of 28 tonnes [
31]. The physical dimensions of the long haul truck are based on the kind of long haul truck that covers the highest amount of mileage in Sweden [
32].
4.4. Control
The control of the power flow on-board the vehicle is different in the three different ETSs. In the two cases where the ETS comprises a DC-DC converter—the HSETS and LSETS—the control of charging power is straightforward as the traction machines are not active parts of the charging procedure. However, regeneration of braking power differs between the HSETS and LSETS. Regeneration of as much power as the traction machines can handle is at all times possible in the HSETS,
Figure 2, since the traction drives at all times are electrically connected to the battery. In the other case, the LSETS,
Figure 3, the traction drives connect to the ERS whenever the ERS is present. Given that the ERS is assumed to not be capable of receiving power, regeneration of braking power is lost whenever the ERS is present. In part, the same might occur in the FIETS,
Figure 1, since one, or both machines, might be connected to the ERS depending on charging demand. The control method that accepts this shortcoming is hereinafter referred to as the Minimum Switching at the ERS control method (MnSW).
The limitations with the MnSW can be mitigated by allowing the switch box, in the FIETS and LSETS, to rearrange its switches so that when the vehicle is braking, the traction drives connect to the battery. When braking is complete, the switch box rearranges some again so that the traction drives are connected to the ERS. This might lead to excessive wear if the switch box consists of mechanical switches, as in [
23], since the number of switching events increase significantly, but increases the amount of regenerated energy. This control method is hereinafter referred to as Maximum Regen at ERS (MxRE). When applicable, the results presented in a following section utilise both control methods.
4.5. Electric Road Modelling
Two different approaches with regard to ERS placement are investigated; (1) equal lengths of the ERS sections separated by a fixed distance or (2) the ERS sections are placed where the required traction power is above a certain level. A detailed explanation of both strategies follows below.
4.5.1. Equal Section Length, Equal Spacing, EQU
In this approach, the ERS sections, with length
, are equally long and placed equidistantly apart. The distance separating the start of the sections is denoted as
, whilst the length of each of the sections is denoted by
; see also
Figure 8. The relative coverage of ERS,
, is defined by
Hereinafter, this method of placing the ERS section is referred to as the Equidistant (EQU) method.
4.5.2. Power Dependant ERS Placing, ADA
Instead of blindly placing the ERS sections according to (1) above, the sections can instead be placed where the traction power is needed the most. This can minimize the amount of energy that needs to be intermediately stored in the traction batteries. In order to do this, the drive cycle has to be known beforehand so that the traction power demand can be evaluated along the driven distance. In this study, the placement of the ERS is deduced by simulating each vehicle over its drive cycle, where a time series of the traction power demand is extracted. By analysing said time series and determining where the traction power exceeds a certain level, the ERS is placed. The procedure is illustrated by
Figure 9 where a short section of a city bus drive cycle is shown.
Figure 9a shows the required traction power and two different levels of constant power thresholds. The two lower
Figure 9b,c shows how each of the dashed lines in
Figure 9a generates a specific layout of the ERS. In reality, 11 different power level thresholds are investigated for each vehicle in this study, i.e., a total of 11 levels of total corresponding
is investigated. As shown in the figures, the ERS sections can become unreasonably short from a practical standpoint as the required traction power might fluctuate significantly over a short distance. In order to mitigate this, a minimum allowed ERS section length is set to a specific length, 0.3 km in the city bus case and 1 km in the long haul case.
Hereinafter, this method of placing the ERS sections is referred to as the Adapted (ADA) method.
5. Results and Discussion
Two vehicles with ETSs configured according to
Table 3 are simulated with an adequate drive cycle with the properties of
Table 1. The rated traction machine power, the battery capacity, the rated DC/DC converter power (for HSETS and LSETS) and the ERS specifications are varied and the energy consumption and an estimate of the battery lifetime wear are calculated.
The parameters of the simulation that are swept in order to evaluate the outcome are shown in
Table 3. The ‘
, ADA’ only shows the lowest/highest level of
since the difference between two subsequent levels is not constant. The number of levels of the power dependent
are eleven in total in both localisation methods. The parameter range is shown as lowest:increment:highest.
The different approaches to ERS placing are evaluated from two perspectives: (I) the energy consumption and (II) how large a fraction of the drive cycle that needs to be covered by ERS in order to make it possible for the vehicle to complete the drive cycle. The EQU placing method is evaluated over a wider span of and than the ADA placing method. However, the results are only presented where the two sets overlap, i.e., the energy consumption is only illustrated for parameter setting that make the vehicle complete the drive cycle.
The difference in battery ageing by the different ERS localisation methods is presented by a surface,
S, defined by
meaning that a ratio above 1, the battery is aged to a higher extent on the ADA placing method and vice versa. Furthermore, each plot contains two surfaces, where the filled, gray, surface corresponds to the ratio between the two placing methods when the
parameter is long whilst the non-filled surface corresponds to when
short, the actual values of
differ between the drive cycles.
5.1. City Bus
It is found that the energy consumption is not to a great extent affected by neither nor the traction drive rated power which is why these two parameters are fixed at 1 km and 180 kW, respectively. Furthermore, in the results presented, the rated power of the DC-DC converter in the HSETS and LSETS is fixed at 160 kW and 60 kW each, respectively, since it is found that these power levels roughly correspond with the FIETS at 180 kW from a charging performance point of view.
The energy consumption of the bus operating the city bus route with the different ETSs is shown in
Figure 10. It can be seen that only a slight difference in energy consumption, between the ERS placing methods EQU and ADA, can be observed with the HSETS,
Figure 10e, which is due to the fact that traction and charging of the vehicle are highly de-coupled in the sense that the high power DC-DC converter supplies the vehicle with energy regardless of driving condition whilst the traction drives only propel the vehicle. The difference is also small in the FIETS and LSETS cases,
Figure 10b,d, when utilising the MxRE control method. This shows that the impact on energy consumption imposed by the ERS placing can be mitigated by a sophisticated control strategy. However, note that, although the energy consumption is lower when utilising the MxRE control method, the vehicle does not complete (indicated by no data in the figures) the drive cycle to the same extent as when utilising the MnSW control method. This is due to the fact that, while a larger amount of energy is regenerated from braking, the vehicle with the MxRE control method, lowering the total consumption, some charging opportunities are lost, i.e., the vehicle actively ‘choose’ to regenerate instead of transferring energy from the ERS. A difference in energy consumption with regard to ERS placing is only really prominent in the FIETS and LSETS case when utilising the MnSW control method,
Figure 10a,c. This shows that charging (from the ERS) while the tractive power requirement is negative is affecting the energy consumption badly, but increases the vehicles ability to finish the drive cycle.
Common in all figures is that the energy consumption is increasing with decreasing battery capacity. This is partly due to the fact that a vehicle with a lower battery capacity requires more energy from the ERS than a higher battery capacity one, i.e., higher charging losses (the energy consumption includes the losses to bring the SOC back to its start value during AC depot charging), and also that a smaller capacity battery has higher internal loss than a larger capacity battery. The increase of energy consumption with respect to battery capacity is largest with the FIETS, which is to be expected since the path from ERS to battery in this charging solution involves several conversions, from DC to AC, from AC to mechanical and vice versa via the two traction machines and the transmission. It is also shown that the
parameter is of lower influence on the energy consumption than the battery capacity, especially in the HSETS case and when utilising the MxRE control method. The reason for the consumption decreasing with increasing
in
Figure 10a is that the higher level of ERS available, the more the vehicle will run both its machine directly from the ERS, reducing conversion losses. The contrary behaviour is seen in
Figure 10c, which is explained by that the more ERS available, the less energy is recovered during braking. Even though the
comparison between ERS layout and vehicle ETS is of the main focus in this study, it is also seen that the lowest energy consumption, in absolute numbers, is achieved by the HSETS, whilst the other two ETSs, FIETS and LSETS, produce an arguably similar result.
The ratio of battery ageing for the two ERS placing methods, as defined by Equation (
2), is illustrated in
Figure 11 for two different ERS section distances. It is clearly shown that the difference in battery degradation between the two placing methods is greater when the equal spacing method, EQU, features a long
distance (light gray surfaces), in this case 10 km, and especially so, when the battery capacity is low. This behaviour is not unexpected since a long
distance, 10 km in this case, cycles the battery more deeply than when
is short, in this case 1 km. As the ADA placing method does not feature a constant
distance, the average distance between sections are closer to 1 km rather than 10 km. When
is short, the difference between the two placing methods are not that prominent (ratio around 1), the ADA placing method is shown to be slightly worse than the EQU placing method for some combinations of
and
suggesting that the distance between ERS sections is of great importance when estimating battery ageing. In addition, comparing
Figure 11a,b as well as
Figure 11c,d, shows that the control method does not to a great extent alter the ageing of the battery, especially when
is long (light gray surface).
5.2. Long Haul Truck
In the figures presenting the result from the long haul truck simulations in this section, the parameters
and rated power of the individual traction drives are fixed at 10 km and 180 kW, respectively. The rated power of the DC-DC converter in the HSETS and LSETS is set to 200 kW and 80 kW, respectively, in order to match the charging performance of the FIETS. Furthermore, due to the monotonous characteristic of the drive cycle, the difference in outcome between the two control methods presented in
Section 4.4, is not sufficient enough to draw any conclusions, which is why only the result when utilising the MnSW control method is shown.
The energy consumption of the long haul truck simulated, with three different ETSs, on the long haul drive cycle is shown in
Figure 12. The difference in energy consumption of the FIETS and LSETS,
Figure 12a,b, with regard to ERS placing, shows approximately 5% lower energy consumption with the ADA placing method. With the HSETS, the difference is lower, around 1–2%. Apart from the lower energy consumption, it is also shown that the drive cycle is completed to a significantly greater extent when the ERS is placed according to power requirements. This is especially prominent in the LSETS where
is required in order to make the vehicle complete the drive cycle when the ERS is placed according the the EQU method. In the case with ADA placing of the ERS, the vehicle can complete the drive cycle with
meaning with the ADA placing of the ERS sections, the
sensitivity is lower and even
is possible, i.e., a reduction of about 30% compared to the
needed with EQU placing.
The relative battery ageing between the two ERS placing methods is shown in
Figure 13. The comparison is presented by two surfaces for each ETS, where the dark gray surface corresponds to when the
parameter equals 3 km whilst the light gray surface corresponds to when the
parameter equals 30 km. A long
leads to a deeper cycling of the battery, but with fewer cycles, than a short
. Due to the nonlinear lifetime dependency of cycle depth (see
Figure 2), it is expected that the battery is degraded to a greater extent with long
. However, the relative benefit of using ADA vs. EQU is expected to be higher with long
, since ADA can take more advantage of the drive cycle power variations than EQU. Thus, more improvement in relative battery ageing between ADA and EQU can be expected when
is long (light gray surface), which is shown in the figures as a lower surface. This is a common result for all ETSs, and it can be seen that the gain is substantial; a factor around 0.2 to 0.5 is presented. In addition, it is also shown that it is in many cases advantageous to place the ERS according to the traction power requirement even if the alternative is to have a short
distance as shown by the non-filled surfaces.
6. Conclusions
Two different methods of placing a conductive electric road along two specific drive cycles are investigated from an energy consumption and battery ageing point of view. The two drive cycles represent a typical driving scenario for a city bus and a long haul truck, respectively. Furthermore, three different energy transfer systems (ETSs) capable of energy transfer from a conductive electric road are evaluated in each vehicle.
The two different placing methods of the ERS can in short be explained by either (1) placing sections of the ERS of equal length at an equal distance from each other (here called EQU), or (2) placing the ERS sections were traction power is required the most, i.e., on inclines, at typical places of acceleration, etc. (here called ADA). The motive of this study is to investigate if the placing of the ERS can impact total energy consumption and battery ageing with the idea that a sophisticated placing can be advantageous.
Three different ETSs are modelled and simulated in a city bus and long haul truck. One of the ETS features fully integrated energy transfer (called FIETS), meaning charging of the battery is achieved by parts of the ETS mainly used for traction purposes, i.e., the electric machines and converters, and mechanical transmission. The other two ETSs feature an arguably more conventional approach to energy transfer as they both comprise a separate, doubly and galvanic isolated DC-DC converter as interface towards the ERS. One of them features a high power DC-DC converter (called HSETS) which feeds all of the power required by the vehicle. The other ETS features a low power DC-DC converter (called LSETS), which also can connect the traction drives to feed directly from the ERS, leaving the DC-DC converter to feed only battery charging power and potential auxiliary loads.
It is found that the placing of the ERS can, in fact, influence the over all energy consumption. This is especially emphasized in the FIETS and LSETS drivetrains. It can also be concluded that the gain that the ERS placing has on energy consumption can also be achieved by a more sophisticated control strategy with regard to charging and traction, especially if the drive cycle comprises a great deal of start-and-stop traffic.
With regard to battery ageing, it is found that the ADA ERS placing method is the preferred choice, in particular if the intention is to exploit a relatively long distance, i.e., a long distance between the start of the ERS sections. What is regarded as a long is related to the landscape topography as well as to the density of on/off-ramps. The authors have no clear definition but regard 1...30 km as relevant distances between the start of ERS sections. A large distance between ERS section will cycle the battery more deeply than if the distance is short, ageing the battery faster. When comparing the placing methods with a short , the influence is lowered or non existent.
All in all, it can be concluded that the placing of the ERS can increase the performance of the vehicle with regard to energy consumption and battery degradation. However, the practical aspects of placing the ERS sections where the traction power is mostly needed are not a part of this study.


