
Data Mining-Based Collision Scenarios of Vehicles and Two Wheelers for the Safety Assessment of Intelligent Driving Functions

Abstract
:1. Introduction
2. Data Sources and Scenarios Feature Element Extraction
2.1. Sources of Accident Data
- A collision between a vehicle (car, SUV, and MVP) and a TW;
- The type of road is straight, an intersection, or a T-junction;
- The motions of the vehicle and TW were limited to traveling straight ahead, turning, and others (the driver was waiting to turn left, reversing, performing a U-turn, or overtaking);
- Vehicle-to-TW rear-end accidents were ruled out.
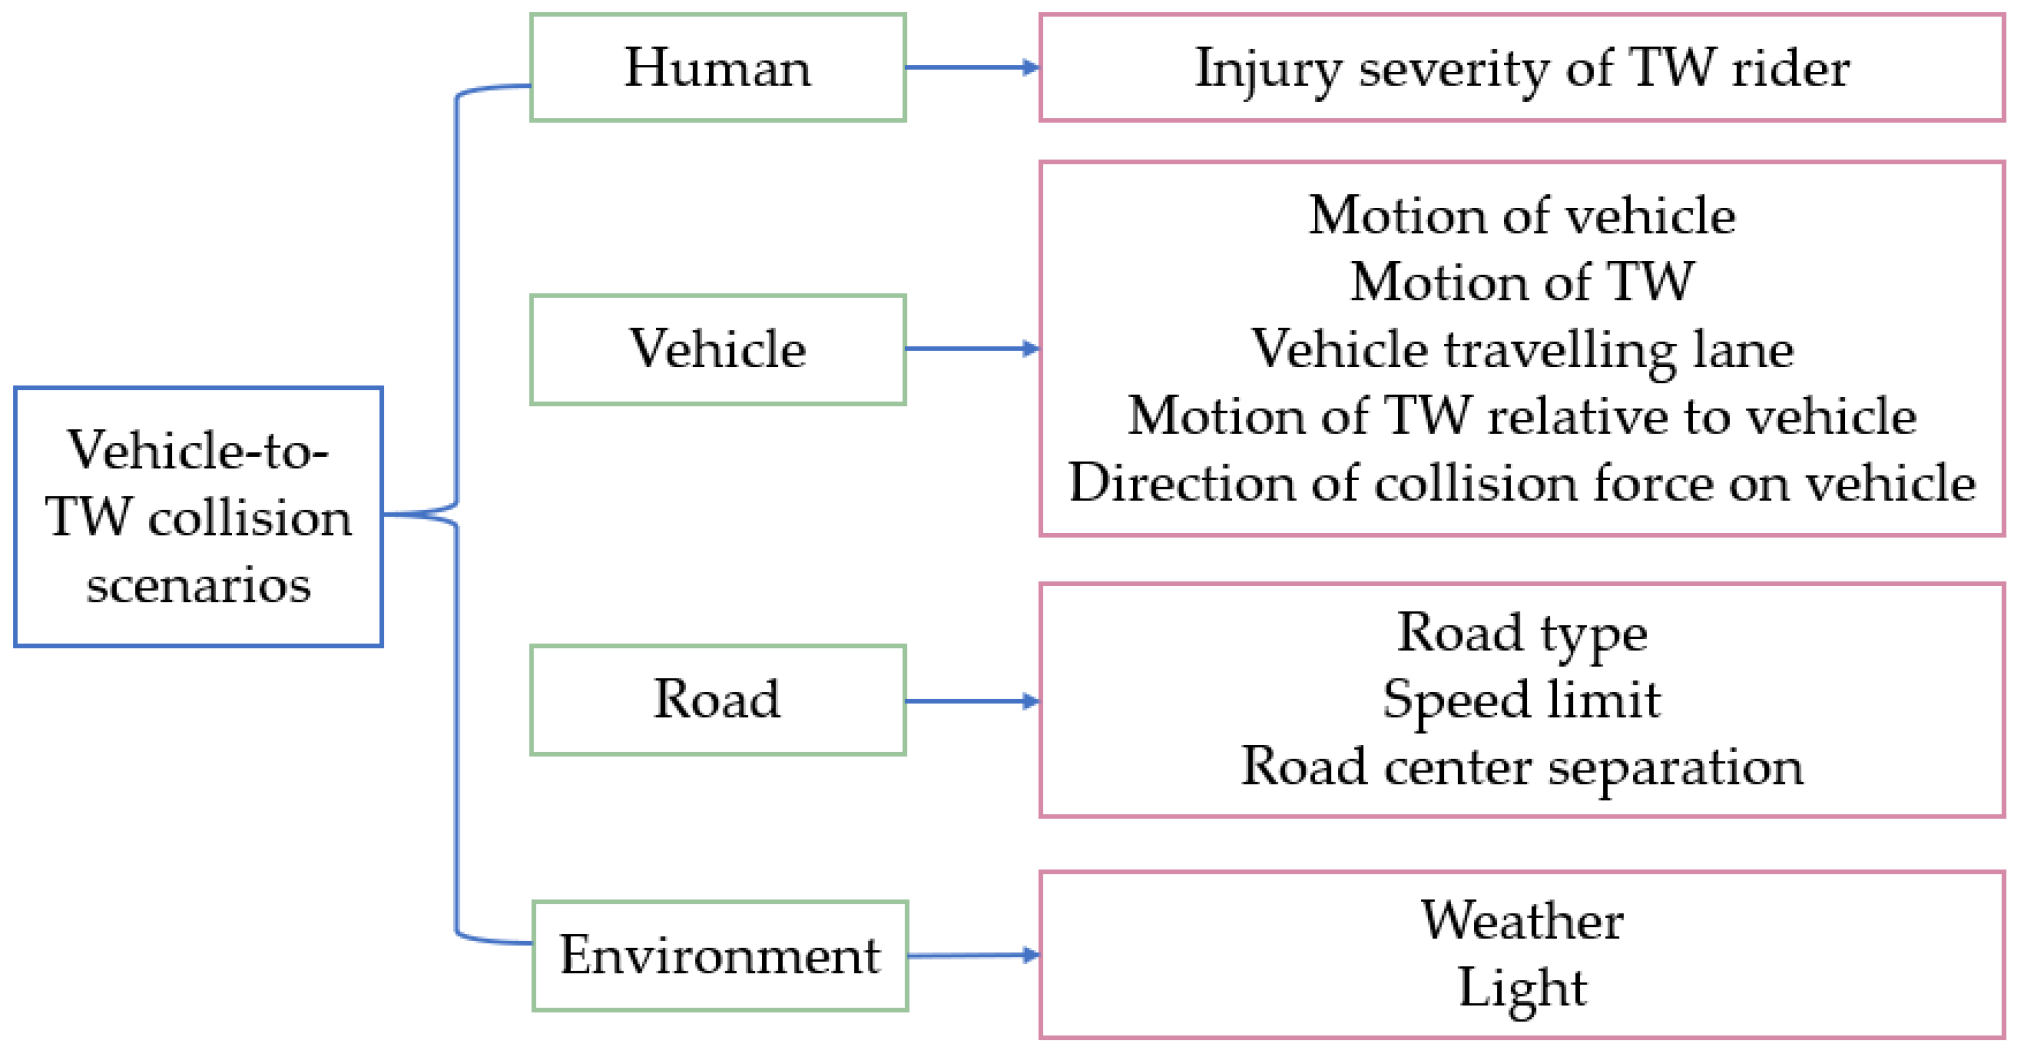
2.2. Accident Variable Extraction and Coding
3. Data Mining Methods
3.1. Hierarchical Clustering
- Each sample is a separate cluster;
- The distance between different samples is calculated, and the two samples with the closest distance are combined into one cluster;
- Calculate the distance between the different clusters, combining two closest clusters into one new cluster;
- Keep repeating step 3 until all the samples are clustered into one cluster.
3.2. Association Rules Mining
4. Base Scenarios and Rules Mining
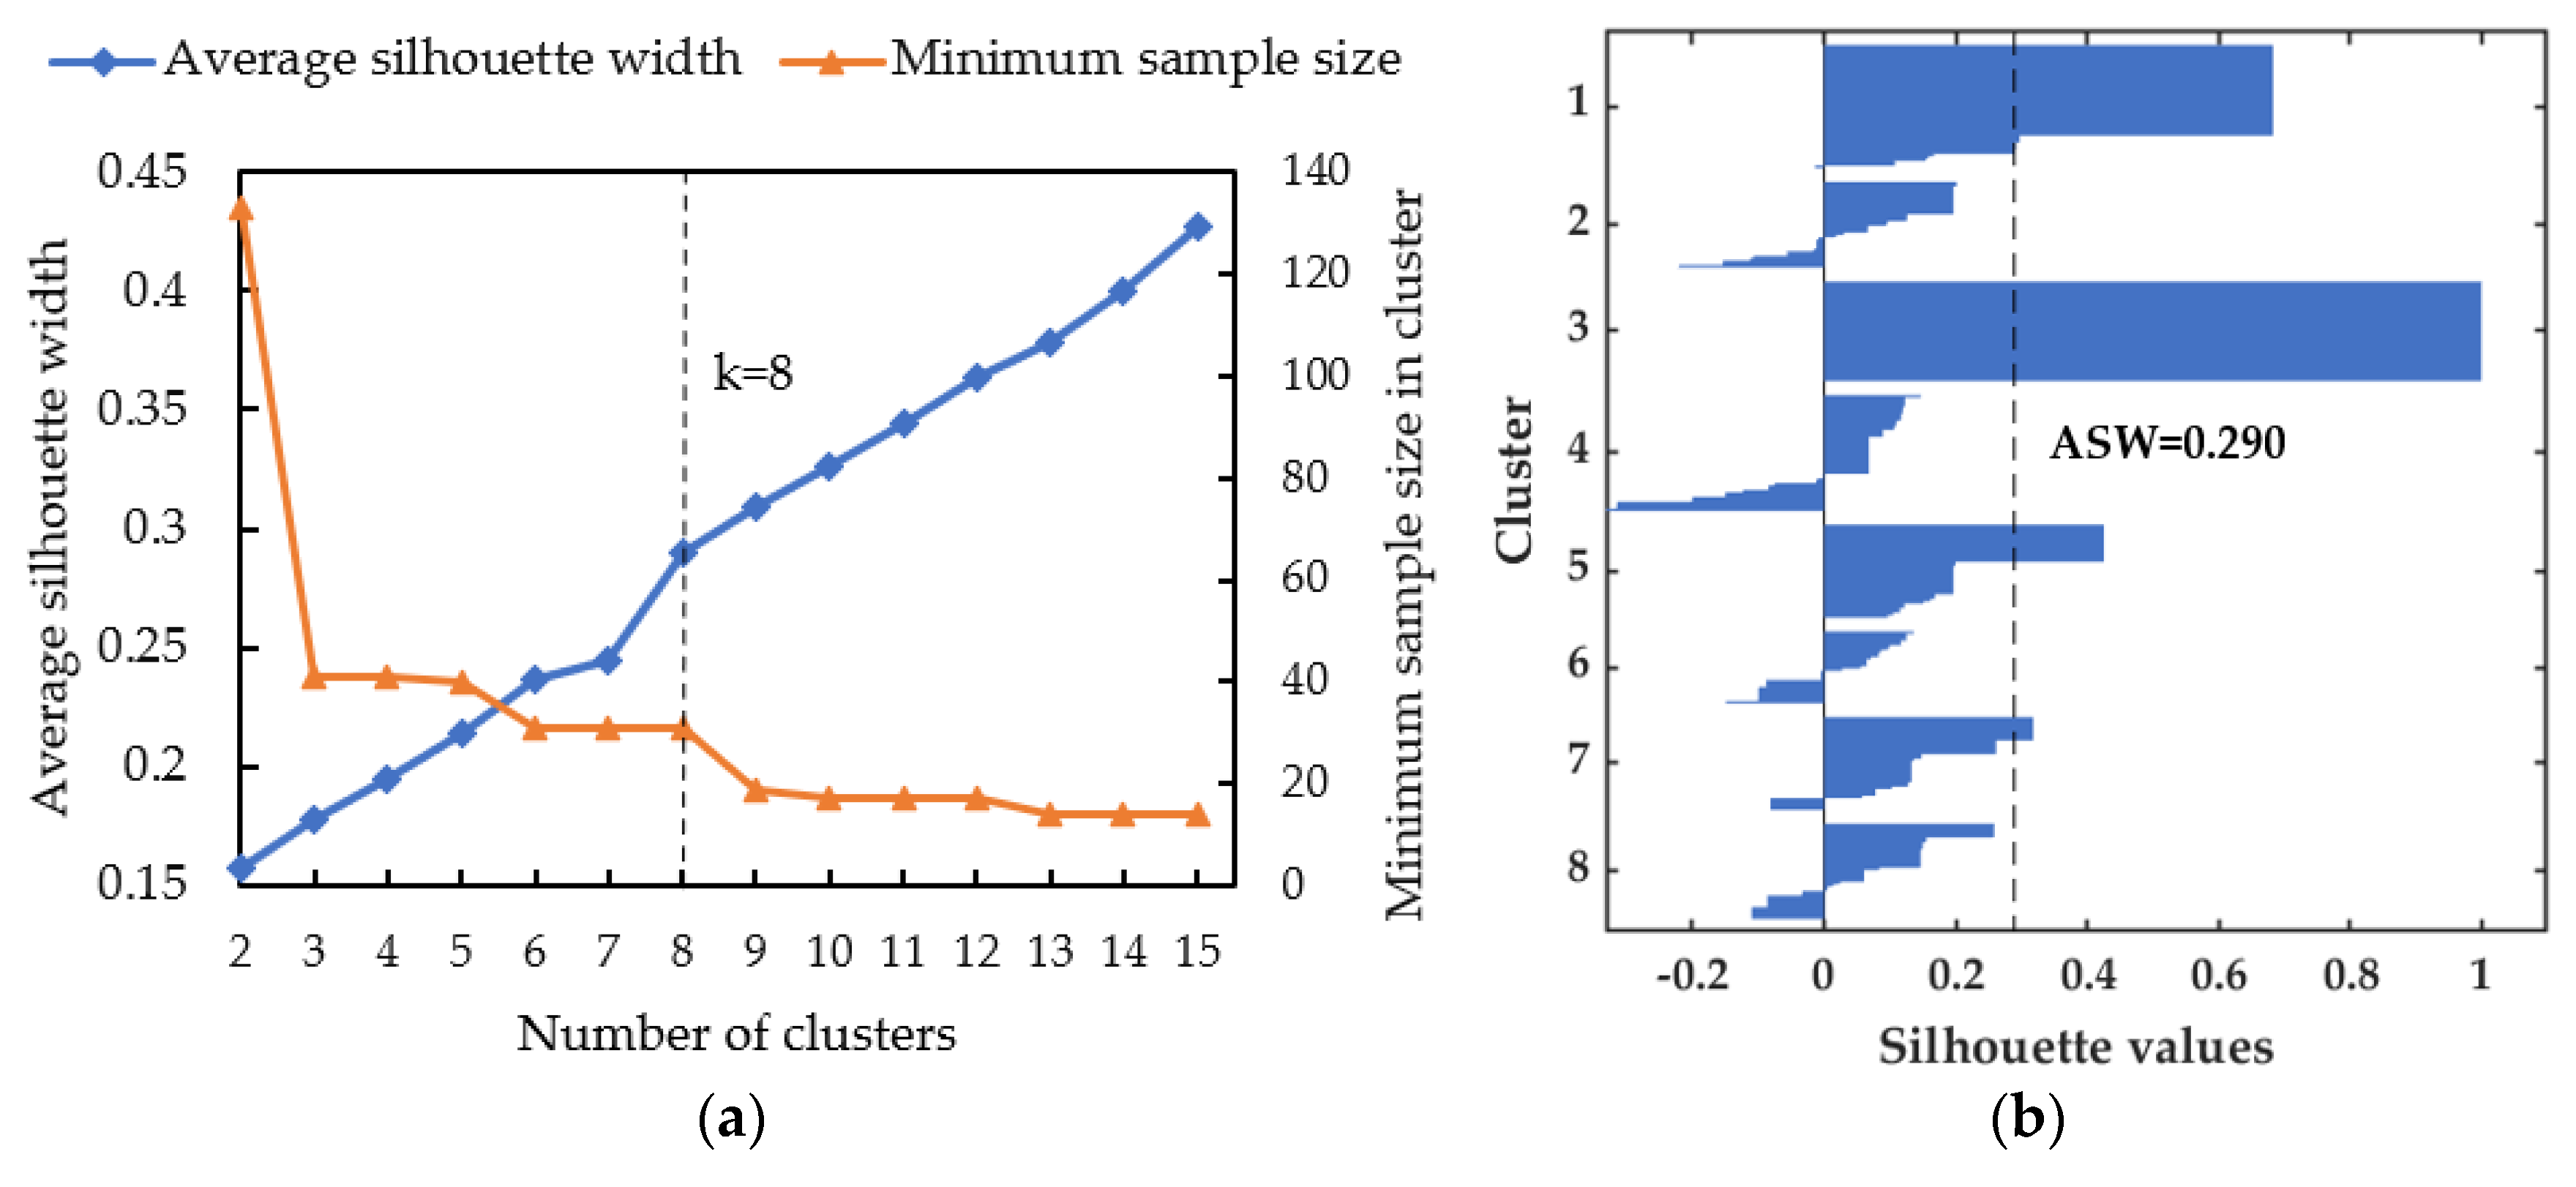
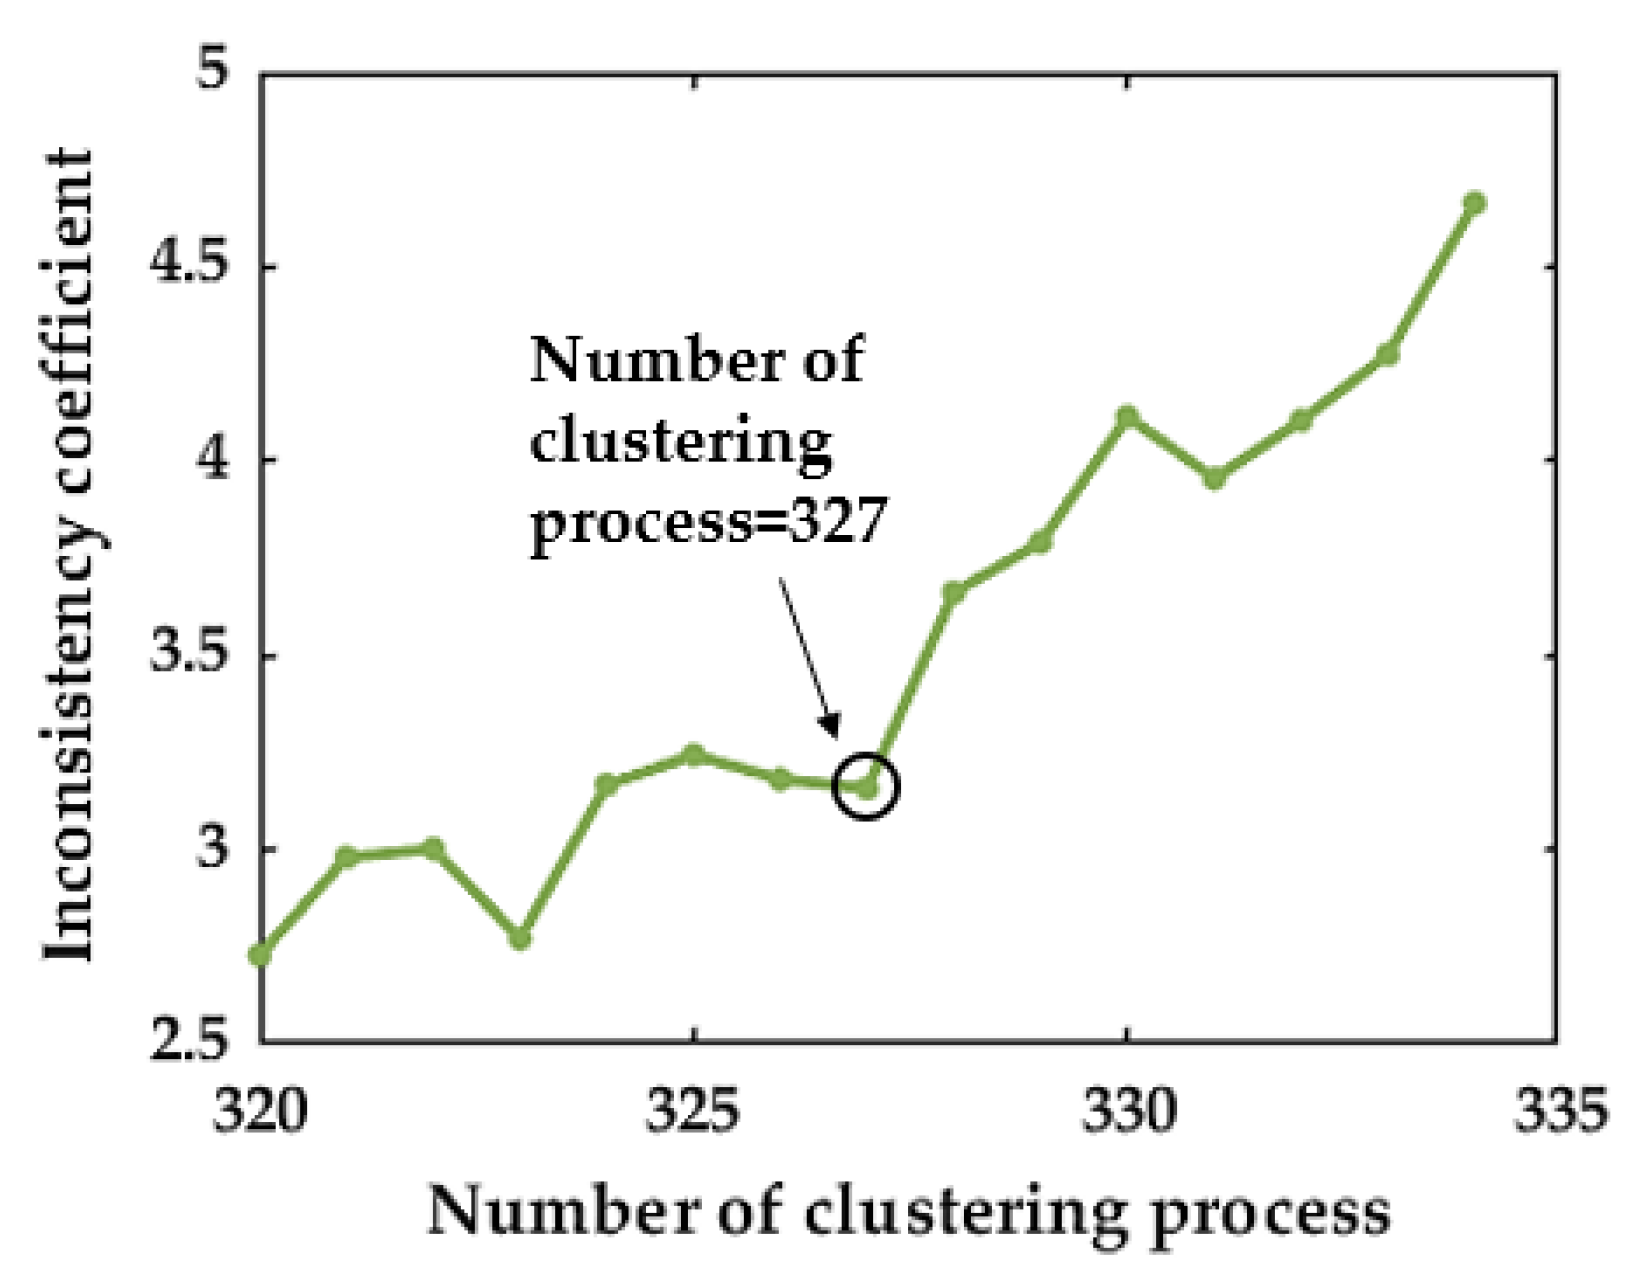
4.1. Accident Data Clustering
4.2. Collision Scenarios Derived from Association Rules
5. Conclusions
Author Contributions
Funding
Data Availability Statement
Conflicts of Interest
References
- World Health Organization. Global Status Report on Road Safety: Summary; World Health Organization: Geneva, Switzerland, 2018. [Google Scholar]
- National Bureau of Statistics. Annual Traffic Accident Data [2022-09]. Available online: http://www.stats.gov.cn/sj/ndsj/2022/indexch.htm (accessed on 10 February 2022).
- Han, I. Scenario establishment and characteristic analysis of intersection collision accidents for advanced driver assistance systems. Traffic Inj. Prev. 2020, 21, 354–358. [Google Scholar] [CrossRef] [PubMed]
- Bing, Z.; PeiXing, Z.; Hong, C.; Xu, Z. Research progress on scene-based virtual test of autonomous driving vehicles. China J. Highw. Transp. 2019, 32, 1–19. [Google Scholar]
- Wang, R.; Zhu, Y.; Zhao, X. Research progress on test scenario of autonomous driving. J. Traffic Transp. Eng. 2021, 21, 21–37. [Google Scholar]
- Tan, Z.; Che, Y.; Xiao, L.; Hu, W.; Li, P.; Xu, J. Research of fatal car-to-pedestrian precrash scenarios for the testing of the active safety system in China. Accid. Anal. Prev. 2021, 150, 105857. [Google Scholar] [CrossRef] [PubMed]
- Li, L.; Zhu, X.; Liu, Y.; Ma, Z. Typical traffic danger scenes involving cyclists. J. Tongji Univ. Nat. Sci. Ed. 2014, 42, 1082–1087. [Google Scholar]
- Hu, L.; Yi, P.; Huang, J.; Zhang, X.; Lei, B. Research on automatic emergency braking system two-wheeled vehicle test scenario based on real accident cases. Automot. Engine 2018, 40, 1435–1446+1453. [Google Scholar]
- Zhou, H.; Zhang, Q.; Mu, Y.; Tan, Z.; Sun, Q.; Zhang, D. Clustering and deduction of typical dangerous scenarios between passenger vehicles and two-wheelers at crossroads. China Saf. Sci. J. 2020, 30, 100–107. [Google Scholar]
- Xu, X.; Zhou, Z.; Hu, W.; Xiao, L.; Li, W.; Wang, S. Intersection test scenarios for AEB based on accident data mining. J. Beijing Univ. Aeronaut. Astronaut. 2020, 46, 1817–1825. [Google Scholar]
- Sui, B.; Lubbe, N.; Bargman, J. A clustering approach to developing car-to-two-wheeler test scenarios for the assessment of Automated Emergency Braking in China using in-depth Chinese crash data. Accid. Anal. Prev. 2019, 132, 105242. [Google Scholar] [CrossRef]
- Cao, Y.; Xiao, L.; Dong, H.; Wang, Y.; Wu, X.; Li, P.; Qiu, Y. Typical pre-crash scenarios reconstruction for two-wheelers and passenger vehicles and its application in parameter optimization of AEB system based on NAIS database. In Proceedings of the International Conference on Enhanced Safety of Vehicles, Eindhoven, The Netherlands, 10–13 June 2019. [Google Scholar]
- Wang, X.; Peng, Y.; Xu, T.; Xu, Q.; Wu, X.; Xiang, G.; Yi, S.; Wang, H. Autonomous driving testing scenario generation based on in-depth vehicle-to-powered two-wheeler crash data in China. Accid. Anal. Prev. 2022, 176, 106812. [Google Scholar] [CrossRef]
- Pan, D.; Han, Y.; Jin, Q.; Wu, H.; Huang, H. Study of typical electric two-wheelers pre-crash scenarios using K-medoids clustering methodology based on video recordings in China. Accid. Anal. Prev. 2021, 160, 106320. [Google Scholar] [CrossRef] [PubMed]
- Ren, L.; Xia, H.; Jiang, C.; Fan, T.; Zhao, T. Construction of autonomous emergency braking system test scenarios based on traffic accident data. Sci. Technol. Eng. 2022, 22, 10737–10747. [Google Scholar]
- Montella, A.; de Oña, R.; Mauriello, F.; Riccardi, M.R.; Silvestro, G. A data mining approach to investigate patterns of powered two-wheeler crashes in Spain. Accid. Anal. Prev. 2020, 134, 105251. [Google Scholar] [CrossRef] [PubMed]
- Meißner, K.; Rieck, J. Strategic planning support for road safety measures based on accident data mining. IATSS Res. 2022, 46, 427–440. [Google Scholar] [CrossRef]
- Xu, C.; Bao, J.; Wang, C.; Liu, P. Association rule analysis of factors contributing to extraordinarily severe traffic crashes in China. J. Saf. Res. 2018, 67, 65–75. [Google Scholar] [CrossRef]
- Das, S.; Tamakloe, R.; Zubaidi, H.; Obaid, I.; Alnedawi, A. Fatal pedestrian crashes at intersections: Trend mining using association rules. Accid. Anal. Prev. 2021, 160, 106306. [Google Scholar] [CrossRef]
- Kumar, S.; Toshniwal, D. A data mining framework to analyze road accident data. Big Data 2015, 2, 26. [Google Scholar] [CrossRef]
- Nitsche, P.; Thomas, P.; Stuetz, R.; Welsh, R. Pre-crash scenarios at road junctions: A clustering method for car crash data. Accid. Anal. Prev. 2017, 107, 137–151. [Google Scholar] [CrossRef]
- Distefano, N.; Leonardi, S. A list of accident scenarios for three legs skewed intersections. IATSS Res. 2017, 42, 97–104. [Google Scholar] [CrossRef]
- Ferreira, S.; Amorim, M.; Couto, A. Risk factors affecting injury severity determined by the MAIS score. Traffic Inj. Prev. 2017, 18, 515–520. [Google Scholar] [CrossRef]
- Kunanbayev, K.; Temirbek, I.; Zollanvari, A. Complex Encoding. In Proceedings of the 2021 International Joint Conference on Neural Networks(IJCNN), Shenzhen, China, 18–22 July 2021; pp. 1–6. [Google Scholar]
- Montella, A.; Aria, M.; D’Ambrosio, A.; Mauriello, F. Analysis of powered two-wheeler crashes in Italy by classification trees and rules discovery. Accid. Anal. Prev. 2012, 49, 58–72. [Google Scholar] [CrossRef] [PubMed]
- Das, S.; Dutta, A.; Avelar, R.; Dixon, K.; Sun, X.; Jalayer, M. Supervised association rules mining on pedestrian crashes in urban areas: Identifying patterns for appropriate countermeasures. Int. J. Urban Sci. 2019, 23, 30–48. [Google Scholar] [CrossRef]
- Chen, L.; Huang, S.; Yang, C.; Chen, Q. Analyzing factors that influence expressway traffic crashes based on association rules: Using the shaoyang-xinhuang section of the shanghai-kunming expressway as an example. J. Transp. Eng. Part A 2020, 146, 05020007. [Google Scholar] [CrossRef]
- Guillaume, S.; Guillet, F.; Philippe, J. Improving the discovery of association rules with intensity of implication. In Principles of Data Mining and Knowledge, Discovery Lecture Notes in Computer Science; Żytkow, J.M., Quafafou, M., Eds.; Springer: Berlin/Heidelberg, Germany, 1998; Volume 1510, pp. 318–327. [Google Scholar]
- Kong, X.; Das, S.; Jha, K.; Zhang, Y. Understanding speeding behavior from naturalistic driving data: Applying classification based association rule mining. Accid. Anal. Prev. 2020, 144, 105620. [Google Scholar] [CrossRef] [PubMed]
- Peter, R.J. Silhouettes: A graphical aid to the interpretation and validation of cluster analysis. J. Comput. Appl. Math. 1987, 20, 53–65. [Google Scholar]
- Euro NCAP. European New Car assessment Programme (Euro NCAP)-Test Protocol AEB/LSS VRU Systems. 2023. Available online: https:/cdn.euroncap.com/media/77299/euro-ncap-aeb-lss-vru-test-protocol-v44.pdf (accessed on 12 August 2023).
- Han, Y.; Li, Q.; He, W.; Wan, F.; Wang, K.B. Mizuno Analysis of vulnerable road user kinematics before/during/after vehicle collisions based on video recordings. Proc. IRCOBI Conf. 2017, 13, 15. [Google Scholar]

| Variable | Attribute | Count | Frequency |
|---|---|---|---|
| Road type | Straight | 138 | 41.2% |
| Intersection | 150 | 44.8% | |
| T-junction | 47 | 14.0% | |
| Weather | Sunny | 176 | 52.5% |
| Cloudy | 84 | 25.1% | |
| Rain/snow | 75 | 22.4% | |
| Light | Day | 237 | 70.7% |
| Night lighted | 71 | 21.2% | |
| Night not lighted | 27 | 8.1% | |
| Motion of vehicle | Straight ahead | 258 | 77.0% |
| Turn left | 30 | 9.0% | |
| Turn right | 32 | 9.6% | |
| Other | 15 | 4.4% | |
| Motion of TW | Straight ahead | 264 | 78.9% |
| Turn left | 53 | 15.9% | |
| Turn right | 14 | 4.2% | |
| Other | 4 | 1.2% |
| Variable (Short Name) | Attribute (Code) | Count | Frequency |
|---|---|---|---|
| Injury severity of TW rider (Injury) | Uninjured (Unj) | 10 | 3.0% |
| Slight (Sli) | 47 | 14.0% | |
| Serious (Sei) | 229 | 68.4% | |
| Fatal (Fal) | 49 | 14.6% | |
| Vehicle traveling lane (Lane) | Single carriageway (Sc) | 86 | 25.7% |
| Inside of dual carriageway (Idc) | 65 | 19.4% | |
| Outside of dual carriageway (Odc) | 120 | 35.8% | |
| Inside of three or more carriageways (Itcs) | 38 | 11.3% | |
| Outside of three or more carriageways (Otcs) | 26 | 7.8% | |
| Motion of TW relative to vehicle (Motr) | Left (L) | 183 | 54.6% |
| Right (R) | 152 | 45.4% | |
| Speed limit (Splim) | 30 mph (30 mph) | 24 | 7.2% |
| 40 mph (40 mph) | 95 | 28.3% | |
| 50 mph (50 mph) | 41 | 12.2% | |
| 60 mph (60 mph) | 156 | 46.6% | |
| Above 60 mph (>60 mph) | 19 | 5.7% | |
| Road center separation (Rcensep) | Unisolated (Unl) | 28 | 8.4% |
| Dotted line (Dl) | 37 | 11.0% | |
| Solid line (Sl) | 162 | 48.4% | |
| Isolation rail (Ir) | 36 | 10.7% | |
| Central green belt (Cgb) | 72 | 21.5% | |
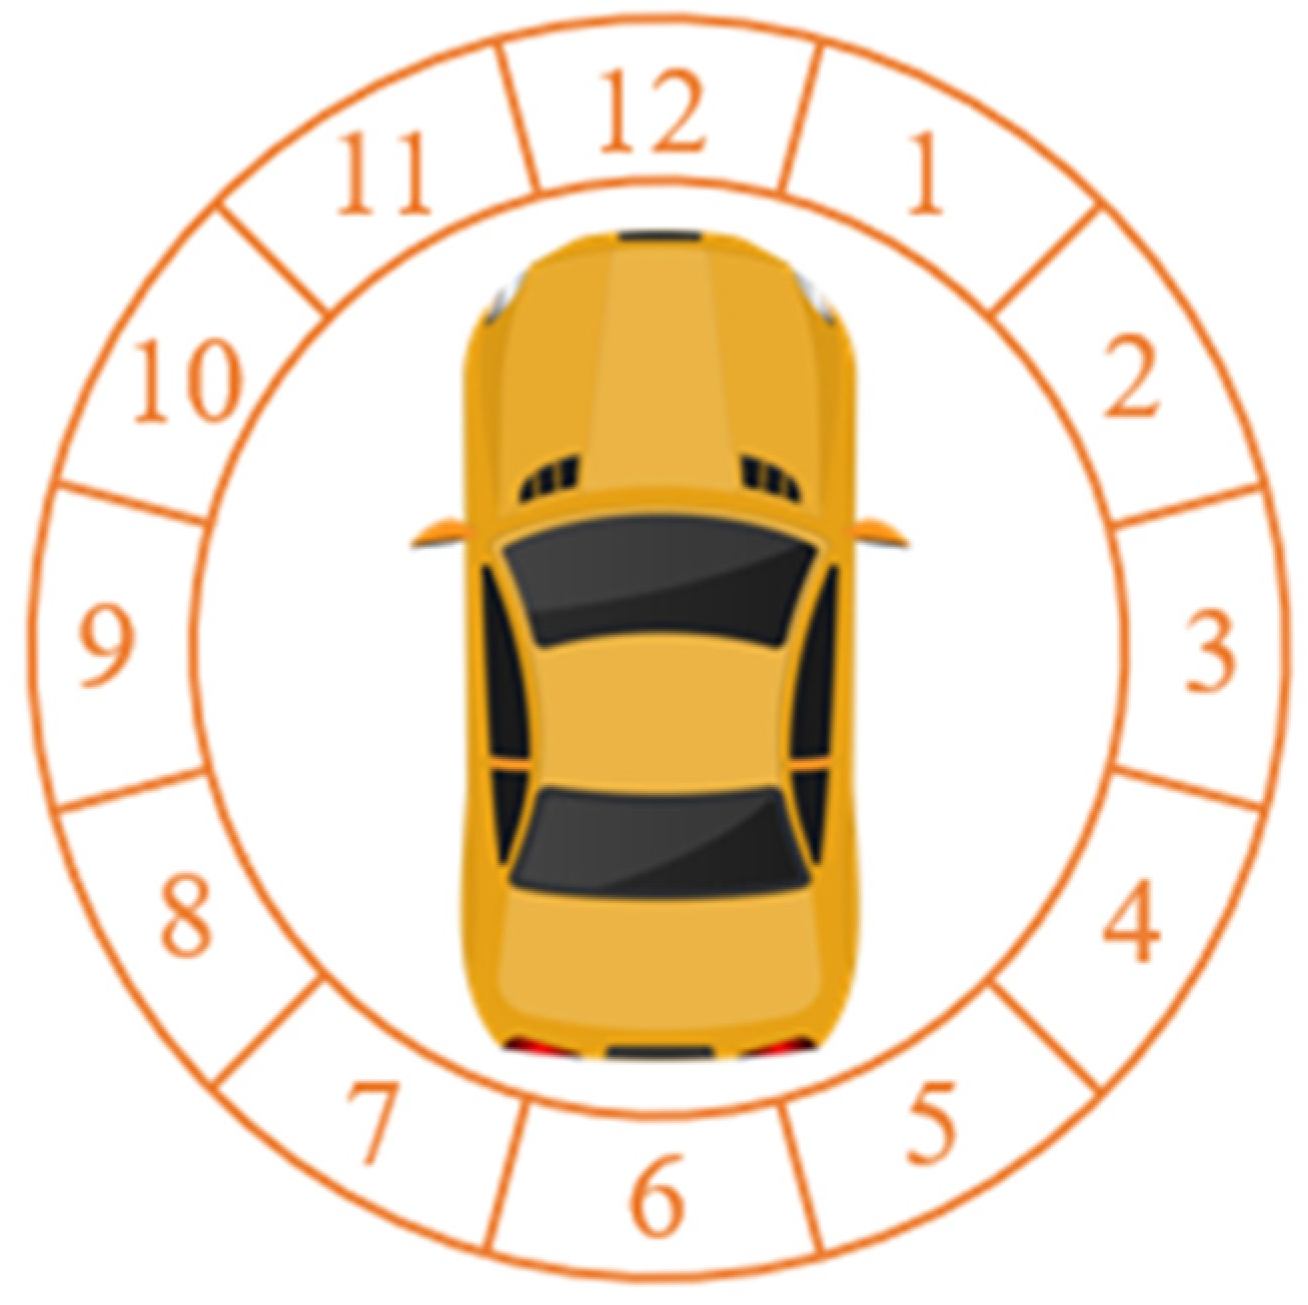
| Direction of collision force on vehicle (Dirt) | 1 o’clock direction (O1) | 70 | 20.9% |
| 2 o’clock direction (O2) | 25 | 7.5% | |
| 3–9 o’clock direction (O3–O9) | 42 | 12.5% | |
| 10 o’clock direction (O10) | 19 | 5.7% | |
| 11 o’clock direction (O11) | 69 | 20.6% | |
| 12 o’clock direction (O12) | 110 | 32.8% |
| Cluster | C1 | C2 | C3 | C4 | C5 | C6 | C7 | C8 | |
|---|---|---|---|---|---|---|---|---|---|
| Count (Frequency) | 53 (15.8%) | 37 (11.0%) | 43 (12.8%) | 50 (14.9%) | 40 (11.9%) | 31 (9.2%) | 40 (11.9%) | 41 (12.2%) | |
| Road type | Straight | 53 | 37 | 0 | 0 | 24 | 1 | 5 | 18 |
| Intersection | 0 | 0 | 43 | 49 | 16 | 0 | 32 | 10 | |
| T-junction | 0 | 0 | 0 | 1 | 0 | 30 | 3 | 13 | |
| Weather | Sunny | 53 | 5 | 43 | 7 | 0 | 14 | 18 | 36 |
| Cloudy | 0 | 24 | 0 | 36 | 0 | 7 | 12 | 5 | |
| Rain/snow | 0 | 8 | 0 | 7 | 40 | 10 | 10 | 0 | |
| Light | Day | 48 | 17 | 43 | 34 | 40 | 21 | 0 | 34 |
| Night lighted | 2 | 11 | 0 | 3 | 0 | 9 | 40 | 6 | |
| Night not lighted | 3 | 9 | 0 | 13 | 0 | 1 | 0 | 1 | |
| Motion of vehicle | Straight ahead | 39 | 30 | 43 | 29 | 32 | 15 | 35 | 35 |
| Turn left | 4 | 2 | 0 | 10 | 3 | 11 | 0 | 0 | |
| Turn right | 5 | 4 | 0 | 9 | 2 | 3 | 3 | 6 | |
| Other | 5 | 1 | 0 | 2 | 3 | 2 | 2 | 0 | |
| Motion of TW | Straight ahead | 52 | 31 | 43 | 38 | 36 | 27 | 37 | 0 |
| Turn left | 1 | 3 | 0 | 11 | 2 | 1 | 0 | 35 | |
| Turn right | 0 | 1 | 0 | 1 | 2 | 3 | 1 | 6 | |
| Other | 0 | 2 | 0 | 0 | 0 | 0 | 2 | 0 | |
| No. | Antecedent | Consequent | Support | Confidence | Lift |
|---|---|---|---|---|---|
| 1 | Motr = L | Injury = Sei | 0.512 | 0.759 | 1.087 |
| 2 | lane = Odc | Injury = Sei | 0.279 | 0.857 | 1.229 |
| 3 | Motr = R | Splim = 60 mph | 0.256 | 0.786 | 1.408 |
| 4 | Lane = Odc and Injury = Sei | Motr = L | 0.209 | 0.750 | 1.112 |
| 5 | Lane = Odc and Motr = L | Injury = Sei | 0.209 | 0.900 | 1.290 |
| 6 | Injury = Sei and Rcensep = Cgb | Motr = L | 0.186 | 0.889 | 1.318 |
| 7 | Rcensep = Cgb and Motr = L | Injury = Sei | 0.186 | 0.800 | 1.147 |
| 8 | Injury = Sei and Motr = R | Splim = 60 mph | 0.163 | 0.875 | 1.568 |
| 9 | Rcensep = Sl and Dirt = O12 | Splim = 60 mph | 0.163 | 0.778 | 1.394 |
| 10 | Injury = Sli | Motr = R | 0.140 | 0.750 | 2.304 |
| 11 | Lane = Sc | Injury = Sei | 0.140 | 0.750 | 1.075 |
| 12 | Splim = 40 mph | Injury = Sei | 0.140 | 0.857 | 1.229 |
| 13 | Splim = 40 mph | Motr = L | 0.140 | 0.857 | 1.271 |
| 14 | Dirt = O1 | Motr = L | 0.140 | 0.857 | 1.271 |
| 15 | Lane = Odc and Rcensep = Sl | Injury = Sei | 0.140 | 0.857 | 1.229 |
| 16 | Injury = Sei and 40 mph | Motr = L | 0.140 | 1.000 | 1.483 |
| 17 | Splim = 40 mph and Motr = L | Injury = Sei | 0.140 | 1.000 | 1.433 |
| 18 | Splim = 40 mph | Injury = Sei and Motr = L | 0.140 | 0.857 | 1.675 |
| 19 | Lane = Odc and Rcensep = Sl | Motr = L | 0.140 | 0.857 | 1.271 |
| 20 | Splim = 50 mph | Injury = Sei | 0.116 | 1.000 | 1.433 |
| 21 | Dirt = O10 | Injury = Sei | 0.116 | 1.000 | 1.433 |
| 22 | Lane = Itcs | Splim = 60 mph | 0.116 | 0.833 | 1.493 |
| 23 | Lane = Otcs | Motr = L | 0.116 | 1.000 | 1.483 |
| 24 | Splim > 60 mph | Motr = L | 0.116 | 1.000 | 1.483 |
| 25 | Dirt = O1 and Motr = R | Injury = Sli | 0.116 | 0.833 | 4.479 |
| 26 | Dirt = O1 and Injury = Sli | Motr = R | 0.116 | 1.000 | 3.071 |
| 27 | Motr = R and Injury = Sli | Dirt = O1 | 0.116 | 0.833 | 3.583 |
| 28 | Motr = L and Lane = Idc | Injury = Sei | 0.116 | 0.833 | 1.194 |
| 29 | Lane = Odc and 60 mph | Injury = Sei | 0.116 | 0.833 | 1.194 |
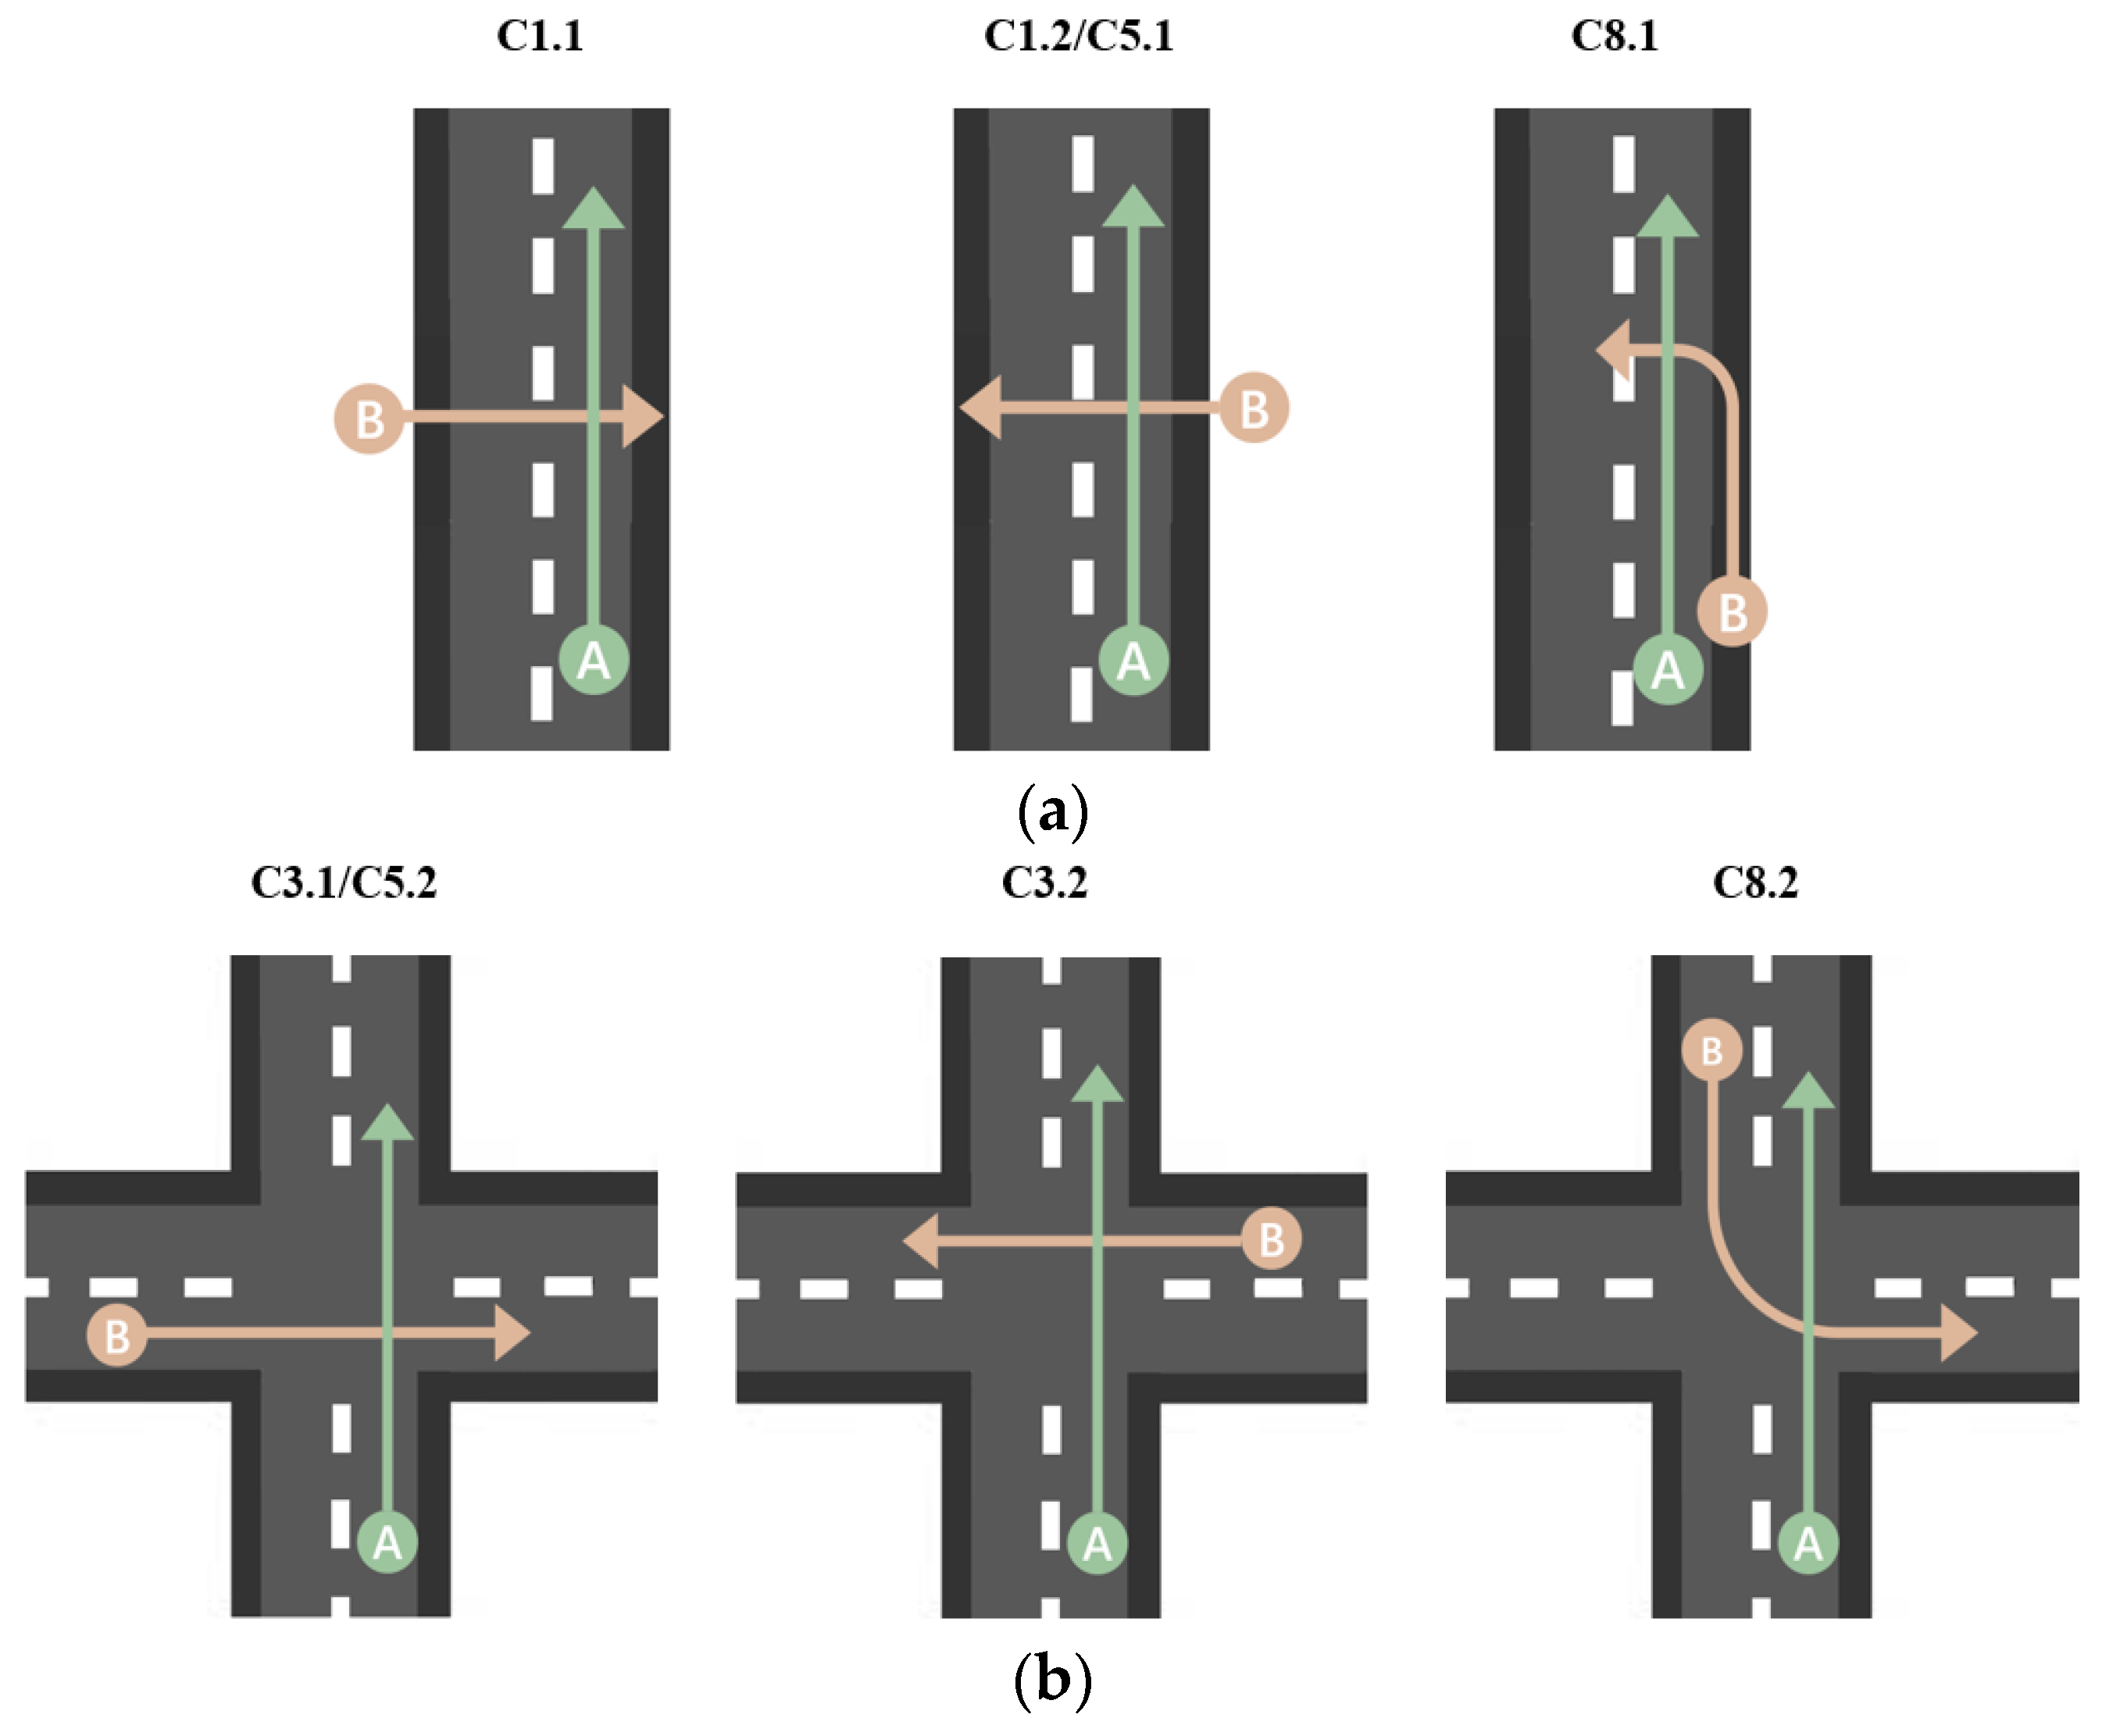
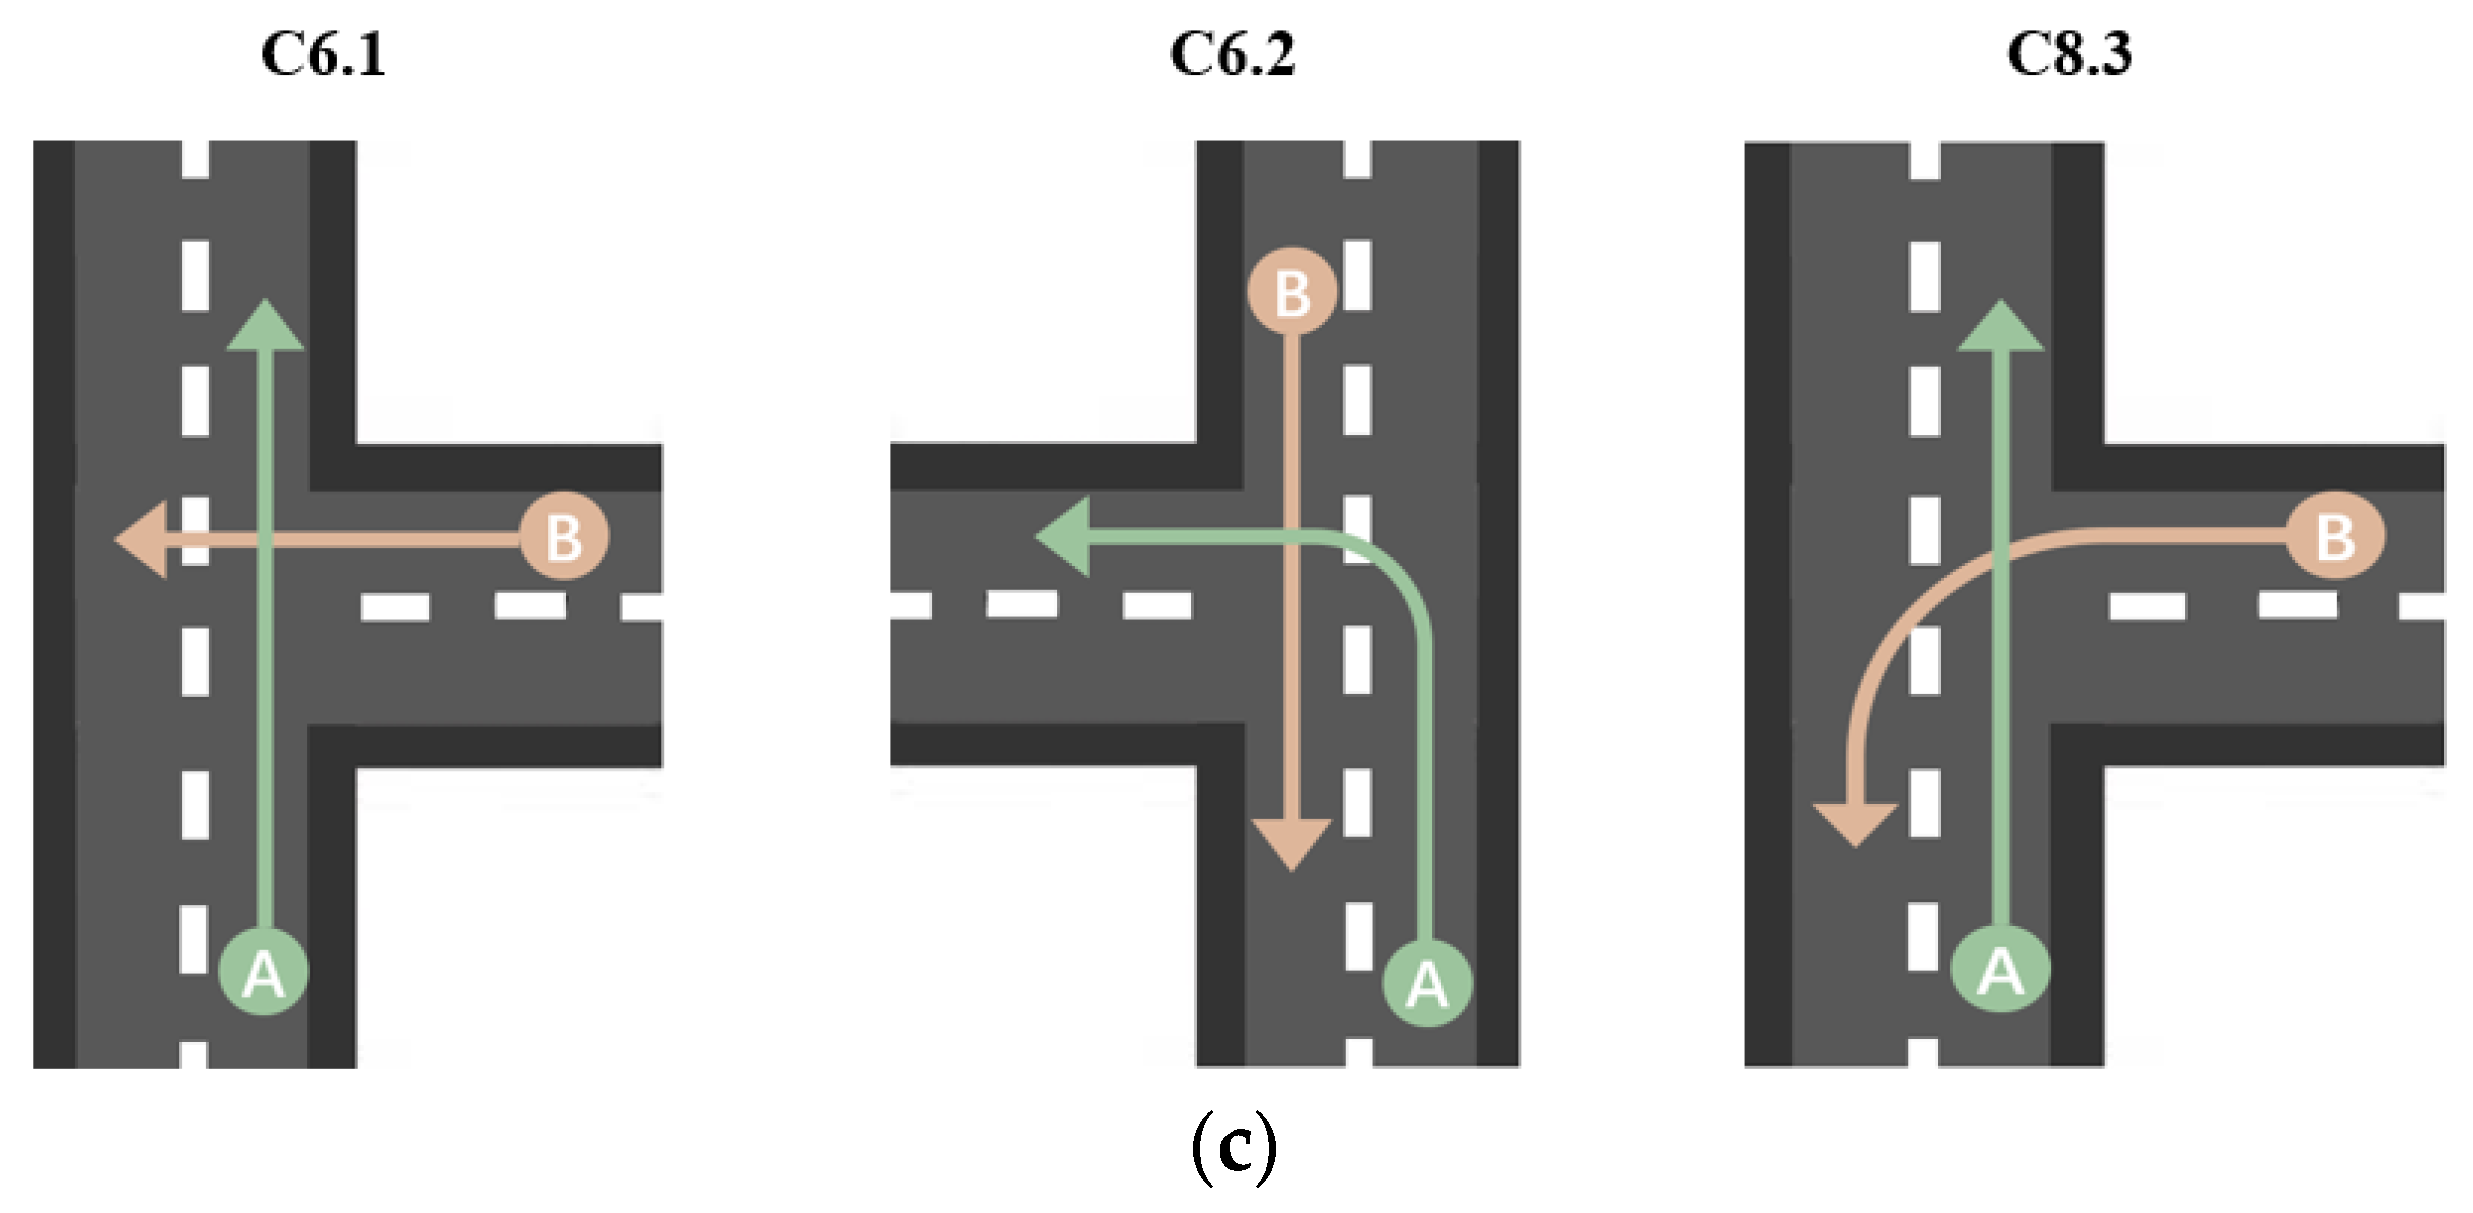
| Road Type | Collision Scenario | Weather | Light | Injury Severity of TW Rider | Vehicle Traveling Lane | Motion of TW Relative to Vehicle | Speed Limit | Road Center Separation | Direction of Collision Force on Vehicle |
|---|---|---|---|---|---|---|---|---|---|
| Straight | C1.1 | Sunny | Day | Sei | Sc | Left | 40/50 mph | Unl | O11 |
| C1.2 | Sunny | Day | Sli | Sc | Right | 40/50 mph | Unl | / | |
| C5.1 | Rain/snow | Day | Sei/Fal | Sc | Right | 60 mph | / | O1 | |
| C8.1 | Sunny | Day | Sei | Sc | Right | 40 mph | / | / | |
| Intersection | C3.1 | Sunny | Day | Sei | Odc | Left | 40 mph | Cgb | O11 |
| C3.2 | Sunny | Day | Sei/Sli | / | Right | 60 mph | Sl | O12/O1 | |
| C5.2 | Rain/snow | Day | Sei/Fal | Odc | Left | 60 mph | / | O12 | |
| C8.2 | Sunny | Day | Sei | Odc | Left | 60 mph | Cgb | / | |
| T-junction | C6.1 | / | Day | Sei | Idc | Right | 60 mph | / | O12 |
| C6.2 | / | Day | Sei | Idc | Left | 60 mph | / | O12 | |
| C8.3 | Sunny | Day | / | / | Right | / | / | / |
Disclaimer/Publisher’s Note: The statements, opinions and data contained in all publications are solely those of the individual author(s) and contributor(s) and not of MDPI and/or the editor(s). MDPI and/or the editor(s) disclaim responsibility for any injury to people or property resulting from any ideas, methods, instructions or products referred to in the content. |
© 2023 by the authors. Licensee MDPI, Basel, Switzerland. This article is an open access article distributed under the terms and conditions of the Creative Commons Attribution (CC BY) license (https://creativecommons.org/licenses/by/4.0/).
Share and Cite
Wang, R.; Qian, Y.; Dong, H.; Yu, W. Data Mining-Based Collision Scenarios of Vehicles and Two Wheelers for the Safety Assessment of Intelligent Driving Functions. World Electr. Veh. J. 2023, 14, 284. https://doi.org/10.3390/wevj14100284
Wang R, Qian Y, Dong H, Yu W. Data Mining-Based Collision Scenarios of Vehicles and Two Wheelers for the Safety Assessment of Intelligent Driving Functions. World Electric Vehicle Journal. 2023; 14(10):284. https://doi.org/10.3390/wevj14100284
Chicago/Turabian StyleWang, Rong, Yubin Qian, Honglei Dong, and Wangpengfei Yu. 2023. "Data Mining-Based Collision Scenarios of Vehicles and Two Wheelers for the Safety Assessment of Intelligent Driving Functions" World Electric Vehicle Journal 14, no. 10: 284. https://doi.org/10.3390/wevj14100284