
Parameter Matching of Power Systems and Design of Vehicle Control Strategies for Mini-Electric Trucks


Abstract
:1. Introduction
2. Power System Parameter Design
2.1. Basic Parameters and Performance Indicators
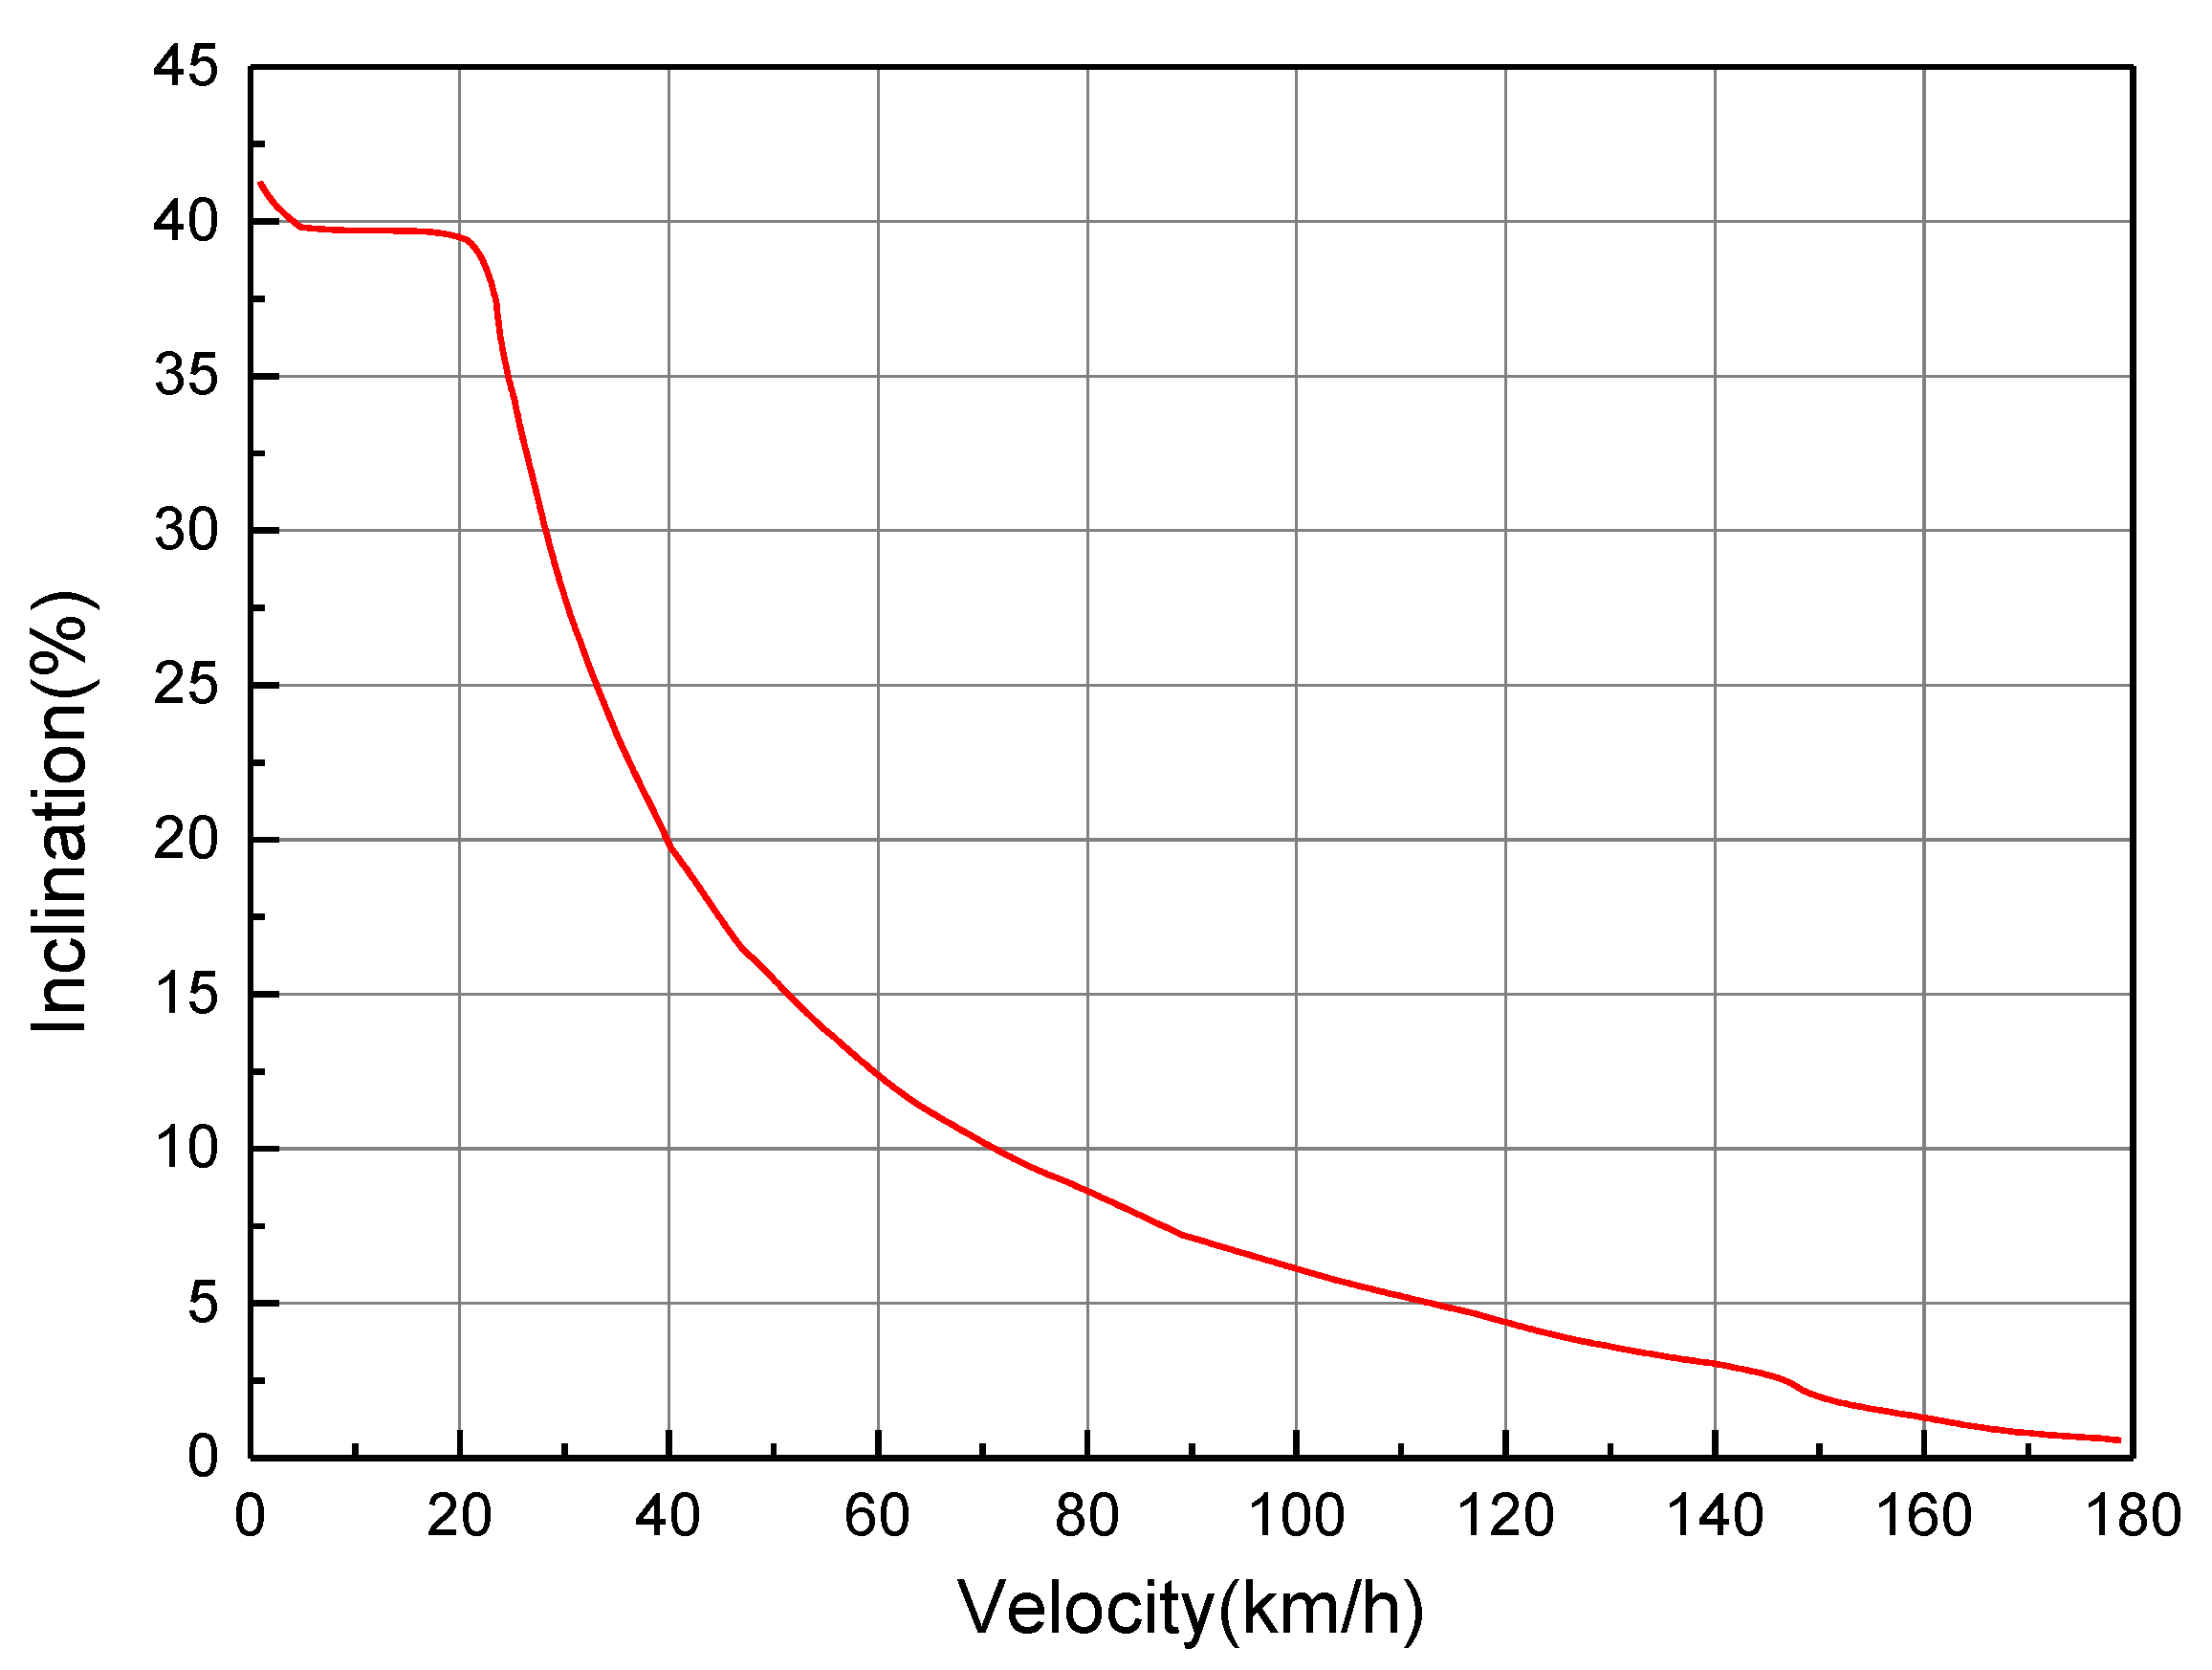
2.2. Selection of Operation Conditions
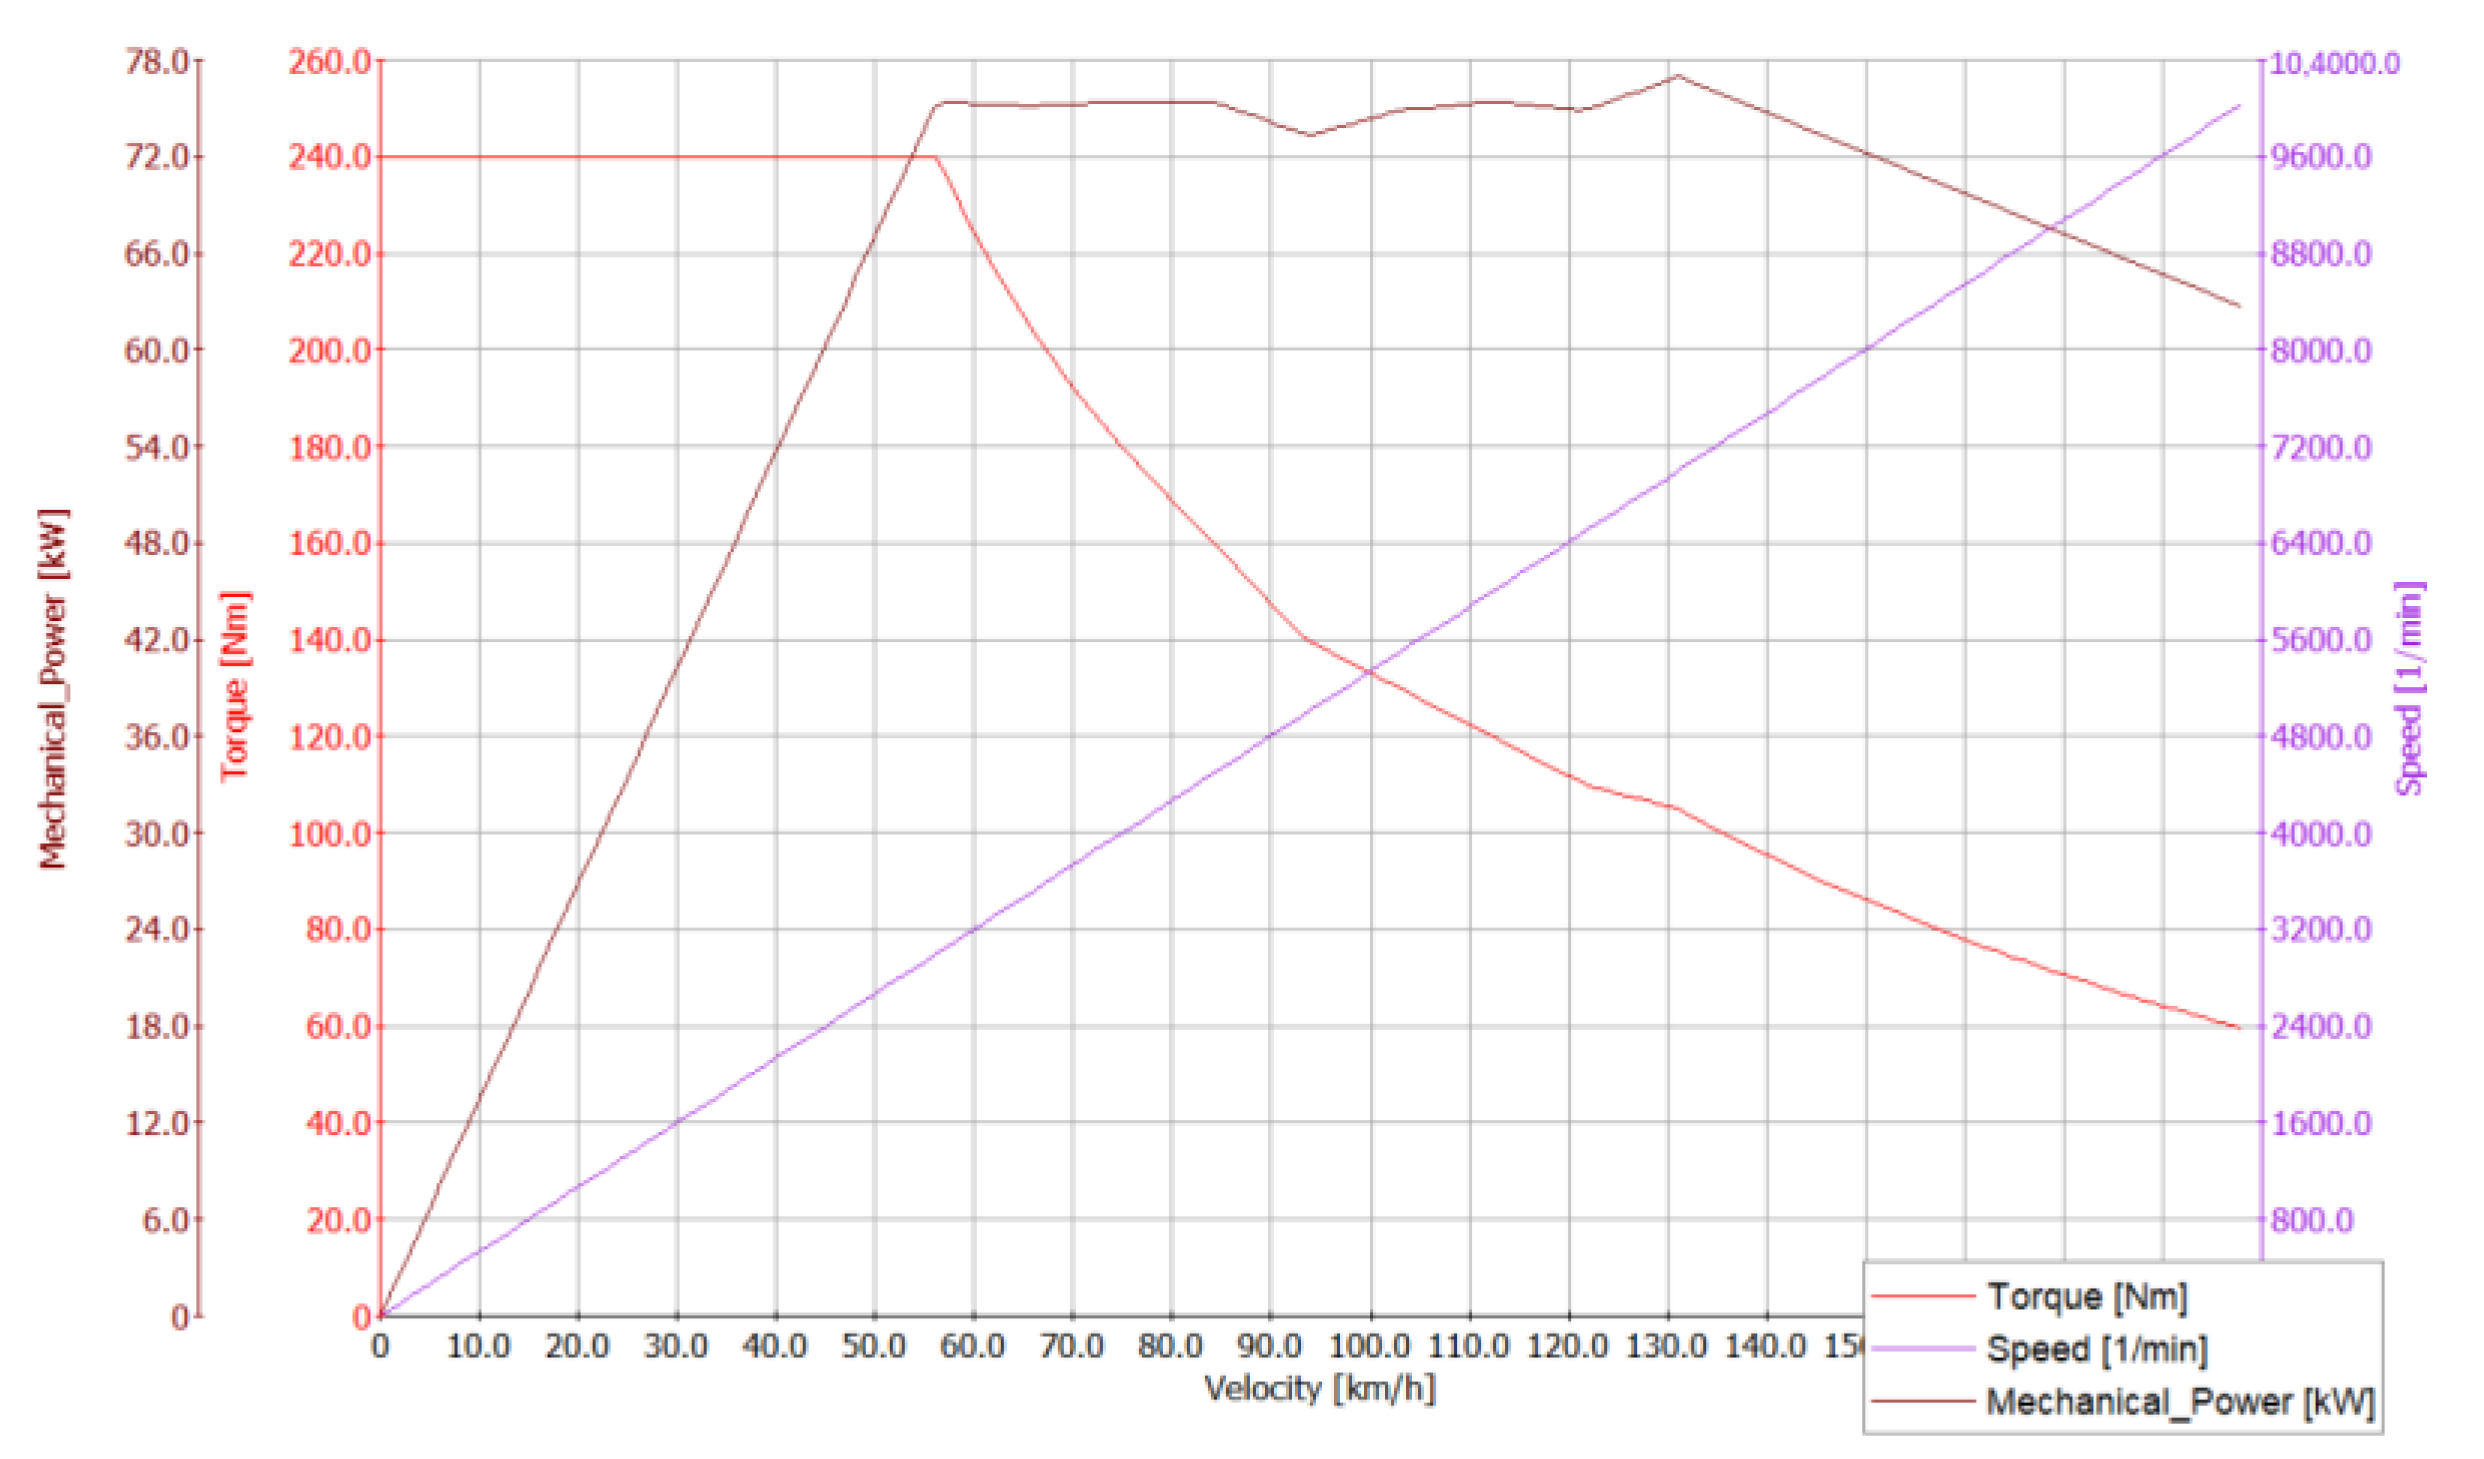
2.3. Calculation of Motor Parameters
2.4. Determination of Transmission System Parameters
2.5. Determination of Power Battery Parameters
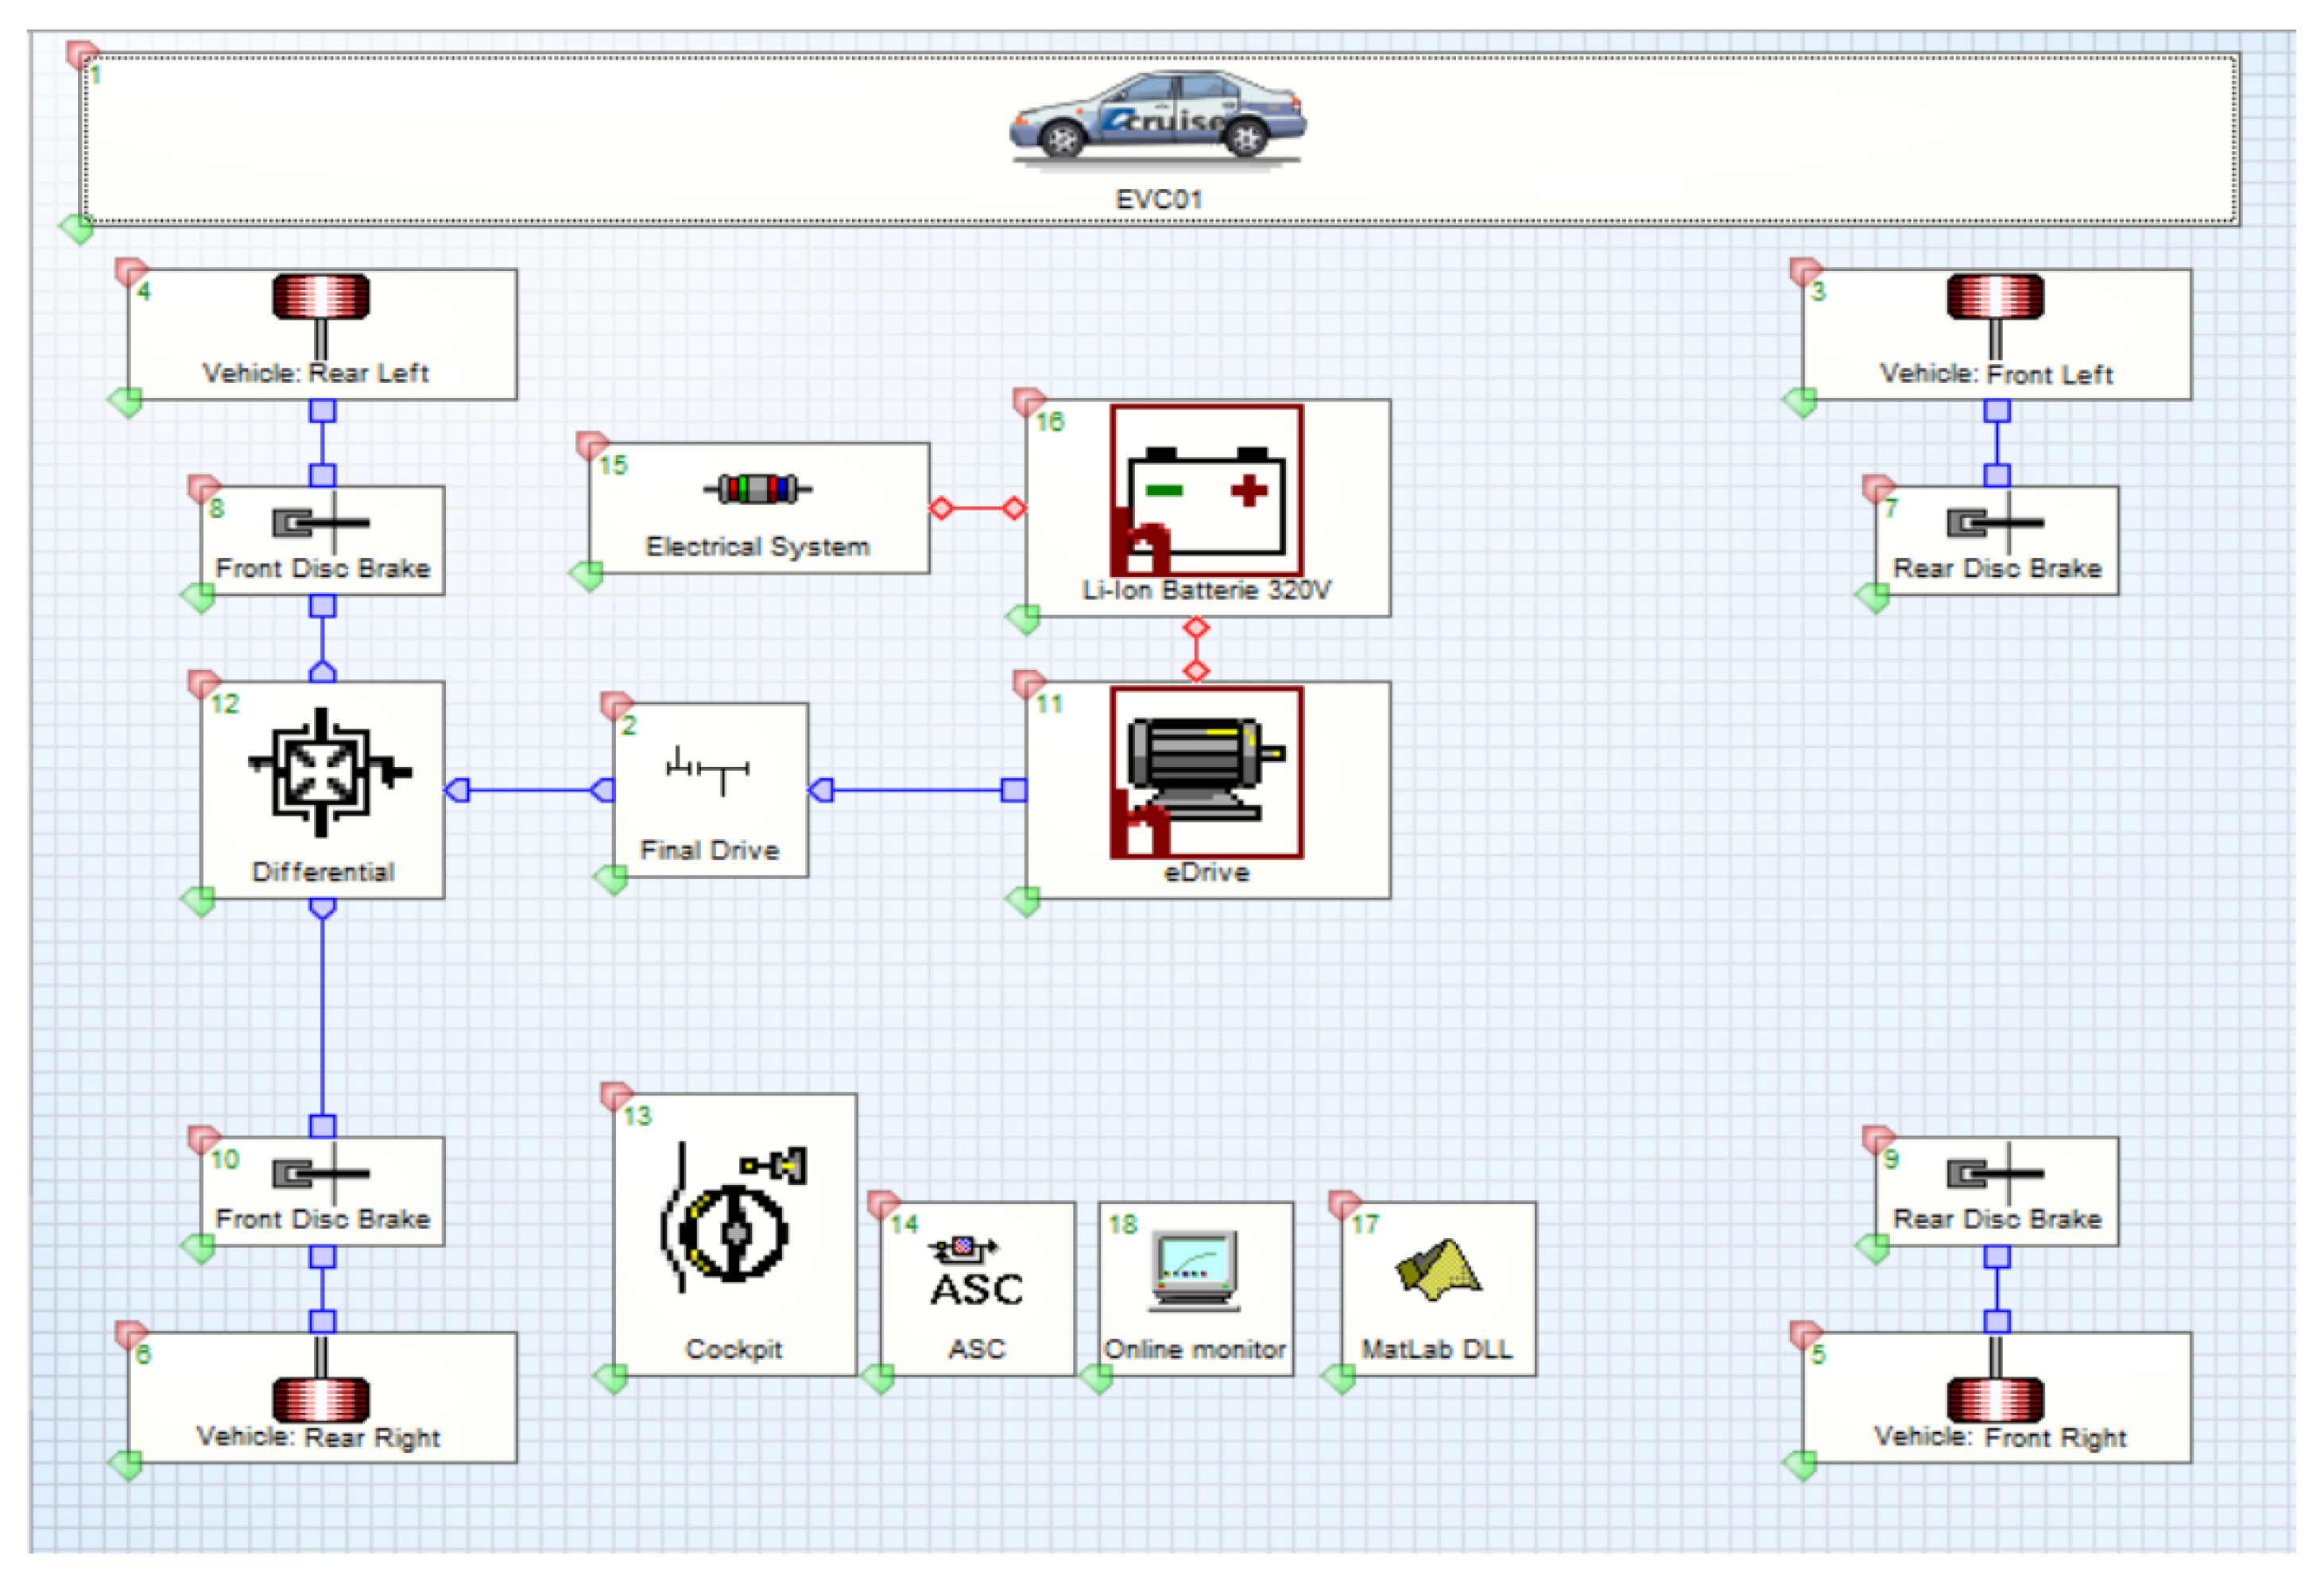
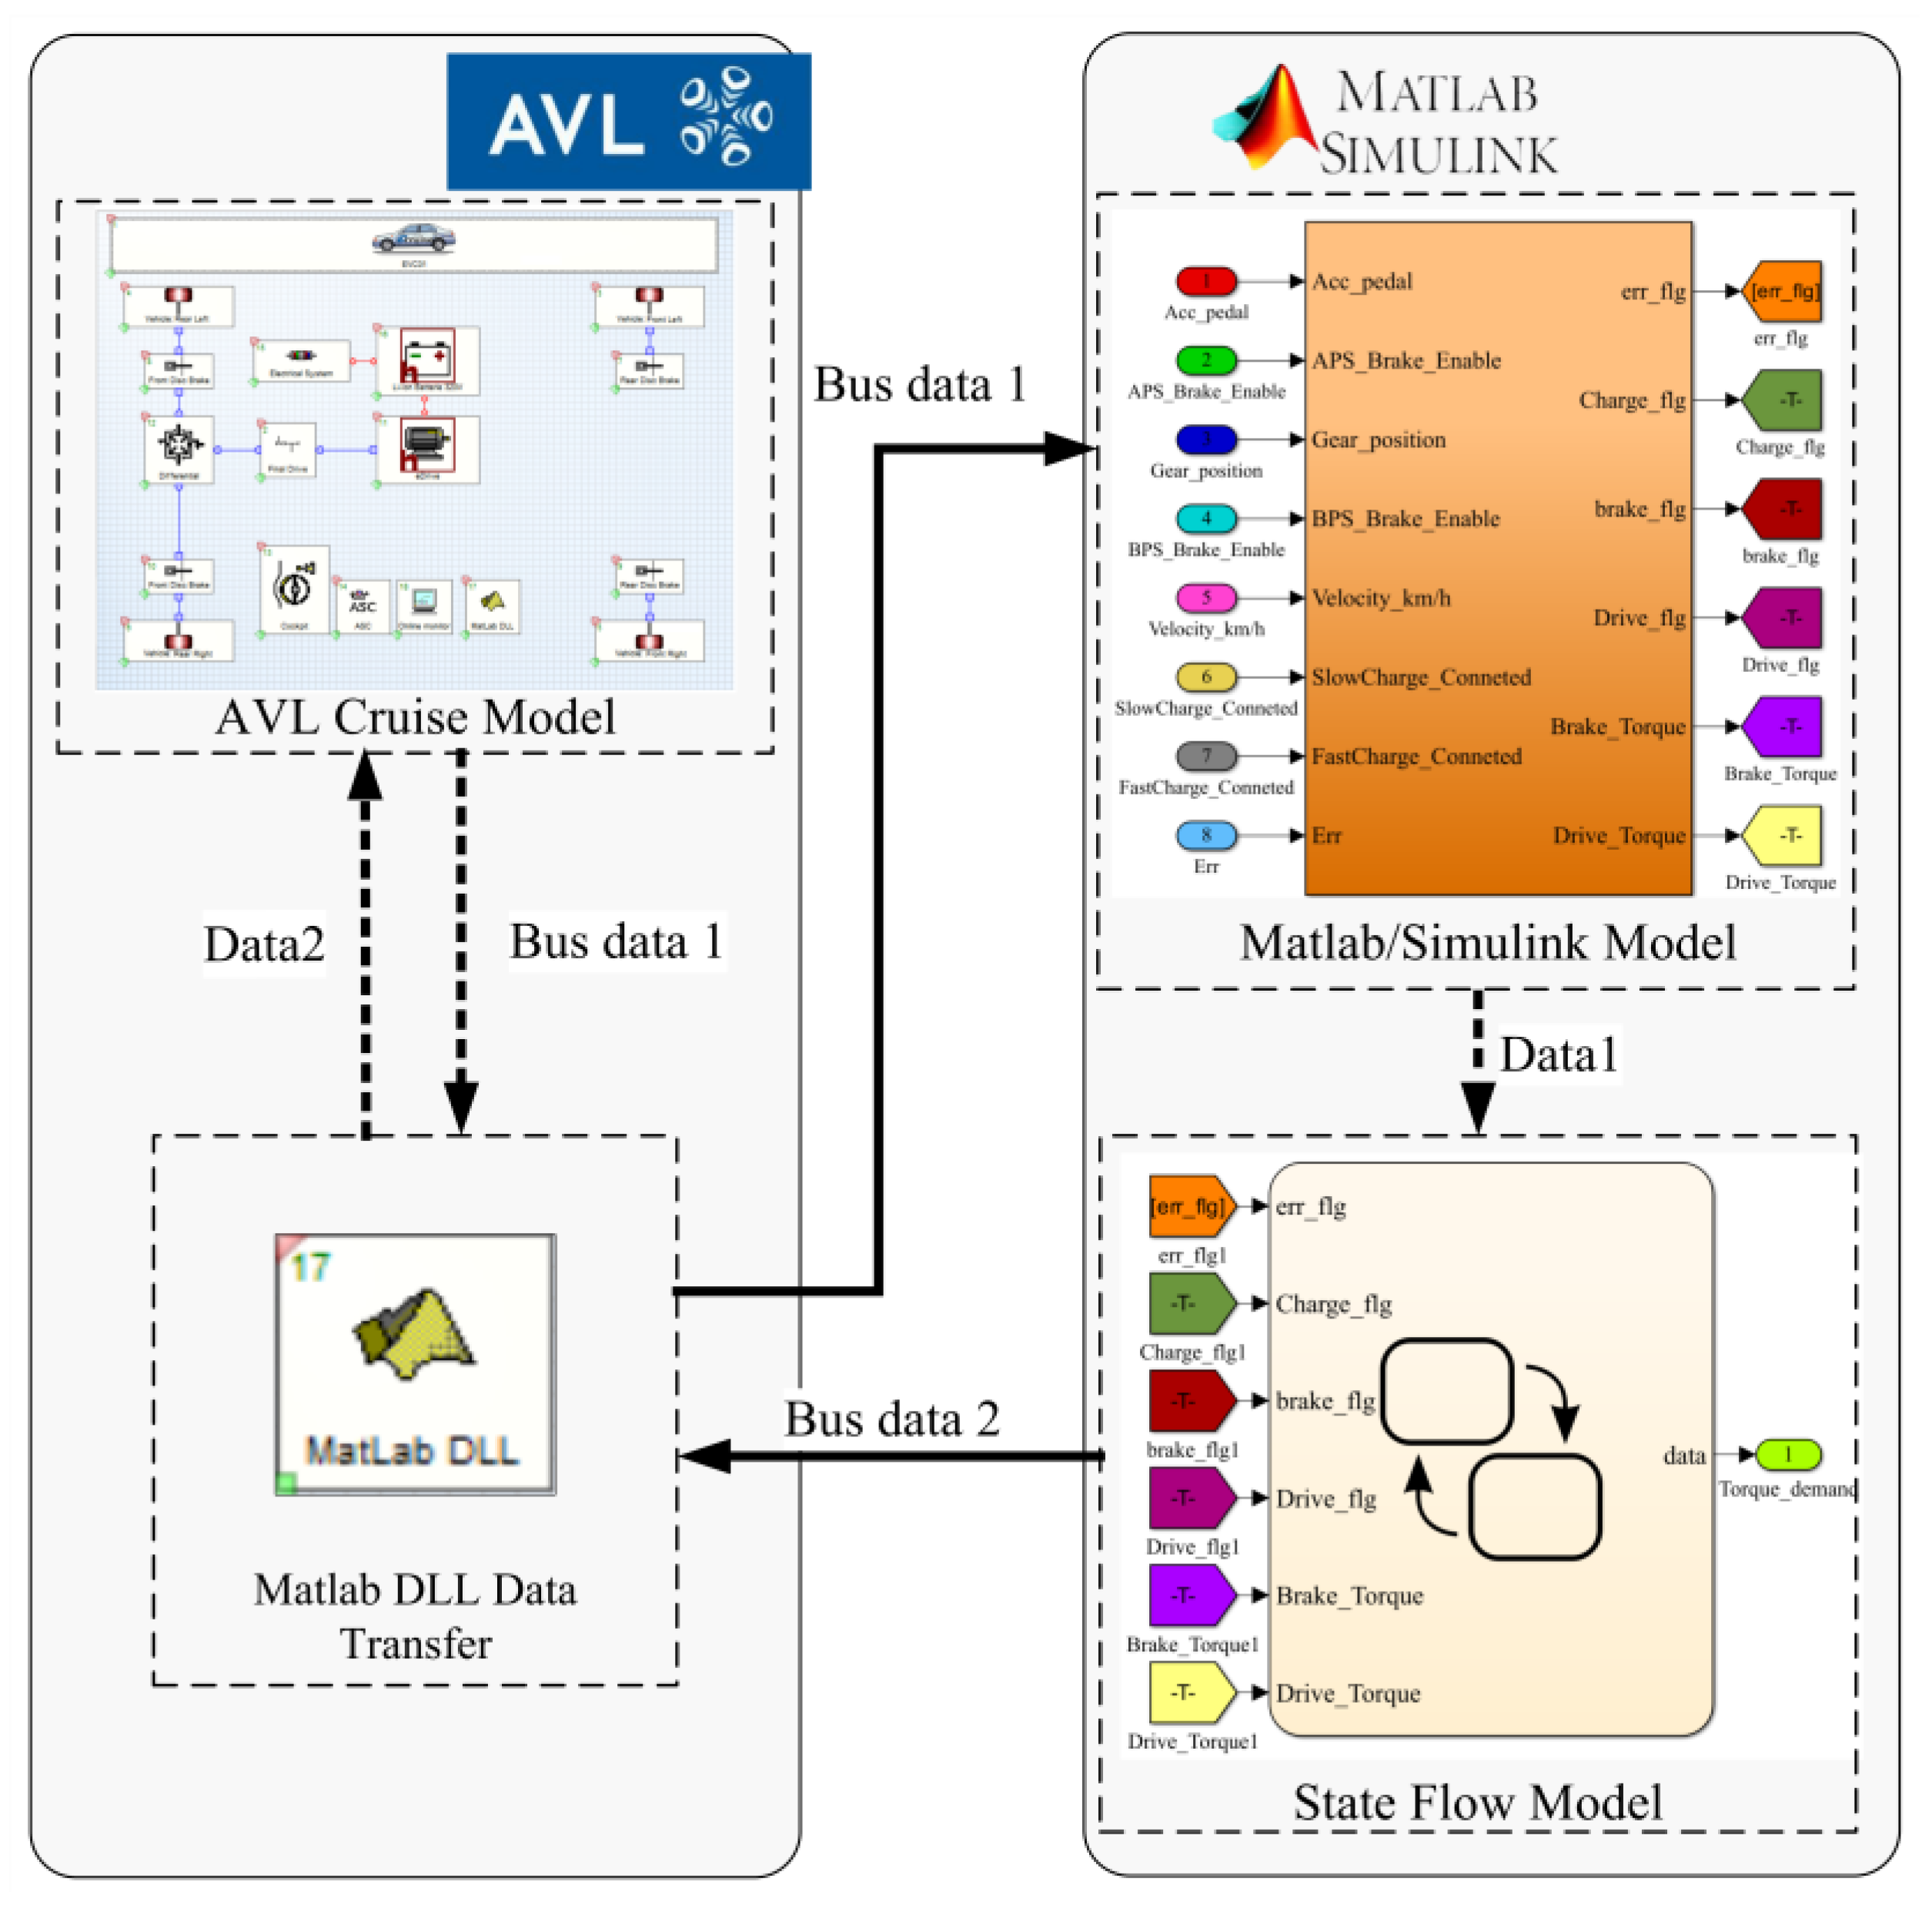
3. Establishment of the Power Model Based on CRUISE Software
4. Vehicle Control Strategy Design
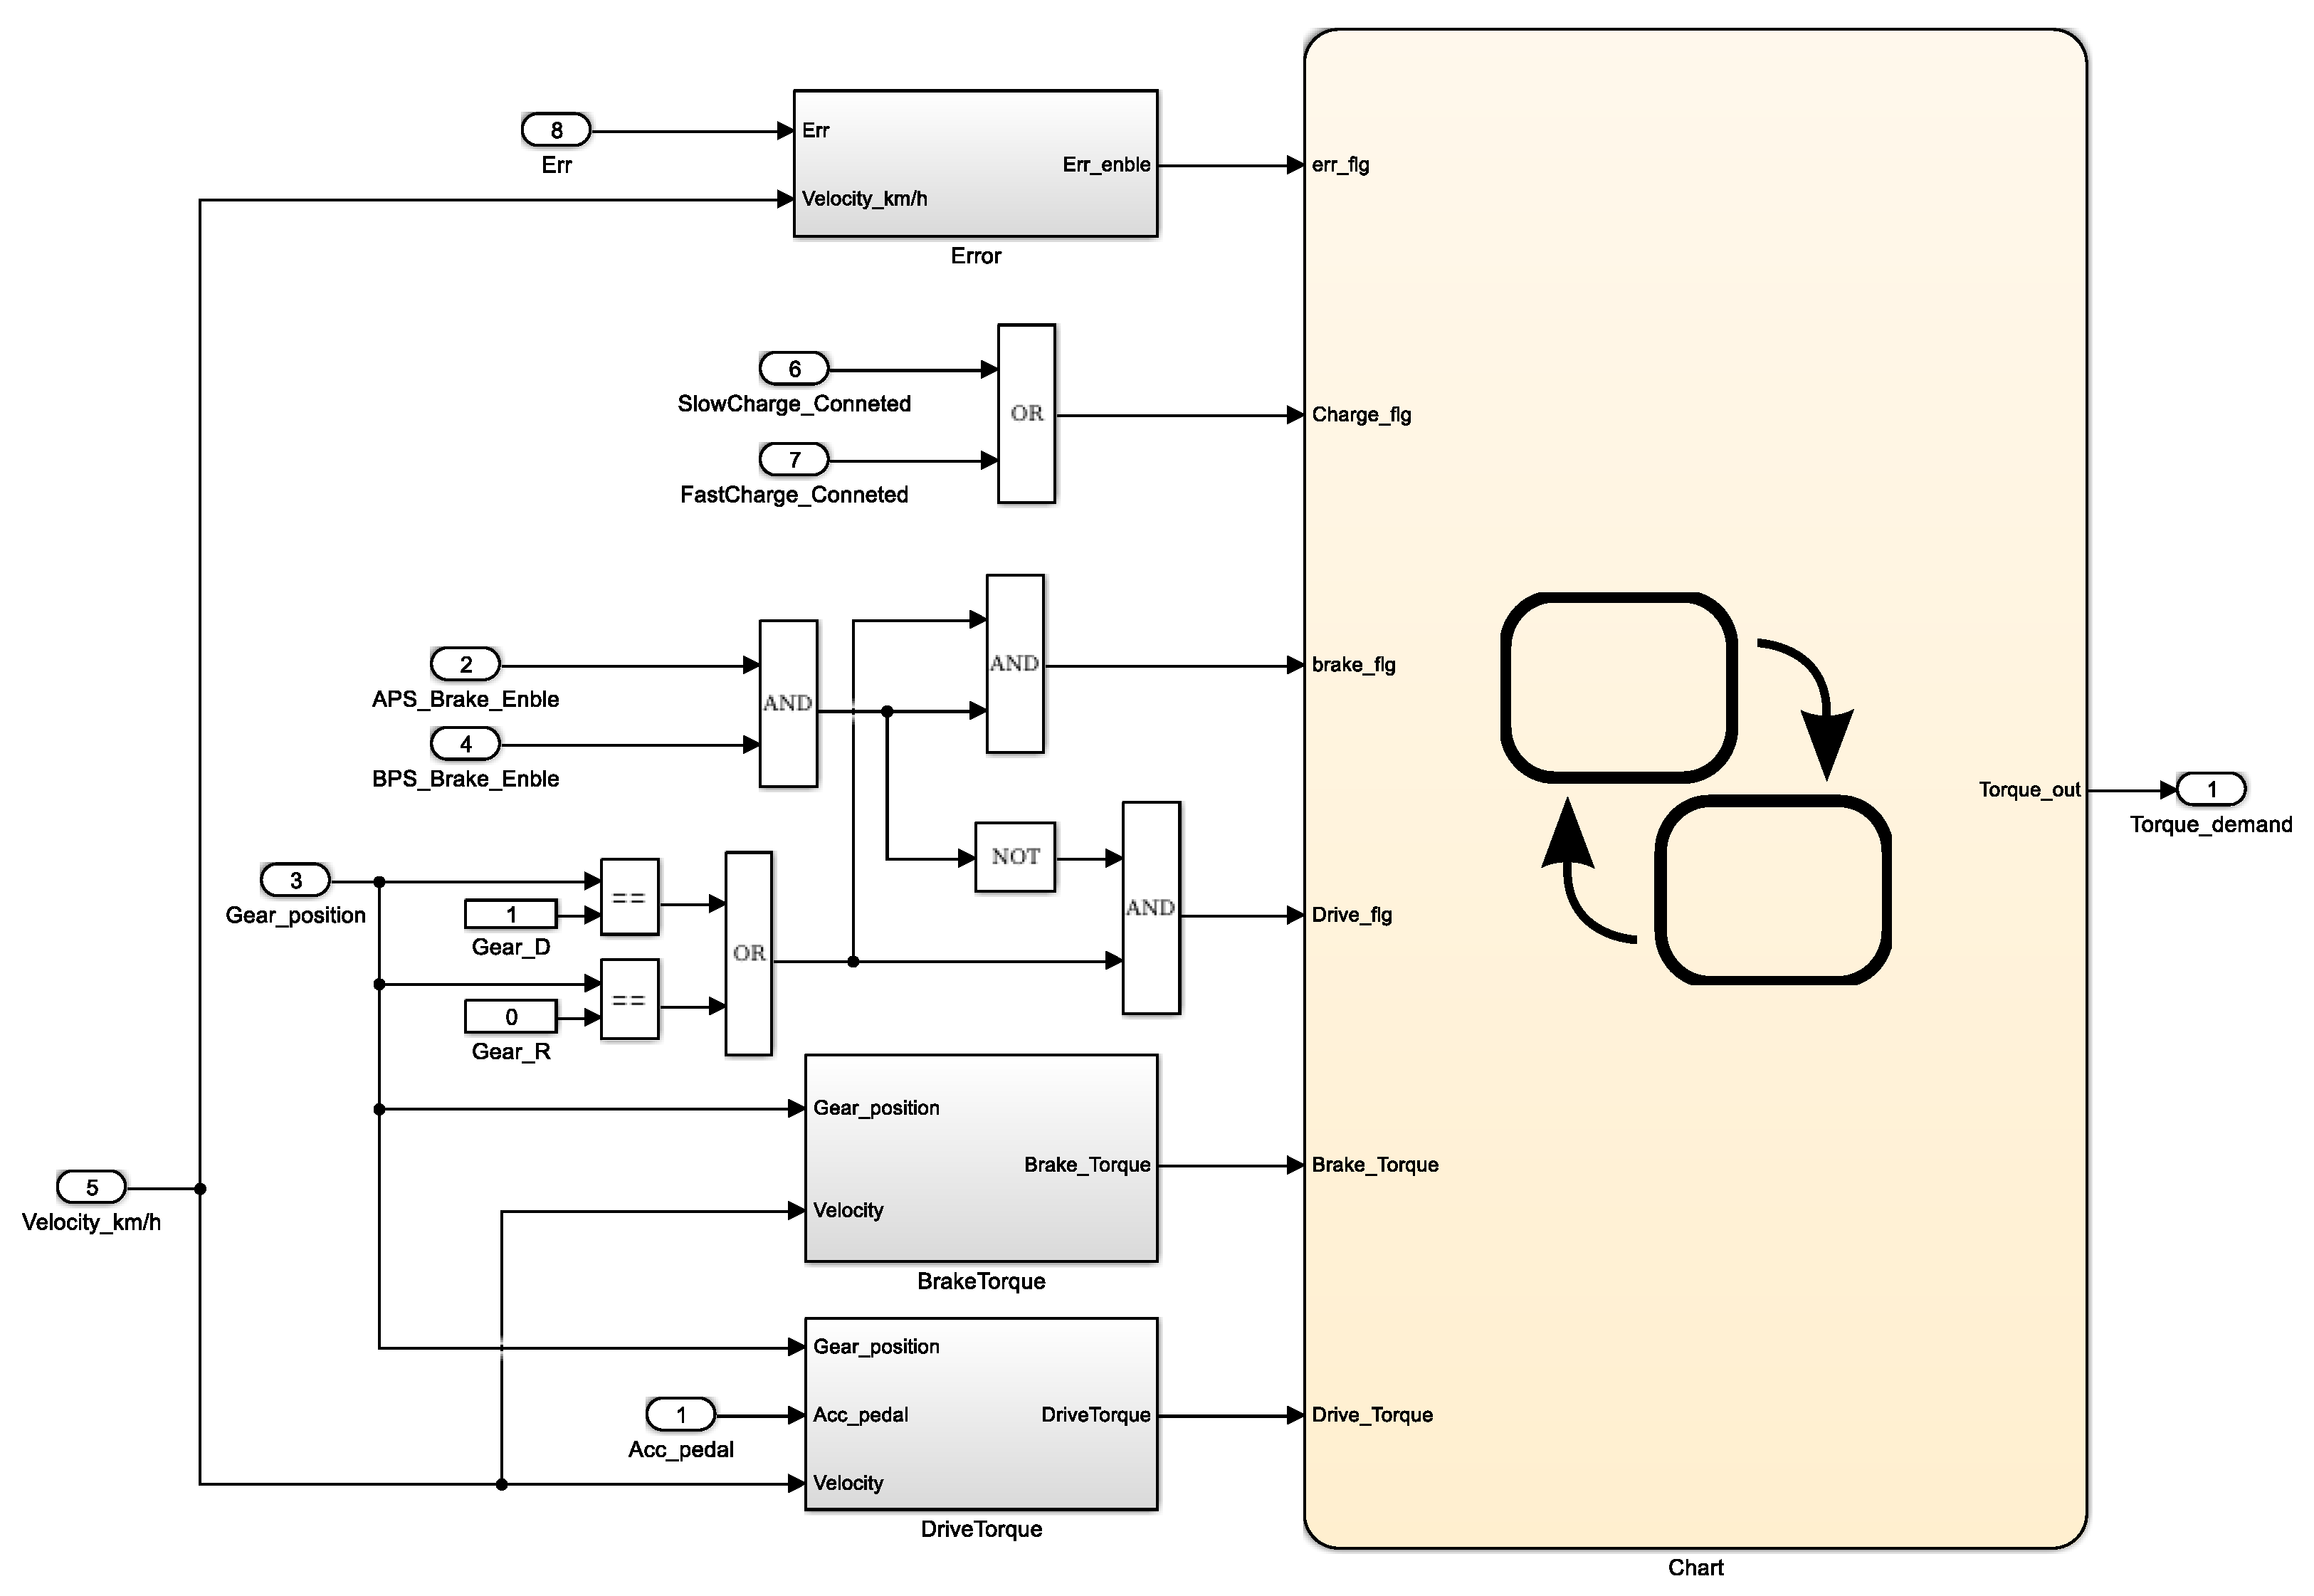
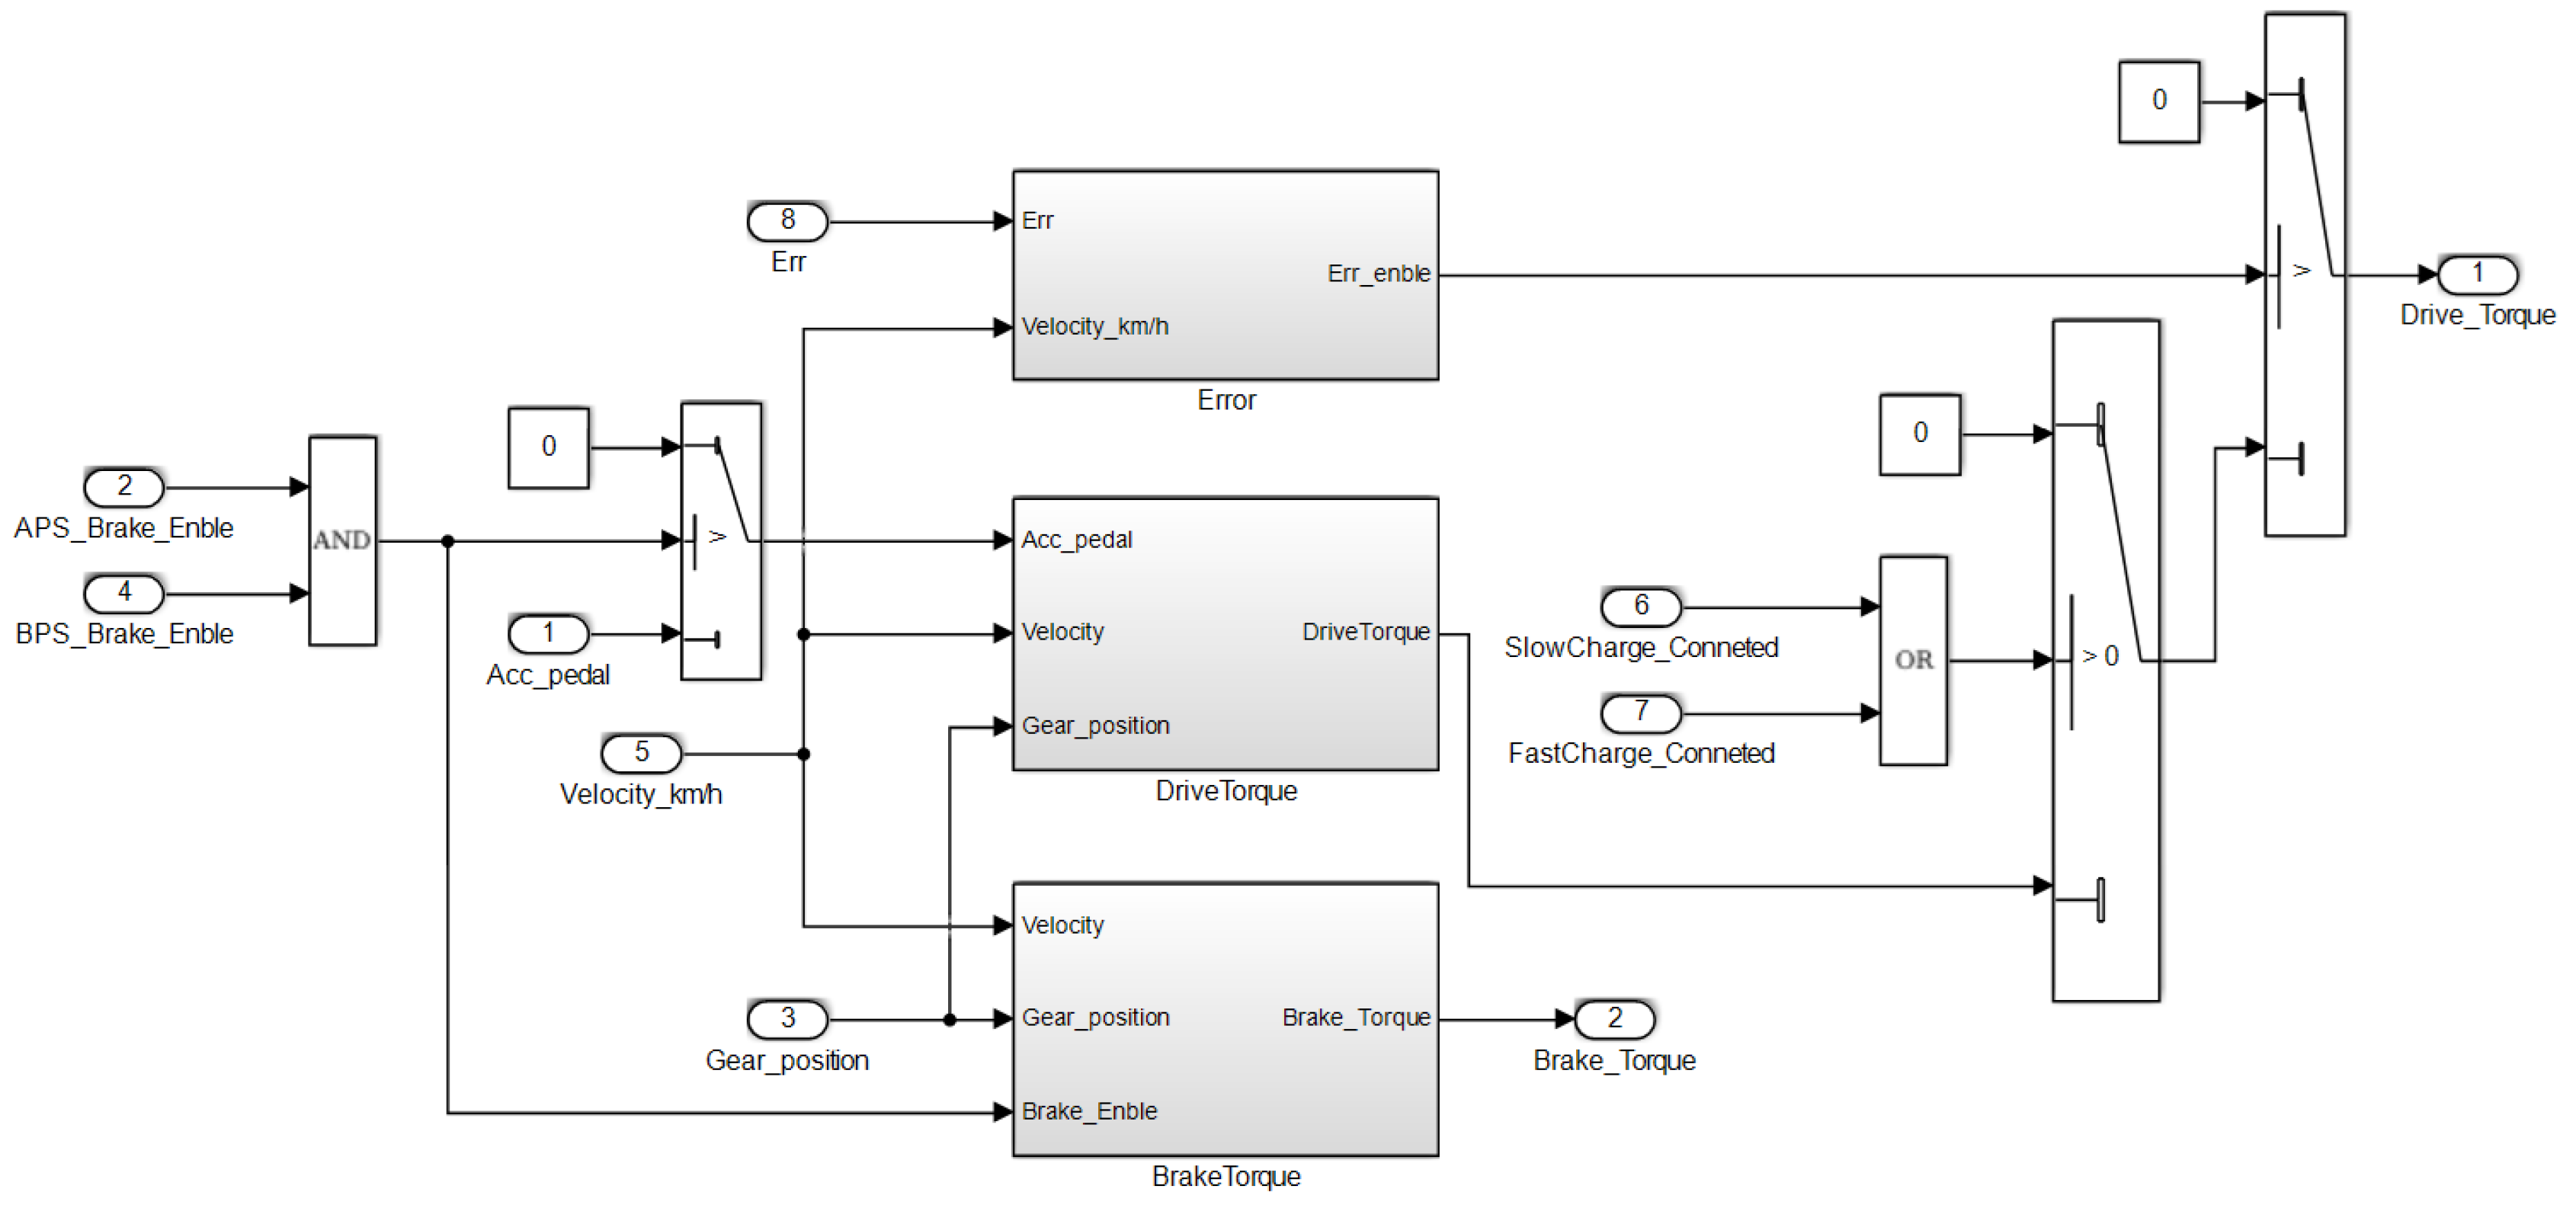
4.1. Vehicle Control Strategy Modeling
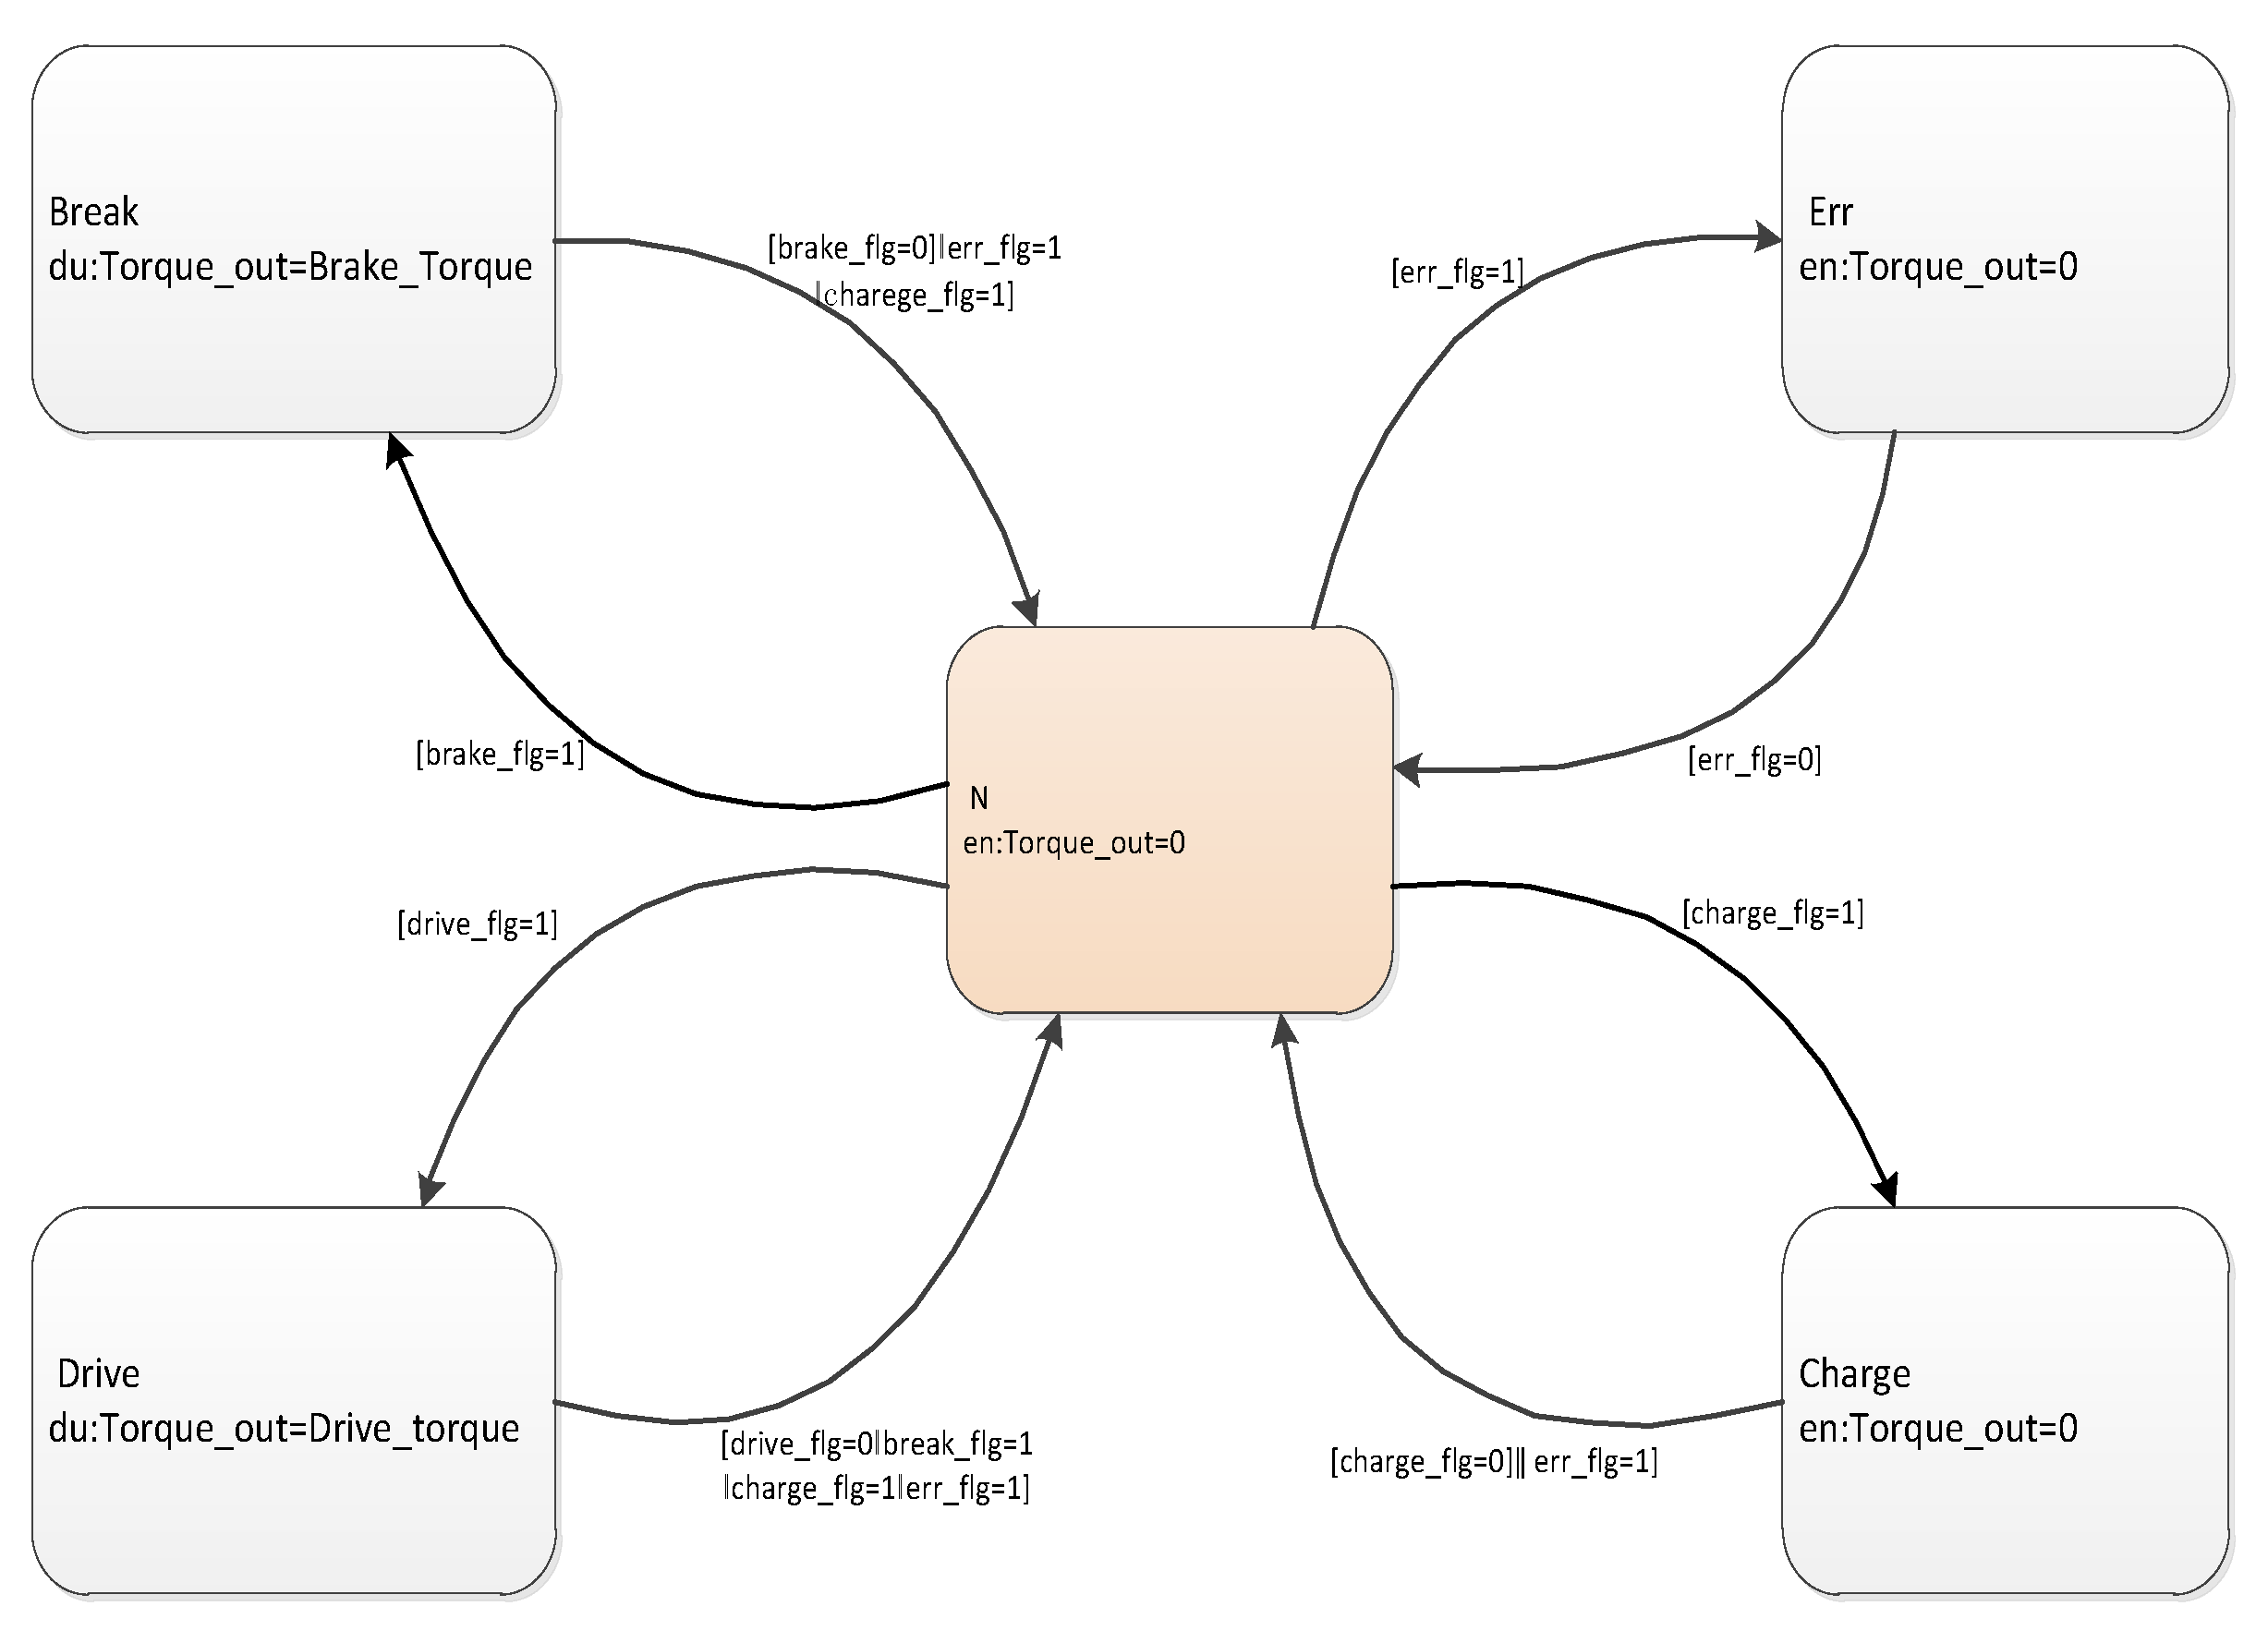
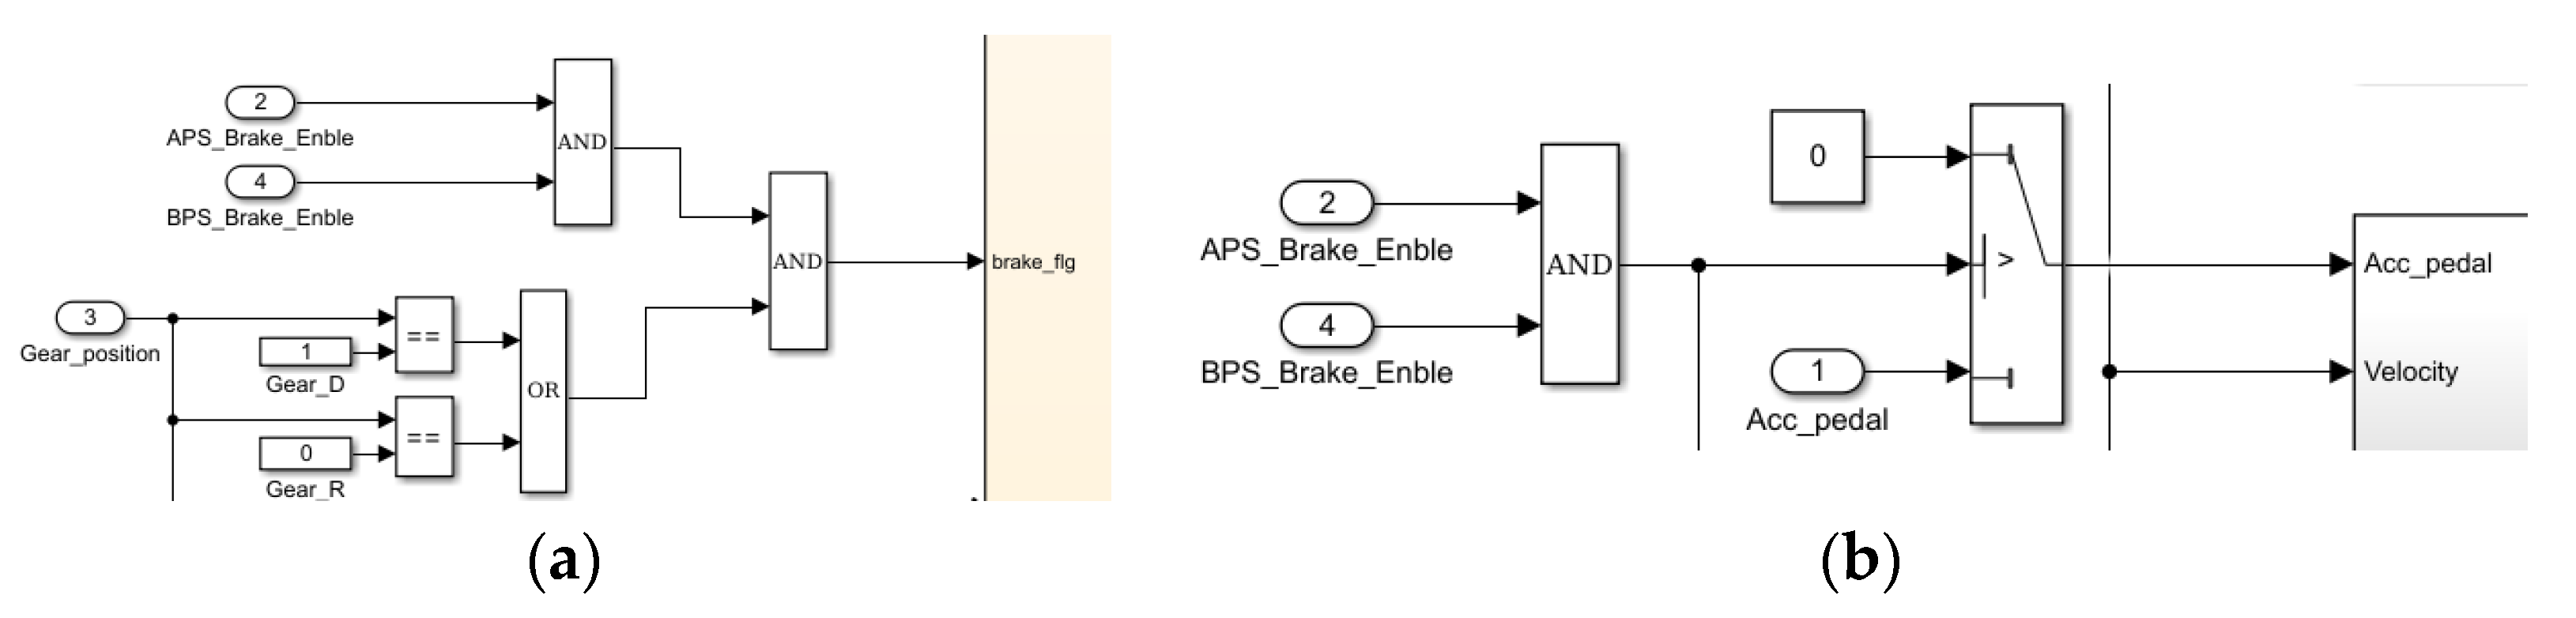
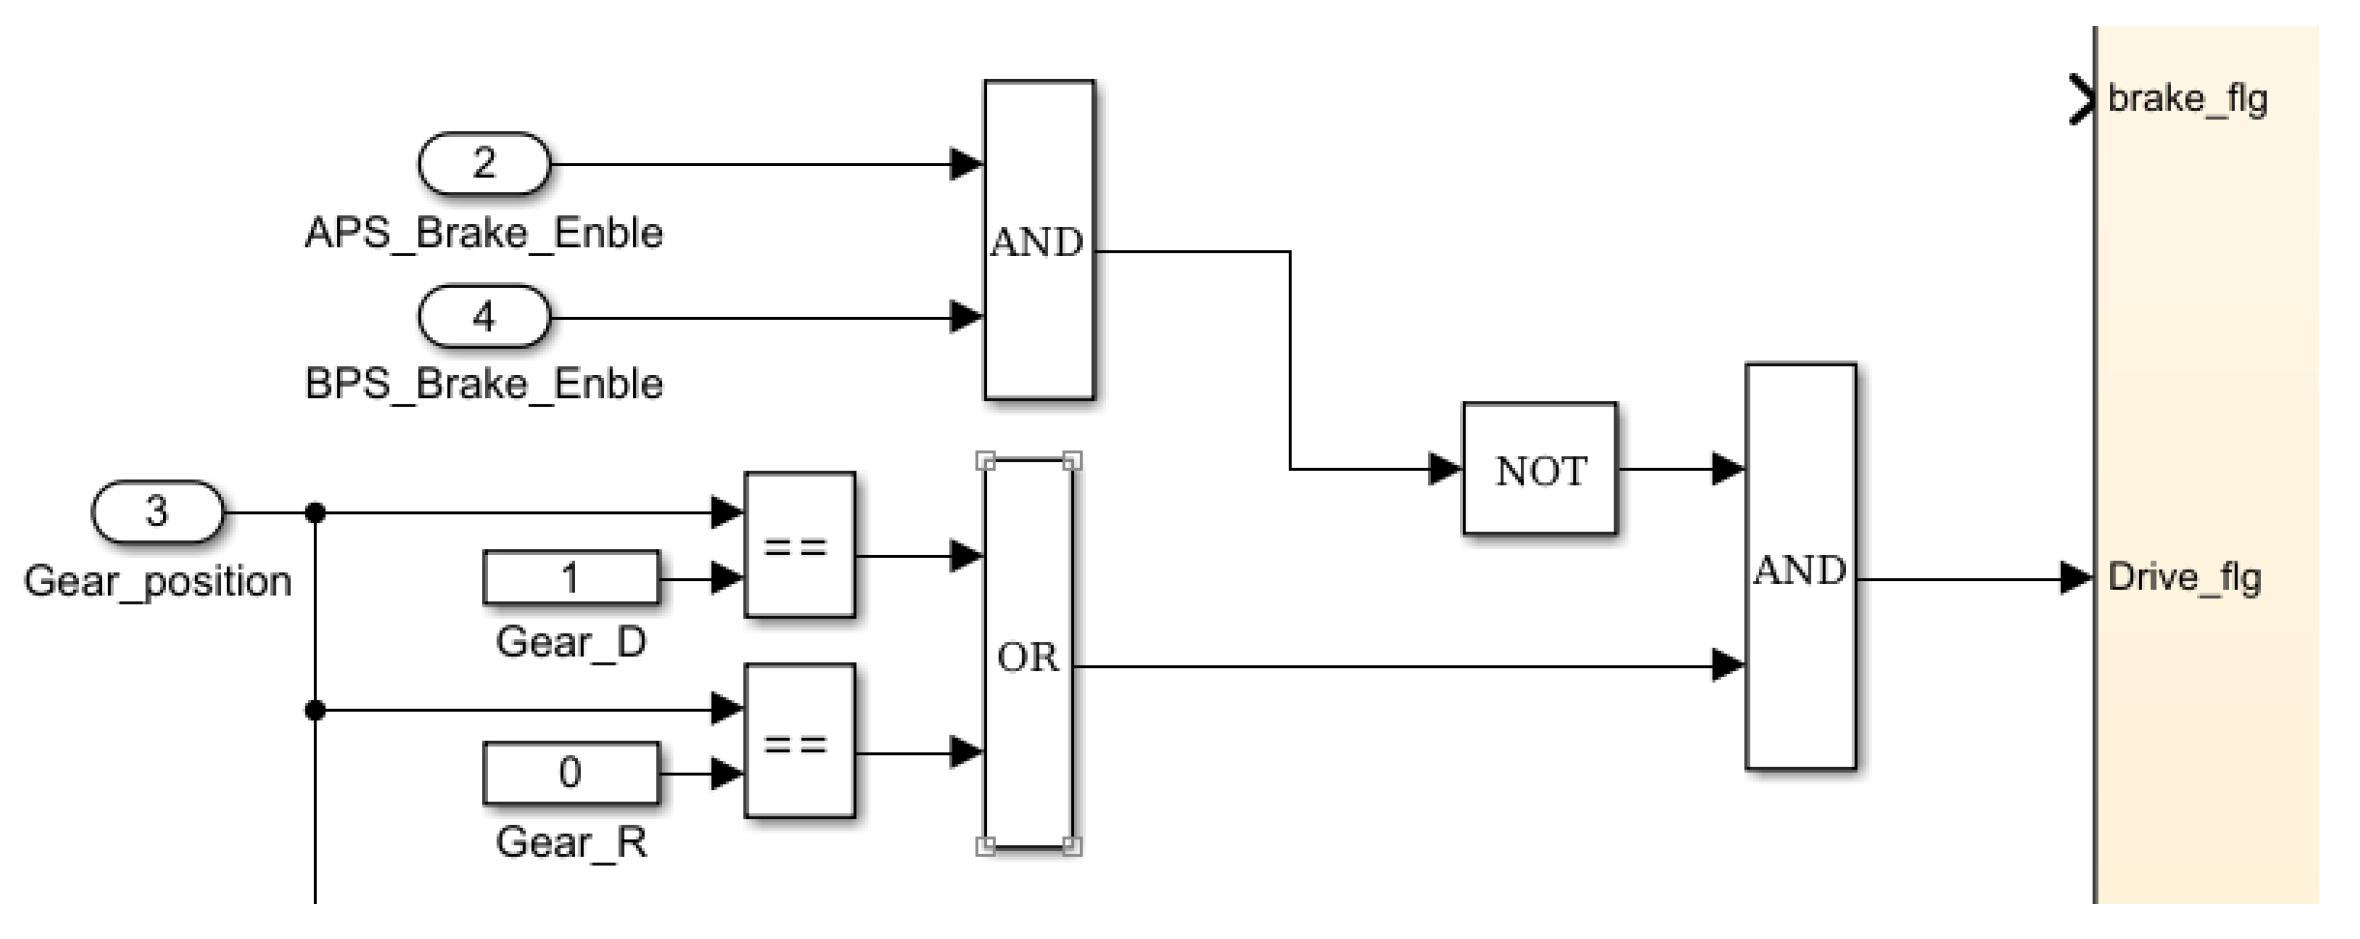
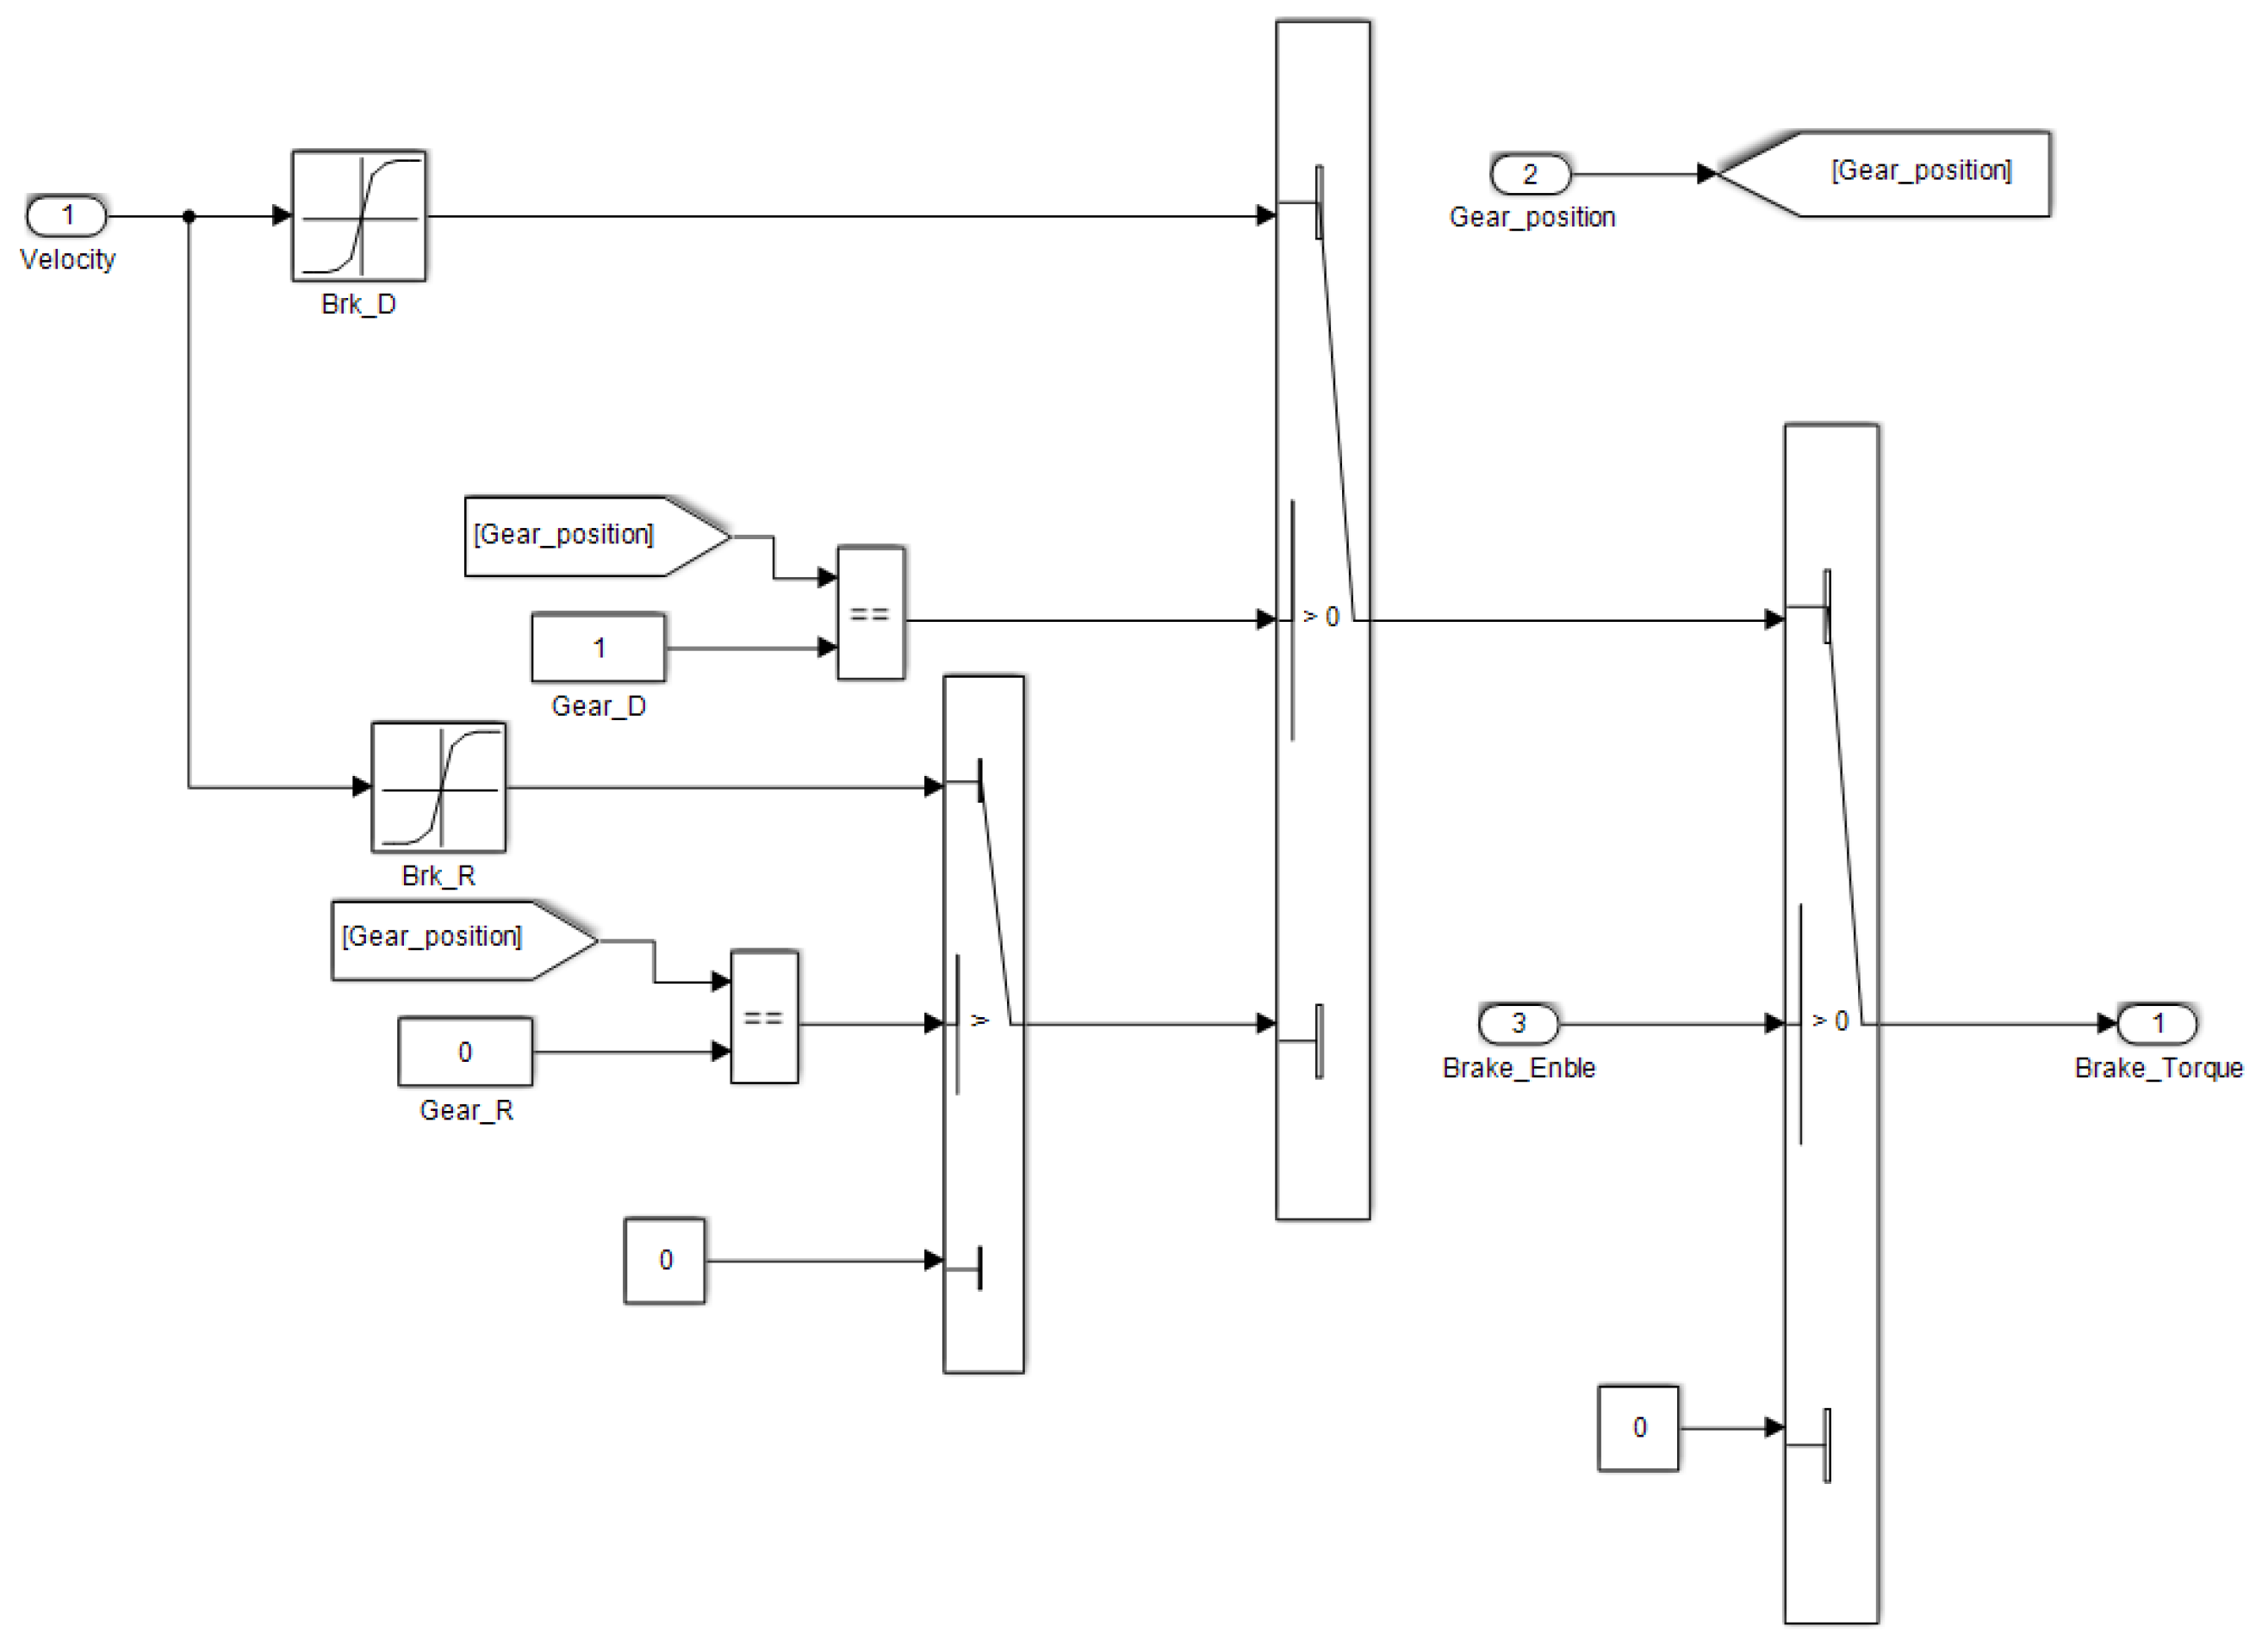
4.2. Implementation of Brake Priority
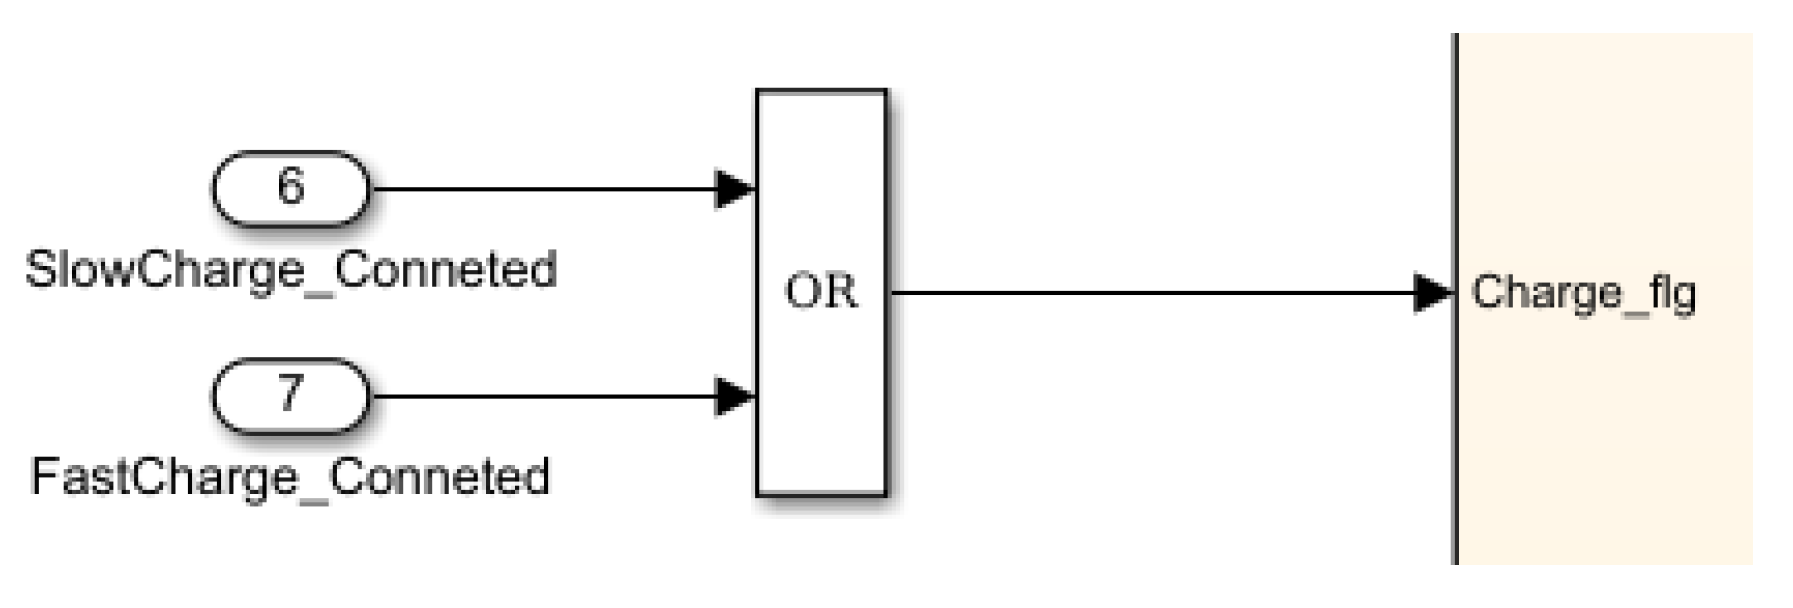
4.3. Implementation of Prohibiting Vehicle Driving on Charging
4.4. Implementation of Vehicle Driving
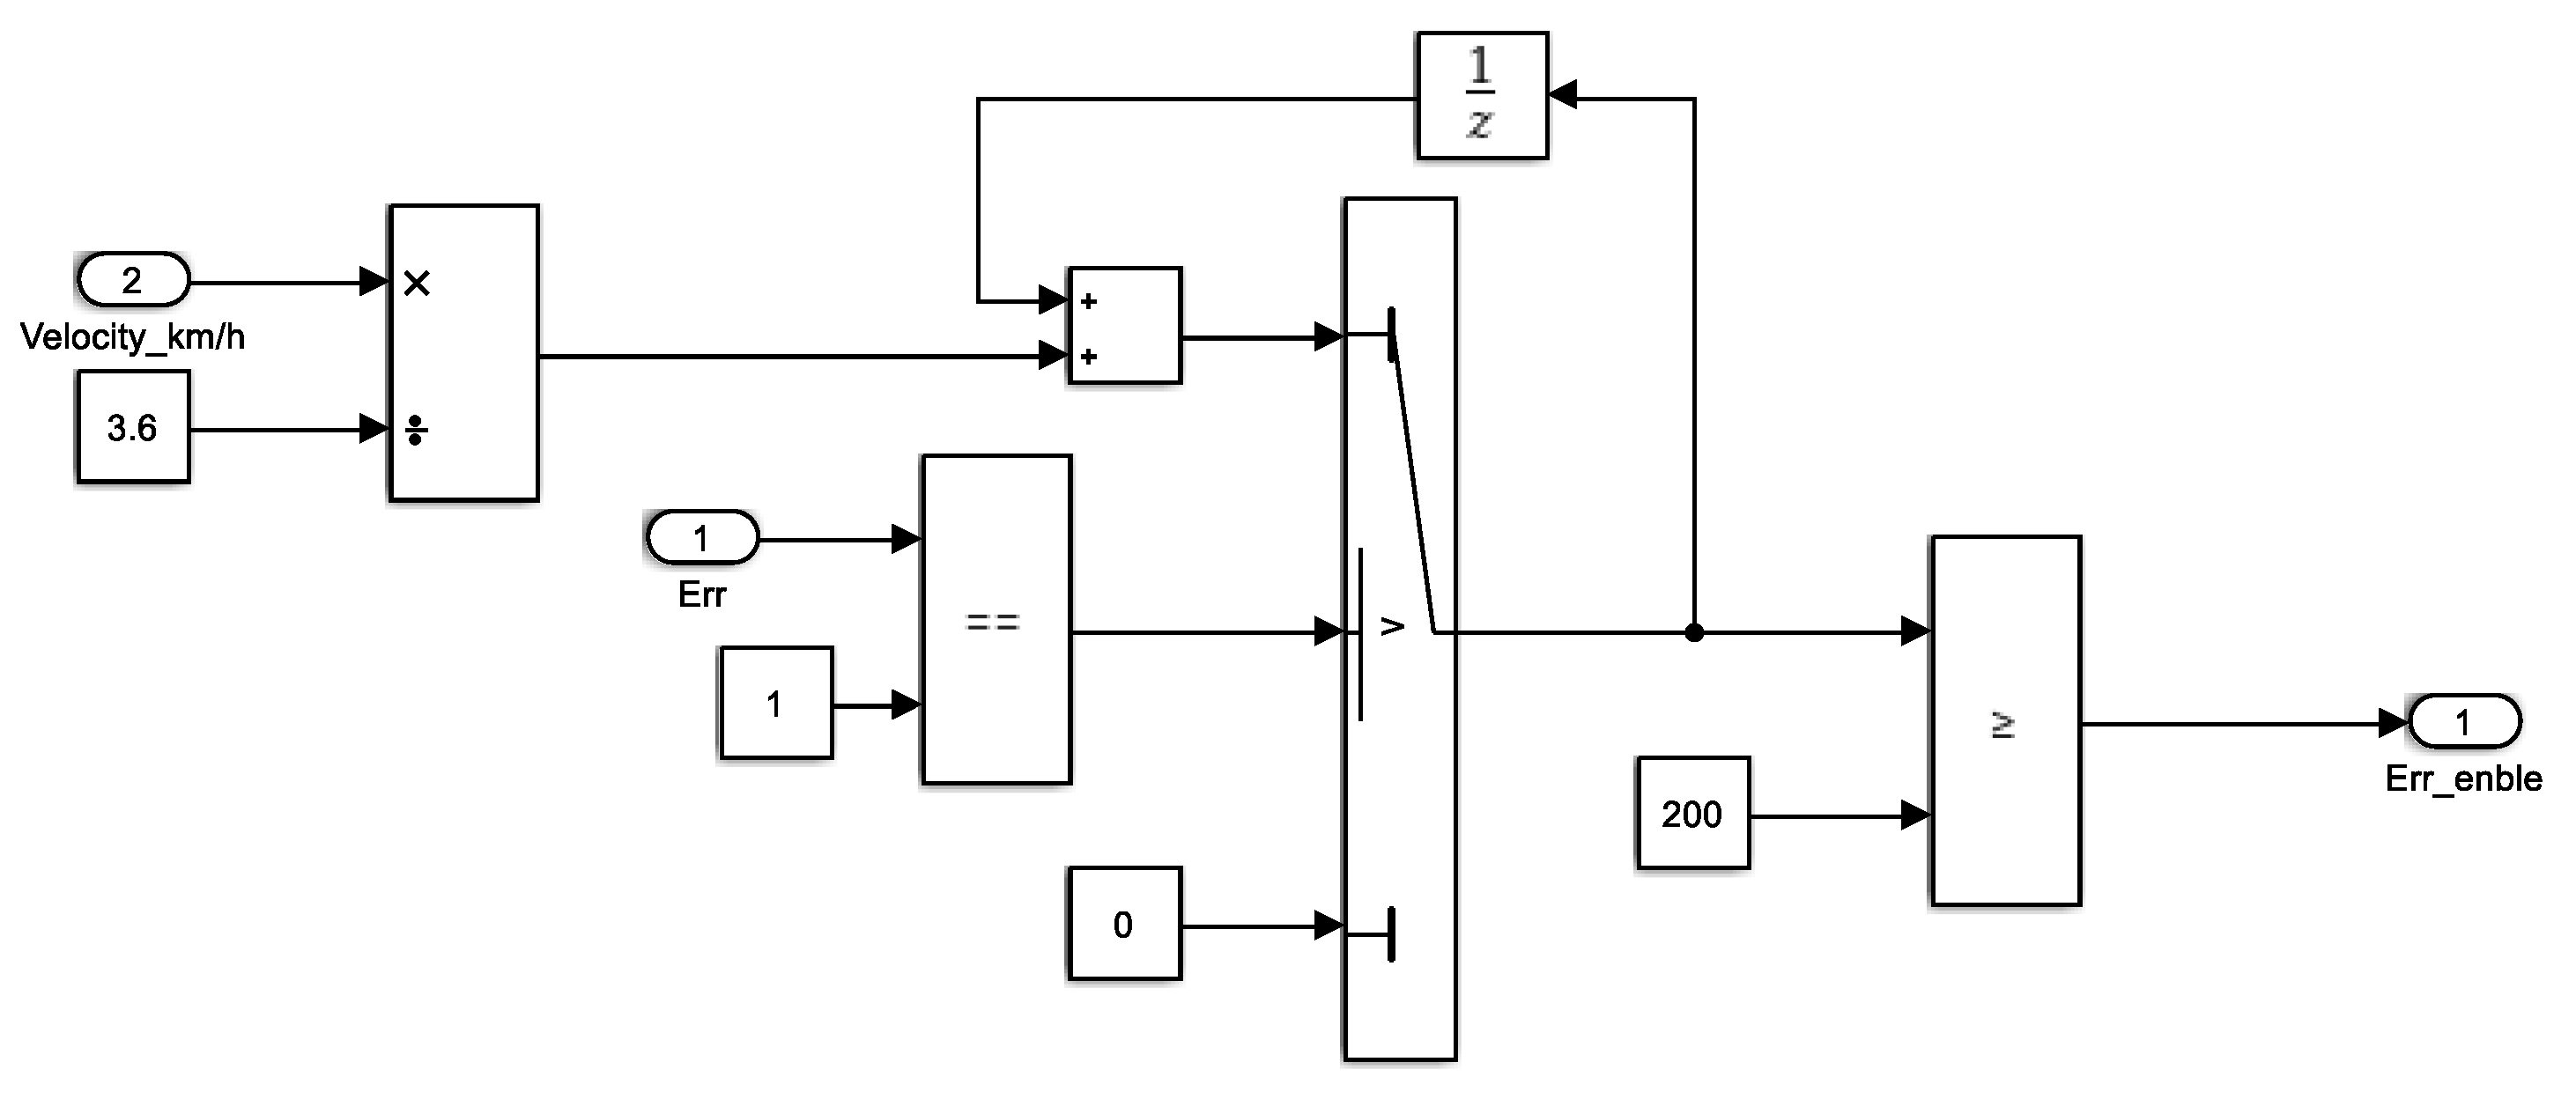
4.5. Implementation of Fault Handling
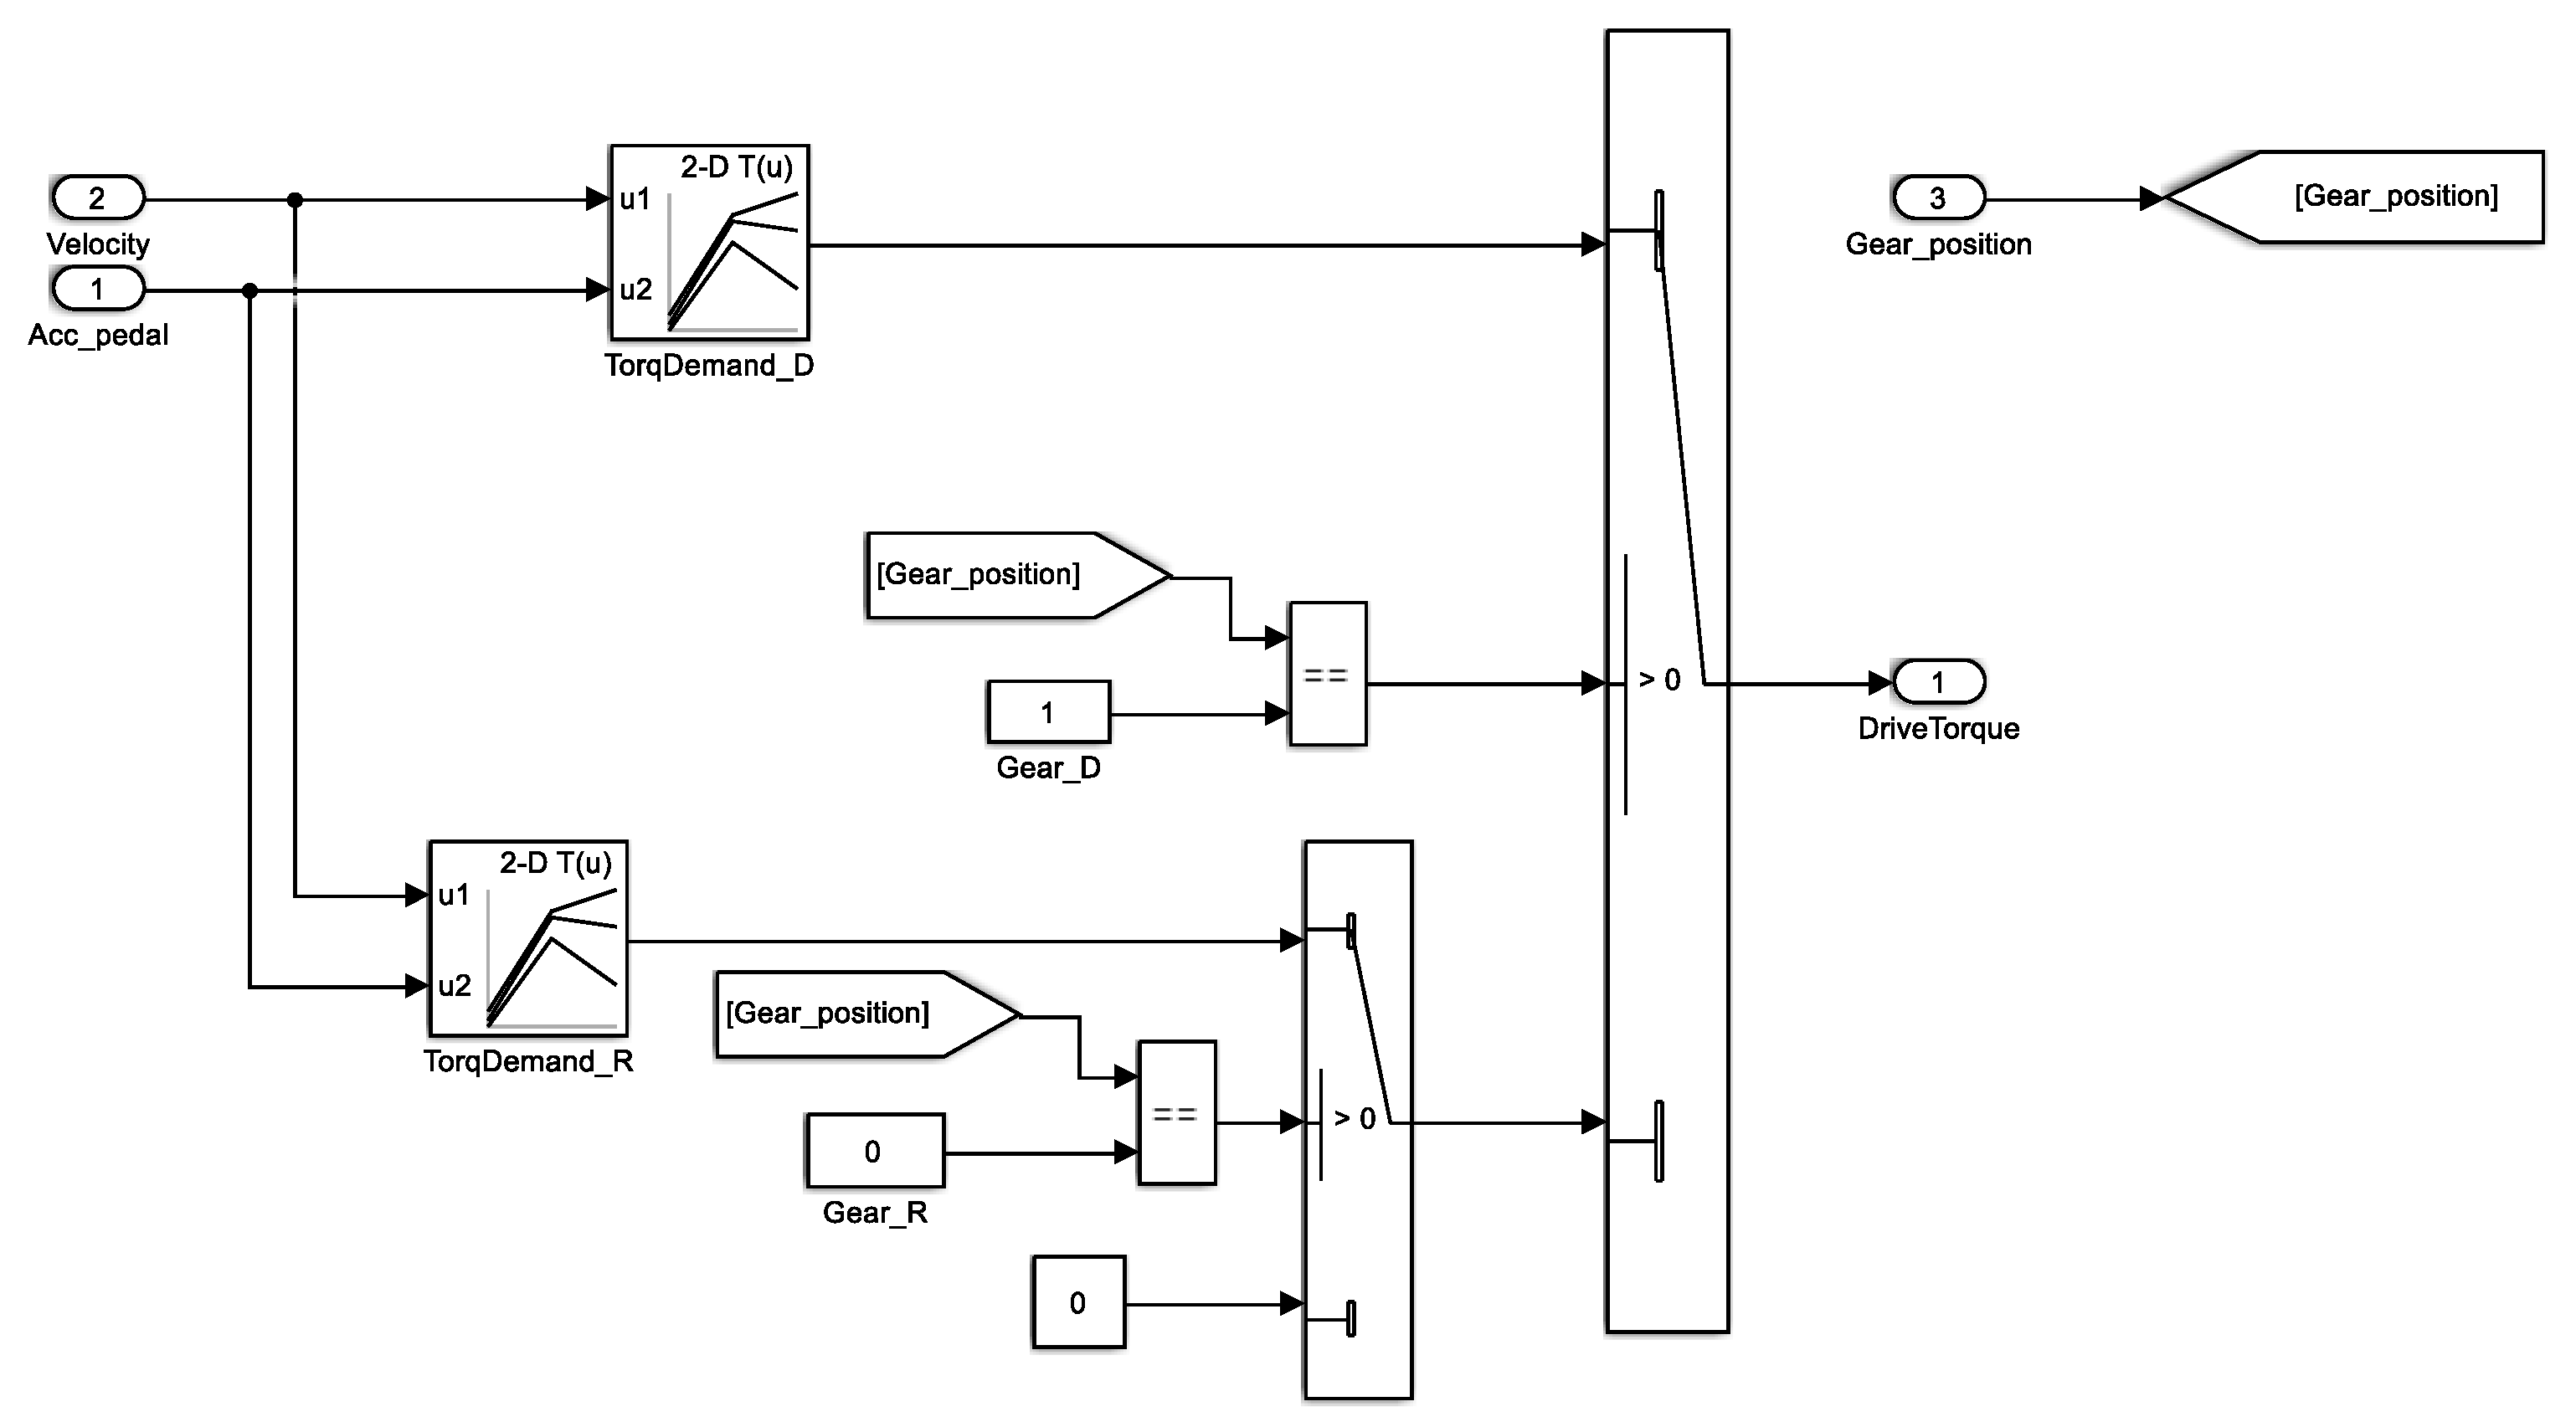
4.6. Implementation of Drive Control
4.7. Implementation of Braking Energy Recovery
5. Analysis of Simulation Results
6. Performance Test
6.1. Maximum Speed Test
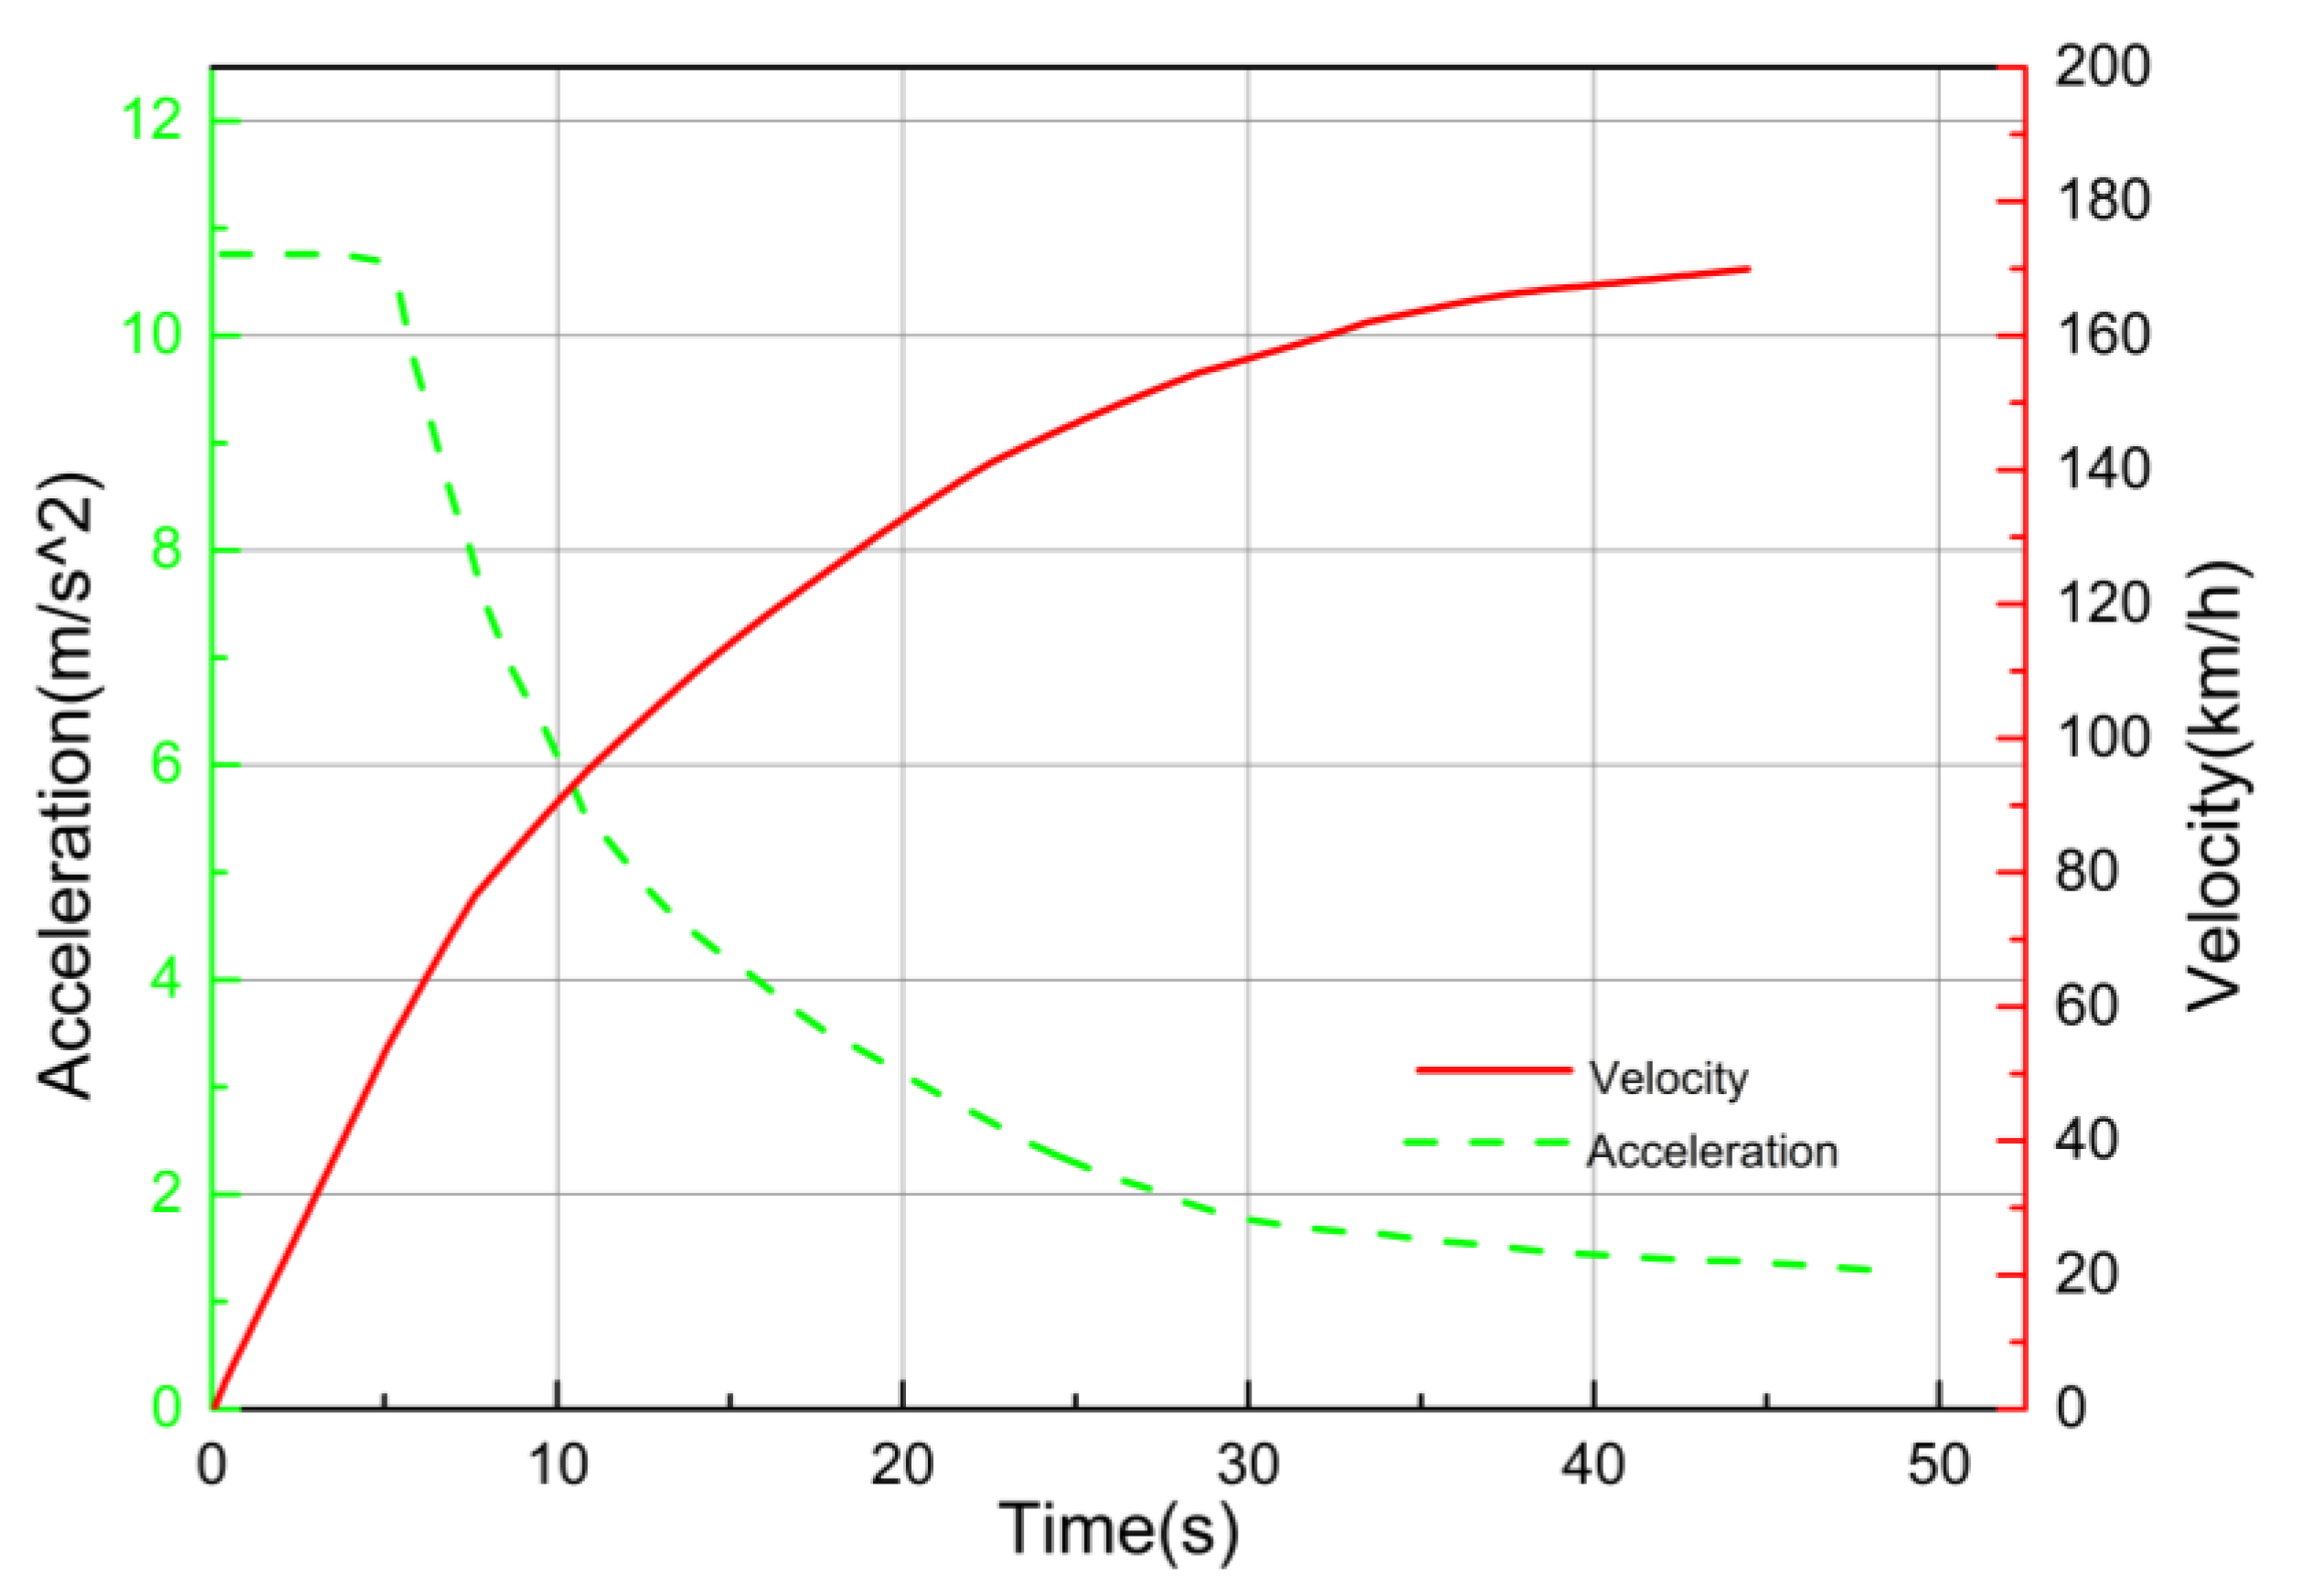
6.2. Acceleration Test
7. Theoretical Calculation of Dynamic Performance
8. Analysis of Dynamic Performance
9. Analysis of Economy
10. Conclusions
- (1)
- According to the power demand of the whole vehicle, to enhance the accuracy of dynamic parameters of mini−electric trucks, combining the characteristics of mini trucks, the parameters of the driving motor, power battery, and the transmission ratio of the main reducer are designed using the automobile theory and the types of drive motors and power batteries are selected, the dynamic model of mini−electric trucks is established.
- (2)
- The vehicle control strategy including how working condition switching is developed according to the work conditions of mini−electric trucks, and the control strategy model is built using the simulation software, and the realization method of each function of the control strategy and the realization process of each function are analyzed.
- (3)
- According to the matched parameters of the power system, the power performance is calculated theoretically.
- (4)
- The dynamic performance is analyzed through the simulation results were compared with theoretical calculation and performance tests results respectively, the comparison results show an error rate of maximum speed, acceleration time and maximum gradient between simulation results and test results are 0.641% and 5.63% (15.328%), respectively, the dynamic index have reached the expected value, it proves that the design method of dynamic parameters is reasonable, and the dynamic performance is analyzed through co−simulation, endurance mileage is up to 295 Km under UDC conditions, increased by 5% after the vehicle control strategy adopted. The economy is improved. It has practical guiding significance for the power system design of mini−electric trucks.
Author Contributions
Funding
Data Availability Statement
Conflicts of Interest
References
- Yang, G. Development trend of mini truck products. Automob. Parts 2016, 21, 52–53. [Google Scholar]
- Lu, Y.; Liu, L. Risk identification and prevention of vertical fresh e-commerce logistics supply chain operation. J. Commer. Econ. 2023, 6, 88–89. [Google Scholar]
- Ma, R.C. Study on the construction of cross-border e-commerce logistics service system in the new retail era. Trade Fair Econ. 2023, 4, 58–60. [Google Scholar]
- Jiang, D.L.; Song, L.Y.; Wang, L. Analysis on Impact of Energy Consumption and Carbon Emission of New Energy Vehicles Based on GREET Software. Automob. Appl. Technol. 2022, 47, 15–21. [Google Scholar]
- Han, J. China’s new energy vehicle development present situation and explored. Auto Time 2019, 15, 75–76. [Google Scholar]
- Zhu, J. Development prospects of new energy vehicles. Auto Time 2021, 17, 75–76. [Google Scholar]
- Zhai, J.X.; Liu, X.M.; Li, C.D.; Yang, X.J. Matching design of power system of pure electric truck. Heavy Truck 2022, 5, 15–17. [Google Scholar]
- Li, X. Debate on development route of pure electric vehicle. Commer. Automob. News 2018, 9, 26–29. [Google Scholar]
- Guo, D.; Zhang, H.H.; Zheng, C.Y. Future development forecast of Chinese automobile and benefits analysis of energy saving and emission reduction. Syst. Eng. Theory Pract. 2016, 36, 7–11. [Google Scholar]
- Lin, X.; Feng, Q.; Mo, L.; Li, H. Optimal adaptation equivalent factor of energy management strategy for plug-in CVT HEV. Proc. Inst. Mech. Eng. Part D J. Automob. Eng. 2019, 233, 877–889. [Google Scholar] [CrossRef]
- Ritari, A.; Vepsäläinen, J.; Kivekäs, K.; Tammi, K.; Laitinen, H. Energy consumption and lifecycle cost analysis of electric city buses with multispeed gearboxes. Energies 2020, 13, 2117–2124. [Google Scholar] [CrossRef]
- Qu, J.Y.; Liu, D.C. Parameter Matching and Simulation of Pure Electric Bus Power System. Bull. Sci. Technol. 2022, 38, 93–97. [Google Scholar]
- Prochazka, P.; Pazdera, I.; Vorel, P. Design of Small Electric Car. In Proceedings of the International Symposium on Power Electrical Drives, Automation and Motion, Anacapri, Capri Island, Italy, 11–13 June 2018; pp. 359–364. [Google Scholar]
- Kim, J. Optimal power distribution of front and rear motors for minimizing energy consumption of 4-wheel-drive electric vehicles. Int. J. Automot. Technol. 2016, 17, 319–326. [Google Scholar] [CrossRef]
- Yang, G.; Zhang, A.; Li, S.; Wang, Y.; Wang, Y.; Xie, Q.; He, L. Multi-objective evolutionary algorithm based on decision space partition and its application in hybrid power system optimization. Appl. Intell. 2017, 46, 827–844. [Google Scholar] [CrossRef]
- Qin, D. Dynamic Drive Control Strategy for Pure Electric Vehicle Based on Driver Intention Recognition. Automot. Eng. 2015, 37, 26–32. [Google Scholar]
- Lian, J.; Li, L.H.; Liu, X.Z.; Huang, H.; Zhou, Y.; Han, H. Research on adaptive control strategy optimization of hybrid electric vehicle. J. Intell. Fuzzy Syst. 2016, 30, 2581–2592. [Google Scholar] [CrossRef]
- Boukehili, A.; Zhang, Y.T.; Zhao, Q.; Ni, C.Q.; Su, H.F.; Huang, G.J. Hybrid Vehicle Power Management Modeling and Refinement. Int. J. Automot. Technol. 2012, 13, 987–998. [Google Scholar]
- Niu, J.G.; Xu, C.H.; Niu, D.T.; Pei, F.L. Comparison of regular energy management strategies for extended range electric vehicles. J. Jiangsu Univ. (Nat. Sci. Ed.) 2018, 39, 266–272+295. [Google Scholar]
- Liu, H.W.; Lei, Y.L.; Fu, Y.; Li, X.Z. Parameter matching and optimization for power system of range-extended electric vehicle based on requirements. Proc. Inst. Mech. Eng. Part D–J. Automot. Eng. 2020, 234, 3316–3328. [Google Scholar] [CrossRef]
- Li, Z.Y. Energy Recovery of Electric Vehicle Base on NEDC Cycle. Automob. Appl. Technol. 2021, 46, 1–4. [Google Scholar]
- Ma, J.A. Parameter matching study for power system of electric sweeping vehicle based on AVL CRUISE. Int. J. Electr. Hybrid Veh. 2020, 12, 144–157. [Google Scholar]
- Yu, Z. Automobile Theory; Machinery Industry Press: Beijing, China, 2009. [Google Scholar]
- Zhao, Y.Q.; Lin, F. Automotive System Dynamics; Science Press: Beijing, China, 2017. [Google Scholar]
- Xu, Z. Driving scheme analysis and parameter matching of a pure electric vehicle based on AVL CRUISE. Automob. Pract. Technol. 2019, 23, 41–45. [Google Scholar]
- You, Y.; Sun, D.Y.; Qin, D.T.; Wu, B.Z.; Feng, J.H. A new continuously variable transmission system parameters matching and optimization based on wheel loader. Mach. Mach. Theory 2020, 150, 103876. [Google Scholar]
- Kui, H.L.; Wang, Z.Z.; Zhang, J.Z.; Liu, Y. Transmission ratio and energy management strategy of fuel cell vehicle based on AVL-Cruise. J. Jilin Univ. (Eng. Technol. Ed.) 2022, 52, 2119–2129. [Google Scholar]
- Guo, H.L.; Kong, W.S.; Yan, Y.C.; Chen, F.; Zhang, C.Z. Parameter Matching Analysis of Energy-Saving Vehicle Power System Based on AVL-Cruise. Agric. Equip. Veh. Eng. 2022, 60, 44–49. [Google Scholar]
- Tian, Y.; Yao, Q.; Hang, P.; Wang, S. Adaptive Coordinated Path Tracking Control Strategy for Autonomous Vehicles with Direct Yaw Moment Control. Chin. J. Mech. Eng. 2022, 35, 1. [Google Scholar] [CrossRef]
- Gong, C.Z.; Wu, D.; Yu, Y.; Zhang, Y. Research on Power Performance Test and Data Analysis Method of Electric Vehicle. China Auto 2022, 12, 44–52. [Google Scholar]
- Jiang, Z. Control System Modeling and Simulation-Analysis and Implementation Based on MATLAB/Simulink; Tsinghua University Press: Beijing, China, 2020. [Google Scholar]
- Wang, Z.; Zang, L.G.; Jiao, J.; Mao, Y.L. Research on Hierarchical Control Strategy of Automatic Emergency Braking System. World Electr. Veh. J. 2023, 14, 97. [Google Scholar] [CrossRef]
- Agyeman, P.K.; Tan, G.F.; Alex, F.J.; Valiev, F.J.; Owosu-Ansah, P.; Olayode, I.O.; Hassan, M.A. Parameter Matching, Optimization, and Classification of Hybrid Electric Emergency Rescue Vehicles Based on Support Vector Machines. Energies 2022, 15, 7071. [Google Scholar] [CrossRef]
- Liao, Y.T.; Wu, L.; Hou, T.T. Comparative Study on Battery Electric Vehicles and Fuel Vehicles. Automot. Eng. 2021, 28, 40–44. [Google Scholar]
- Zhai, X.Z.; Han, T.Q. Analysis of Economic and Power Performance of Electric Vehicle Based on Cruise–Carsim Joint Simulation. J. Hubei Univ. Automot. 2021, 35, 40–43+80. [Google Scholar]


| Items | Length/Width/Height (mm) | Curb Weight (kg) | Max Total Mass (kg) | Air Resistance Coefficient | Windward Area (m2) | Rolling Radius (m) | Rolling Resistance Coefficient | Transmission Efficiency (%) |
|---|---|---|---|---|---|---|---|---|
| Index | 4995/2050/1900 | 1185 | 2505 | 0.8 | 2.5 | 0.301 | 0.016 | 94 |
| Performance Indicators | Maximum Speed | Maximum Climbable Gradient | Acceleration Time | Endurance Mileage | |
|---|---|---|---|---|---|
| 0–50 km/h | 0–100 km/h | ||||
| Value of parameter | 180 km/h | 35% | 6 s | 14 s | 280 |
| Parameters | Rated Power (kW) | Peak Power (kW) | Rated Torque (N∙m) | Peak Torque (N∙m) | Rated Speed (r/min) | Peak Speed (r/min) | Rated Voltage (V) | Efficiency (%) |
|---|---|---|---|---|---|---|---|---|
| Value | 80 | 240 | 90 | 240 | 3000 | 10,000 | 320 | 0.9 |
| Items | Battery Type | Nominal Voltage | Capacity | Max Continuous Charging/Discharge Current | Max Transient Charging/Discharge Current | Monomer Mass | Cyclic-Life (80%) |
|---|---|---|---|---|---|---|---|
| Index | Lithium iron phosphate | 3.2 V | 50 Ah | 15 A/50 A | 50 A/50 A | 1.5 kg | 2000 times |
| Serial Number | Direction | Driving Distance (m) | Time (s) | Average Speed (km/h) |
|---|---|---|---|---|
| 1 | Positive | 1000 | 19.37 | 185.86 |
| 2 | Reverse | 1000 | 19.37 |
| Serial Number | Direction | Time (s) | Average Time (s) |
|---|---|---|---|
| 1 | Positive | 4.95 | 4.965 |
| 2 | Reverse | 4.98 |
| Serial Number | Direction | Time (s) | Average Time (s) |
|---|---|---|---|
| 1 | Positive | 13.692 | 13.688 |
| 2 | Reverse | 13.685 |
| Maximum Speed (km/h) | Acceleration Time from 0 to 50 km/h (s) | Acceleration Time from 0 to 100 km/h (s) | Maximum Gradient (%) | |
|---|---|---|---|---|
| Simulation results | 187 | 4.7 | 11.59 | 40.34 |
| Theoretical calculation results | 186.69 | — | — | 39.8 |
| Test results | 185.8 | 4.965 | 13.688 | — |
| Error rate (%) between simulation results and theoretical calculation results | 0.166 | — | — | 1.35 |
| Error rate (%) between simulation results and test results | 0.641 | 5.63 | 15.328 | — |
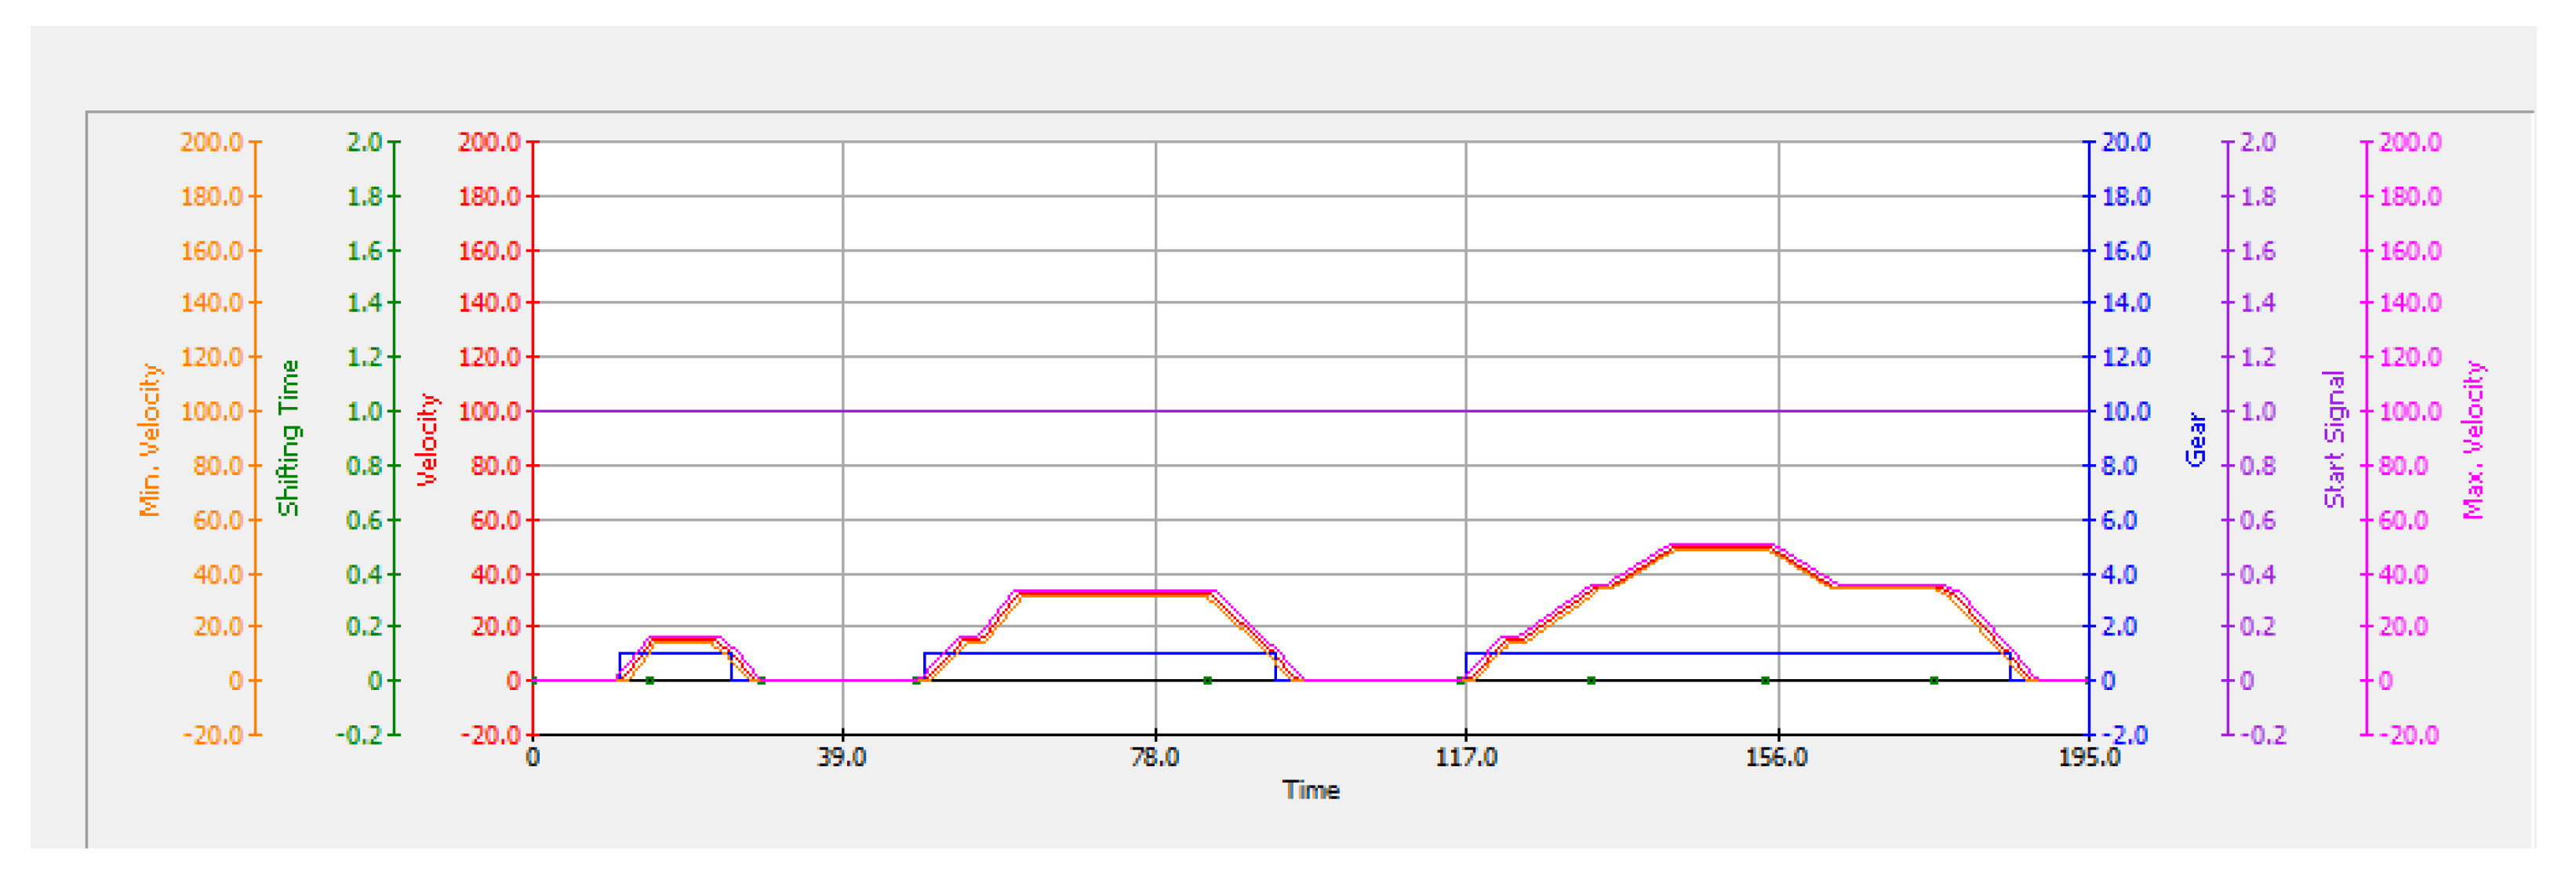
| Time (s) | Signal status | Mode |
|---|---|---|
| 0–12 | err_flg = 0; BPS_Brake_Enble = 1; APS_Brake_Enble = 0 | Neutral |
| 13–28 | err_flg = 0; APS_Brake_Enble = 0; Gear_position = 1; Acc_pedal = 1 | Motor drive |
| 29–32 | BPS_Brake_Enble = 1; Gear_position = 0; Acc_pedal = 0 | Brake energy recovery |
| 32–45 | err_flg = 0; BPS_Brake_Enble = 1; APS_Brake_Enble = 0 | Neutral mode |
| 45–74 | err_flg = 0; APS_Brake_Enble = 0; Gear_position = 1; Acc_pedal = 1 | Motor drive mode |
| 74–82 | err_flg = 0; BPS_Brake_Enble = 1; Gear_position = 0; Acc_pedal = 0 | Brake energy recovery |
| 82–117 | err_flg = 0; BPS_Brake_Enble = 1; APS_Brake_Enble = 0 | Neutral |
| 117–154 | err_flg = 0; APS_Brake_Enble = 0; Gear_position = 1; Acc_pedal = 1 | Motor drive |
| 160–165 | err_flg = 0; BPS_Brake_Enble = 1; APS_Brake_Enble = 0 | Neutral |
| 165–175 | err_flg = 0; APS_Brake_Enble = 0; Gear_position = 1; Acc_pedal = 1 | Motor drive |
| 175–188 | err_flg = 0; BPS_Brake_Enble = 1; Gear_position = 0; Acc_pedal = 0 | Brake energy recovery |
Disclaimer/Publisher’s Note: The statements, opinions and data contained in all publications are solely those of the individual author(s) and contributor(s) and not of MDPI and/or the editor(s). MDPI and/or the editor(s) disclaim responsibility for any injury to people or property resulting from any ideas, methods, instructions or products referred to in the content. |
© 2023 by the authors. Licensee MDPI, Basel, Switzerland. This article is an open access article distributed under the terms and conditions of the Creative Commons Attribution (CC BY) license (https://creativecommons.org/licenses/by/4.0/).
Share and Cite
Ma, J.; Gu, F.; Feng, Z.; Zhang, S. Parameter Matching of Power Systems and Design of Vehicle Control Strategies for Mini-Electric Trucks. World Electr. Veh. J. 2023, 14, 207. https://doi.org/10.3390/wevj14080207
Ma J, Gu F, Feng Z, Zhang S. Parameter Matching of Power Systems and Design of Vehicle Control Strategies for Mini-Electric Trucks. World Electric Vehicle Journal. 2023; 14(8):207. https://doi.org/10.3390/wevj14080207
Chicago/Turabian StyleMa, Jianwei, Fengyi Gu, Ziliang Feng, and Shaohang Zhang. 2023. "Parameter Matching of Power Systems and Design of Vehicle Control Strategies for Mini-Electric Trucks" World Electric Vehicle Journal 14, no. 8: 207. https://doi.org/10.3390/wevj14080207
APA StyleMa, J., Gu, F., Feng, Z., & Zhang, S. (2023). Parameter Matching of Power Systems and Design of Vehicle Control Strategies for Mini-Electric Trucks. World Electric Vehicle Journal, 14(8), 207. https://doi.org/10.3390/wevj14080207