Article

Assessing the Impacts of Electric Vehicle Penetration in Curaçao’s Power Network

by
Geolain Robles-Lozano
1,
Sergio D. Saldarriaga-Zuluaga
2,
Carlos D. Zuluaga-Ríos
2,
Jesús M. López-Lezama
3,* and
Nicolás Muñoz-Galeano
3
1
Faculty of Engineering, University of Curaçao, 111 Jan Noorduynweg, Willemstad, Curacao
2
Departamento de Eléctrica, Facultad de Ingeniería, Institución Universitaria Pascual Bravo, Calle 73 No. 73A-226, Medellin 050036, Colombia
3
Research Group on Efficient Energy Management (GIMEL), Department of Electrical Engineering, Universidad de Antioquia (UdeA), Medellin 050010, Colombia
*
Author to whom correspondence should be addressed.
World Electr. Veh. J. 2023, 14(8), 231; https://doi.org/10.3390/wevj14080231
Submission received: 1 August 2023 / Revised: 14 August 2023 / Accepted: 16 August 2023 / Published: 21 August 2023

Abstract

:
Electric vehicles (EVs) have gained considerable attention in the last decade due to a paradigm shift in the transport sector driven by a higher awareness of environmental issues. While the importance of EVs cannot be overstated in the context of the global climate crisis, it does raise the question of whether certain countries or states are ready for their implementation. It is, therefore, necessary to analyze the impact of EVs in the power grids of these countries and states, considering factors such as line congestion and the eventual degradation of voltage profiles, to determine their hosting capacity and assess eventual expansion options. This paper proposes a representative prototype of Curaçao’s electrical system, which is used for assessing the impacts of EVs, allowing us to determine its hosting capacity. Curaçao is an island in the southern Caribbean Sea that uses fuel generators, wind energy, and solar energy to generate electricity. The idea behind this paper is to analyze the effects caused by an increase in EVs on Curaçao’s power grid and propose preventive measures to deal with such problems. Eight EV charging stations were considered, one DC super fast-charging station, three normal DC fast-charging stations, and four AC fast-charging stations. In 2022, there were an estimated 82,360 vehicles on the island. Using this information, this paper analyzes how many vehicles can be simultaneously connected to the grid before it no longer operates under acceptable values. The results showed that 3.5% of the total vehicles can be hosted by the grid. Nonetheless, this can be increased up to 4.5% with the reinforcement of a transmission line.

1. Introduction

Transportation means have revolutionized the way people travel and connect around the world. Since their invention, combustion engine vehicles (CEVs) have made it possible to transport goods and people quickly and efficiently over vast distances. Nonetheless, they have also been a major contributor to air and noise pollution. The exhaust emissions from CEVs have been linked to a range of health and environmental problems [1]. According to [2], a report conducted by the European Union as of 2022, 76.7 % of CO 2 emissions are caused by road transportation; of this portion, 59.5 % of the total road CO 2 emissions are caused by cars, and this sector is almost entirely dependent on fossil fuels [3]. This is one of the reasons that led to an increase in the popularity of electric vehicles (EVs) in recent years, even leading some CEVs manufacturers to produce and promote them. Likewise, several countries have encouraged the proliferation of EVs through policies and economic aid.
The increasing adoption of EVs has the potential to significantly impact the power grid. While the widespread use of EVs would decrease greenhouse gas emissions and improve air quality, it would also increase the demand for electricity [4]. This demand may cause congestion on the power grid during peak charging times, leading to grid instability and potential blackouts. Nevertheless, the impact of EVs on the power grid can be mitigated through smart charging and vehicle-to-grid (V2G) technology. Smart charging ensures that EVs charge during off-peak hours, when electricity demand is lower, while V2G technology allows EVs to send power back to the grid during periods of high demand [5]. This technology can help balance the grid and improve its resilience, as well as enable greater integration of renewable energy sources [6]. As EV adoption continues to increase, it becomes important for the power industry to explore innovative solutions to ensure a reliable and sustainable grid. Some of the already studied topics are voltage deviation, power system losses, increase in peak demand, overloads, and harmonics [7,8,9].
Several studies have been carried out in the specialized literature to evaluate the impacts of EVs in modern power systems. The authors in [10] consider the effect of several EV penetration levels on power losses, voltage stability, reliability indices, and economic losses in distribution networks. However, the study only focused on the location of charging stations to ameliorate the aforementioned impacts. If an increased amount of EVs connects to an electricity distribution grid, it may cause problems to the system such as branch congestion and voltage drops. Distribution grids are designed to accommodate an expected load level; nonetheless, if a lot of EVs are simultaneously connected, the system security can be compromised and the grid might not be able to return to normal values before greater damage is caused [11]. In [12], the authors present a sensitivity analysis using Monte Carlo simulation to evaluate the effects of high EV penetration levels. The authors consider several aspects such as types of chargers, driving patterns, types of EVs, grid configuration, EVs placement, and load duration curve. Despite proposing a complete analysis, they do not take into account the voltage levels in the network and do not propose improvement strategies for the aspects mentioned above. In [13], a study is carried out to analyze how private EVs may affect residential electricity prices in Germany, and it is shown that EVs can reduce electricity prices for households. Nonetheless, the study lacks strategies to ameliorate the power grid impacts caused by EVs. Rahman et al., in [14], presented a comprehensive review and impact analysis of integrating the projected EV charging load into low-voltage distribution systems. The authors analyzed the voltage profile in these grids as the penetration levels of EVs increased. They also evaluated the impact of EV charging on load curves and discussed strategies implemented to optimize grid performance with EV charging load such as peak load management in load curves, increased renewable energy penetration, and ancillary services by EVs to improve the grid stability. Despite analyzing the voltage profile at the distribution system nodes, which is an important element in the operation of these systems, the authors do not discuss strategies by which to mitigate the impacts of EVs.
There are several approaches for modeling the penetration levels of EVs in power distribution networks. These modeling methodologies can be categorized into three main groups: deterministic approaches, data-driven approaches, and uncertainty-based approaches [15]. Regarding the first group, the authors in [16] use measurement-based load modeling approaches to estimate the load model for EV fast-charging stations. In this case, a ZIP-based approach is employed to model the penetration of EVs in AC distribution grids. The second group includes machine learning-based methods such as k-nearest neighbors [17], linear regression [18], and random forest [19] in order to model the interaction of EVs with power systems. Essentially, data-driven methods manipulate large blocks of data to model underlying realistic EV charging behaviors. The final and third group includes all the methodologies that are based on dealing with the random behaviors of EV users. Within this group, we can find the use of different probability distributions (Gaussian [20], Weibull [21], or lognormal [22] distributions), stochastic processes [23], and Monte Carlo simulation-based approaches [12]. All three of these major approaches have presented novel modeling methodologies for assessing the impacts of EVs within distribution networks. However, data-driven and uncertainty-based methods require large amounts of data to be conclusive in modeling EV penetration, and they are computationally expensive. For these two reasons, polynomial-based load models (ZIP-based methodologies) can be an attractive alternative with which to analyze the impact of EVs on distribution networks.
In many studies regarding EVs impacts on power systems, the type of charger is a topic often overlooked. While most studies concentrate on overall EV load, the charger categories, which range from slow AC chargers to DC fast chargers, have a substantial influence on the grid dynamic. EV chargers consist mainly of power electronic converters, which can behave differently in comparison to traditional loads in a power system [24]. There are three known charging methods: battery exchange, conductive charging, and inductive charging [25]. Conductive charging occurs when the vehicle is connected directly to the power system using a charger. Inductive charging uses magnetic fields to transfer power through the air gap between the coil in the ground and the coil in the vehicle [26]. The last charging method is battery exchange or battery swapping, which involves replacing the discharged battery with a charged one [27]. In this paper, only conductive charging is considered; moreover, the discussion is approached using voltage profiles and conductor chargeability as elements of analysis. For the above purpose, a ZIP load modeling strategy was considered for the EV charging station’s representation based on the information employed in [24]. Note that ZIP load models can be used in both static and dynamic studies; moreover, AC and DC fast-charging stations were considered using the aforementioned modeling. These types of charging stations are analyzed since they have been proven to have the greatest impact on power systems [28].
As the world shifts toward sustainable transportation, conducting comprehensive studies on the impacts EVs on power systems has gained increasing importance around the world. These studies provide crucial insights into the challenges and opportunities associated with integrating EVs into existing grids. By analyzing factors such as charging patterns, demand fluctuations, and infrastructure requirements, researchers can guide policymakers and utilities in making informed decisions. Nonetheless, there are states and countries where these studies have not been carried out due to a variety of factors. This paper presents an assessment of the impacts of EV penetration in Curaçao’s power network. To the best of the authors’ knowledge, there are no studies regarding the impact of EVs on the island, nor is there a representative prototype of its network with which to carry out these studies. In this sense, this research may lead the way for other detailed studies aiming at promoting the inclusion of EVs on the island. The main features and contributions of this paper are as follows:
  • A representative prototype of Curaçao’s power grid is proposed, the data of which was made available to the academic community to carry out further studies;
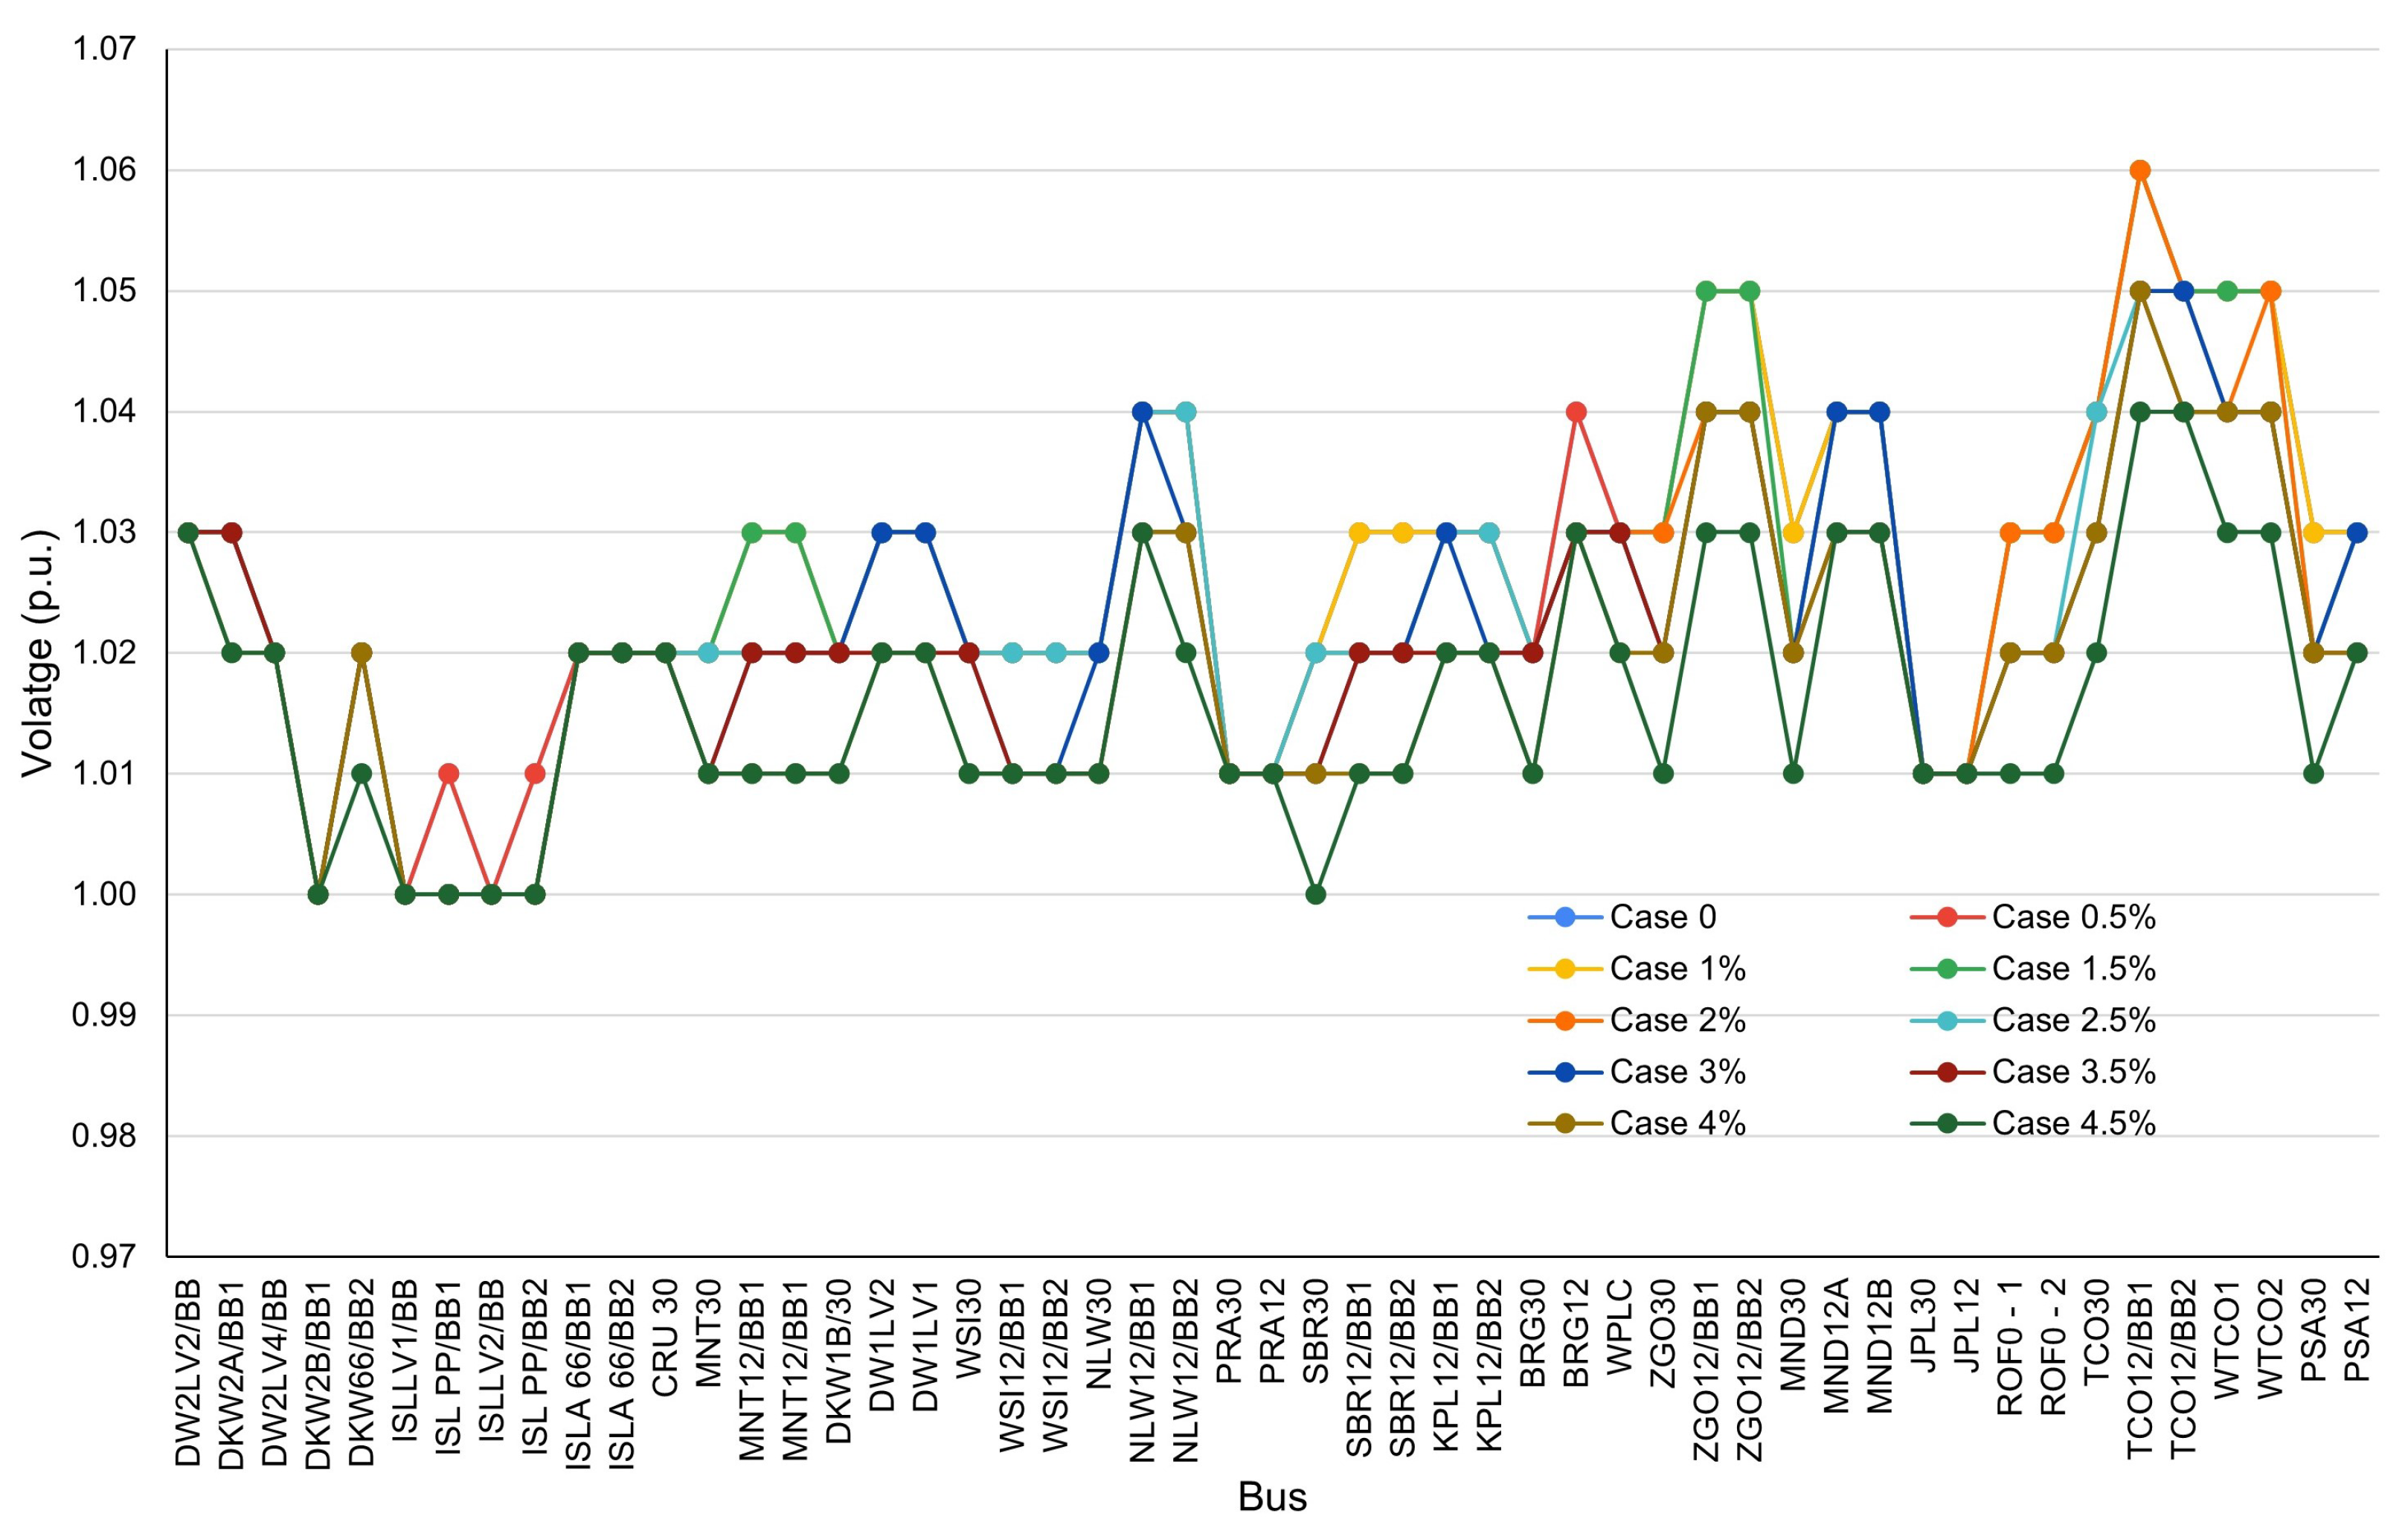
  • The impacts of EVs on line chargeability and voltage profiles are analyzed considering different EV participation scenarios, as well as voltage and chargeability indices;
  • An upgrade of the network is proposed and validated to mitigate the impacts of EVs in the power grid.
This paper is organized as follows. Section 1 presented an introduction to the problem and a brief literature review on studies regarding the impact of EVs in power grids. Section 2 describes the proposed Curaçao’s power grid prototype, which includes the location of EV charging stations. Section 4 presents the assessment of EVs penetration in the network regarding the impact on chargeabililty and voltage profiles; moreover, a solution th which to mitigate such impacts is proposed and validated. Finally, conclusions and suggestions for future work are presented in Section 5.

2. Curaçao’s Electric Power Grid Representation

Curaçao is a Caribbean island located in the southern part of the Lesser Antilles and is a constituent country within the Kingdom of the Netherlands. The island covers an area of approximately 444 square km, with a population of over 164,000 people. The island does not produce significant energy resources, relying heavily on imported energy sources to meet its energy needs. The main energy sources used in Curaçao are oil and natural gas, which are imported and used to generate electricity and for transportation; nonetheless, in recent years, there have been efforts to transition to more sustainable and renewable energy sources, such as wind and solar power, with the aim of reducing the island’s reliance on fossil fuels and decreasing its carbon footprint. The data regarding Curaçao’s power grid are not public; nonetheless, this paper proposes a representative prototype of the power grid for academic purposes based on available information provided in [29].

2.1. Generation

Curaçao’s energy matrix relies mainly on fossil fuel power plants; nonetheless, wind turbines and solar panels also support energy production. The power grid features five power plants, two wind farms, thirteen substations, 321 km of overhead lines, 1354 km of underground cables, and transformers of different capacities. There are also three main power stations connected to 66 kV transmission lines. Aside from these power stations, there are 30 kV substations where the two wind farms are connected. These are later divided into 12 kV substations where aggregated loads are connected.
The peak demand of the island is around 130 MW but changes throughout the year. While the installed capacity is theoretically greater than the peak demand, in some periods, this is still not being reached due to fluctuations in wind farm production or solar panel energy production. There are three main power plants. The first plant is divided into two plants, each with four generators, one (Station 1a) with a power capacity of 35.6 MW and the second (Station 1b) with a power capacity of 39.2 MW. The second (Station 2) has four generators and a power capacity of 33.2 MW. The last (Station 3) consists of seven smaller generators with a total power capacity of 42.8 MW. The first two are connected to a 66.0kV station, while the last is located at a 33.0 kV station. This adds up to 150.8 MW of connected fuel power. Table 1 presents the details of the fuel generators. All of them usually operate at a power factor 0.95 and with a nominal voltage of 11 kV.
After fuel generators, the second energy source is wind power generation. There are three wind turbine parks in Curaçao situated onshore at the windward coast of the island. The first park has five wind turbines with a hub height of 80 m and a rotor of 90 m. Each turbine has a rated power of 3 MW and a rated total power of 15 MW. The second wind park consists of five turbines in total, each with a rated power of 3 MW, 90 m diameter, and a total nominal power of 15 MW. The third park has five turbines, each with a rated power of 3.45 MW, 117 m in diameter, and with a total nominal power of 17.25 MW. There is a total of 46.5 kW under ideal circumstances. The information on wind power generation is provided in Table 2.
There are also five solar parks in Curaçao, adding a total of 14 MW of solar energy that supports the electric network. An estimated 760 PV are installed in Curaçao. Each solar park was modeled with a value of 2.8 MW.

2.2. Transformers

The highest voltage level in Curaçao’s electrical network is 66 kV where two generator plants are installed, and the 11 kV nominal voltage of the power plant is raised to 66 kV. The substation is later divided into eleven 30 kV substations, which are later divided into twelve 12 kV substations and two small 6 kV substations where general loads are connected. In order to make an accurate representation of the transformers, the ATP draw simulation program was used to extract the parameters of the positive sequence impedance. Table 3 presents the parameters of the transformers.

2.3. Buses

All 66 kV and 30 kV substations are connected to double bus systems, and the second fuel plant is connected to a double bus system with a tie-breaker. All 12 kV sub-stations are single buses with a tie-breaker, and the small stations of 6 kV are two single buses. The wind farms are all connected to a 1 kV single bus. Table 4 provides information on the system buses. All buses are connected in an ABC-N connection.

2.4. Underground Lines

Curaçao’s electricity is transported via 132 km of low-voltage overhead and around 1352 km of underground cables for high voltage. All the transmission lines were modeled in DigSILENT using underground cables already available in the simulation program library, while the distances of the lines were estimated using Google Maps. There are mainly two types of cables used, which are specified in Table 5.

2.5. Aggregated Loads

The peak demand in Curaçao is around 130 MW. In order to allocate the loads at each substation, the Geo-zone data of the latest census available at the Central Bureau of Statistics was used. With the number of people per Geo-zone and the available peak demand, an approximation of the aggregated demand at each substation was implemented. For each 12 kV substation, there are two general loads connected; therefore, the total demand for each station is divided into two. Table 6 illustrates how the total peak demand was allocated in the 13 substations.
After distributing the loads at the substation, capacitor banks that are already installed were used to achieve a voltage magnitude of 1.0 p.u. at each substation. This was undertaken in order to ascertain precisely the effect of the increase in EV demand on the electric system. Figure 1 depicts the one-line diagram of the test grid that will be used in this study.

3. Methodology to Assess the Effect of EVs

3.1. Charging of EVs

EV chargers convert the alternating current from the grid to direct current through power converters [30]. Two types of converters are used for these vehicles, the onboard and the off-board converter. The onboard EV charger is, as its name suggests, embedded in the vehicle. The AC/DC converter is therefore dependent upon the dimensions of the vehicle, causing the conversion rate to be slower. On the other hand, the AC/DC conversion for the off-board EV charger occurs outside the vehicle, injecting DC directly into the EV battery. Since the converters are not limited to the vehicle’s dimensions, the efficiency rate is greater, which reduces the time needed to charge the batteries [31]. There are three charging methods:
  • Level 1 or AC trickling charging;
  • Level 2 or AC fast charging;
  • Level 3 or DC fast charging.
Levels 1 and 2 use the onboard charger and level 3 uses the off-board charger. Level 1 charging uses the onboard charger and is the only method that does not require any additional installation; the EV is connected directly to the existing household installation [32]. It is typically rated up to 3 kW, and the charging can take from 11 to 20 h depending on the type of battery and the state of charge of the battery. Similar to level 1 charging, level 2 charging uses the onboard charger but does require a special installation. It is usually installed in a residential or a working area and is typically rated from 7 kW to 22 kW. The charging time is between 3 to 4 h depending on the previously stated factors. The rated voltage for this type of charging is from 208 V to 240 V. The level 3 charging method is the only type that uses the off-board EV charger. It also needs a special installation but is typically not connected in residences; rather it is connected at a specific area due to the high current and voltage needed, and not every vehicle has the technology for this charging method. This charger delivers between 50 kW to 350 kW depending on the vehicle. Since the AC/DC conversion occurs outside the vehicle, the charging time can vary between 30 to 60 min. Level 3 charging has been shown to cause more impacts on the grid such as voltage deviation, reliability issues, and increased power losses; furthermore, as it increases the demand, it may shorten the lifetime of the network transformers [28]. The main characteristics of the charging stations are presented in Table 7, adapted from [33].

3.2. Load Modeling

In order to properly replicate the characteristics of an EV charging station, ZIP load modeling was employed. These models are described as mathematical representations of the relationship between the power and voltage in a load bus. The ZIP model can be used in both static and dynamic studies, and it represents the relationship between the voltage magnitude and power in a polynomial equation that combines constant impedance (Z), current (I), and power (P) components. Only the active power of the EVs is simulated. The mathematical expression of the polynomial load model is presented in Equation (1). In this case, P 0 stands for the active power when the supply voltage corresponds to 1 p.u.; p 1 , p 2 , and p 3 are model parameters. If they approach 1, it implies that the load behaves as a constant impedance, constant current, or constant power, respectively. The independent parameter V is the per unit supply voltage.
P = P 0 p 1 V ^ 2 + p 2 V ^ + p 3
The parameters of Equation (1) that model each EV charging station are given in Table 8 and were determined via the least-squares method as mentioned in [24].

3.3. Indices for Chargeability and Voltage Assessment

Equations (2) and (3) serve as indices utilized for chargeability and voltage assessment, respectively. Equation (2) defines the chargeability index (CI), which is the weighted sum of the number of lines exceeding 90% chargeability per scenario. In this case, NL and NS indicate the number of lines and scenarios, respectively. On the other hand, Equation (3) defines the voltage index (VI) which, in turn, is the weighted sum of the number of buses with voltage magnitudes lower than 0.9 per unit. In this case, NB indicates the number of buses of the network.
C I = 1 N L · 1 N S i = 1 N L j = 1 N S m a x [ ( f i j 0.9 f i j m a x ) , 0 ]
V I = 1 N B · 1 N S k = 1 N B j = 1 N S m a x [ ( V k j < 0.9 ) , 0 ]

4. Tests and Results

The analysis focused on scenarios of high, medium, and low demand that considered, respectively, 149.81, 104.3, and 74.5 MW. For each scenario, a given percentage of the current vehicle fleet was considered to be EVs and simultaneously connected to the grid. This percentage ranged from 0.5% to 4.5%, with increments of 0.5%. The specific details are presented in Table 9.
Eight EV charging stations were understood to be installed at specific locations of the island, which are illustrated in red in Figure 1. EV station one represents a DC super-fast-charging station. Stations two, three, and four represent normal DC fast-charging stations; finally, the last four ones are AC fast-charging stations. EV stations one to four were connected to 30 kV sub-stations, while the last four were connected to 12 kV sub-stations. A total of nine cases of EV penetration were analyzed for each demand scenario and subsequently compared to the initial state of the system. The aim of the study was to observe the impact of EVs on the voltage profile and load capacity. In order to access the most critical scenario, all EVs were understood to be simultaneously connected to the system.
Figure 2, Figure 3 and Figure 4 illustrate the lines loading for the different cases under consideration. Case 0, indicated in blue, is the base case with no EVs in the network. Note that when no EVs are considered, all transmission lines are way below their transportation limits. Nonetheless, as the percentage of EVs increases, a line becomes overloaded. In this case, the ISLA—Dokweg 2 line exhibited a loading of 140% in the high-demand scenario for an EV penetration of 4.5% (3706 EVs) and 130% for an EV participation of 4% (3294 EVs). In the medium-demand scenario, this line is also overloaded by 115% when the penetration of EVs is 4.5%. Note that this was the only line that presented problems since the network features sufficient transmission capacity in the base case. This is due to the fact that line ISLA—Dokweg 2, links an important amount of generation to the demand of the network, as can be seen in Figure 1.
Table 10 presents the results of the chargeabiliy index defined by Equation (2). The value of this index was zero for all demand scenarios, and EV penetration levels were lower than 3.0%. Note that from 3.5% EV penetration, the chargeabiliy index is different from zero, which indicates that at least one line is operating at more than 90% of its capacity. In this case, it is line ISLA—Dokweg 2, as can be verified in Figure 2. In medium- and low-demand scenarios, this line also surpasses 90% of its chargeabiliy for 4.5% of EV penetration.
Figure 5, Figure 6 and Figure 7 illustrate the voltage profile of the network for different EV penetration levels. Note that voltage levels remained consistently above the threshold of 0.9 p.u., even at maximum EV penetration of 4.5% under a high-demand scenario. This is due to the fact that the lines have sufficient slack to accommodate the new demand and some branches have capacitors at the end of the feeders to help maintain a proper voltage level. In this case, the lowest voltage level was 0.96 p.u. in some buses for the high-demand scenario and 4.5% of EV penetration, as can be seen in Figure 5. Consequently, the voltage index defined in Equation (3) is zero for all cases under study.
According to the presented results, it is important to highlight the following:
  • Curaçao’s network is capable of hosting an EV penetration of up to 3.5% relative to the current vehicle fleet in high-, medium-, and low-demand scenarios;
  • The network is capable of supporting an EV penetration of up to 4% in the medium- and low-demand scenarios;
  • To enable the network to support an EV penetration of 4.5% in all scenarios, it is necessary to carry out some network upgrades.
Several alternatives can be explored in order for the network to be able to accommodate up to 4.5% EV penetration without encountering overloading problems. One of them would be through demand response programs that would allow peak shaving so that the ISLA—Dokweg 2 line is not overloaded. However, this requires a change in the normative as well as an arduous pedagogical and awareness-raising effort on the part of the users. Another solution would be the installation of DG units at the receiving end of the line or directly at the buses where the charging stations are located. In this case, it would be necessary to guarantee that these DG units were able to provide energy at peak demand, which is when the congestion of the line occurs. A third option, and the one explored in this paper, is the installation of an additional line with the same characteristics in parallel to the ISLA—Dokweg 2 line. Once the line is added, load flow simulations are performed again, and it is verified that this time, there are no overloads in any of the scenarios. Figure 8 shows the loadability of the lines in the maximum-demand scenario. It can be seen that the corridor ISLA—Dokweg 2 (two parallel lines with the same characteristics) is below its nominal power, which guarantees system safety. When simulating the percentages of EVs participation in the medium- and low-demand scenarios, it is again verified that there are no overloads in the lines or voltage problems in the nodes. This indicates that the proposed solution is effective.

5. Conclusions

This paper presented a representative prototype of Curaçao’s electrical grid and an assessment of its EV hosting capacity. Several AC and DC fast-charging stations were considered in the study and simulated using DigSILENT Power Factory software through a ZIP load model. The hosting capacity of the network was evaluated by gradually increasing the percentage of EVs that were supposed to be simultaneously connected to the network, using the current number of conventional vehicles on the island as a reference. The analyses carried out showed that around 3.5% of the total vehicle fleet could be simultaneously connected to the grid without compromising the voltage profile or the lines’ transportation limits. As regards this last issue, one line was found to be critical, reaching up to 140% of overloading in the high-demand scenario and 4.5% EV penetration. This drawback was solved by proposing a new line in parallel with the same characteristics. In this case, the new simulations allowed us to verify the effectiveness of the network upgrade. Regarding the voltage profile, it was found that there were no voltage issues for the percentage of EVs evaluated in the network. All voltages remain within acceptable limits in all scenarios and under all EV participation levels considered in the study. Counting with a representative prototype of Curaçao’s network leads the way for future research studies on the impact of EVs in this network. These studies may include stability analyses, assessments of network reliability, and studies on the effects of EVs on the protection coordination system. Furthermore, the interaction of EVs with other distributed energy resources may be explored, along with a strategy for the optimal allocation of charging stations, which comprise the main limitations of this study.

Author Contributions

Conceptualization, G.R.-L., S.D.S.-Z., C.D.Z.-R., N.M.-G. and J.M.L.-L.; Data curation, G.R.-L., S.D.S.-Z., C.D.Z.-R., N.M.-G. and J.M.L.-L.; Formal analysis, G.R.-L., S.D.S.-Z., C.D.Z.-R., N.M.-G. and J.M.L.-L.; Funding acquisition, G.R.-L., S.D.S.-Z., C.D.Z.-R., N.M.-G. and J.M.L.-L.; Investigation, G.R.-L., S.D.S.-Z., C.D.Z.-R., N.M.-G. and J.M.L.-L.; Methodology, G.R.-L., S.D.S.-Z., C.D.Z.-R., N.M.-G. and J.M.L.-L.; Project administration, G.R.-L., S.D.S.-Z., C.D.Z.-R., N.M.-G. and J.M.L.-L.; Resources, G.R.-L., S.D.S.-Z., C.D.Z.-R., N.M.-G. and J.M.L.-L.; Software, G.R.-L., S.D.S.-Z., C.D.Z.-R., N.M.-G. and J.M.L.-L.; Supervision, G.R.-L., S.D.S.-Z., C.D.Z.-R., N.M.-G. and J.M.L.-L.; Validation, G.R.-L., S.D.S.-Z., C.D.Z.-R., N.M.-G. and J.M.L.-L.; Visualization, G.R.-L., S.D.S.-Z., C.D.Z.-R., N.M.-G. and J.M.L.-L.; Writing—original draft, G.R.-L., S.D.S.-Z., C.D.Z.-R., N.M.-G. and J.M.L.-L.; Writing—review and editing, G.R.-L., S.D.S.-Z., C.D.Z.-R., N.M.-G. and J.M.L.-L. All authors have read and agreed to the published version of the manuscript.

Funding

This research was funded by Agencia de Educación Postsecundaria de Medellín—Sapiencia under agreement 723 of 2021 and the project SM202013.

Institutional Review Board Statement

Not applicable.

Informed Consent Statement

Not applicable.

Data Availability Statement

Not applicable.

Acknowledgments

The authors gratefully acknowledge the support from the Agencia de Educación Postsecundaria de Medellín—Sapiencia under agreement 723 of 2021 and the project SM202013. The authors also want to acknowledge to the Institución Universitaria Pascual Bravo for its support through the project SM202013.

Conflicts of Interest

The authors declare that they have no conflict of interest.

References

  1. Sanguesa, J.A.; Torres-Sanz, V.; Garrido, P.; Martinez, F.J.; Marquez-Barja, J.M. A Review on Electric Vehicles: Technologies and Challenges. Smart Cities 2021, 4, 372–404. [Google Scholar] [CrossRef]
  2. European Commission; Directorate-General for Mobility and Transport. EU transport in Figures: Statistical Pocketbook 2022; Publications Office: Brussels, Belgium, 2022. [Google Scholar] [CrossRef]
  3. Gruetzmacher, S.B.; Bento Vaz, C.; Ferreira, A. Sustainability performance assessment of the transport sector in European countries. Rev. Fac. Ing. Univ. Antioq. 2021, 1, 42–52. [Google Scholar] [CrossRef]
  4. Qiu, D.; Wang, Y.; Hua, W.; Strbac, G. Reinforcement learning for electric vehicle applications in power systems: A critical review. Renew. Sustain. Energy Rev. 2023, 173, 113052. [Google Scholar] [CrossRef]
  5. Alsharif, A.; Tan, C.W.; Ayop, R.; Al Smin, A.; Ali Ahmed, A.; Kuwil, F.H.; Khaleel, M.M. Impact of electric Vehicle on residential power distribution considering energy management strategy and stochastic Monte Carlo algorithm. Energies 2023, 16, 1358. [Google Scholar] [CrossRef]
  6. Saberi-Beglar, K.; Zare, K.; Seyedi, H.; Marzband, M.; Nojavan, S. Risk-embedded scheduling of a CCHP integrated with electric vehicle parking lot in a residential energy hub considering flexible thermal and electrical loads. Appl. Energy 2023, 329, 120265. [Google Scholar] [CrossRef]
  7. Gomez, J.; Morcos, M. Impact of EV battery chargers on the power quality of distribution systems. IEEE Trans. Power Deliv. 2003, 18, 975–981. [Google Scholar] [CrossRef]
  8. Tripathi, S.; Singh, V.P.; Kishor, N.; Pandey, A. Load frequency control of power system considering electric Vehicles’ aggregator with communication delay. Int. J. Electr. Power Energy Syst. 2023, 145, 108697. [Google Scholar] [CrossRef]
  9. Yang, Z.; Yang, F.; Min, H.; Tian, H.; Hu, W.; Liu, J. Review on optimal planning of new power systems with distributed generations and electric vehicles. Energy Rep. 2023, 9, 501–509. [Google Scholar] [CrossRef]
  10. Deb, S.; Tammi, K.; Kalita, K.; Mahanta, P. Impact of Electric Vehicle Charging Station Load on Distribution Network. Energies 2018, 11, 178. [Google Scholar] [CrossRef]
  11. Lopes, J.A.P.; Soares, F.J.; Almeida, P.M.R. Integration of electric vehicles in the electric power system. Proc. IEEE 2010, 99, 168–183. [Google Scholar] [CrossRef]
  12. Stiasny, J.; Zufferey, T.; Pareschi, G.; Toffanin, D.; Hug, G.; Boulouchos, K. Sensitivity analysis of electric vehicle impact on low-voltage distribution grids. Electr. Power Syst. Res. 2021, 191, 106696. [Google Scholar] [CrossRef]
  13. Kühnbach, M.; Stute, J.; Gnann, T.; Wietschel, M.; Marwitz, S.; Klobasa, M. Impact of electric vehicles: Will German households pay less for electricity? Energy Strategy Rev. 2020, 32, 100568. [Google Scholar] [CrossRef]
  14. Rahman, S.; Khan, I.A.; Khan, A.A.; Mallik, A.; Nadeem, M.F. Comprehensive review & impact analysis of integrating projected electric vehicle charging load to the existing low voltage distribution system. Renew. Sustain. Energy Rev. 2022, 153, 111756. [Google Scholar] [CrossRef]
  15. Zuluaga-Ríos, C.D.; Florián-Ceballos, D.F.; Ángel Rojo-Yepes, M.; Saldarriaga-Zuluaga, S.D. Review of Charging Load Modeling Strategies for Electric Vehicles: A Comparison of Grid-to-Vehicle Probabilistic Approaches. Tecnura 2021, 25, 108–125. [Google Scholar] [CrossRef]
  16. Gil-Aguirre, J.; Perez-Londoño, S.; Mora-Flórez, J. A measurement-based load modelling methodology for electric vehicle fast-charging stations. Electr. Power Syst. Res. 2019, 176, 105934. [Google Scholar] [CrossRef]
  17. Li, X.; Zhang, Q.; Peng, Z.; Wang, A.; Wang, W. A data-driven two-level clustering model for driving pattern analysis of electric vehicles and a case study. J. Clean. Prod. 2019, 206, 827–837. [Google Scholar] [CrossRef]
  18. Frendo, O.; Graf, J.; Gaertner, N.; Stuckenschmidt, H. Data-driven smart charging for heterogeneous electric vehicle fleets. Energy AI 2020, 1, 100007. [Google Scholar] [CrossRef]
  19. Gerossier, A.; Girard, R.; Kariniotakis, G. Modeling and Forecasting Electric Vehicle Consumption Profiles. Energies 2019, 12, 1341. [Google Scholar] [CrossRef]
  20. Sun, K.; Sarker, M.R.; Ortega-Vazquez, M.A. Statistical characterization of electric vehicle charging in different locations of the grid. In Proceedings of the 2015 IEEE Power Energy Society General Meeting, Denver, CO, USA, 26–30 July 2015; pp. 1–5. [Google Scholar] [CrossRef]
  21. Li, G.; Zhang, X. Modeling of Plug-in Hybrid Electric Vehicle Charging Demand in Probabilistic Power Flow Calculations. IEEE Trans. Smart Grid 2012, 3, 492–499. [Google Scholar] [CrossRef]
  22. Khoo, Y.B.; Wang, C.H.; Paevere, P.; Higgins, A. Statistical modeling of Electric Vehicle electricity consumption in the Victorian EV Trial, Australia. Transp. Res. Part D Transp. Environ. 2014, 32, 263–277. [Google Scholar] [CrossRef]
  23. Jiang, H.; Ren, H.; Sun, C.; Watts, D. The temporal-spatial stochastic model of plug-in hybrid electric vehicles. In Proceedings of the 2017 IEEE PES Innovative Smart Grid Technologies Conference Europe (ISGT-Europe), Turin, Italy, 26–29 September 2017; pp. 1–6. [Google Scholar] [CrossRef]
  24. Tian, H.; Tzelepis, D.; Papadopoulos, P.N. Electric Vehicle Charger Static and Dynamic Modelling for Power System Studies. Energies 2021, 14, 1801. [Google Scholar] [CrossRef]
  25. Arif, S.M.; Lie, T.T.; Seet, B.C.; Ayyadi, S.; Jensen, K. Review of Electric Vehicle Technologies, Charging Methods, Standards and Optimization Techniques. Electronics 2021, 10, 1910. [Google Scholar] [CrossRef]
  26. Ahmad, A.; Alam, M.S.; Chaban, R.C. Efficiency enhancement of wireless charging for Electric vehicles through reduction of coil misalignment. In Proceedings of the 2017 IEEE Transportation Electrification Conference and Expo (ITEC), Chicago, IL, USA, 22–24 June 2017; pp. 21–26. [Google Scholar]
  27. Sarker, M.R.; Pandžić, H.; Ortega-Vazquez, M.A. Electric vehicle battery swapping station: Business case and optimization model. In Proceedings of the 2013 International Conference on Connected Vehicles and Expo (ICCVE), Las Vegas, NV, USA, 2–6 December 2013; pp. 289–294. [Google Scholar] [CrossRef]
  28. Dharmakeerthi, C.; Mithulananthan, N.; Saha, T. Impact of electric vehicle fast charging on power system voltage stability. Int. J. Electr. Power Energy Syst. 2014, 57, 241–249. [Google Scholar] [CrossRef]
  29. Bulbaai, R.R. Toward 100% Sustainable Energy Production and a Structural Decrease in Energy Demand: Curaçao, as a Case Study of Small Island Developing States. Ph.D. Thesis, University of Twente, Enschede, The Netherlands, 2019. [Google Scholar]
  30. Collin, R.; Miao, Y.; Yokochi, A.; Enjeti, P.; Jouanne, A. Advanced Electric Vehicle Fast-Charging Technologies. Energies 2019, 12, 1839. [Google Scholar] [CrossRef]
  31. Brenna, M.; Foiadelli, F.; Leone, C.; Longo, M. Electric vehicles charging technology review and optimal size estimation. J. Electr. Eng. Technol. 2020, 15, 2539–2552. [Google Scholar] [CrossRef]
  32. Dericioglu, C.; Yirik, E.; Unal, E.; Cuma, M.; Onur, B.; Tumay, M. A review of charging technologies for commercial electric vehicles. Int. J. Adv. Automot. Technol. 2018, 2, 61–70. [Google Scholar]
  33. Saldarriaga-Zuluaga, S.D.; López-Lezama, J.M.; Zuluaga Ríos, C.D.; Villa Jaramillo, A. Effects of the Incorporation of Electric Vehicles on Protection Coordination in Microgrids. World Electr. Veh. J. 2022, 13, 163. [Google Scholar] [CrossRef]
Figure 1. One-line diagram of the power grid under study.
Wevj 14 00231 g001
Figure 2. Lines loading in high demand.
Wevj 14 00231 g002
Figure 3. Lines loading in medium demand.
Wevj 14 00231 g003
Figure 4. Lines loading in low demand.
Wevj 14 00231 g004
Figure 5. Voltage magnitudes in high demand.
Wevj 14 00231 g005
Figure 6. Voltage magnitudes in medium demand.
Wevj 14 00231 g006
Figure 7. Voltage magnitudes in low demand.
Wevj 14 00231 g007
Figure 8. Lines loading in high demand (upgraded network).
Wevj 14 00231 g008
Table 1. Fuel generators.
Power PlantNumber of GeneratorsNominal Power [MW]
Station 1a48.9
Station 1b49.8
Station 248.3
Station 366.25
Station 315.3
Total19150.8
Table 2. Wind turbines.
Wind ParkTurbine QuantityNominal Power [MW]Power FactorVoltage [kV]
152.80.951
253.00.951
353.450.951
Table 3. Transformers data.
QuantityNameRated Power MVAVoltage-In kVVoltage-Out kVReactance x1 p.u.Resistance r1 p.u.
1TRG 1.21.511110.030
1TRG 1.31.511110.030
2TRG 1.15011660.059130480.00290888
2TGR 1.45011660.059130480.00290888
1TGR 2.11.511110.050.00656212
1TGR 2.21.511110.050.00656212
1TGR 2.34511660.059130.00198434
1TGR 2.44511660.059130.00198434
1TGR 2.57566300.059130430.00450707
1TGR 2.67566300.059130430.00450707
1TGR 3.1811300.050.0041349
6TGR 3.11611300.059130430.00256748
1TG 3.11.530300.050.00715276
1TG 3.21.530300.050.00715276
2TR21630120.059130430.00290888
2TR32530120.050.00329128
2TR41630120.059130430.00290888
2TR51630120.059130430.00290888
2TR62530120.050.00329128
2TR71030120.050.00423796
2TR7.383060.050.00450707
2TR81630120.059130430.00290888
2TR91630120.059130430.00290888
2TR101030120.050.00423796
2TR111630120.059130430.00290888
2TR121030120.050.00423796
2TR131630120.059130430.00290888
5TRW13.13010.050.00437125
5TRW23.13010.050.00437125
2TRW33.753010.050.00414761
Table 4. Nominal voltages of substations.
Nominal Voltage kVType
66Double Bus
11Single Bus
30Double Bus
30Single Bus
30Single Bus
30Single (short) Bus
30Double (short) Bus
12Single Bus with Tie Breaker
12Double Bus
6Single Bus (ABC-N)
Table 5. Underground cables.
RateinVoltage kVRated CurrentAC Resistance R’ (20 °C)Reactance X’AC-Resistance R0’Reactance X0’
600.8140.03140.11623890.12570.4649556
300.5250.08330.10995570.33330.4398228
Table 6. Aggregated loads per substation.
NameActive Power MWReactive Power Mvar
LD2A10.553.49
LD2AB10.553.49
LD3A4.311.4166
LD3B4.311.4166
LD4A8.022.636
LD4B8.022.636
LD5A3.491.147
LD5B3.491.147
LD6A3.931.2917
LD6B3.931.2917
LD7A1.610.5292
LD7B1.610.5292
LD8A8.872.9154
LD8B8.872.9154
LD9A7.642.511
LD9B7.642.511
LD10A2.290.7527
LD10B2.290.7527
LD11A2.330.7658
LD11B2.330.7658
LD12A6.782.2285
LD12B6.782.2285
LD13A3.851.265
LD13B3.851.265
Table 7. Charging level of EVs according to [33].
Charging LevelsLevel 1Level 2Level 3
Phase1 phase AC1/3 phase AC3 phase AC or DC
Voltage120 V240 V208 V–600 V
Current11 A, 16 A16 A, 32 A, 80 A240 A, 480 A
Power1.4 kW, 1.9 kW4 kW, 8 kW, 19.2 kW50 kW, 100 kW
InstallationDomestic locationDomestic/Public locationPublic location
Table 8. EV charging modeling parameters.
Type p 1 p 2 p 3
AC Fast Charging0.0034−0.11991.086
DC Fast Charging0.0620−0.21991.156
DC Super Fast Charging 0.1326 0.18160.951
Table 9. EV penetration represented in MW.
EV
Stations
Charge
Level
Case 0.5%
[MW]
Case 1%
[MW]
Case 1.5%
[MW]
Case 2%
[MW]
Case 2.5%
[MW]
Case 3%
[MW]
Case 3.5%
[MW]
Case 4%
[MW]
Case 4.5%
[MW]
1391722.5304757.578.890112
232.5511.251516.252021.92530.5
334.258.7515.2520.3522.8527.532.837.539
424.258.7512.751723.7528.530.63535
520.190.390.420.550.610.740.870.991.25
620.180.370.410.550.610.740.850.971.06
720.180.370.410.550.610.740.650.740.77
820.180.370.410.550.610.56240.490.560.56
Vehicles-4128241235164720592471288332943706
Table 10. Chargeability index for different penetration levels of EV penetration.
EVs PenetrationCase 3%Case 3.5%Case 4%Case 4.5%
High Demand00.291.252.23
Medium Demand0000.59
Low Demand0000.068
Disclaimer/Publisher’s Note: The statements, opinions and data contained in all publications are solely those of the individual author(s) and contributor(s) and not of MDPI and/or the editor(s). MDPI and/or the editor(s) disclaim responsibility for any injury to people or property resulting from any ideas, methods, instructions or products referred to in the content.

