Article

Benefit Evaluation of Carbon Reduction and Loss Reduction under a Coordinated Transportation–Electricity Network

1
Electric Power Science Research Institute, State Grid Jiangsu Electric Power Co., Ltd., Nanjing 211103, China
2
College of Electrical Engineering, Southeast University, Nanjing 210096, China
*
Author to whom correspondence should be addressed.
World Electr. Veh. J. 2024, 15(1), 24; https://doi.org/10.3390/wevj15010024
Submission received: 24 October 2023 / Revised: 26 November 2023 / Accepted: 12 December 2023 / Published: 10 January 2024

Abstract

:
With the extensive promotion of new energy vehicles, the number of electric vehicles (EVs) in China has increased rapidly. Electric vehicles are densely parked in garages, which means parking garages contain a large amount of idle energy storage resources. How to make this idle energy storage in garages participate in power system dispatch and evaluate the network loss and system carbon emissions considering electric vehicle energy storage has become an important research topic. The uncertainty around parking habits for electric vehicles causes it to be difficult to predict compared with the traditional energy storage system. Therefore, it is necessary to study its influence on the synergistic effect of loss reduction and carbon reduction as energy storage access. The benefits of new energy power generation output growth, energy waste reduction, and carbon emission reduction brought by loss reduction measures can be well reflected in the loss reduction index system of a power system in a low-carbon scenario. In this paper, a large amount of parking information in a certain area is collected, and the approximate parking habits of all vehicles in the simulated garage are obtained by the Monte Carlo method. Then, the load aggregation model is established, which is incorporated into the power system as an energy storage model. The synergy of loss reduction and carbon reduction is considered in this paper and comprehensively optimizes the strategy of integrating electric vehicles into the power system from the perspectives of electricity and carbon. In the scenarios of carbon flow calculation and network loss calculation, the YALMIP and CPLEX of MATLAB are applied, with various constraints input for simulation, so that the benefit evaluation method of carbon reduction and loss reduction under a coordinated transportation–electricity network is obtained.

1. Introduction

Under the background of “carbon neutrality” and “peak carbon dioxide emissions”, the penetration rate of renewable energy, such as wind power and solar power generation, in the power system is increasing, and the high proportion of new energy is connected to the grid, which makes the problem of power system loss reduction and carbon reduction receive further attention [1]. As a new means of transportation, electric vehicles have achieved rapid development with their advantages of zero emission of polluting gases [2,3]. However, with the increasing number of electric vehicles in the future, the charging of electric vehicles will bring substantial load growth to the distribution network, resulting in an increase in the peak–valley load difference and a lack of certainty in the power system. More clean energy storage resources must be allocated for the stable operation of the power system, and the economic benefit is reduced [4].
As a new type of transportation, electric vehicles have unparalleled advantages in alleviating energy crises and reducing human dependence on traditional fossil fuels, so they have received widespread attention from countries around the world. The network loss rate, as an important economic indicator for the operation of the power system, is an important indicator for comprehensively measuring the technical and management level of power enterprises [5]. As an important link in distributing electrical energy to users, the distribution network has low voltage levels, large scale, and multiple pieces of equipment. The active network loss accounts for more than 40% of the total network loss and has a relatively large potential for energy conservation and loss reduction [6]. As a new type of load, the charging load of electric vehicles has a certain degree of controllability. Reasonable regulation of the charging load of electric vehicles connected to the distribution network can reduce network loss in the distribution network, which is conducive to the safe and economic operation of the power system. The research on the integration of electric vehicles into the power grid in China mainly focuses on the impact and control measures of electric vehicle charging on the power grid [7], the joint scheduling of electric vehicles, and new energy sources such as wind power [8,9]. In [10], for the optimal power-flow problem in fully decentralized distribution networks with large-scale PV and EV, an optimal power-flow model with PV and EV as controllable media was established to reduce network losses. There are few studies on the synergistic effect of optimizing the charging and discharging processes of electric vehicles on carbon reduction and loss reduction in the power system.
V2G (vehicle-to-grid) technology can be used to realize energy exchange between a power system and electric vehicles. V2G technology enables electric vehicles to participate in power system regulation. By optimizing the charging and discharging performance of electric vehicles, the load characteristics are improved, the consumption of renewable energy is promoted, and the energy storage configuration is optimized. V2G technology also provides auxiliary services such as voltage and frequency adjustment for the power grid [11], which has an impact on the online loss management of the power system. As a flexible energy storage resource, electric vehicles can effectively track the charging load, smooth the fluctuating demand of renewable energy output, improve the degree of renewable energy access to the power grid, improve the operation efficiency of the power grid, and effectively control the loss adjustment.
Reference [12] describes the architecture of a smart grid and the interaction between electric vehicles and renewable energy. The influence of electric vehicles on the development of renewable energy is analyzed. Reference [13] develops a scheduling model based on stochastic optimization, which can adapt to the uncertain output of PHEV and renewable energy generation. Reference [14] proposes a two-stage distributed energy consumption strategy considering the active distribution network of electric vehicles. However, the above papers do not comprehensively consider the energy storage situation of electric vehicles in various time periods and do not reasonably analyze the network changes and the impact of loss reduction and carbon reduction caused by the aggregation model of electric vehicles connected to the power grid.
In fact, all kinds of loads, such as residential or household loads, are connected to the distribution system, but the complexity of the distribution system is increasing due to the growth of electric vehicles. The loss of electric vehicles as an energy storage access system has also been studied. In [15], based on the particle swarm optimization (CSA-PSO) method, a new crow search algorithm is proposed, which is used to optimally allocate different amounts of renewable distributed power generation based on total power loss and cost reduction under different conditions of inserting renewable distributed generation (RDG). An idea of using distributed generation with different scales to influence the system is put forward [16]. These effects include system loss, voltage deviation, and cost. Researchers have tried many times to optimize the loss effect of electric vehicle charging on distribution systems by designing the distribution of charging stations, just as some authors use nonlinear methods to achieve this goal. Most of these technologies mainly focus on the placement of EVCs (Electric Vehicle Charging Stations). In [17], only the electric vehicles in the unbalanced network are allocated by forming the objective function of reducing power loss. Most research has achieved the optimal allocation of distributed generation and EVCs by implementing various meta-heuristic algorithms to minimize line loss as the objective function. Reference [18] discusses the optimization scheduling and collaborative model of electric vehicles participating in the carbon market. In [19], the orderly charging and discharging of electric vehicles in low-carbon scenarios has also been further studied. However, from the perspective of a benefit evaluation system for loss reduction, there has been very little research on loss optimization connected with electric vehicles. In most cases, these studies only involve one aspect of optimal allocation but ignore the impact of energy storage and loss reduction of electric vehicles on carbon emissions and other social and economic indicators.
At present, the research on the comprehensive evaluation index system of power loss reduction mainly focuses on two aspects: the conventional power supply side and the power grid side. For the conventional power supply side, the establishment of an energy-saving evaluation index system for thermal power plants provides a reference for thermal power enterprises to figure out their own energy consumption, which is helpful for enterprises to tap energy-saving potential and promote the effective development of energy-saving work. Compared with the conventional power supply side, the evaluation index system of power grid side loss reduction has achieved more fruitful research results, and the evaluation index of technical performance has been put forward, which causes the evaluation of distribution networks to begin to shift to the aspects of power supply security and quality. The evaluation index of service and economy is put forward in reference [20] to ensure that power supply companies can provide high-quality services to users at an economical power supply cost. However, the traditional evaluation index system for power loss reduction is no longer applicable in a situation where the proportion of new energy generation in new power systems is greatly increased. Therefore, it is necessary to study the evaluation index system of power loss reduction benefits considering carbon emission reduction.
The novelty of this paper is to build a probabilistic aggregation model of the charging and discharging of electric vehicles and consider their impact on network loss and carbon emission. It makes sense for the structuring of an evaluation system of network carbon and power loss reduction benefits, taking into account technical parameters such as the power loss reduction rate, as well as economic and social aspects such as cost, carbon emission, and the carbon reduction rate. In this paper, the corresponding evaluation index of carbon reduction and loss reduction under a coordinated transportation-electricity network is introduced. The model is optimized by using the IEEE 33-bus system. The YALMIP and CPLEX in MATLAB are used, and various constraints are input for the simulation to prove the effectiveness of the model and indicators.

2. Carbon and Loss Reduction Model under a Coordinated Transportation–Electricity Network

2.1. Electric Vehicle Parking Time Distribution Prediction Model

2.1.1. Monte Carlo Simulation

The Monte Carlo method originated in the 1940s and was first used in the experimental study of atomic energy. By randomly sampling a large amount of data, the real physical process can be simulated by the method of experimentation, so that the results gradually approach the real value. Therefore, after recording a large number of random parking times of electric vehicles, a more accurate approximation of parking time within a reasonable range can be randomly extracted and predicted by the Monte Carlo method.

2.1.2. Parking Time Prediction

The parking time of electric vehicles is influenced by various factors such as vehicle types, users’ travel habits, weather, seasons, and so on. Office workers in residential areas will drive away from their garages in the morning for work and will drive into their garages in the afternoon for off-duty reasons. Families with children will also leave and enter their garages because of taking their children to and from school. On rainy days, users’ willingness to use vehicles will increase significantly, while on sunny days, users’ willingness to use vehicles will not be very high. Taxi owners are the most interested in maximizing benefits. They usually leave their garages early and go home very late. Therefore, the prediction model must fully consider the randomness and fluctuation of vehicle parking time in the garage.
In order to make the randomness of the experimental data meet the requirements, during the investigation, the data such as the storage time, departure time, parking time, and storage battery capacity of a random car among all commuter vehicles in garages in one day were randomly observed and formed into a trip chain. A total of 1080 groups of data were investigated to form the whole data set. The data set is input into MATLAB, with the centralized data extracted randomly by the Monte Carlo simulation method. The data with the highest frequency are considered as the optimal solution.

2.2. Objective Function

The objective function is to minimize the system’s carbon emission and network loss, which is expressed as follows:
minF = α C + β P loss
The carbon emission, C, of the system and the total network loss, Ploss, of the system can be expressed by Equations (2) and (3).
C = t T k Ω G E G k P G k , t
P loss = t T l L I l , t 2 R l
where ΩG is the set of nodes where the unit is located; E G k is the carbon emission intensity of unit k; P G k , t is the output power of unit k at time t; I l , t is the current flowing through the line l at time t; R l is the resistance of line l; and α and β are the weight coefficients in the dual objective, respectively. In this paper, set α = 0.5, and β = 0.5.

2.3. Constraints

2.3.1. Power Flow Constraints

i Π j ( P i j , t I i j , t 2 R i j ) = k Ω j P j k , t + P j , t G + P j , t d i s P j , t c h P j , t L D
i Π j ( Q i j , t I i j , t 2 X i j ) = k Ω j Q j k , t + Q j , t G Q j , t L D
V j , t 2 = V i , t 2 2 ( R i j P i j , t + X i j Q i j , t ) + I i j , t 2 ( R i j 2 + X i j 2 )
I i j , t 2 = ( P i j , t 2 + Q i j , t 2 ) / V i , t 2
where Π j and Ω j are, respectively, the set of end and head nodes; P i j , t and Q i j , t are the active power and reactive power through branch ij at time t; R i j and X i j are, respectively, the resistance and reactance of branch ij; I i j , t is the current flowing through branch ij at time t; V j , t is the voltage of node j at time t; P j k , t and Q j k , t are the active power and reactive power through branch jk at time t; P j , t G and Q j , t G are active power and reactive power of generation node j, respectively; P j , t L D and Q j , t L D are the load active power and reactive power; P j , t d i s and P j , t c h are the discharge and charging active power of the node j connected to EVs, respectively.

2.3.2. Security Constraints

  • Current limitation:
I i j min I i j I i j max
  • Voltage limitation:
U j min U j U j max
  • Unit output limitation:
P G min P j , t G P G max
  • Line power flow limitation:
P l min P i j , t P l max
where I i j max and I i j min are, respectively, the upper and lower limits of the branch current; U j max and U j min represent the upper and lower limits of the node voltage; P G max and P G min are the upper and lower limits of the unit output; and P l max and P l min are the upper and lower limits of the line power flow.

2.3.3. EV Constraints

Multi-period constraints are considered, mainly including charging and discharging state constraints, charging and discharging power constraints, and capacity constraints.
  • Charging and discharging state limitation:
u j , t dis + u j , t c h 1
Equation (12) indicates that an EV cannot be charged and discharged at the same time; u j , t d i s and u j , t c h are the EV discharge state and charging state, respectively.
  • Charging and discharging power limitation:
u j , t c h P c h min P j , t c h u j , t c h P c h max
u j , t d i s P d i s min P j , t d i s u j , t d i s P d i s max
Equation (13) refers to the EV charging power limit, and Equation (14) refers to the EV discharge power limit, where P c h max and P c h min are the upper and lower limits of the EV charging power; and P d i s max and P d i s min are the upper and lower limits of the EV discharge power.
  • Capacity limitation:
In order to improve EV battery life and avoid overcharge or over-discharge, the EV state of charge constraints should be set.
E e v , j , t = E e v , j , t 1 + ( P c h , j , t η P d i s , j , t η ) Δ t
E e v , j , t min E e v , j , t E e v , j , t max
Equation (15) represents the electric quantity equation of EV at time t, and Equation (16) represents the upper and lower constraints of electric quantity, where E e v , j , t is the electric power of the electric vehicle on node j at time t; E e v , j , t max and E e v , j , t min are, respectively, the upper and lower limits of the electric quantity on node j at time t; η is the charging and discharging efficiency; and Δt is the time step.
j k E e v , j , 0 = j k E e v , j , T
Equation (17) indicates the constraint of energy conservation, where E e v , j , 0 represents the energy at the initial starting-up of the EV, and E e v , j , T represents the energy of the EV at the end of a cycle.

3. Index Evaluation System

The comprehensive indicator system includes multi-level evaluation indicators. The number of indicator levels is determined according to the complexity of the indicator level relationship. The indicator system in this paper includes three levels, as shown in Figure 1. The evaluation index system of power loss reduction benefits considering carbon emission reduction mainly includes five aspects: power loss reduction effects, load loss reduction effects, power loss reduction effects, economic loss reduction benefits, and environmental protection loss reduction benefits.
The comprehensive evaluation indicators of loss and carbon reduction benefits built in this section of the research content mainly include two aspects: one is the indicators that affect the loss change, and the other is the indicators that are affected by the loss change. This covers many aspects such as loss reduction indicators, power supply indicators, load indicators, economic indicators, and environmental protection indicators, forming a grid loss reduction benefit evaluation index system that considers carbon emission reduction. The design content is characterized by a number of points, a wide range, and complex elements, which can scientifically and comprehensively reflect the effect of grid carbon reduction and loss reduction.
In addition, the analytic hierarchy process (AHP) is used to determine the weight of each indicator. AHP, with its characteristics of combining qualitative and quantitative methods to deal with various decision-making factors, and its advantages of being systematic, flexible, and concise, has been rapidly applied in social, economic, and other fields. The advantage of AHP is that it decomposes complex problems by establishing a clear hierarchical structure, scales people’s judgments by using a relative scale, obtains the comprehensive weight of the scheme by solving the judgment matrix, and determines the weight of each index by using the analytic hierarchy process. The AHP analysis and calculation process is shown in Figure 2.

3.1. Grid Loss Reduction Indicators

  • Transmission line loss, A11
Due to the existence of line resistance and conductance to the ground of transmission lines, there will be losses after the transmission lines are connected to the power grid for operation. The loss of line resistance is related to the power transmitted by the lines, which is variable loss. The loss caused by conductance to the ground is related to the operating voltage of transmission lines, which is a fixed loss. The mechanism of power grid loss reduction considering carbon emission reduction in this project is mainly to reduce the power transmitted by the line or make the power transmitted by the line more evenly distributed, so as to reduce the network loss. Therefore, this paper mainly considers the use of line resistance loss to evaluate the loss reduction effect. The calculation formula for transmission line loss is as follows:
A 11 = P i 2 + Q i 2 U i 2 × R i
  • Transmission line loss rate, A12
The percentage of the power lost on the power grid line in the output power of the first end of the line is called transmission line loss rate, or line loss rate, for short. If the active power transmitted by line i, and the active losses of the line itself are divided into Pi and A11, then the line loss rate of line i can be defined as follows:
A 12 = A 11 P i × 100 %

3.2. Power Indicators

  • Effective utilization rate of new energy, A21
This qualitative index represents the absorptive capacity of the power grid to new energy after loss reduction. For example, for wind power generation, the calculation expression is:
A 21 = Actual   power   generation   of   new   energy Maximum   required   electricity   generation   of   new   energy × 100 %
  • Distributed power access rate, A22
Distributed power generation mainly includes renewable energy power generation such as wind energy, solar energy, biomass energy, hydro energy, tidal energy, and marine energy, as well as waste heat, residual pressure, and waste gas utilization power generation and natural gas cooling/heating power multi-generation. The high proportion of distributed generation can reduce the power of large-scale long-distance power supply and reduce system loss.
A 22 = Distributed   generation   access   capacity Total   installed   capacity   of   the   power   system × 100 %

3.3. Load Indicators

  • Grid peak–valley difference, A31
This qualitative index represents the absorptive capacity of the power grid to new energy after loss reduction. For example, for wind power generation, the calculation expression is:
A 31 = Daily   maximum   load     Daily   minimum   load Daily   minimum   load × 100 %
  • Load rate, A32
The load rate can reflect the degree of load balance. The higher the load rate, the lower the overall comprehensive loss.
A 33 = Average   load   capacity Maximum   load   capacity × 100 %

3.4. Economic Indicators

  • Power saving, A41
This indicator reflects the power saved by the power grid after loss reduction and reflects the economic benefits.
  • Power saving rate, A42
This index also reflects the economic benefits brought by loss reduction, as a supplement to the power saving index.
A 42 = A 41 original   quantity   of   electricity × 100 %
  • Cost-saving income, A43
The cost-saving benefits include direct benefits and indirect benefits brought by the loss reduction measures. Direct income refers to the income from electricity sales, C e ; indirect income refers to the carbon quota transaction, C c , saved by the loss reduction, which reflects the environmental benefits.
A 43 = C e + C c = Δ W d e + Δ Q d c
where Δ W is the loss reduction value; d e is the electricity price, generally taking 0.5 yuan/(kW h); Δ Q is the reduced carbon emission; and d c is the carbon price.

3.5. Emission Indicators

  • Total CO2 emission of the system, A51
Large-scale wind–solar power grid connections have good low-carbon benefits; using coal for thermal power generation will emit a substantial amount of carbon dioxide, so increasing the output of large-scale wind–solar power can reduce the output of thermal power units, thus reducing carbon emissions. Therefore, by introducing the total CO2 emission, A51, index of the system, it can be used to estimate the low-carbon benefits brought by the power grid loss reduction measures to promote large-scale wind and solar power consumption. Its definition is as follows.
A 51 = i = 1 N G P G i × E G i × t
where P G i is the power generation of generator i , and E G i is the carbon emission intensity of generator i .
  • Carbon flow rate of power loss, A52
The carbon flow rate is the conversion of the line loss into carbon dioxide emissions, examining the carbon emissions caused by line loss, and providing data basis for carbon and loss reduction in the power system. The smaller the carbon flow rate of network loss, the less the carbon emission caused by network loss, thus proving the feasibility of emission reduction and loss reduction measures.
Assuming that the power flow direction of branch k-j is from node K to node J, then the loss of branch power is composed of the upstream generator power of node K, and the principle of proportional distribution is as follows.
P k j l o s s = P k j l o s s P k P k = P k j l o s s P k e k T P = P k j l o s s P k e k T A u 1 P G
where e k ∈ Rn×1 is the k-th component of 1, P G ∈ Rn×1 is the vector formed by the active power of generators at each node, and A u ∈ Rn×n is the power flow distribution matrix, and its element calculation formula is as follows.
( A u ) j i = { 1 , i = j | P j i | / P i , i U j ,   j = 1 , 2 , , n 0 , others
The shared contribution of generators connected to node i for P k j l o s s can be expressed as
P k j , G i l o s s = P k j l o s s P G i P k e k T A u 1 e i
To sum up, the carbon flow rate contribution of the generators connected to node i to the active loss of branch k-j can be expressed as
A 52 = R k j , G i l o s s = P k j , G i l o s s E G i
where P k j , G i l o s s is the power contributed by the generators connected to node I to the active loss of branch k-j, and EGi is the carbon emission intensity of generator set I.
  • Carbon flow rate of power loss, A53
Calculate the carbon emissions of the system before and after the transformation of loss and carbon reduction measures. The difference between them is the carbon reduction amount, and the ratio of the carbon reduction amount to the carbon emissions before the loss and carbon reduction measures is the carbon reduction rate.
E s c = E b c E r c
A 53 = e s c = E s c / E b c × 100 %
where e s c —Carbon reduction rate (%).

4. Case

4.1. Description

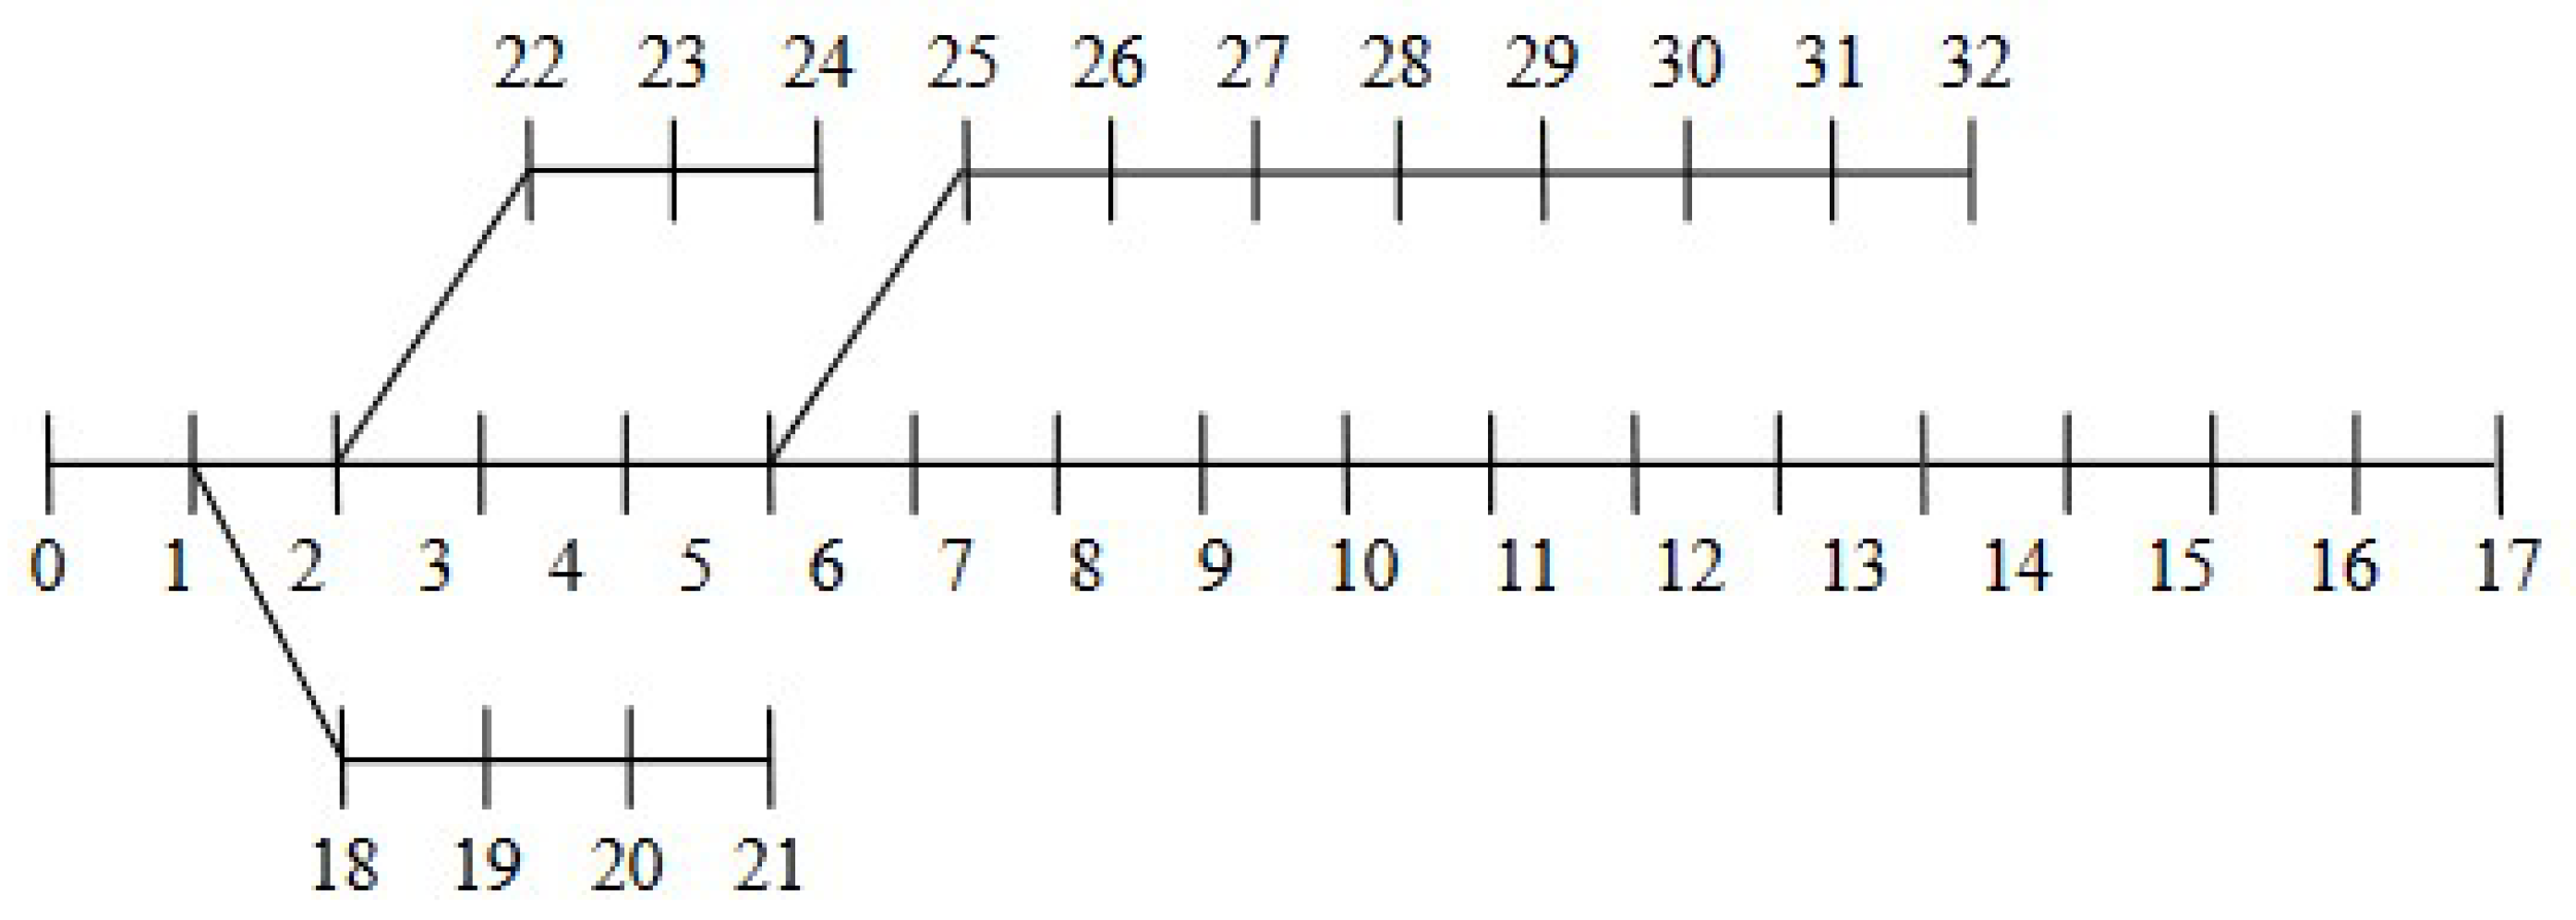
In order to verify the effectiveness of the carbon reduction and loss reduction model of transportation–electricity network collaboration, the carbon reduction and loss reduction model considering the participation of electric vehicles is applied to the improved IEEE 33-bus system, as shown in Figure 3. There are 10 generators in the 33-bus system, of which G1 and G2 are coal-fired units, and the carbon emission intensity is set to 0.875; G3, G5, G6, G7, and G10 are gas-fired units, and the carbon emission intensity is set to 0.525 or 0.520, respectively; G4, G8, and G9 are distributed wind generators and water turbines, and their carbon emission intensity is set to 0. The system power reference value, SB, is set as 100 MVA, while the voltage reference value, UB, is set as 12.66 kV.

4.2. Typical Scenario Analysis

Three scenarios are set for comparative analysis, and MATLAB, YALMIP, and CPLEX are applied to optimize the solution.
Scenario 1: EVs are not considered;
Scenario 2: The number of EV charging piles is 2;
Scenario 3: The number of EV charging piles is 20.
Scenario 1:
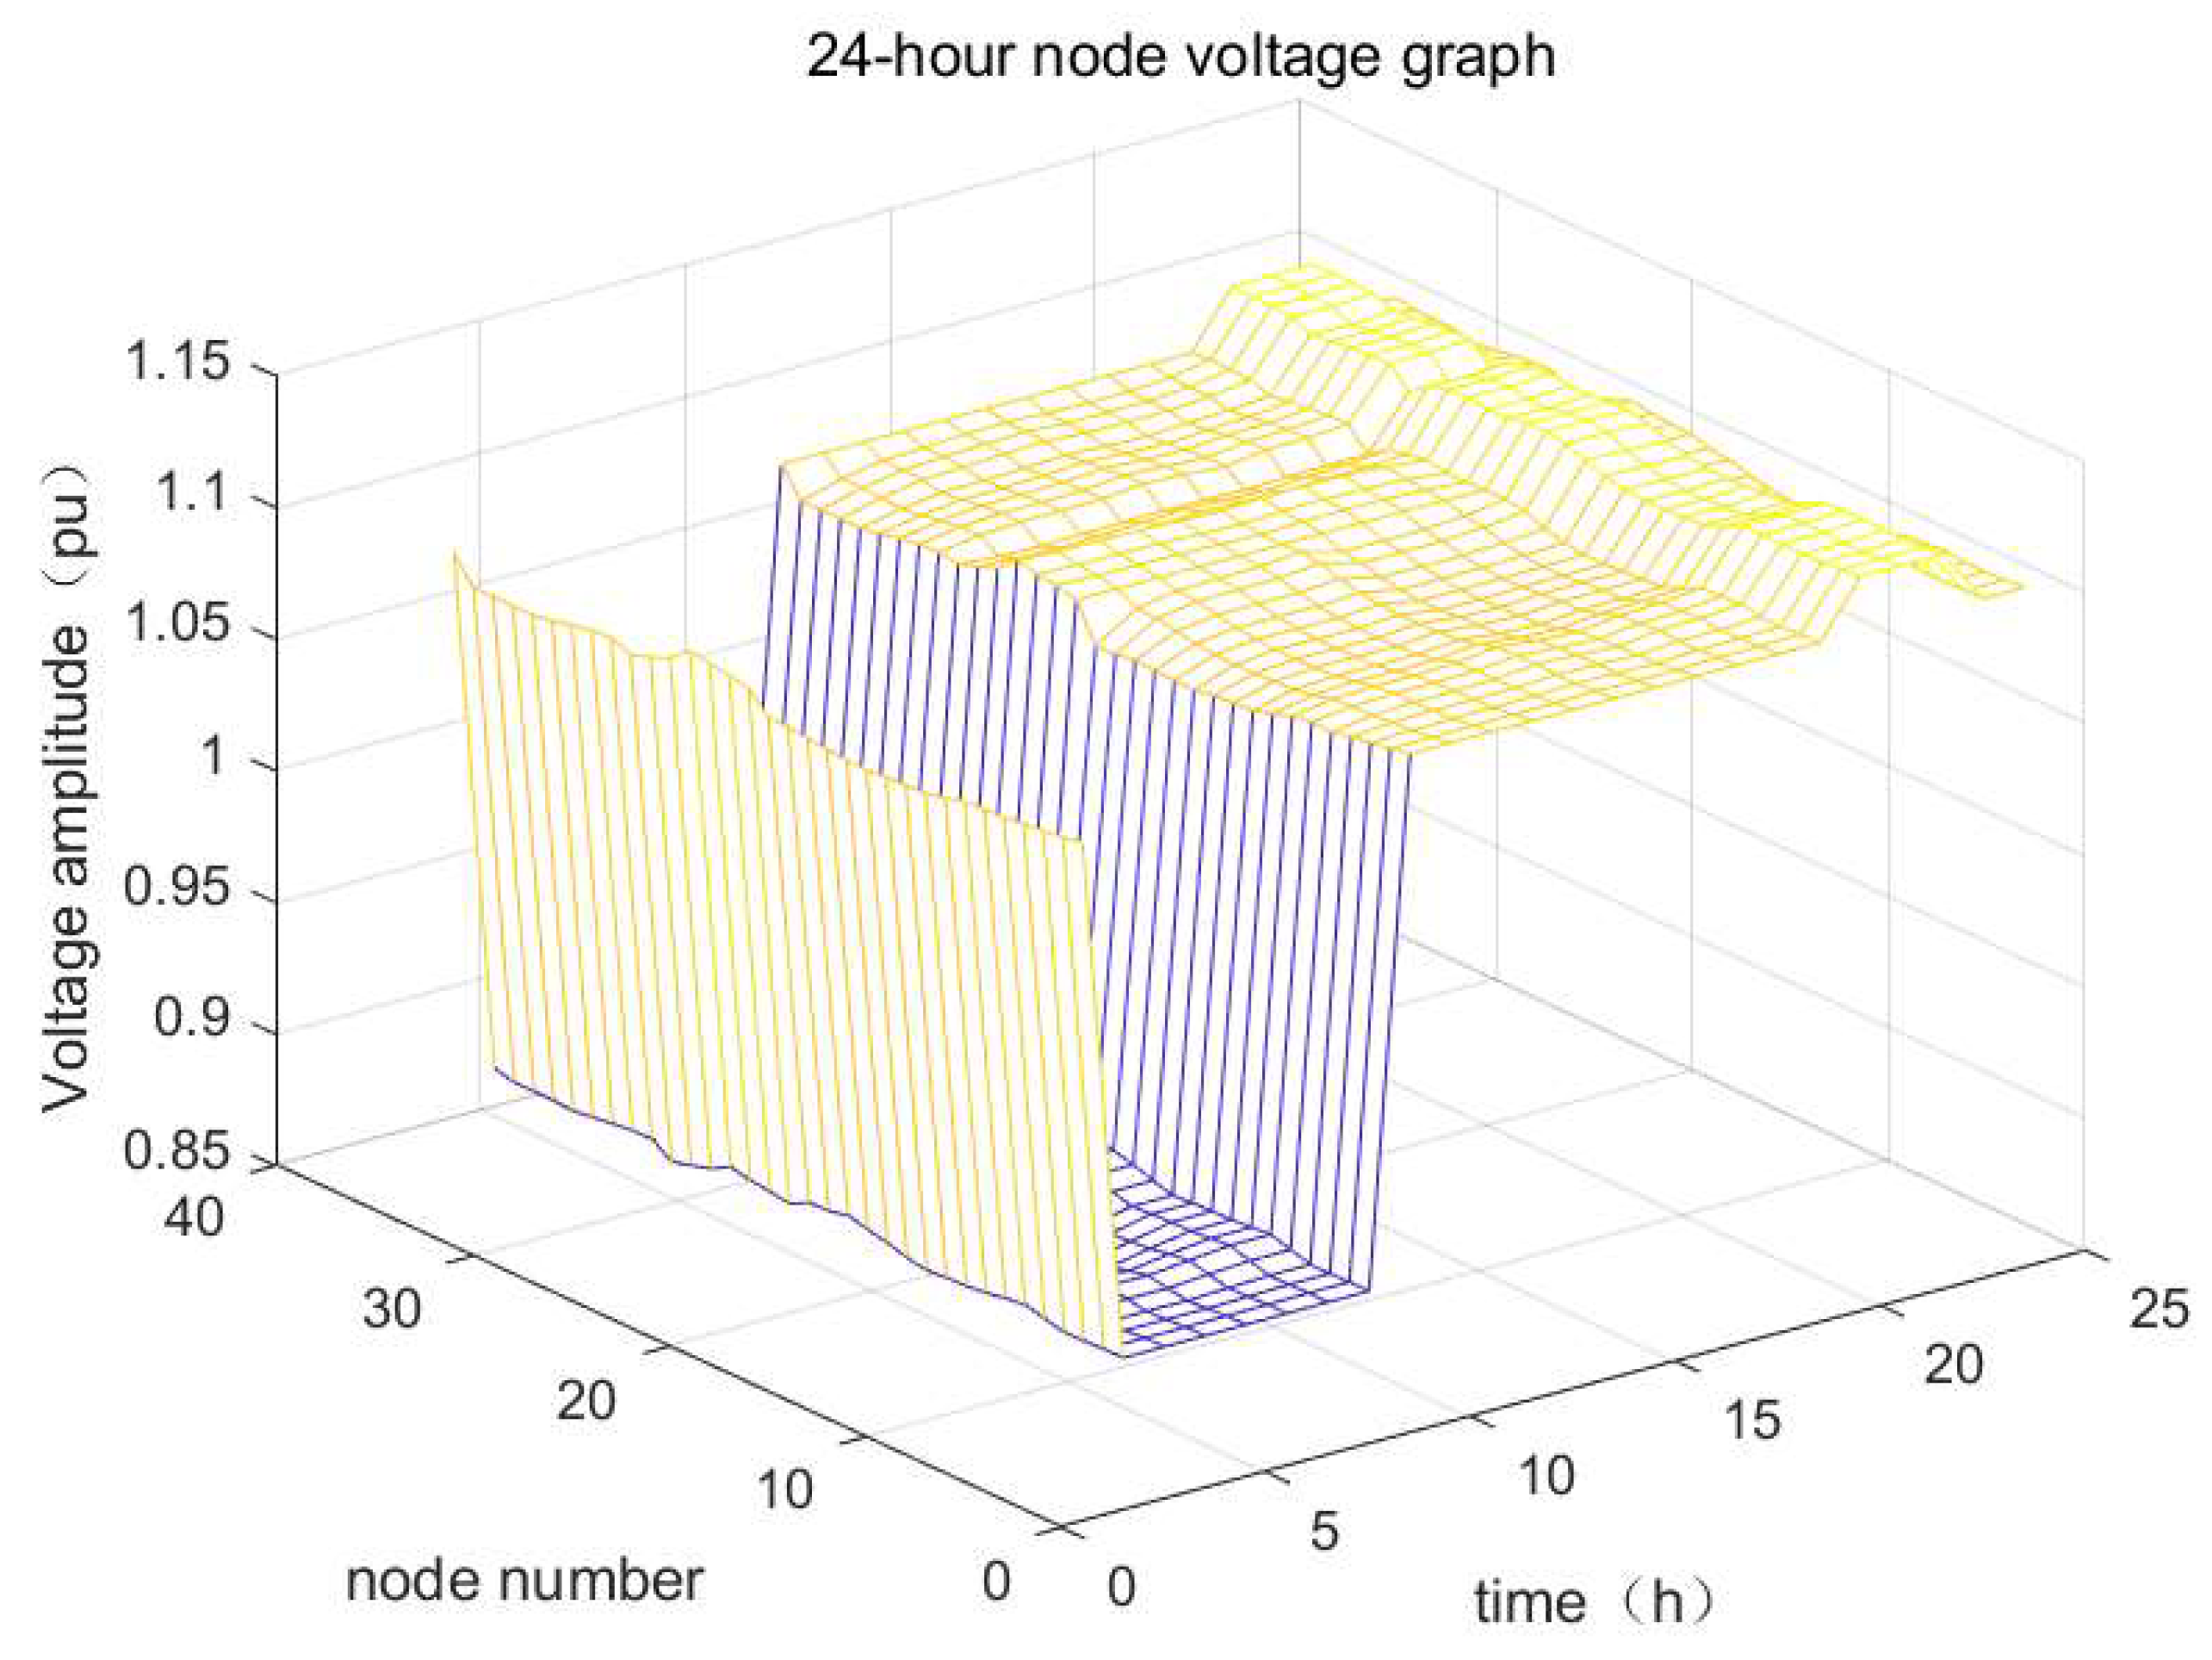
Without considering the access of EVs in the distribution network system, the voltage distribution diagram of each hour during the day can be obtained as shown in Figure 4. It can be seen that the maximum voltage unit value is 1.12, and the minimum voltage unit value is 0.9.
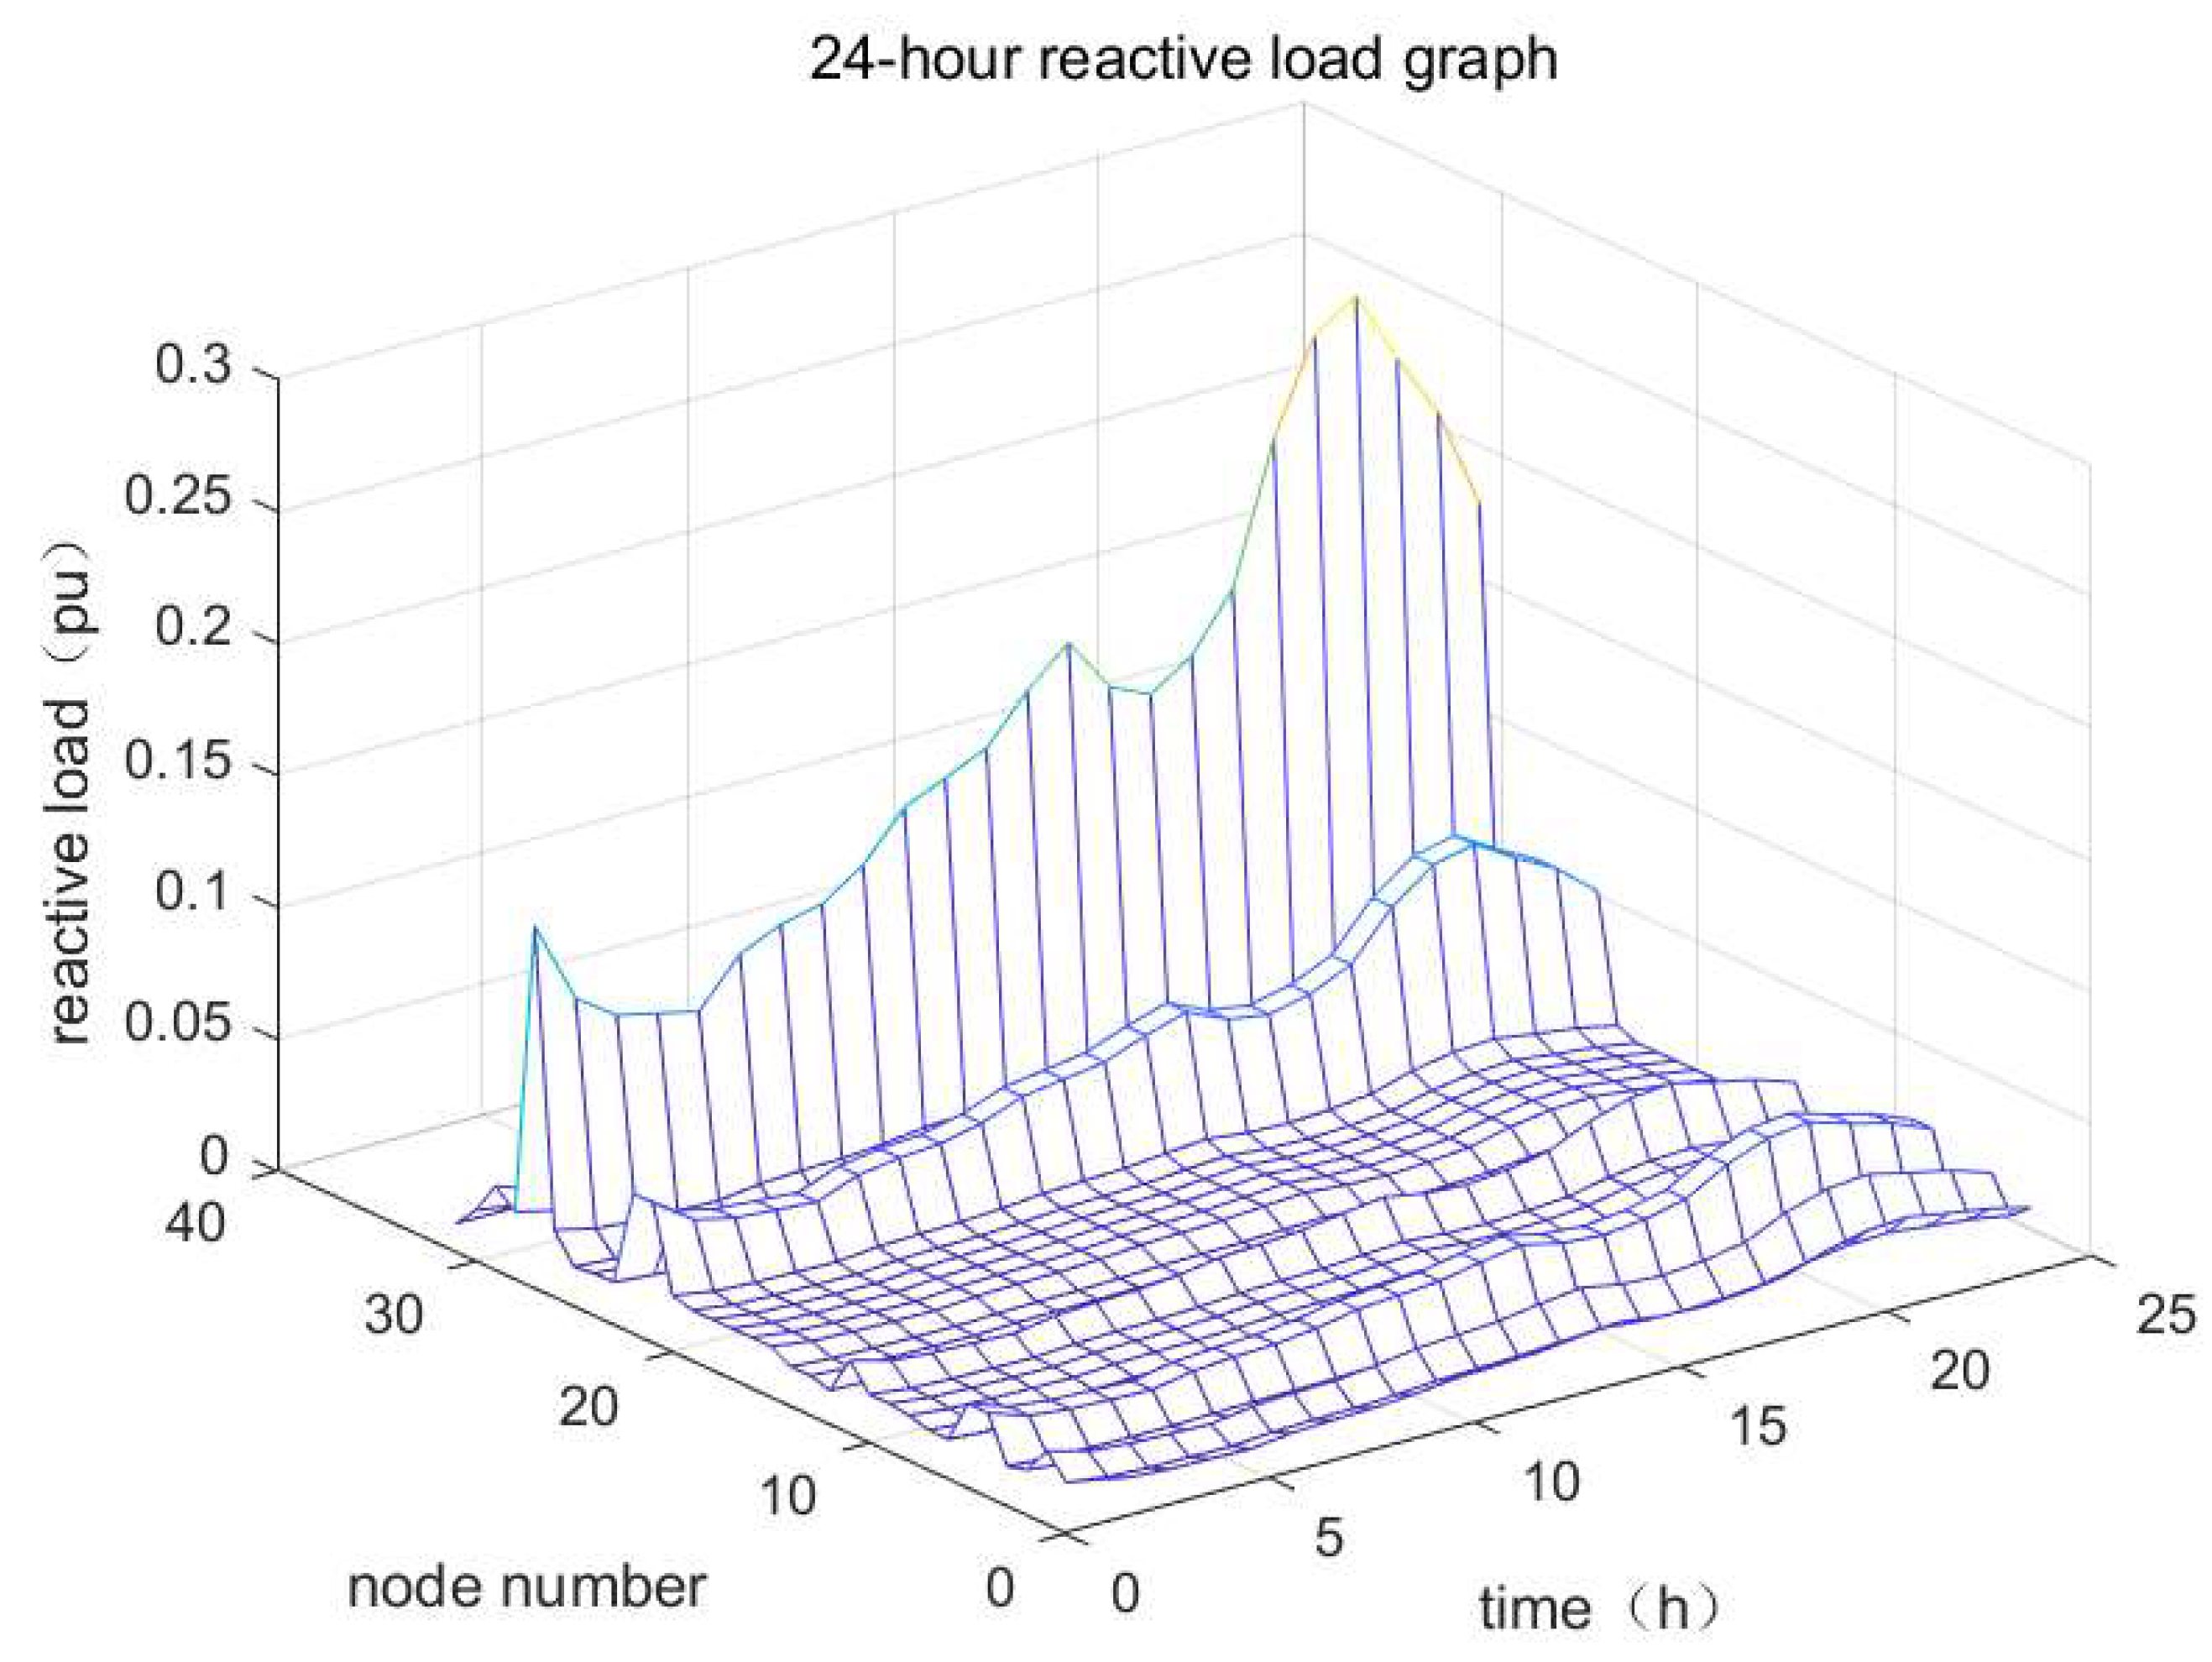
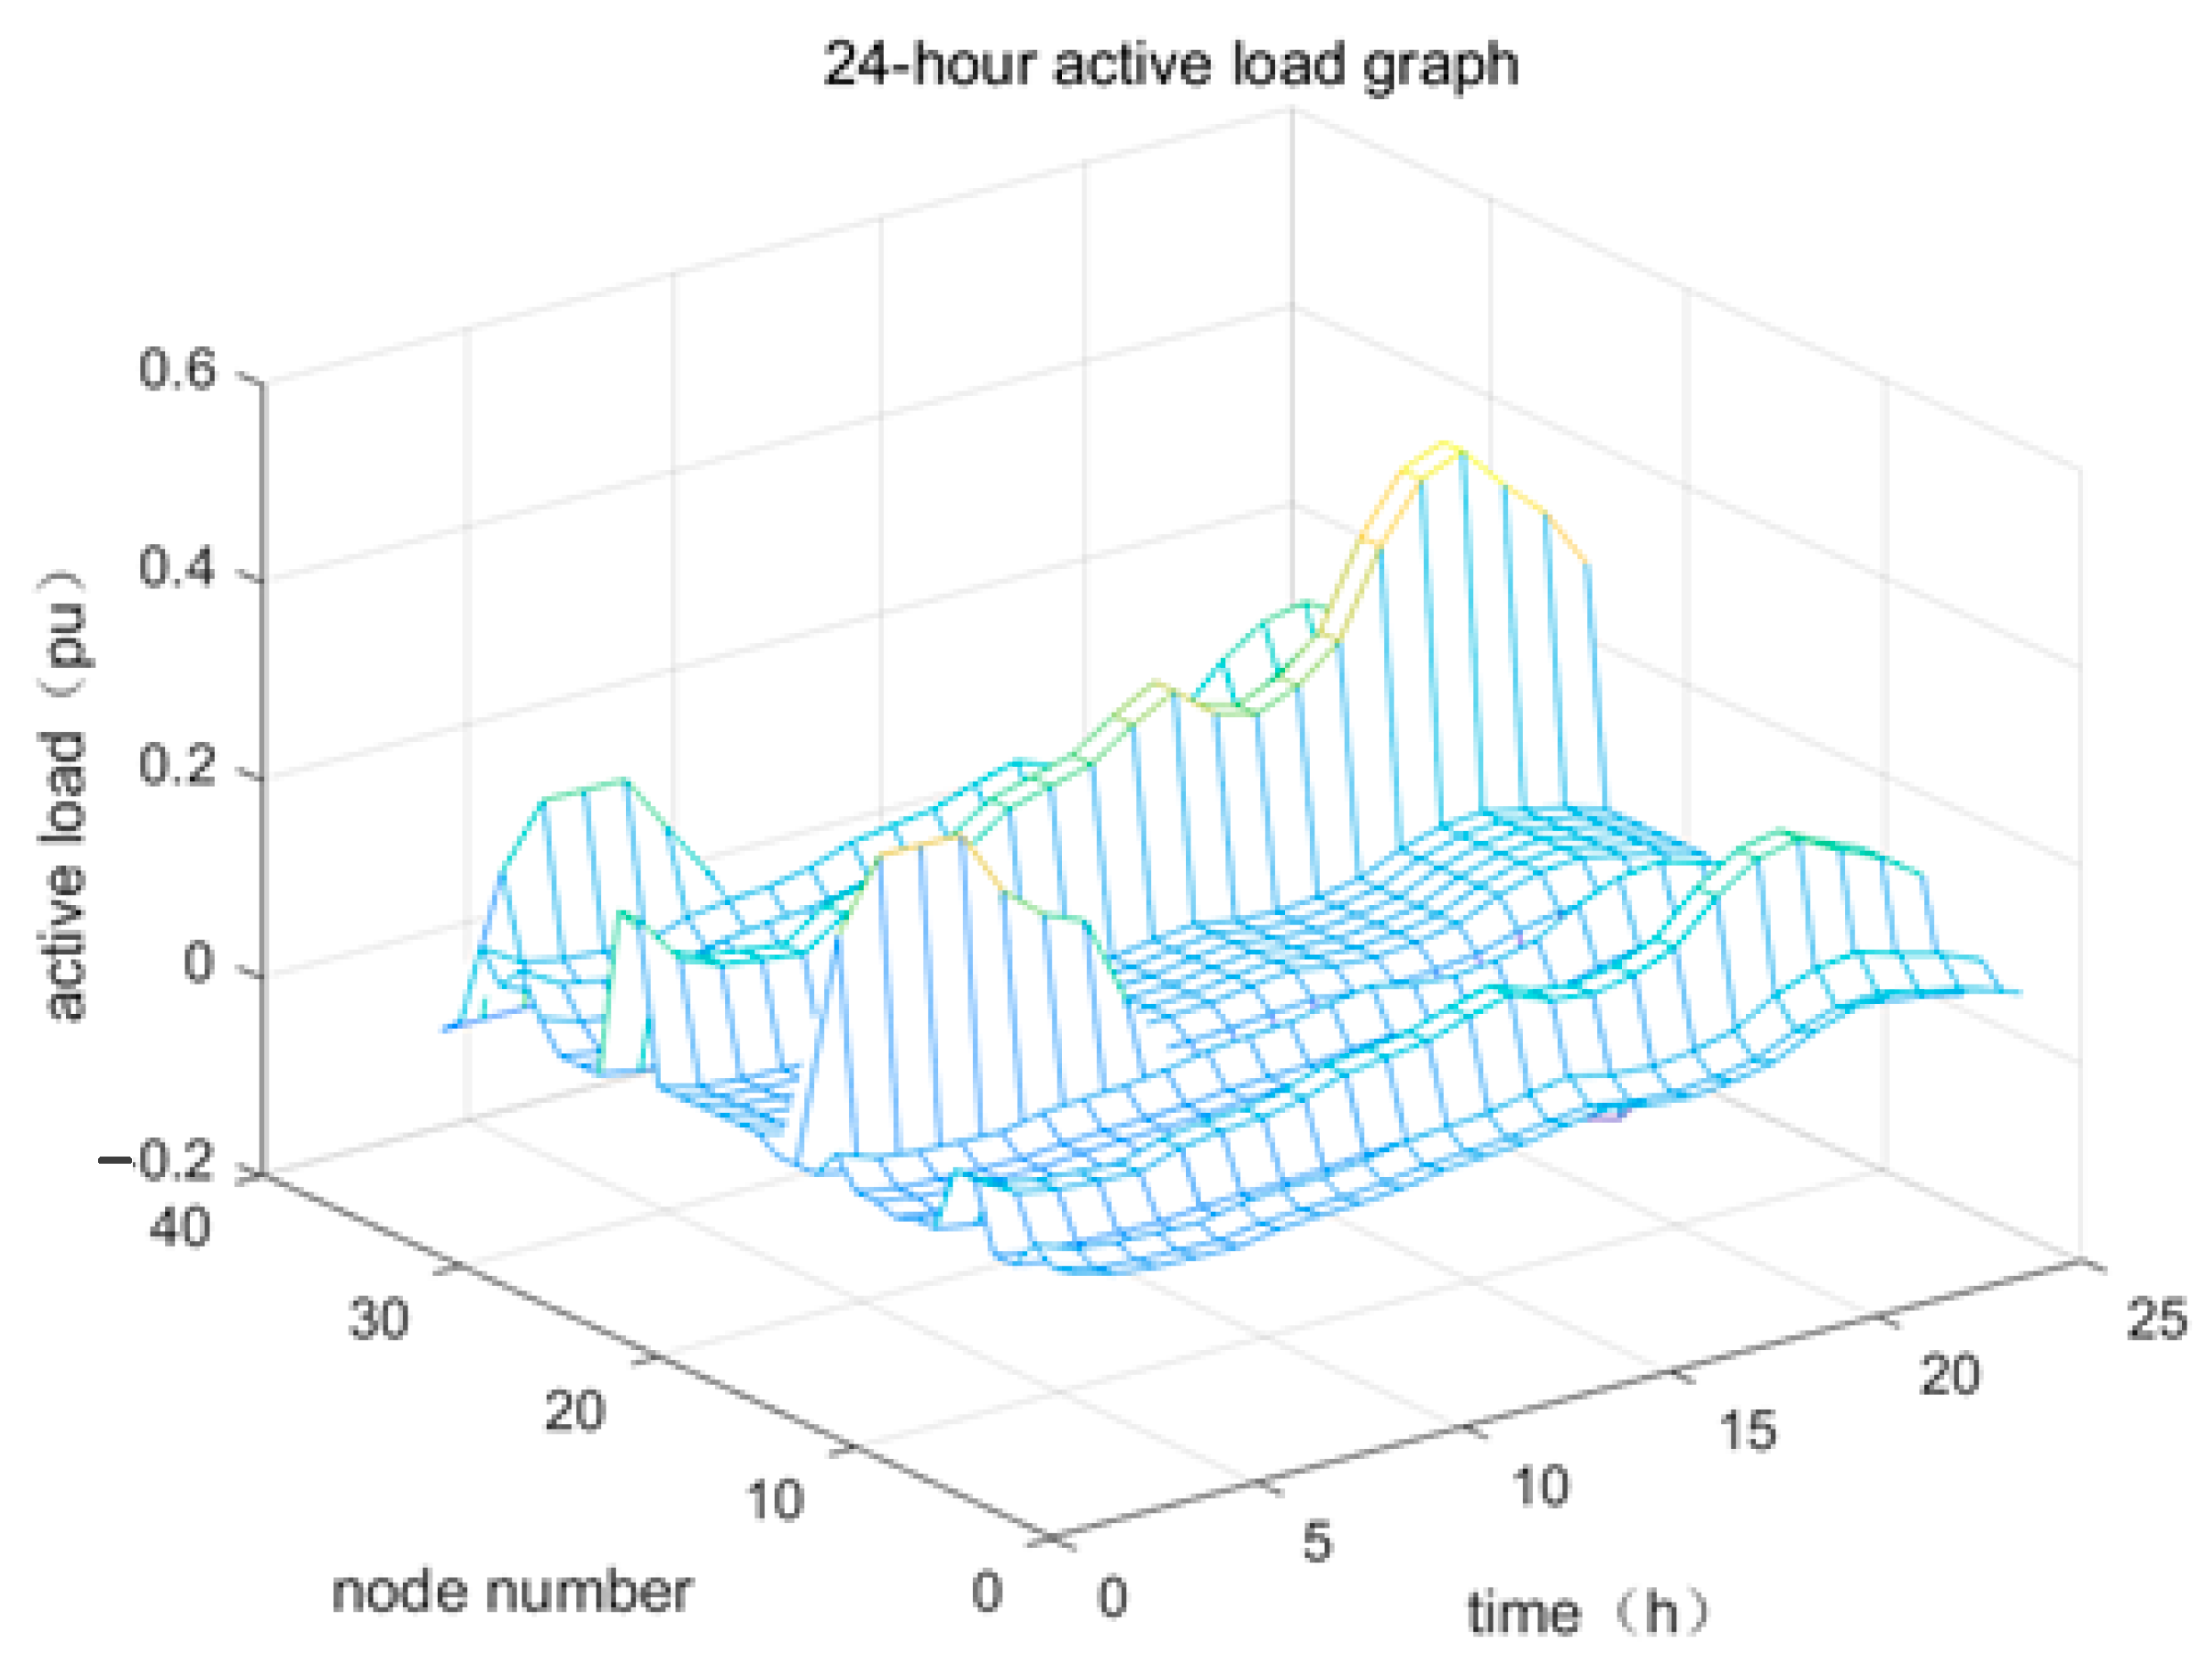
The distribution of the active load in a day is shown in Figure 5. The distribution of the reactive load in a day is shown in Figure 6. It can be seen that there are the most loads at nodes 23 and 24.
The EV charging piles are set at node 15 and node 32, where electric vehicle users can voluntarily charge and discharge. Therefore, there are two charging piles in the distribution network under Scenario 2. The node voltage distribution diagram of Scenario 2 can be obtained as shown in Figure 7. It can be seen from the figure that the maximum unit value of voltage amplitude is 1.12, and the minimum is 1.05, which is 0.15 less than the difference between the maximum and minimum values of voltage amplitude in Scenario 1, and the node voltage level is greatly improved, effectively suppressing the voltage fluctuation range.
The 24 h node active load distribution diagram of Scenario 2 is shown in Figure 8. The active load distribution is analyzed for EV charging and discharging active power only. By comparing Figure 5 and Figure 8, it can be seen that connecting EVs to the power system for orderly charging and discharging can improve the load distribution of the system in one day and effectively reduce the load fluctuation.
The charging and discharging situation of EVs in Scenario 2 for one day is shown in Figure 9. Obviously, EVs tend to charge and store energy before dawn and discharge in the early and late peak hours, especially in the late peak hours.
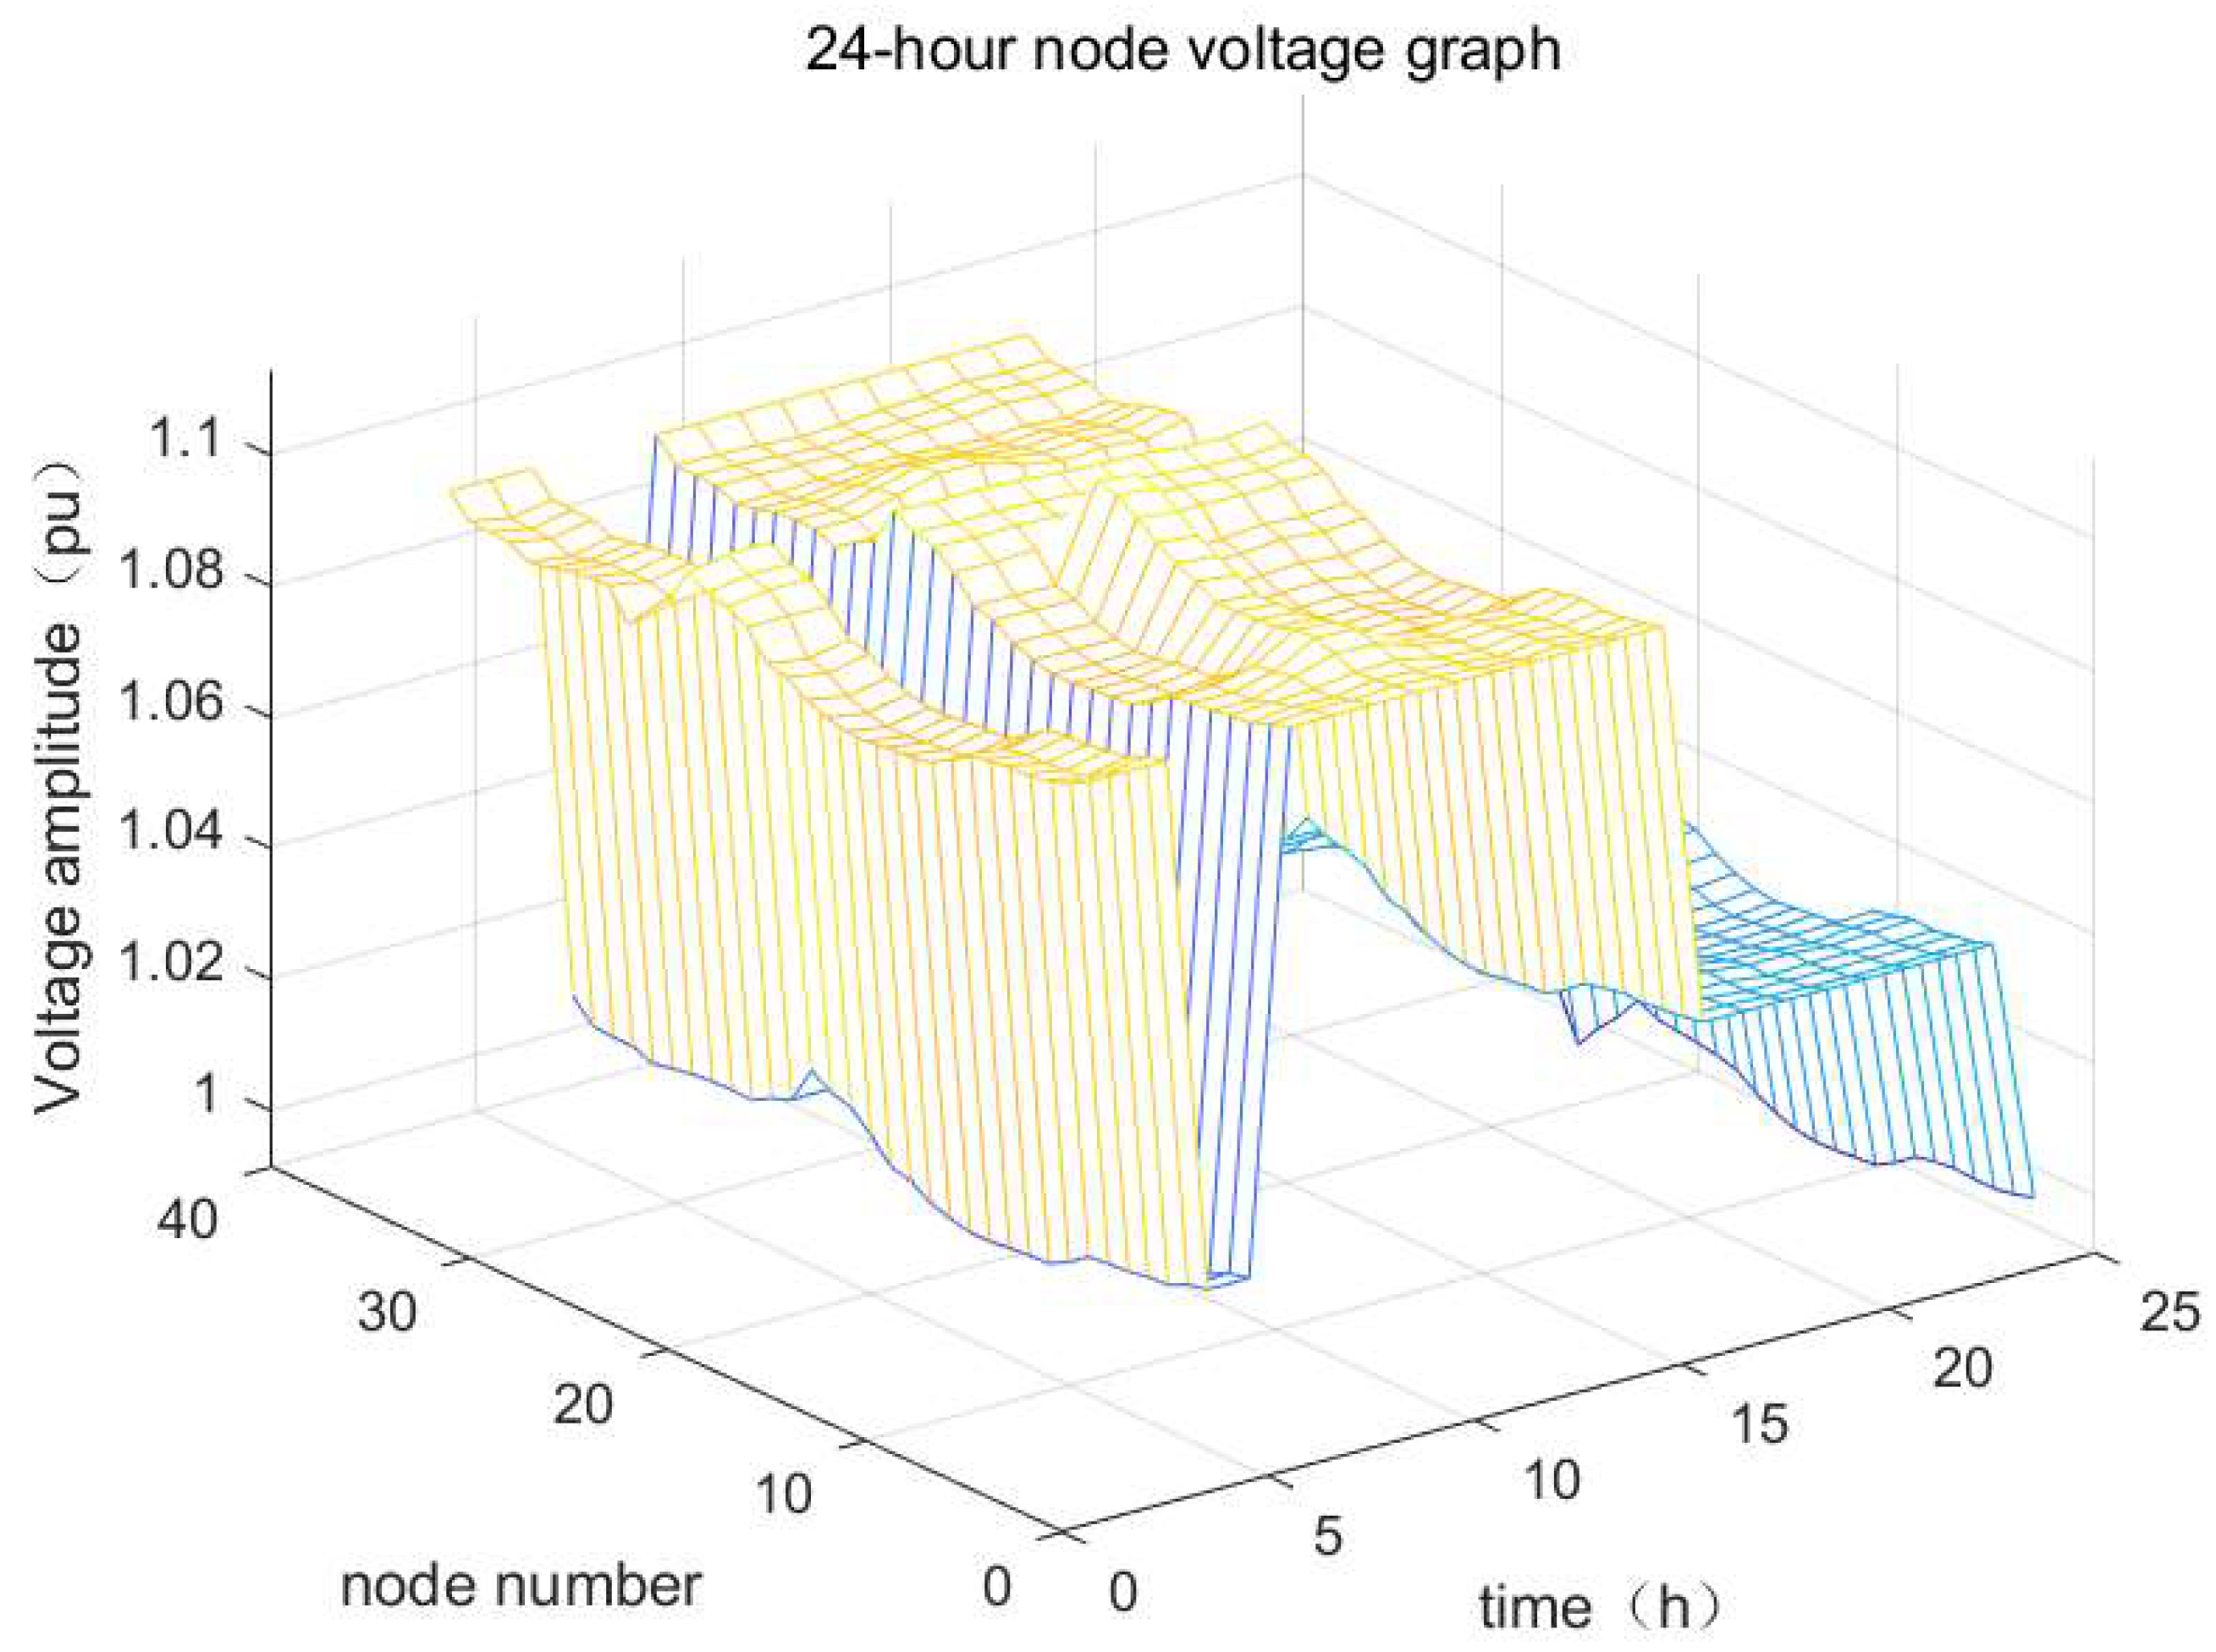
In Scenario 3, the number of EV charging piles is increased to ten times that of Scenario 2; that is, 20 nodes in the distribution network system are equipped with EVs. In this paper, the EV charging piles are set at nodes 3–10, 13–18, and 27–32. The voltage distribution diagram of each hour within the 24 h of a day can be obtained as shown in Figure 10. It can be seen that the maximum voltage unit value is 1.1, and the minimum voltage unit value is 0.99, which is closer to 1 than the unit value of voltage amplitude in Scenario 1 and Scenario 2.
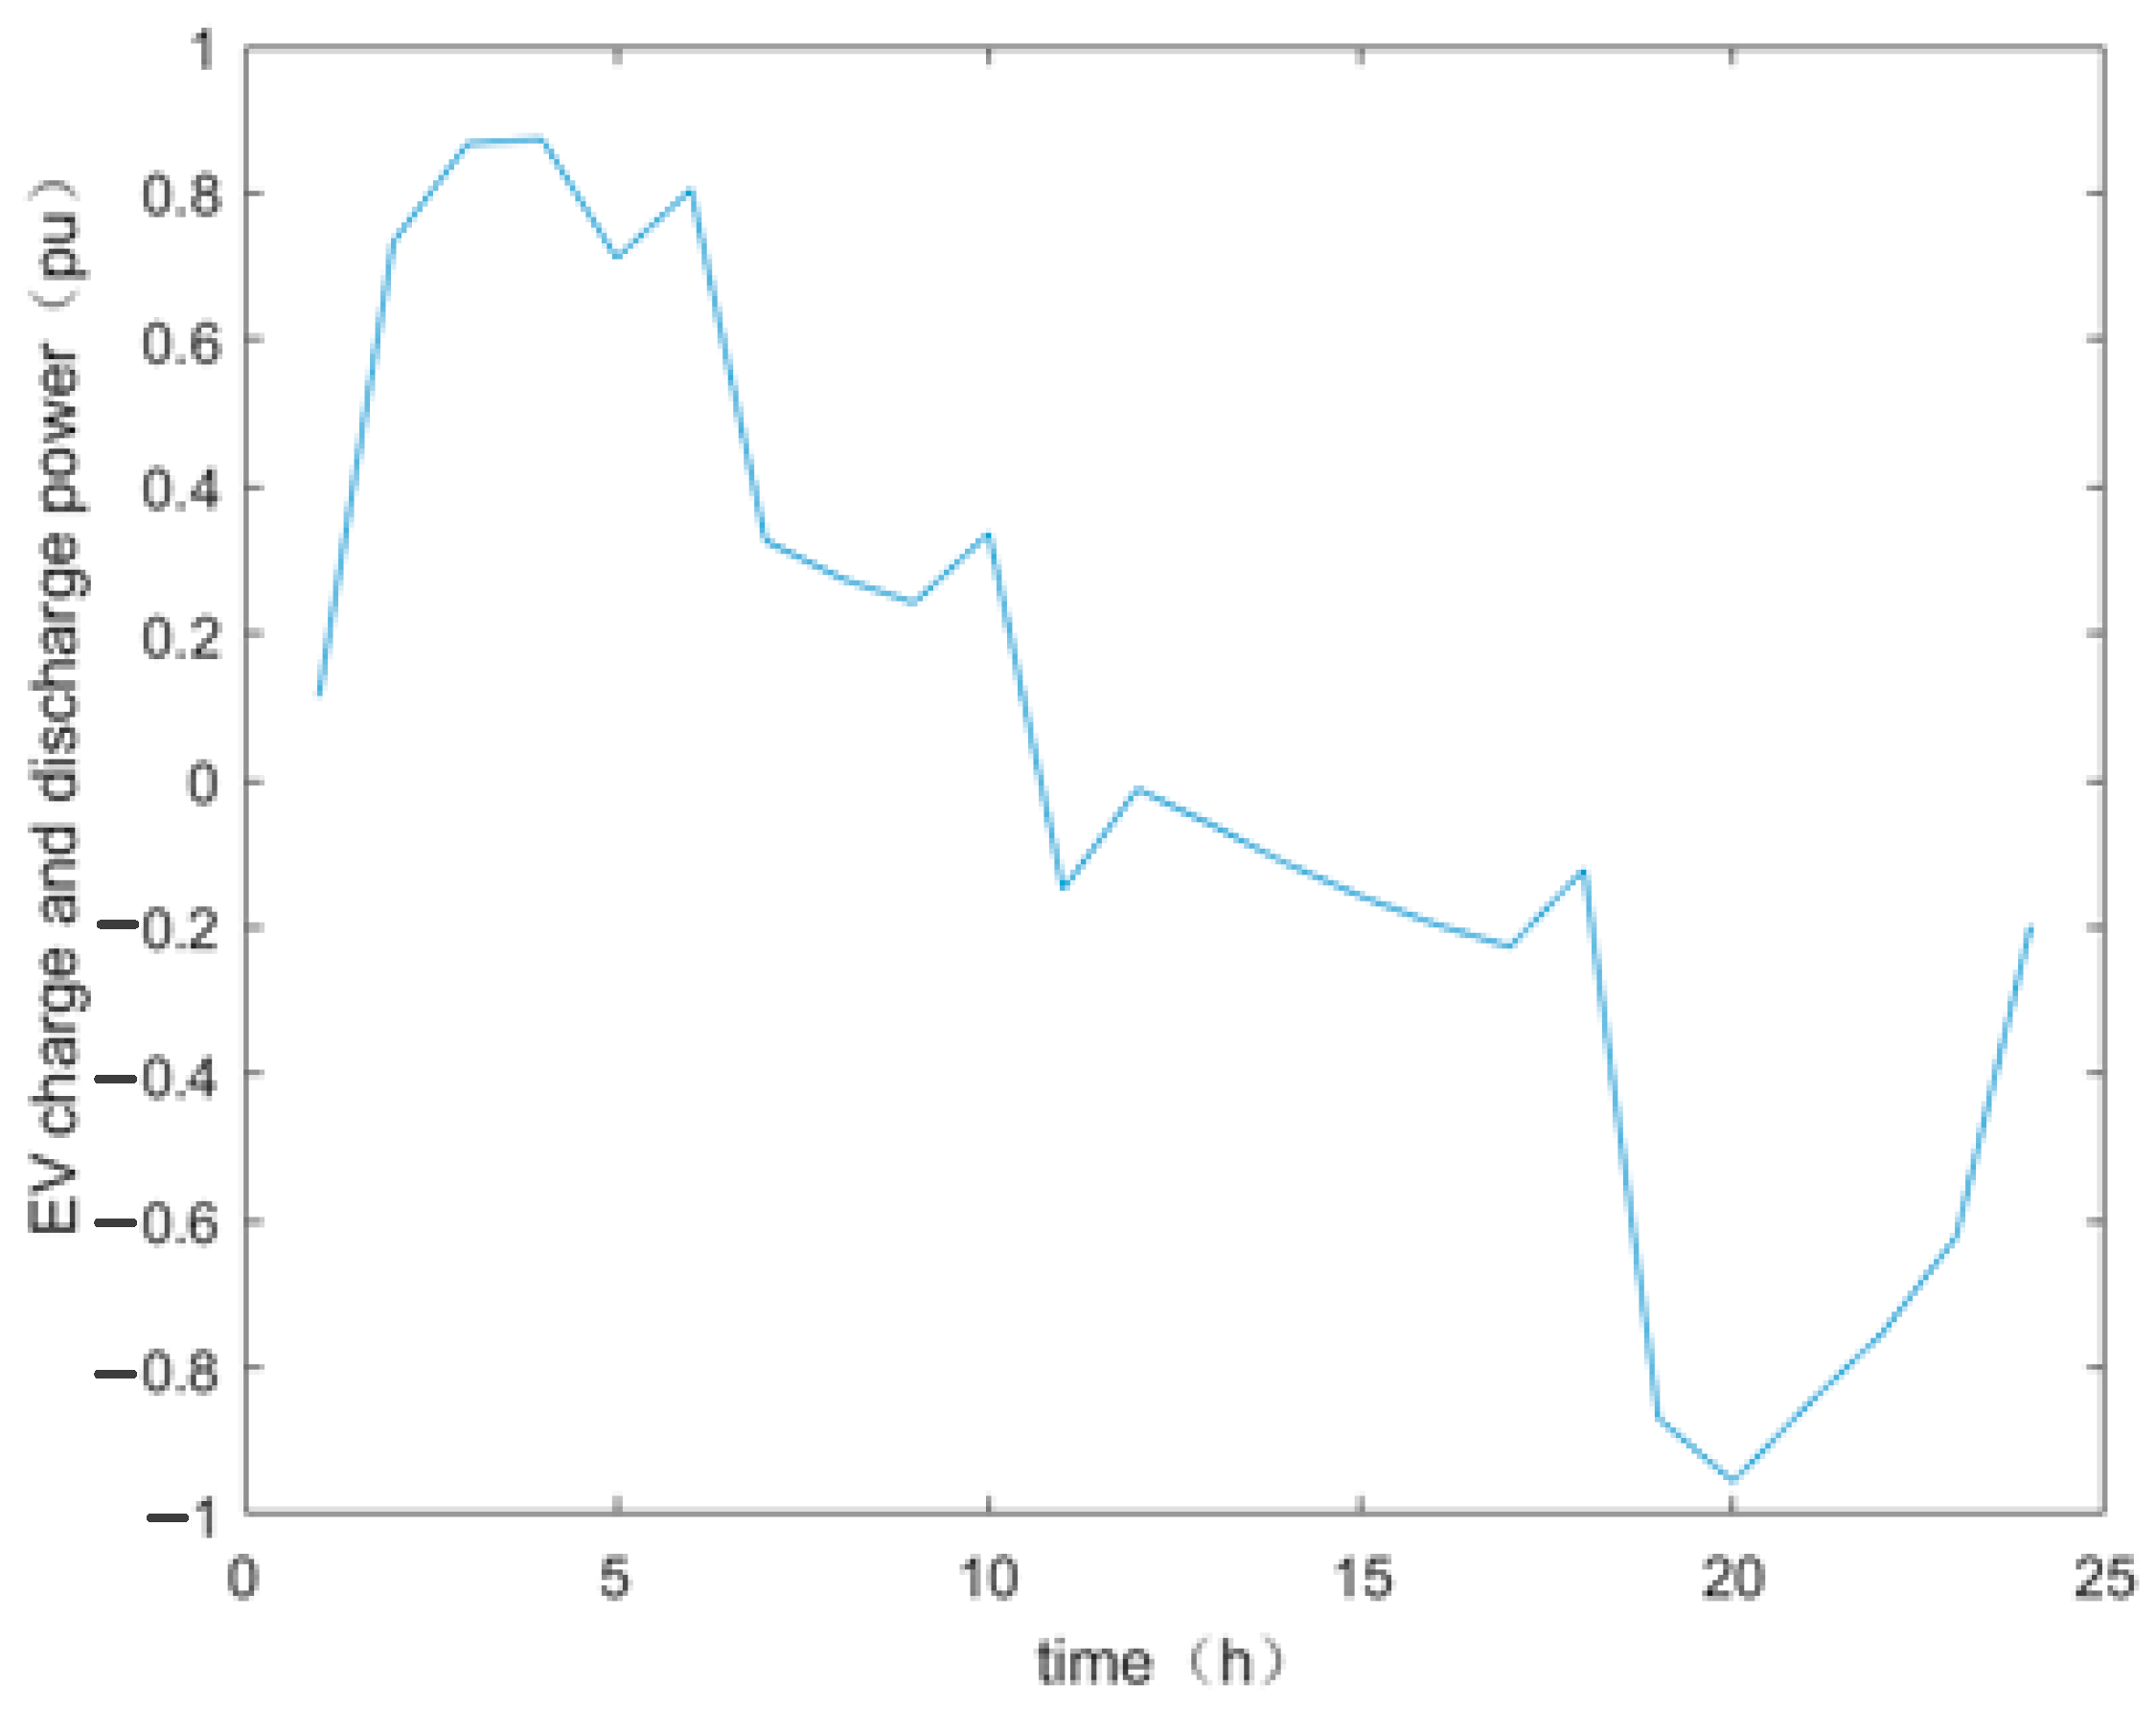
The 24 h node active load distribution diagram in Scenario 3 is shown in Figure 11. It can be found that when EVs are distributed in more nodes, the active load of some nodes will be negative at some moments, indicating that the EVs discharge power more at this moment. The total charging and discharging power diagram of the EVs is shown in Figure 12. The EVs are heavily charged around 4:00 and discharged around 20:00.
The 24 h power loss curves of the system in the three different scenarios are contrasted in Figure 13. In Scenario 1 and Scenario 2, the largest power loss of the system is at 5:00, which is because the new energy output is preferentially absorbed under the objective function of minimum carbon emission and power loss, changing the power flow distribution in the system, with the result of an unreasonable power flow distribution in some lines and increased power loss. In addition, EVs mainly charge around 5:00, the charging load of the electric vehicles will increase the network loss, and the network loss in Scenario 2 and Scenario 3 will be reduced compared with Scenario 1, which shows that the orderly charging and discharging of EVs will improve the power flow distribution of the system and reduce the network loss of the system. The shape of the network loss curve is closely related to the topology of the distribution network and the load of nodes.
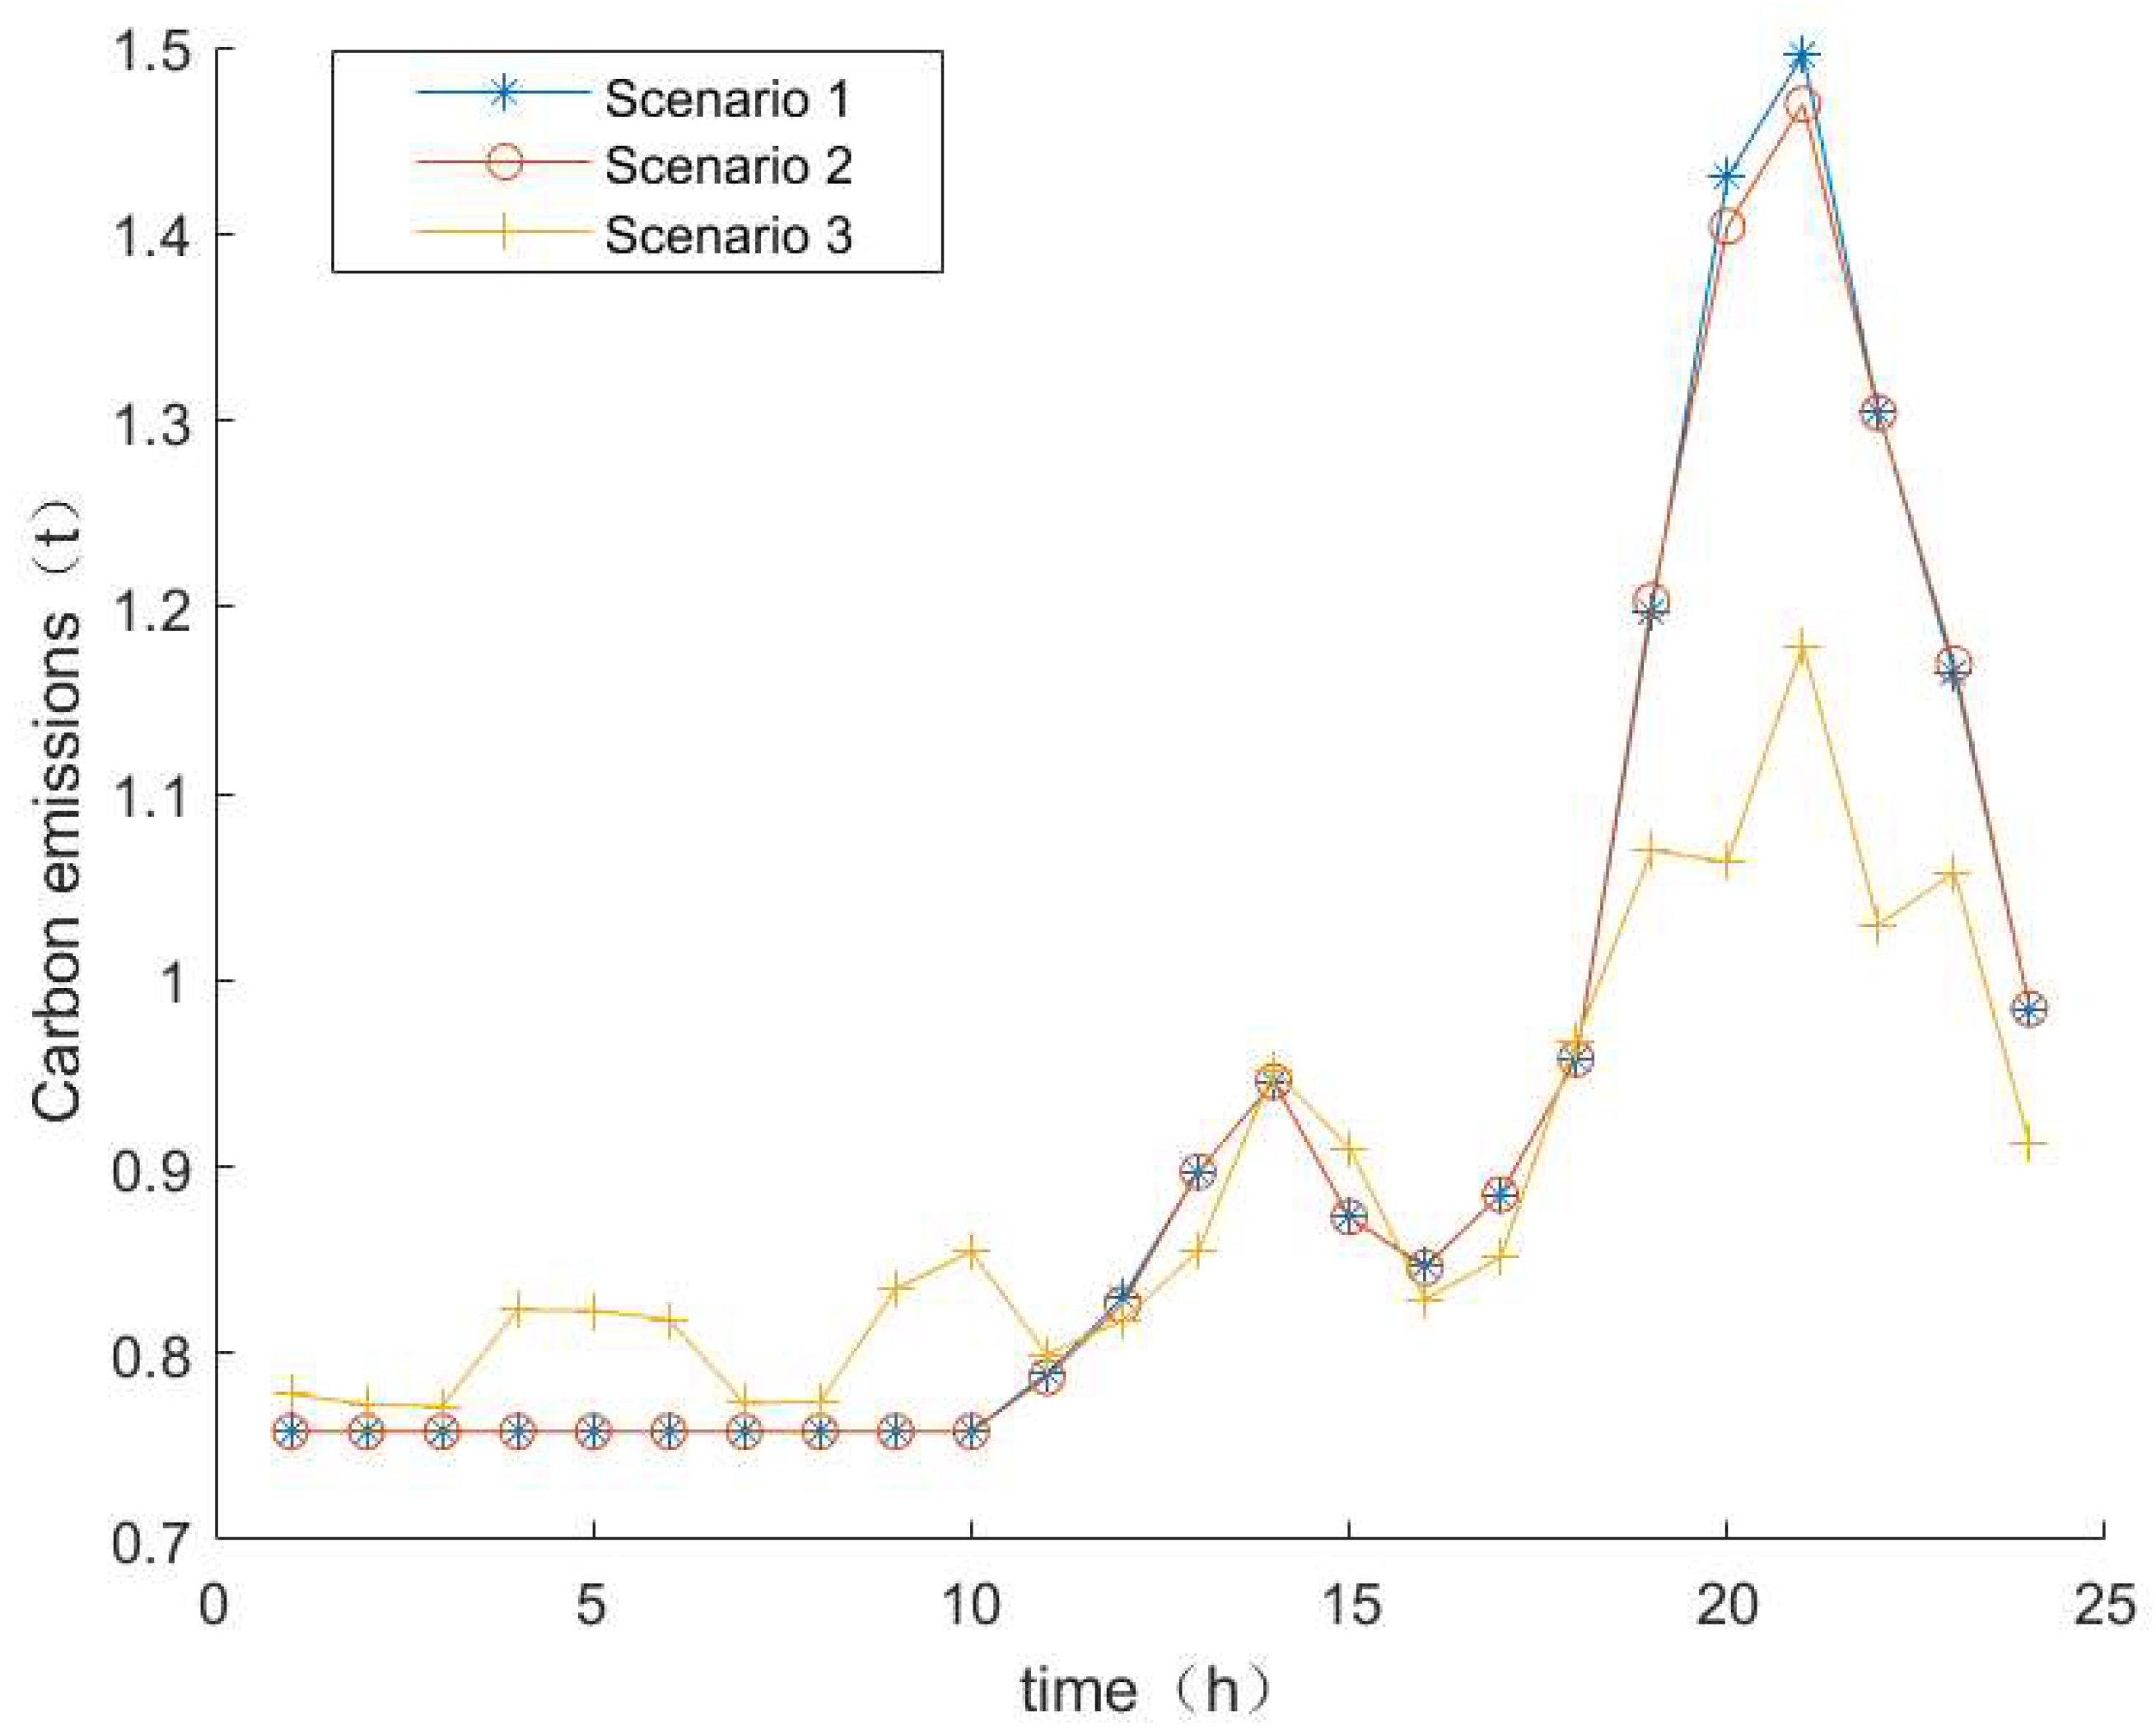
The 24-h carbon emission curves of the system under the three different scenarios are shown in Figure 14. It can be seen that the carbon emission is the largest at 20:00 and 21:00 because most of the load is borne by the units with higher carbon emission intensity at this time, resulting in an increase in the carbon emission of the system. Compared with Scenario 1, the carbon emissions in Scenario 2 and Scenario 3 are reduced, and the power loss is more stable and even in Scenario 3.
Taking the network loss and carbon emissions in Scenario 1 as a reference, the evaluation indexes of network carbon reduction and loss reduction benefits in Scenario 2 and Scenario 3 under the coordinated transportation–electricity network are calculated, respectively. The index data are shown in Table 1 and Table 2, where transmission line loss, transmission line loss rate, the effective utilization rate of new energy, access rate of distributed power supply, peak–valley difference in the power grid, load rate, power saving rate, cost-saving benefit, total carbon dioxide emission of the system, and carbon reduction rate are included.
Comparing the network losses in the three scenarios, it can be seen that the access of EVs to the power grid will change the power flow distribution of the system and then bring about changes in the network losses and carbon emissions of the system. In Scenario 3, the network loss and loss rate are the smallest, which represents that more users participating in EV orderly charging and discharging will bring more economic benefit to the power system and reduce losses. Because new energy units have better low-carbon properties, the new energy units will be given priority under the principle of minimum carbon emission of the objective function. With the wider distribution of EVs, the higher the effective utilization rate of new energy. In the IEEE 33-bus system, a certain installed capacity of new energy units is set, so the access rate of the distributed power supply is unchanged.
By analyzing the load index data, it can be concluded that EVs have the same charging and discharging properties as energy storage, which can avoid charging electric vehicles during peak power consumption, effectively reducing the peak–valley difference in distribution network load and improving the load rate. When the gap between the peak load and the valley load decreases, the operating load tends to be balanced, and the increment of current change becomes smaller, so the loss caused by power system transmission decreases as well.
Among the economic indicators, with the more extensive distribution of EVs, the power saving, power saving rate, and cost saving in power systems are increasing. The reduction in line loss can achieve the effect of energy saving and carbon reduction in the power system. The benefits of cost savings include the profits of electricity selling and carbon quota trading; namely, the benefits can be increased by selling the saved electric energy and trading the surplus carbon quota.
In terms of emission indicators, due to the increase in the number of EVs, there is more room for load adjustment, resulting in the smaller peak–valley difference in loads. Additionally, the electricity demand of more loads is provided by clean energy, which causes the total carbon emission in the power system to decrease, while the carbon reduction rate increases.

4.3. Actual Scenario Analysis

In a 10 kV distribution network in a certain urban area of the Jiangsu Power Grid, an equivalent 11-node system is shown in Figure 15. The equivalent parameters of the generator, branch, and load are shown in Table 3, Table 4 and Table 5, respectively.
When different nodes in the distribution network are connected to new energy distributed energy storage, the system’s network loss and carbon emissions will change. By traversing each node of the distribution network system, the network loss and system carbon emissions will be calculated, as shown in the table below.
In Table 6, it can be seen that except for when the distributed power supply is connected to node 2, the system has a high network loss value and minimal carbon emissions. When the distributed power supply is installed in other locations, there is a consistent trend of reducing network loss and carbon emissions. This phenomenon may be caused by the high resistance and reactance values of branches 1–2, as well as the high active load at node 2. Node 2 is directly connected to the coal-fired unit. However, when distributed energy storage is added at node 2, the load can be directly supplied by the distributed energy storage, reducing the flow of power on the line and significantly reducing carbon emissions.
When the distributed power generation is set at node 8, the grid loss is minimized and the carbon emissions of the system are also at a relatively low level. At this point, the power supply structure of the distribution network is shown in Table 7.
In the case where the synergistic effect of loss reduction and carbon reduction is good, the carbon flow and loss results of each branch of the system are shown in Table 8.
In summary, when the load capacity of a node is high, installing distributed energy storage at this location not only enhances the environmental benefits of carbon reduction but also minimizes network losses to the greatest extent possible, making the optimization and synergy of loss reduction and carbon reduction the best.

5. Outlook and Limitations

The existing research is based on the optimization and synergy of existing technologies and electric vehicle resources for loss reduction and carbon reduction. The probabilistic performance of electric vehicles considering user habits, weather conditions, and other factors affecting charging and discharging patterns has not been thoroughly considered. Future research can explore the following two aspects in depth.
Electric vehicle output and optimal charging location under fixed investment can be planned and allocated, with optimization decisions at the planning level.
Apart from that, under the trend of extensive participation of load-side resources in power grid regulation, research will be conducted on the evaluation and optimization of the decision-making methods of line loss for the scaled and standardized response of load-side resources. In the case of multiple charging and swapping stations connected to the distribution system, the coefficient of influence of each node’s connected power on the system network loss is obtained, and further research is being conducted from the coupling mechanism direction on the coupling influence of electric vehicle load resource access and system line loss.

6. Conclusions

This paper proposes evaluation indicators for the carbon and loss reduction considering electric vehicles be accessed. The power grid loss reduction benefit indicator system in low-carbon scenarios can well reflect the benefits brought by energy storage from electric vehicles, such as increased output of new energy generation, reduced energy waste, and reduced carbon emissions.
Examining the nature and characteristics of indicators from different perspectives, and conducting research on the interrelationships and classifications of indicators, not only helps to select indicators to reasonably evaluate the energy efficiency of power grid loss reduction considering carbon emissions reduction but also guides the examination of the connotation of the same indicator from different perspectives and the understanding of the mutual influence between various indicators, in order to deepen the understanding of the nature and characteristics of indicators and the entire indicator system, thus helping to determine the evaluation criteria.
By conducting research on the quantitative calculation method of power loss reduction benefit indicators in low-carbon scenarios, the quantitative calculation methods of various levels of targets based on this indicator system were discussed. Taking the typical scenario of electric vehicle energy storage integration as an example, the effectiveness of the evaluation system was verified, and the conclusion was drawn that orderly charging and discharging of electric vehicles can improve system power flow distribution, reduce network losses, and reduce carbon emissions, which is conducive to further rational planning of loss and carbon reduction measures.
Overall, this paper designs two collaborative relationships. One is the collaboration between the transportation network and the electrical network, which incorporates the optimization of electric vehicle charging and discharging into the electrical scheduling and operation optimization model and proposes a carbon reduction plan for the power system. The second is the collaborative optimization of loss reduction and carbon reduction. The comprehensive benefit evaluation system links line loss with system carbon emissions and calculates and evaluates the model in typical scenarios to comprehensively obtain the optimized access strategy for electric vehicles.

Author Contributions

Conceptualization, H.A. and Q.Z.; methodology, T.Z. and H.L.; validation, H.A., Q.Z. and Y.W.; formal analysis, Y.J.; investigation, Z.C.; writing—original draft preparation, T.Z.; writing—review and editing, Y.W.; supervision, H.A., Y.J., Z.C. and B.C.; project administration, H.A. All authors have read and agreed to the published version of the manuscript.

Funding

This research was funded by [National Natural Science Foundation of China] grant number [52007032], [State Grid Jiangsu Electric Power Research Institute project] grant number [SGJSDK00XTJS2310252]. And The APC was funded by [State Grid Jiangsu Electric Power Research Institute project] grant number [SGJSDK00XTJS2310252].

Data Availability Statement

Data available on request due to restrictions. The data presented in this study are available on request from the corresponding author. The data are not publicly available due to privacy.

Conflicts of Interest

The authors declare no conflict of interest. Haiyun An, Qian Zhou, Yongyong Jia, Zhe Chen, Bingcheng Cen and Yifei Wang are employees of State Grid Jiangsu Electric Power Co., Ltd. Electric Power Science Research Institute. The paper reflects the views of the scientists, and not the company.

References

  1. Zhou, P.; Pan, X.; Li, J.; Lu, K. Energy Conservation and Emission Reduction in Power lndustry Based on Background of “Double Carbon”. Nengyuan Yu Jieneng 2023, 1, 63–65. [Google Scholar]
  2. Rodríguez, C.; Vidal, C.; Díaz, M.; Contreras, E.; Guggisberg, G.; Rivas, I. An Overview of Challenges and Benefits Associated to the Development of Vehicle to Grid Technology. In Proceedings of the 2021 IEEE CHILEAN Conference on Electrical Electronics Engineering Information and Communication Technologies (CHILECON), Valparaíso, Chile, 6–9 December 2021; pp. 1–6. [Google Scholar]
  3. Das, S.; Acharjee, P.; Bhattacharya, A. Charging Scheduling of Electric Vehicle Incorporating Grid-to-Vehicle and Vehicle-to-Grid Technology Considering in Smart Grid. IEEE Trans. Ind. Appl. 2021, 57, 1688–1702. [Google Scholar] [CrossRef]
  4. Zhang, Q.; Zhu, Y.; Wang, Z.; Su, Y.; Li, C. Reliability Assessment of Distribution Network and Electric Vehicle Considering Quasi-Dynamic Traffic Flow and Vehicle-to-Grid. IEEE Access 2019, 7, 131201–131213. [Google Scholar] [CrossRef]
  5. Tu, Y.; Wu, Z.; Huang, Q.; Liu, Y.H.; Wang, K. Contribution factor based network loss allocation for distribution network containing distributed power generation. Power Syst. Technol. 2008, 32, 86–89. [Google Scholar]
  6. Wang, X.; Ren, Z.; Chu, D. Study of algorithm on distribution network optimum reconfiguration for reducing line loss. Power Syst. Prot. Control 2008, 36, 21–24. [Google Scholar]
  7. Li, H.; Bai, X. Impacts of electric vehicles charging on distribution grid. Autom. Electr. Power Syst. 2011, 35, 38–43. [Google Scholar]
  8. Zhao, J.; Wen, F.; Xue, Y.; Dong, Z.; Xin, J. Power system stochastic economic dispatch considering uncertain outputs from plug-in electric vehicles and wind generators. Autom. Electr. Power Syst. 2010, 34, 22–29. [Google Scholar]
  9. Yu, D. Synergistic dispatch of PEVs charging and wind power in Chinese regional power grids. Autom. Electr. Power Syst. 2011, 35, 24–29. [Google Scholar]
  10. Tang, C.; Liu, M.; Liu, Q.; Dong, P. A per-node granularity decentralized optimal power flow for radial distribution networks with PV and EV integration. Int. J. Electr. Power Energy Syst. 2019, 116, 105513. [Google Scholar] [CrossRef]
  11. Ota, Y.; Taniguchi, H.; Nakajima, T.; Liyanage, K.M.; Shimizu, K.; Masuta, T.; Baba, J.; Yokoyama, A. Effect of Autonomous Distributed Vehicle-to-grid (V2G) on Power System Frequency Control. In Proceedings of the 2010 5th International Conference on Industrial and Information Systems, Mangalore, India, 29 July–1 August 2010; pp. 481–485. [Google Scholar]
  12. Dai, J.Z.; Dong, M.; Ye, R.X.; Ma, A.; Yang, W. A Review on Electric Vehicles and Renewable Energy Synergies in Smart Grid. In Proceedings of the 2016 China International Conference on Electricity Distribution (CICED), Xi’an, China, 10–13 August 2016; pp. 1–4. [Google Scholar]
  13. Wang, G.; Zhao, J.; Wen, F.; Xue, Y.; Xin, J. Stochastic Optimization Dispatching of Plug-in Hybrid Electric Vehicles in Coordination with Renewable Generation in Distribution Systems. Autom. Electr. Power Syst. 2012, 36, 22–29. [Google Scholar]
  14. Li, Q.T.; Lu, Y.; Liu, Y.; Liu, S.; Diao, X.; Zhang, Y.; Ma, Q. Distributed two-stage dispatch strategy for new energy consumption in active distribution Network. Therm. Power Gener. 2022, 51, 54–62. [Google Scholar]
  15. Farh, H.M.H.; Al-Shaalan, A.M.; Eltamaly, A.M.; Al-Shamma’A, A.A. A Novel Crow Search Algorithm Auto-Drive PSO for Optimal Allocation and Sizing of Renewable Distributed Generation. IEEE Access 2020, 8, 27807–27820. [Google Scholar] [CrossRef]
  16. Singh, B.; Gyanish, B.J. Impact assessment of DG in distribution systems from minimization of total real power loss viewpoint by using optimal power flow algorithms. Energy Rep. 2018, 4, 407–417. [Google Scholar] [CrossRef]
  17. Reddy, M.S.K.; Selvajyothi, K. Optimal placement of electric vehicle charging station for unbalanced radial distribution systems. In Energy Sources Part A: Recovery Utilization and Environmental Effects; Taylor & Francis: London, UK, 2020; pp. 1–15. [Google Scholar]
  18. Jiang, W.; Shan, M.; Deng, Y.; Li, P.; Zhang, L. Optimization strategy for aggregating electric vehicles through Vpp to participate in the carbon market. Electr. Power Eng. Technol. 2023, 42, 13–22. [Google Scholar] [CrossRef]
  19. Qian, Z.; Jiang, Z.; Wu, Q.; Luo, L.; Li, Y.; Wu, Z. Coordinated optimization of distributed power and electric vehicle charging stations considering uncertain factors. Electr. Power Eng. Technol. 2021, 40, 131–137. [Google Scholar]
  20. Chen, Z.; Li, C.; Xu, J. Assessment index system of grid loss reduction and energy efficiency after load-network-source coordinated control. Power Demand Side Manag. 2016, 18, 5–10. [Google Scholar]
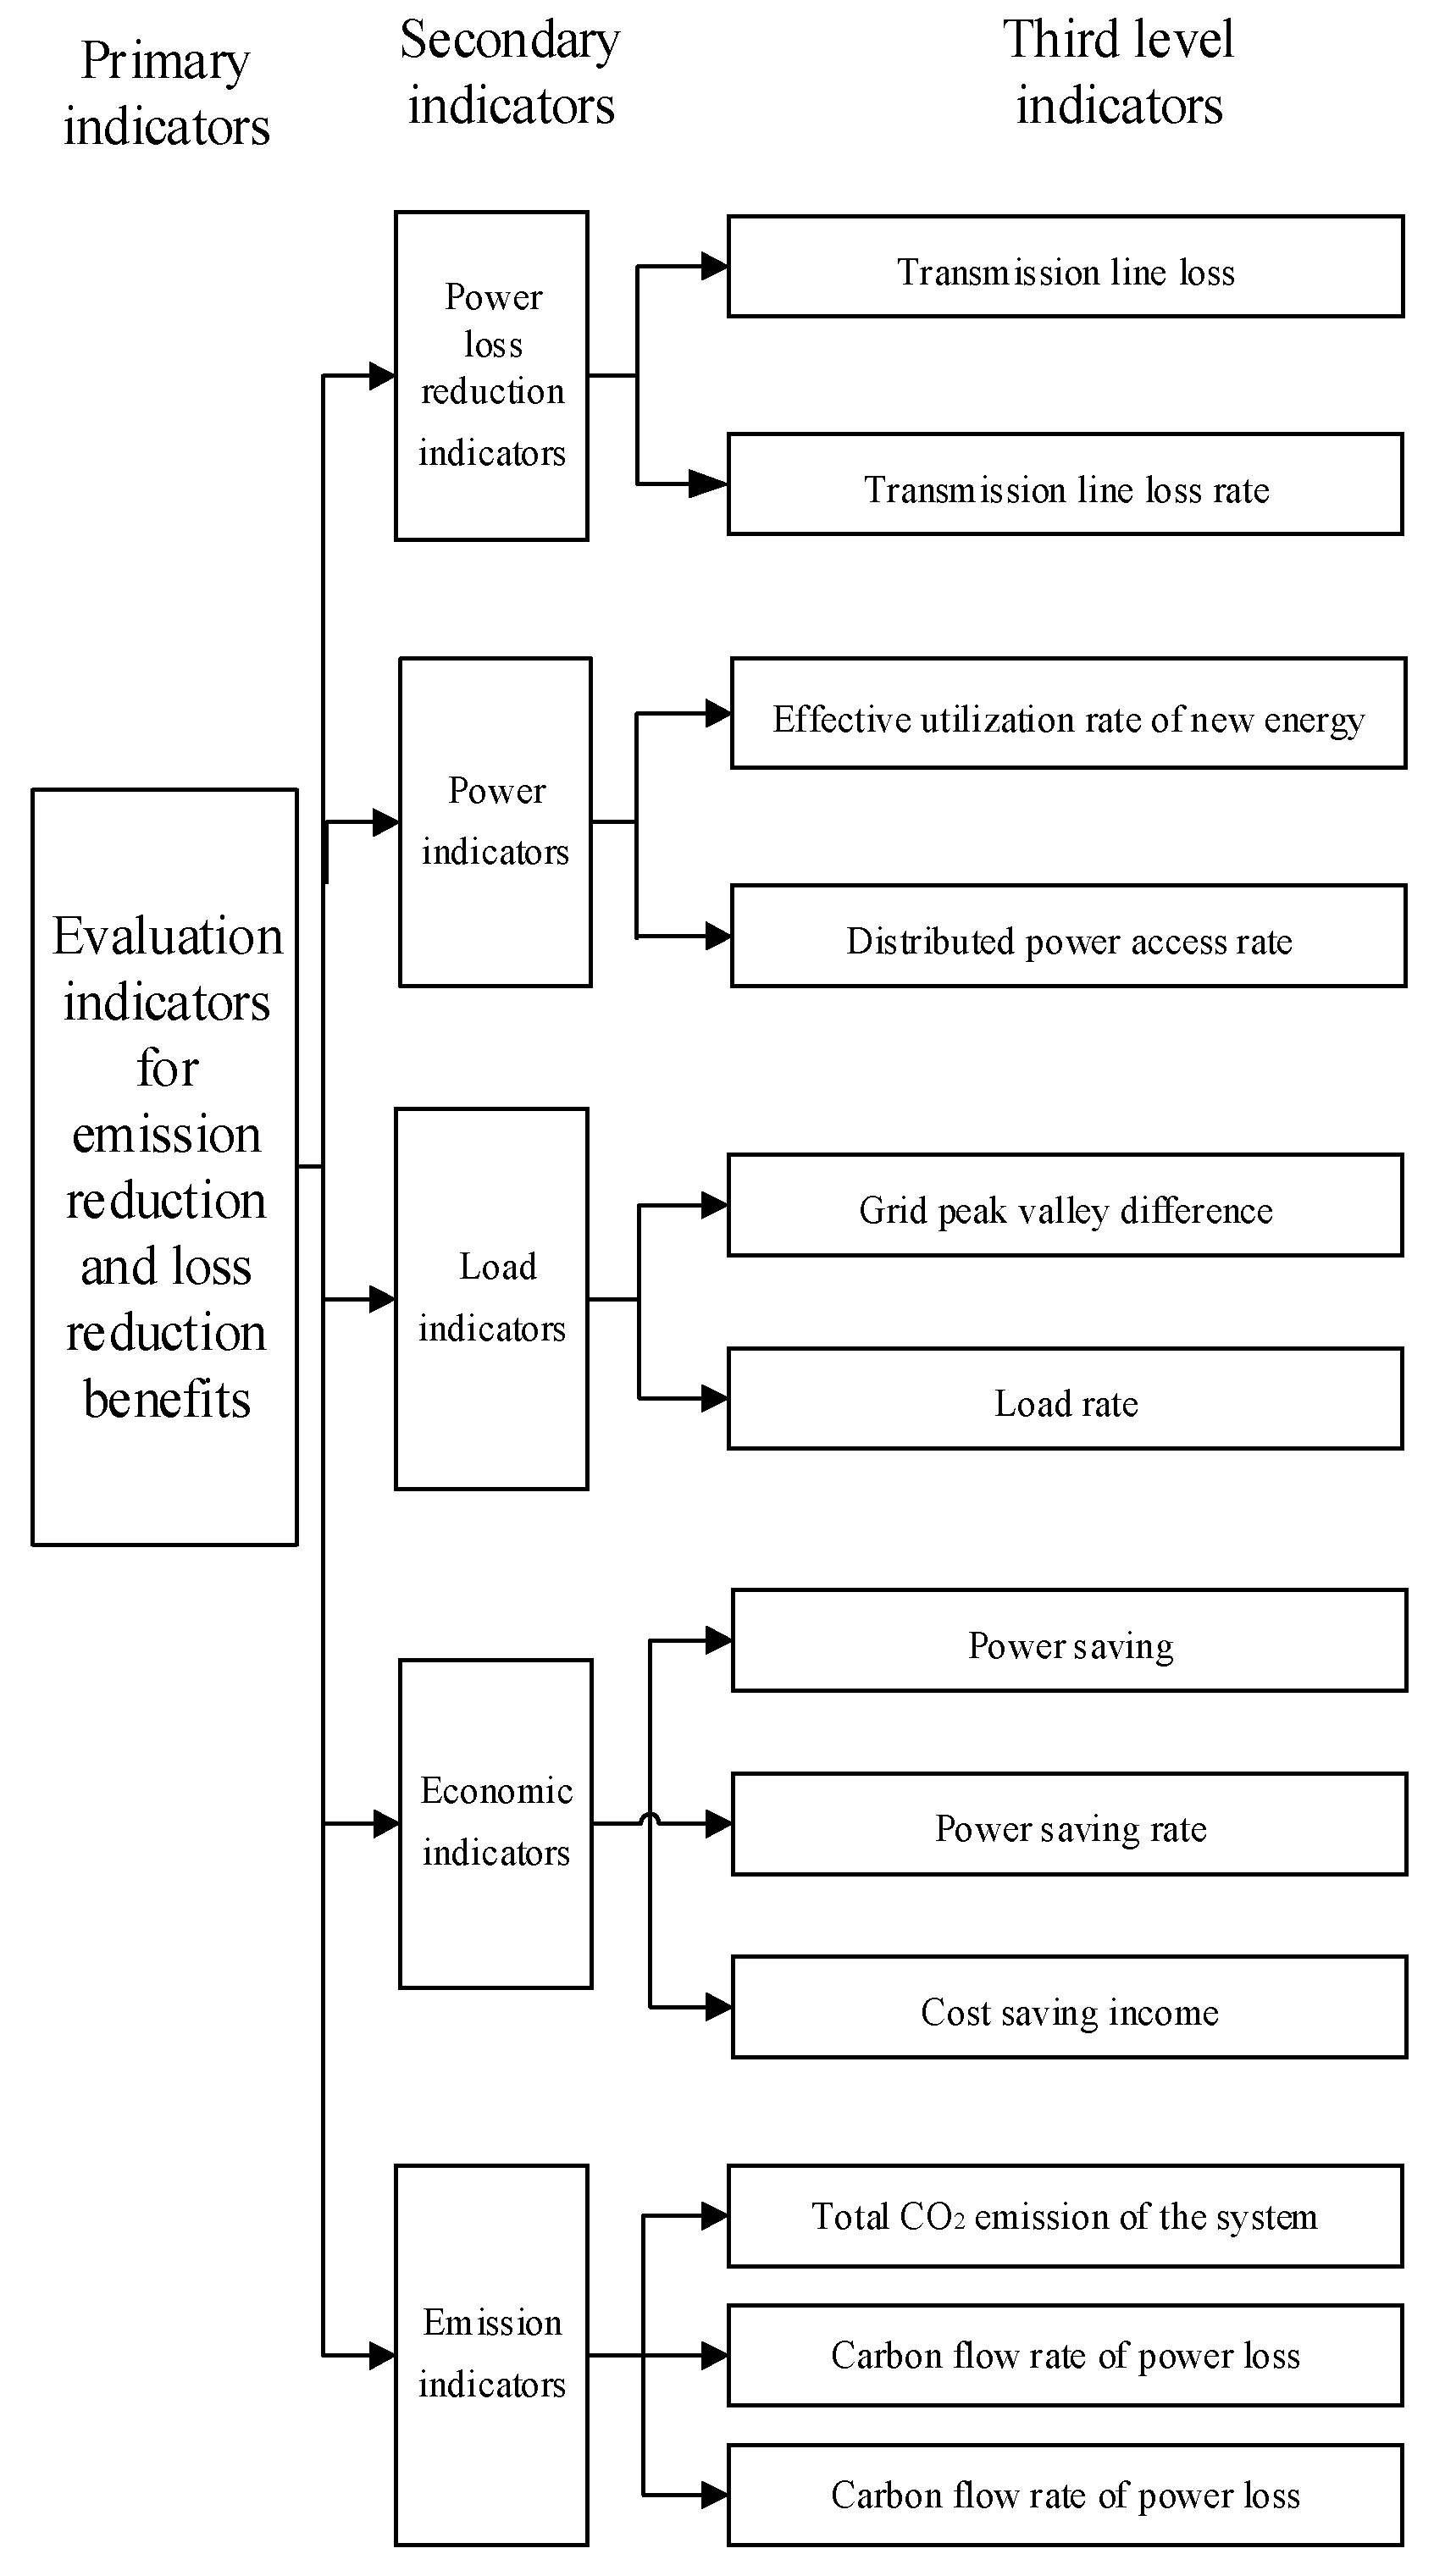
Figure 1. Assessment indicators of emission reduction and loss reduction benefits.
Wevj 15 00024 g001
Figure 2. Flow chart of analytic hierarchy process.
Wevj 15 00024 g002
Figure 3. Topological structure diagram of IEEE 33-bus.
Wevj 15 00024 g003
Figure 4. 24 h node voltage diagram of Scenario 1.
Wevj 15 00024 g004
Figure 5. 24 h active load diagram of Scenario 1.
Wevj 15 00024 g005
Figure 6. 24 h reactive load diagram of Scenario 1.
Wevj 15 00024 g006
Figure 7. 24 h node voltage diagram of Scenario 2.
Wevj 15 00024 g007
Figure 8. 24 h active load diagram of Scenario 2.
Wevj 15 00024 g008
Figure 9. EV charging and discharging power in Scenario 2.
Wevj 15 00024 g009
Figure 10. 24-h node voltage diagram of Scenario 3.
Wevj 15 00024 g010
Figure 11. 24 h active load diagram of Scenario 3.
Wevj 15 00024 g011
Figure 12. Total charging and discharging power of EV in Scenario 3.
Wevj 15 00024 g012
Figure 13. Network loss in different scenarios.
Wevj 15 00024 g013
Figure 14. Carbon emissions in different scenarios.
Wevj 15 00024 g014
Figure 15. Topological structure of 10 kV distribution network in a certain urban area of Jiangsu Province.
Wevj 15 00024 g015
Table 1. Power Grid Loss Reduction, Power Index, and Load Index in Different Scenarios.
ScenarioPower Loss Reduction IndexPower Supply IndexLoad Index
Transmission Line LossElectric Transmission Line
Attrition Rate
Effective Utilization Rate of New EnergyDistributed Power Access RatePower GridsPeak–Valley
Difference Ratio
Load Rate
12.4984.67%12.83%28.46975%72.5%55.73%
21.5443.123%18.95%28.46975%56.6%61.09%
30.57811.23%21.02%28.46975%43.61%70.39%
Table 2. Economic and Emission Indicators in Different Scenarios.
ScenarioEconomic IndexEmission index
Power Saving
(MW)
Power Saving RateCost-Saving Benefit
(Yuan)
Total CO2 Emission of the System (Ton)Carbon Reduction Rate
122.1807
20.95340.1766479.613422.13190.22%
31.920240.034631003.421.31493.9%
Table 3. Distribution Network Generator Parameters.
NumberNode NumberPgQgPmaxPmin
11163.602000
Table 4. Distribution Network Branch Parameters.
NumberFromTorx
1120.2154930.280257
2130.0359760.046788
3140.0292380.038025
4150.05920.030653
5160.019040.009859
6670.026880.013918
7680.0069180.008998
8690.00240.001243
96100.0330880.043032
1010110.015680.008119
Table 5. Distribution Network Load Parameters.
NumberNode NumberPdQd
1147.81.6
2221.71.6
337.61.6
4411.21.6
557.61.6
66101.6
7729.51.6
8894.21.6
9929.51.6
101091.6
11113.51.6
Table 6. Network Losses and Carbon Emissions of New Energy Distributed Energy Storage Connected to Different Locations in the Distribution Network.
Distributed Energy Storage Access LocationNetwork Loss (MW)Carbon Emissions (t)
229.399143.15
319.366160.0956
416.479157.5691
519.234159.9797
611.956153.6113
79.859151.777
88.398150.498
98.568150.6471
1010.993152.769
1112.366153.9705
Table 7. Network Generator Parameters for Distributed Energy Storage Set at 8 Nodes.
NumberNode NumberPgQgPmaxPmin
11163.602000
2810801500
Table 8. Carbon Flow and Loss Results of Each Branch When Distributed Energy Storage is Installed at 8 Nodes.
Branch NumberBranch Carbon Flow Density (kgCO2/MW·h)Branch Active Network Loss (MW)Branch Reactive Power Loss (Mvar)
10.8756.4278.36
20.8750.0230.03
30.8750.0380.05
40.8750.0360.02
50.8751.2720.66
600.2430.13
70.73040.2780.36
80.73040.0290.02
90.73040.0470.06
100.73040.0020.00
Disclaimer/Publisher’s Note: The statements, opinions and data contained in all publications are solely those of the individual author(s) and contributor(s) and not of MDPI and/or the editor(s). MDPI and/or the editor(s) disclaim responsibility for any injury to people or property resulting from any ideas, methods, instructions or products referred to in the content.