Article

Research on Vertical Cooperation and Pricing Strategy of Electric Vehicle Supply Chain

School of Public Policy and Administration, Nanchang University, Nanchang 330031, China
World Electr. Veh. J. 2024, 15(6), 242; https://doi.org/10.3390/wevj15060242
Submission received: 9 May 2024 / Revised: 24 May 2024 / Accepted: 24 May 2024 / Published: 30 May 2024

Abstract

:
To determine a vertical cooperation strategy and address the optimal pricing problem of the electric vehicle (EV) supply chain, a supply chain system consisting of two competing EV manufacturers (M1 and M2) and a battery supplier is studied. Firstly, three cooperation strategy models were constructed for the battery supplier and the EV manufacturers, namely: Strategy N (neither the battery supplier nor the two manufacturers cooperate with each other); Strategy I (M1 cooperates with the battery supplier); and Strategy II (M2 cooperates with the battery supplier). Then, the Stackelberg solution method was used to obtain the optimal equilibrium decisions under the three strategic models. Finally, the effect of the preference coefficient of consumers for leasing EVs per unit on the optimal equilibrium decision was analyzed. We found that: (1) The wholesale price of batteries provided by the battery supplier to M1 is always greater than to M2. (2) Strategies I and II prompt M1 and M2 to reduce the unit and fixed rental prices of EVs to some extent, while intensifying the competition between the two manufacturers in terms of EV lease prices. (3) When the consumer preference coefficient (θ) for leasing EVs per unit provided by manufacturer M1 is relatively small, the cooperation alliance S2 and the supply chain achieve the maximum profit under Strategy II; however, while θ is large, M1, cooperative alliance S1, and the entire supply chain could benefit the most under Strategy I.

1. Introduction

In recent years, electric vehicles (EVs) and other new energy automobile industries have developed rapidly. As a major carbon emitter in the global economic industrial chain, the low-carbon, intelligent and digital transformation of EVs and the realization of dual-carbon goals have brought more multi-dimensional tests to EV enterprises. A large carbon footprint exists throughout the whole life cycle of EV products and assets. Whether through carbon reduction or carbon neutralization, addressing this footprint is a systematic project. The key is to cover the whole EV life cycle of carbon management. In the supply chain of EVs, the challenge of capacity utilization of batteries, as well as upstream and midstream materials, is becoming more and more serious. EV manufacturers directly cooperate with upstream battery suppliers to purchase key power batteries, which can effectively reduce costs and create a battery service ecosystem to achieve steady development. At present, the high proportion of battery costs and the emission of harmful gases into the environment have limited the accelerated development of EVs. In order to build a low-carbon green power battery industry system, promote the implementation of carbon footprint management of power battery production system and effectively control the total carbon emissions, it is necessary to strengthen cooperation between EV manufacturers and battery suppliers. For example, Guang qi has carried out strategic cooperation with Gan feng Lithium to promote the vertical integration of the power battery industry chain, and Greely Automobile has established a sustainable development supply chain system to realize the continuous integration and improvement of the industrial ecology. At the same time, under the pressure of competition and in rapid response to market transformation, car leasing has gradually become a hotspot of common concern to car manufacturers and car circulation enterprises. EV rental services (EV as a service) can maximize the cost advantage of vehicles and compete in the era of electrification. Therefore, based on the green low-carbon development goal of EVs and the improvement of supply chain resilience and stability, this paper focuses on the vertical strategic cooperation and pricing decision making between two competing EV manufacturers and a battery supplier. The main research objectives are as follows: (1) From a practical point of view, define three different cooperation strategies of the supply chain system composed of a battery supplier and two EV manufacturers: Strategy N (a non-cooperation strategy between the battery supplier and both manufacturers); Strategy I (cooperation between the battery supplier and manufacturer M1); and Strategy II (cooperation between the battery supplier and manufacturer M2). (2) Study the optimal decisions of EV supply chain members and the entire supply chain under different vertical cooperation strategies. (3) Explore the influence of the consumer preference coefficient ( θ ) for leasing EVs on the optimal equilibrium decision, and identify how the battery supplier and the EV manufacturers should choose the best cooperation strategy under this influence.

2. Literature Review

This article mainly studies the vertical cooperation and pricing strategies of a supply chain system composed of two EV manufacturers and a battery supplier. Research focuses on the following two aspects: cooperation strategies among supply chain enterprises and EV pricing strategies.

2.1. Cooperation Strategies between Supply Chain Enterprises

In recent years, scholars have conducted extensive research on the cooperation strategy between supply chain enterprises. Li et al. [1] studied a chain-to-chain system with price competition by introducing structural cooperation and contract cooperation of a supply chain. Huang et al. [2] analyzed the interaction between the influencing factors of Chinese manufacturers’ green supply chain cooperation and its impact on supply chain partners, and explained how these influencing factors can help improve the environmental performance of the entire supply chain. Shang et al. [3] established a competition and cooperation decision model of two manufacturers in the context of the two-way intervention of the government in green and non-green supply chains. At the same time, the Stackelberg game between the two manufacturers was explored for the case of no cooperation. The results show that cooperation between manufacturers can improve their own profits and enhance environmental welfare. Saha et al. [4] explored how the strategic cooperation between two manufacturers at the horizontal level of two competitive supply chains or between retailers at the vertical level affects product pricing decisions and supply chain performance in five scenarios. Su et al. [5] constructed a bounded rational game of horizontal and vertical enterprise network embedding behavior in a supply chain using the dynamic mechanism of biological evolution. It is shown that the probability of the supply chain enterprise to choose the network embedding strategy is related to the cooperation cost, network benefit and cooperation benefit of the enterprise. Lu et al. [6], based on the transaction cost theory, tested and discussed the impact of supply and demand cooperation on the availability of supply chain financing from the bilateral perspective of SMEs and their suppliers. Zhang et al. [7] used the Stackelberg game and the Nash game to construct a three-level supply chain system composed of manufacturers, transporters and retailers. The optimal carbon emission reduction, pricing and social welfare were studied under four scenarios, non-cooperative decision making, local cooperative decision making I, local cooperative decision making II and comprehensive cooperative decision making, in a context in which the government imposes carbon tax on carbon emitters and consumers have environmental awareness. Zhang et al. [8] studied the cooperative carbon emission reduction in a three-level supply chain system composed of manufacturers, transporters and retailers under the total carbon control and trading policy and consumers environmental awareness, and used the Stackelberg game to explore the optimal decision made by supply chain members in four cooperative decision models. This study showed that the scenario involving the full cooperation of all supply chain members performed the best in terms of carbon emission reduction, market equilibrium quantity, and supply chain system profit.
Liu et al. [9] from the perspective of decentralized decision making and centralized decision making, a two-stage model considering the degree of cooperation effort and competition of suppliers is established to solve the coordination problem of supply chain composed of two competing suppliers and a dominant retailer, and to explore the influence of the degree of cooperation effort on the profit of supply chain members. Cao et al. [10] analyzed the optimal purchasing decisions of manufacturers in a co-opetition supply chain composed of manufacturers, competitive suppliers and non-competitive suppliers and the influence of brand effect, imitation ability of competitive suppliers and raw material supply ability of non-competitive suppliers on purchasing mode selection and quality decision is studied. Liang et al. [11] constructed a non-cooperative model of the platform supply chain composed of manufacturers, online retailers and platform enterprises and a non-cooperative model under three cooperative strategies. The effects of different cooperative strategies such as cooperation between manufacturers and online retailer sand cooperation between online retailers and platform enterprises on the online distribution strategies of supply chain members and the profits of the entire platform supply chain are discussed. Zeng et al. [12] studied the risk response strategy of cooperation with competitors by modeling analysis. It is found that under the premise that the upstream supplier obtains the order and the supply disruption occurs, the replenishment cooperation option between the two manufacturers has a risk response effect, and the existence of the replenishment cooperation option will make the cooperation between the two manufacturers have an upward and downward spillover effect. Jian et al. [13] established a two-period game model between the manufacturer and the remanufacturer under the patent protection competition mode in the case of the manufacturer’s remanufacturing design, the non-patent protection competition mode and the cooperation mode. The reverse induction method is used to compare the competition and cooperation strategies of manufacturers and remanufacturers in the closed-loop supply chain under three modes.
Most of the above research on the cooperation strategy between supply chain enterprises does not consider the vertical cooperation and pricing between EV manufacturers and battery providers.

2.2. Pricing Strategy for Electric Vehicles

Some scholars have discussed the pricing strategy of EVs. Zhao et al. [14] used Stackelberg game to study the optimal pricing strategies of EV batteries in the context of government subsidies, in three different recycling channels in China in decentralized decision-making and centralized decision-making models. Wang et al. [15] aiming at the charging scenario of the Internet of vehicles and balancing the load variance and user cost, the pricing strategy and profit distribution of the EV aggregator participating in the demand response are studied by using the Shapley value-based demand response profit distribution strategy. Yang et al. [16] based on the two-stage Stackelberg game, a subsidy pricing model of EV sharing operation mode with government participation is constructed. The improved particle swarm optimization algorithm is used to determine the subsidy rate and pricing strategy to balance the interests of the three parties. Ding et al. [17] proposed a coordination model based on marginal price to study the coordination between EV charging stations and EVs. An iterative algorithm is used to obtain the optimal solution of the operation strategy of EV charging stations. Guo et al. [18] under the condition of bounded rationality, the evolutionary game theory and system dynamics method are combined to study the interaction process of EVs, and the influence of different pollution price pricing strategies on the game process is analyzed. Shi et al. [19] based on the LMP prediction, wireless charging load estimation and model predictive control framework, a composite statistical model based on graph signal processing and linear regression is proposed to predict the future location marginal price in the power grid. An effective pricing bidding strategy is developed for wireless charging roads by using a point-queue-based traffic flow model. Lu et al. [20] in order to maximize the total social welfare of stakeholders in the electrified transportation system composed of power wholesalers, fast charging stations and EV users, the Wardrop user equilibrium principle is applied to the path selection of EV users, and the non-cooperative game pricing strategy is used to solve the non-linear program to determine the optimal retail price. Wang et al. [21] under the background of ‘ carbon peak, carbon neutral, a two-level Stackelberg game pricing strategy model of EV agents in the park is established, which shows that the optimal pricing strategy of EV agents can effectively guide EV users to participate in electricity and carbon market transactions and reduce peak–valley load differences. Lu et al. [22] considering consumers’ low-carbon preference and price competition factors, this paper constructs a pricing strategy and emission reduction decision model under the ‘double points’ policy for manufacturers producing fuel vehicles and EVs and manufacturers producing only EVs, and points out that the ‘double points’ policy can reduce the price of EVs and increase the profits of manufacturers. Yi et al. [23] in the background of the coexistence of old-for-new fuel vehicles and old-for-new EVs, the optimal old-for-new strategy and pricing decision of automobile manufacturers and retailers under direct sales mode and distribution mode are studied, respectively, and it is pointed out that users in direct sales mode have more demand for old-for-new, and the overall profit of the supply chain is higher. Xu et al. [24] taking EV manufacturers and battery swapping station investors as the starting point, a three-level Stackelberg three-party game decision analysis model composed of charging vehicle manufacturers, battery swapping vehicle manufacturers and battery swapping station investors is constructed to obtain the optimal pricing and investment strategy of the EV charging and battery swapping mode. Cui et al. [25] constructed a two-level supply chain of cooperative innovation between upstream technology service providers and downstream new energy manufacturers on the basis of considering the competitive relationship and power structure of the two manufacturers. The influence of different competition modes on product pricing strategy and optimal profit of products is studied, which provides reference for the decision making of technology service providers and new energy vehicle manufacturers. Yuan et al. [26] constructed the pricing decision models of power battery supply chain without considering and considering recycling, respectively, in order to determine the influence of battery recycling on supply chain pricing decision under the BaaS mode, and then studied the supply chain system composed of battery manufacturers, automobile enterprises, battery asset companies and consumers by reverse solution method. Fan et al. [27] studied three strategies of EV supply chain composed of battery suppliers, well-known brand manufacturers and ordinary brand manufacturers: non-cooperative strategy, cooperative strategy between battery suppliers and manufacturer A and cooperative strategy between battery suppliers and manufacturer B. The optimal selling price of battery and EVs of two brands and the influence of brand effect on the optimal demand and enterprise profit of two EVs are analyzed under three strategies. Lu et al. [28] constructed the pricing decision model of battery swapping mode by using game theory based on the characteristics of electricity separation in battery swapping mode and the optimal pricing strategies of each member in the supply chain of battery swapping mode under different power structures are studied.
The above researchers analyzed the relevant strategies of the EV supply chain and the related pricing strategies of EVs. This series of research not only provided us with some valuable references for EV supply chain operation strategies, but also made important contributions to EV companies. However, existing research neglects to simultaneously consider the three competing EV manufacturers (manufacturer M1 which leases EV units to consumers and manufacturer M2 who leases EV fixed to consumers) and battery suppliers, vertical cooperation and pricing issues in the EV supply chain. Therefore, what is different from the existing research ideas is that we not only consider the vertical cooperation strategy of the EV supply chain, but also focus on the optimal pricing problem of two competing manufacturers and battery suppliers under three different cooperation strategies, to a certain extent it enriches the research on vertical cooperation and pricing decisions in the EV supply chain.
Through literature analysis, the following chapters are arranged as follows: Section 3 describes the problem and hypotheses, and Section 4 constructs the specific construction of models.

3. Problem Description and Assumptions

The EV supply chain investigated in this paper consists of a single battery supplier S, an EV manufacturer M1 who lease EV units to consumers and an EV manufacturer M2 which provide consumers with fixed leasing EVs. With the purpose of realizing the green sustainable development of supply chain and the improvement of industrial ecology, this paper explores three different cooperation strategies between battery suppliers and EV manufacturers as shown in Figure 1: Strategy N, Strategy I and Strategy II. Two competing manufacturers produce and lease EVs with a battery swapping mode. M1 provides consumers with the price p 1 of unit leasing EVs, M2 provides consumers with the fixed leasing price of p 2 . The wholesale prices of power batteries provided by battery suppliers are w 1 and w 2 , respectively. For the benefit of increasing sales and achieving greater returns, all of them will strive to maximize their own profits. In view of this, this paper explores the optimal decision making and pricing problems of EV supply chain members under three different cooperation strategies. Table 1 shows the specific model symbols and meanings involved in this paper.
For the convenience of analysis, the relevant definitions are shown in Table 1. The superscripts N, I and II represent Strategy N, Strategy I and Strategy II, respectively.
In the meantime, the article has the following basic assumptions: (1) It is assumed that in the competitive EV market, the EVs produced by manufacturers M1 and M2 are only provided to consumers in the form of unit leasing and fixed leasing. (2) Paper mainly studies the vertical cooperation strategy and the optimal rental price of supply chain members, Consequently, the research on the retail price of EVs between retailers and manufacturers are devoid of analysis. (3) Similar to Lu et al. [14] and Yi et al. [23] we make assumption that the utility obtained by heterogeneous consumers for unit leasing the EVs of M1 and EVs provided by unit leasing manufacturer M1 and fixed leasing fixed leasing from M2 are u 1 and u 2 , the random variable v is the consumer’s valuation of the EVs, and v obeys the uniform distribution on [ 0 , 1 ] . The leasing price will have a negative impact on the utility u , but the consumer’s leasing preference coefficient θ ( 0 < θ < 1 ) will take positively impact on the utility. (4) According to Fan et al. [4] the relationship between the production cost of the battery supplier and the remaining production cost of the two manufacturers is assumed to be: c < c 2 < c 1 .
Through the purchasing behavior of consumers, there are three choices which are afforded by EV manufacturers M1 and M2 to consumers: (1) unit leasing M1’s EVs; (2) fixed leasing EVs provided by M2; (3) they do not make any choice. The utility function satisfying the above consumer choices are:
u 1 = v 1 + θ n p 1
u 2 = v p 2
u 3 = 0
From the above-mentioned utility functions, it is easy to know that the consumer utility u 1 and u 2 are greater than zero and u 1 u 2 > 0 . Consumers are willing to make options with unit leasing the EVs of M1. Otherwise, consumers prefer EVs with fixed leasing from M2. On the basis of heterogeneous consumers, different purchase behaviors and the non-negative nature of their demand, we make the hypothesis: 0 < p 2 < n p 1 p 2 θ < 1 , when u 1 > u 2 > 0 , the demand function of the consumer unit leasing EVs can be calculated:
D 1 = n p 1 p 2 θ 1 1 d v = θ n p 1 + p 2 θ
Similarly, the demand function of fixed leasing EVs can be attained:
D 2 = p 2 n p 1 p 2 θ 1 d v = n p 1 p 2 θ p 2 θ

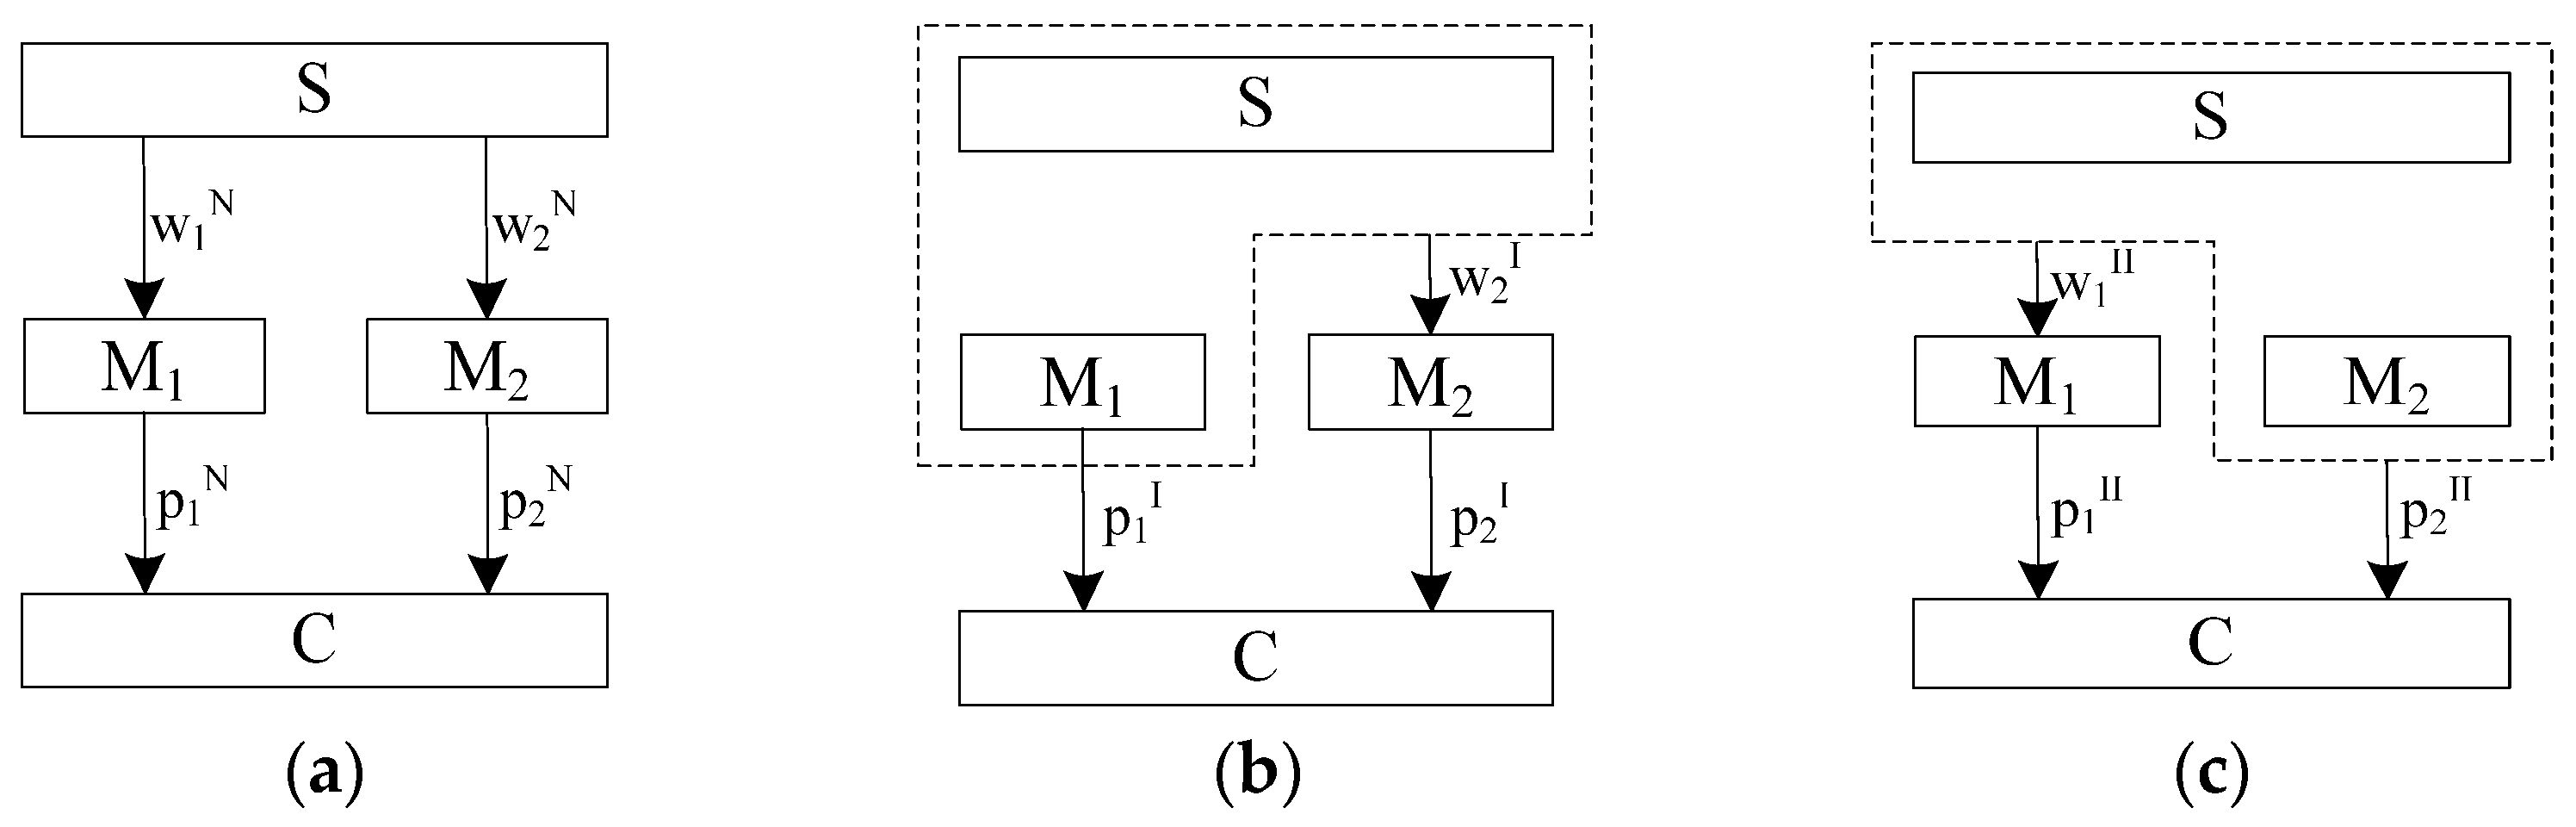
4. Models Construction

Based on the above analysis, this section mainly studies three different cooperation strategies of the supply chain composed of battery suppliers and EV manufacturers: Strategy N (A non-cooperation strategy between battery suppliers and both manufacturers); Strategy I (cooperation strategy between battery supplier and manufacturer M1) and Strategy II (cooperation strategy between battery supplier and manufacturer M2). At the same time, the optimal decisions of EV supply chain members and the entire supply chain under different vertical cooperation strategies were studied, as well as the impact of the preference coefficient θ of consumer unit lease EVs on the optimal equilibrium decision.

4.1. Strategy N (A Non-Cooperation Strategy between Battery Suppliers and Both Manufacturers)

In this section, the battery supplier and the two manufacturers do not cooperate, which is abbreviated as Strategy N. The main decision variables include manufacturer M1 provides consumers with the price p 1 of unit lease EVs, M2 provides consumers with the price p 2 of fixed-lease EVs and the battery supplier provides manufacturers with the wholesale price of battery is w 1 and w 2 . According to Strategy N, the battery supplier is the leader of the cooperation strategy, and the manufacturers M1 and M2 are followers. So, the profit function of the two manufacturers and the battery supplier are as follows:
π 1 N p 1 N , w 1 N = D 1 N n p 1 N c 1 w 1 N
π 2 N p 2 N , w 2 N = D 2 N p 2 N c 2 w 2 N
π s N w 1 N , w 2 N = D 1 N w 1 N c + D 2 N w 2 N c
According to the reverse induction method of game theory, the equilibrium solution is solved. Firstly, the optimal solution is obtained for manufacturer M1 and M2. Using Nash equilibrium, the optimal reaction function of supplier S can be obtained as:
p 1 N = 1 + θ 2 θ + 2 c 1 + c 2 + 2 w 1 N + w 2 N n 4 θ + 3             p 2 N = θ 1 + 2 c 2 + 2 w 2 N + c 1 + 2 c 2 + w 1 N + 2 w 2 N 4 θ + 3
Insomuch that the second-order partial derivatives: 2 π 1 N p 1 N 2 = 2 n 2 θ < 0 and 2 π 2 N p 2 N 2 = 2 1 + θ θ < 0 , wherefore, π 1 N and π 2 N , are concave functions with respect to p 1 N and p 2 N , respectively, then the profit functions π 1 N and π 2 N have approached the unique and ultimate values. Substituting the best-response function into the profit function π s N , we can see that the Hessian matrices of π s N with respect to w 1 N , w 2 N is: 2 1 + 2 θ θ 4 θ + 3 2 1 + θ θ 4 θ + 3 2 1 + θ θ 4 θ + 3 2 1 + θ 1 + 2 θ θ 4 θ + 3 , in this formula, the first-order order principal of the master type is less than zero, the second-order order principal sub-formula is 4 1 + θ θ 4 θ + 3 > 0 , the Hessian negative definite condition is absolutely established. At this moment, π s N is a jointly concave function for wholesaling prices w 1 N and w 2 N . Concomitantly, in accordance with the characteristics of consumers heterogeneity, knowing that there is an optimum equilibria solution condition: c + 2 c 1 c 2 2 + c 2 + c 4 c 1 2 c 2 4 + 4 c 1 c 1 c 2 + c 2 2 2 4 < θ < c 1 c 2 2 c + c 2 1 under Strategy N. The first-order partial derivatives of w 1 N and w 2 N are calculated for π s N and set to be zero. When this condition c + 2 c 1 c 2 2 + c 2 + c 4 c 1 2 c 2 4 + 4 c 1 c 1 c 2 + c 2 2 2 4 < θ < c 1 c 2 2 c + c 2 1 is filled, the optimal battery wholesale price given by S to M1 and M2 under Strategy N is:
w 1 N = 1 + θ + c c 1 2 w 2 N = 1 + c c 2 2        
The optimal prices of EVs that M1 and M2 provide consumers with unit leases and fixed leases are:
p 1 N = 1 + θ 6 θ + 2 c 1 + c 2 + 3 c + 3 2 n 4 θ + 3
p 2 N = 3 c + θ 2 c + 2 c 2 + 5 + c 1 + 2 c 2 + 3 2 4 θ + 3
Thereupon, the optimal demand of consumers and the optimal profits of manufacturers and battery providers under Strategy N are:
D 1 N = 2 θ 2 + θ 2 + c 2 c 2 c 1 c 1 + c 2 2 θ 4 θ + 3
D 2 N = 1 + θ c 1 c 2 θ 2 c + 2 c 2 1 2 θ 4 θ + 3
π 1 N = 2 θ 2 + θ 2 + c 2 c 2 c 1 c 1 + c 2 2 4 θ 4 θ + 3 2
π 2 N = 1 + θ c 1 c 2 θ 2 c + 2 c 2 1 2 4 θ 4 θ + 3 2
π s N = 1 4 θ 4 θ + 3 2 θ 3 + θ 2 2 c 2 + c 2 2 + 2 c 2 2 c 1 + 2 c 2 6 c 4 c 1 + 5 + θ 3 c 2 2 + 2 c 1 2 + 2 c 2 2 c c 1 1 + 2 c 1 c 2 + 3 c 1 2 + c 1 c 2 2
The above indicates that only when the consumers’ leasing preference coefficient θ meets a certain threshold interval: c + 2 c 1 c 2 2 + c 2 + c 4 c 1 2 c 2 4 + 4 c 1 c 1 c 2 + c 2 2 2 4 , c 1 c 2 2 c + c 2 1 , the EV manufacturer and the battery supplier S under Strategy N can obtain the optimal equilibrium solution.

4.2. Strategy I (Cooperation between Battery Suppliers and Manufacturers M1)

In Strategy I, the battery supplier S and the manufacturer M1 cooperate with each other. Under this strategy, S and the M1 are leaders, M2 is followers. The profit function of M2 and the cooperative alliance S1 which composed of S and M1 are constructed as follows:
π s 1 Ι p 1 Ι , w 2 Ι = D 1 Ι n p 1 Ι c 1 c + D 2 Ι w 2 Ι c
π 2 Ι p 2 Ι = D 2 Ι p 2 Ι c 2 w 2 Ι
Under Strategy I, the optimal equilibrium solution can be found by the Stackelberg game between S1 and M2. Since there is a unique maximum when 2 π 2 Ι p 2 Ι 2 = 2 1 + θ θ < 0 , and the optimal response function of M2 is p 2 Ι = θ c 2 + n p 1 Ι + θ w 2 Ι + c 2 + w 2 Ι 2 1 + θ . According to the Hessian matrix π s 1 Ι : n 2 1 + 2 θ θ 1 + θ n θ n θ 1 + θ θ and the second-order sequential principal sub-formula 2 n 2 θ > 0 , it can be seen that π s 1 Ι has the Hessian negative definite condition. At the same time, in accordance with the purchase characteristics of heterogeneous consumers, another limitation is: 0 < p 2 Ι < n p 1 Ι p 2 Ι θ < 1 . After substituting the optimal reaction function into π s 1 Ι , the equation set π s 1 Ι p 1 Ι = 0 π s 1 Ι w 2 Ι = 0 can be resolved, and the optimal unit leasing price and the optimal battery wholesale price of the M2 are obtained:   p 1 Ι = 1 + θ + c 1 + c 2 n w 2 Ι = 1 + c c 2 2 .
It is easy to get that when c + 2 c 1 c 2 2 + c 2 + 2 2 c 1 c 2 2 + 4 c 1 c 1 c 2 + c 2 2 2 4 < θ < c 1 c 2 c + c 2 , there is an optimal equilibrium solution for both S1 and M2 under Strategy I, and the optimal equilibrium solution is:
w 2 Ι = 1 + c c 2 2
p 1 Ι = 1 + θ + c 1 + c 2 n
p 2 Ι = θ 2 + c + c 2 + 2 c + 2 + c 1 + c 2 4 1 + θ
D 1 Ι = 2 θ 2 + θ 2 c + c 2 2 c 1 c 1 + c 2 4 θ 1 + θ
D 2 Ι = c 1 c 2 θ c + c 2 4 θ
π s 1 Ι = 2 θ 3 + θ 2 c 2 + 2 c c 2 + c 2 2 4 c 4 c 1 + 4 + θ 2 c 1 2 + c 1 2 c 2 c 2 4 + 2 c 2 2 + 2 c c 2 + 2 c 1 2 + c 1 c 2 2 8 θ 1 + θ
π 2 Ι = θ c + c 2 c 1 + c 2 2 16 θ 1 + θ

4.3. Strategy II (Cooperation between Battery Supplier and Manufacturer M2)

This section mainly discusses the optimal pricing strategy of the cooperative alliance S2 that composed of S and M2. In Strategy II, the S2 is the leader and M1 is the follower. It is easy to know the profit functions of the this two are:
π 1 p 1 = D 1 n p 1 c 1 w 1
π s 2 p 2 , w 1 = D 1 w 1 c + D 2 p 2 c 2 c
By using a similar method to Strategy I, the cooperative alliance S2 and the manufacturer M1 are subjected to the Stackelberg game to obtain the optimal equilibrium solution. In the same way, there is a unique maximum value when 2 π 1 p 1 2 = 2 n 2 θ < 0 , we have obtained that the optimal reaction function of M1 is p 1 = θ + c 1 + p 2 + w 1 2 n , the Hessian matrix for profit of M2 is 1 + 2 θ θ 1 θ 1 θ 1 θ . Since the second-order sequential principal formula is 2 θ , which is greater than zero, the negative invariance of the Hessian matrix holds. Satisfied simultaneously: 0 < p 2 < n p 1 p 2 θ < 1 . The first-order partial derivatives of p 2 and w 1 under π s 2 are calculated and set to be zero, the simultaneous solution is obtained: p 2 = 1 + c + c 2 2 n w 1 = θ + 1 + c c 1 2 Similarly, when c 1 c 2 < θ < c 1 c 2 2 c + c 2 1 , the cooperative alliance S2 and the M1 under Strategy II have the optimal equilibrium solution as follows:
w 1 = θ + 1 + c c 1 2                                                                                                                                                                                           p 1 = 3 θ + c 1 + 2 + 2 c + c 2 4 n                                                                                                                                                                 D 1 = θ c 1 + c 2 4 θ                                                                                                                                                                                                         D 2 = θ 1 2 c 2 c 2 + c 1 c 2 4 θ                                                                                                                                                 π 1 = c 1 c 2 θ 2 16 θ                                                                                                                                                                                                 π s 2 = θ 2 + θ 2 c 2 2 + 2 c 2 2 c 1 + 2 c 2 4 c 2 c 1 + 2 + c 1 c 2 2 8 θ

4.4. Comparative Analysis of Different Strategies

Next, the article will mainly explain and compare the optimal pricing and leasing prices of EV supply chain members under different cooperation strategies and the changes in optimal decision making under the influence of the preference coefficient θ of consumers’ unit leasing EVs. Forasmuch as there are many factors to be considered in the actual situation of the EV supply chain, it is very complicated to establish models, so it is difficult to compare the relationship between the optimal decision variables in these models. On the basis of the relevant data of the EV supply chain and the original data from Lu et al. [14] and Fan et al. [4], the following parameters: c = 0.2 ,   c 1 = 0.4 ,   c 2 = 0.22 ,   θ ~ 0.2 , 0.4 ,     N ~ 24 , 96 are set up for example analysis by SPSS analysis and mathematical calculation.

4.4.1. Comparative Analysis of Optimal Pricing for θ

Based on the specific economic data of NIO annual report published on NIO’s official website, as well as numerical simulation analysis and mathematical calculation processing using SPSS database, the following data table (Table 2) for the impact analysis of the optimal prices of new energy EV supply chain members is obtained.
In line with the contrastive analysis of the optimal pricing in Figure 2a,b, we can pick up the following proposition.
Proposition 1.
When   c + 2 c 1 c 2 2 + c 2 + c 4 c 1 2 c 2 4 + 4 c 1 c 1 c 2 + c 2 2 2 4 < θ < c 1 c 2 2 c + c 2 1 is satisfied, the monotonicity and comparative analysis of the optimal wholesale price and leasing price under the three cooperative strategies are as described below:
(a) 
The monotonicity of the optimal wholesale price:  w 1 N θ > 0 ;   w 2 N θ = w 2 Ι θ = 0 ;   w 1 Π θ > 0 ;
(b) 
The monotonicity of the optimal rental price:  p 1 N θ > 0 ; p 1 Ι θ > 0 ;   p 1 Π θ > 0 ; p 2 N θ < 0 ; p 2 Ι θ < 0 ; p 2 Π θ < 0
(c) 
Comparative analysis of the optimal wholesale price:  w 1 N > w 2 N ; w 1 N = w 1 Π ;   w 2 N = w 2 Ι ;
(d) 
Comparative analysis of the optimal rental price:  p 2 N > p 2 Ι > p 2 Π > p 1 N > p 1 Π > p 1 Ι .
When c + 2 c 1 c 2 2 + c 2 + c 4 c 1 2 c 2 4 + 4 c 1 c 1 c 2 + c 2 2 2 4 < θ < c 1 c 2 2 c + c 2 1 is established in Proposition 1, the wholesale price of the battery supplier providing power battery for M1 in 1(a) monotonically increases with the preference coefficient θ of the consumers’ unit leasing EVs. Because the greater the preference coefficient of the unit rental, the more trustworthy consumers, the battery supplier will mark up the price and acquire greater profitability. Under the three cooperative strategies in 1(b), the price of EVs leased by consumers increases monotonically with the increase in θ , while the price of fixed EVs leased by consumers decreases monotonically with θ . When M1 possess a larger preference for consumers, it will increase the leasing price to figure for more profits, while M2 will only achieve more consumers to lease by reducing the leasing price. 1(c) comparing the optimal wholesale prices under different strategies, it can be seen that the wholesale price of the power battery provided by the battery supplier for M1 is always greater than the wholesale price provided for M2. Combining with the analysis of 1(a) and (b), it is not difficult to find that the battery supplier provides this wholesale price strategy in order to better comply with the market rules of consumers, so as to make a greater profit improvement. 1(d) investigated the relationship between the optimal leasing prices. Under Strategy N, the fixed leasing price of consumers is the uppermost. Under Strategy I, the unit leasing price of consumers is the most affordable, and the fixed leasing price of consumers is greater than that under any strategy. Consequently, for the two manufacturers, their leasing prices under Strategy N are higher. For consumers, choosing Strategy I might make the unit leasing EV yield the most desirable value.

4.4.2. Comparative Analysis of Optimal Demand under Influence of θ

According to Figure 2c, the research on the optimal demand of EV supply chain members, Proposition 2 can be obtained as below.
Proposition 2.
When  c + 2 c 1 c 2 2 + c 2 + 2 2 c 1 c 2 2 + 4 c 1 c 1 c 2 + c 2 2 2 4 < θ < c 1 c 2 c + c 2 , the monotonicity and optimal demand size analysis under different cooperative strategies are as follows:
(a) 
Monotonicity of optimal demand:  D 1 N θ > 0 ;  D 1 Ι θ > 0 ;  D 1 Π θ > 0 ;  D 2 N θ < 0 ;  D 2 Ι θ < 0 ;  D 2 Π θ < 0 ;
(b) 
Comparative analysis of optimal demand: When  θ ~ 0.2 , 0.25 ,  D 2 Π > D 1 Ι > D 2 N > D 1 N > D 2 Ι > D 1 Π ; When  θ ~ 0.25 , 0.35 ;  D 1 Ι > D 2 Π > D 1 N > D 2 N > D 1 Π > D 2 Ι ; When  θ ~ 0.35 , 0.4 ,  D 1 Ι > D 1 N > D 2 Π > D 1 Π > D 2 N > D 2 Ι .
In Proposition 2, when c + 2 c 1 c 2 2 + c 2 + 2 2 c 1 c 2 2 + 4 c 1 c 1 c 2 + c 2 2 2 4 < θ < c 1 c 2 c + c 2 , (a) shows that the demand for EVs leased by consumers under the three cooperative strategies increases with the increase in θ , while the demand for fixed leasing is the opposite. (b) displays that when θ is small, the demand of consumers for fixed leasing EVs under Strategy II is the most exuberant; when θ is larger, the number of consumers who choose to lease EVs per unit under Strategy I is the maximum.

4.4.3. Analysis of Optimal Profit Changes on θ

Referring to the exploration of the influence of θ on the optimal profit of EV supply chain members in Figure 2d–f, the following propositions can be obtained.
Proposition 3.
When  c 1 c 2 < θ < c 1 c 2 2 c + c 2 1 , the analysis of the influence of θ on the manufacturer’s optimal profit under three cooperative strategies:
(a) 
Monotonicity of manufacturers’ optimal profit:  π 1 N θ > 0 ;  π 1 Π θ > 0 ;  π 2 N θ < 0 ;  π 2 Ι θ < 0 ;
(b) 
Comparison of manufacturers’ optimal profits: when  θ ~ 0.2 , 0.25 ,  π 2 N > π 1 N > π 2 Ι > π 1 Π ; when  θ ~ 0.25 , 0.3 ,  π 1 N > π 2 N > π 1 Π > π 2 Ι ; when  θ ~ 0.3 , 0.4 ,  π 1 N > π 1 Π > π 2 N > π 2 Ι .
In Proposition 3(a), when c 1 c 2 < θ < c 1 c 2 2 c + c 2 1 , the optimal profit of M1 increases monotonically with the leasing preference coefficient θ , while the optimal profit of M2 is opposite to M1. Proposition 3(b) analyzes that when θ is small, the optimal profit of M2 under Strategy N is the largest, and the profit of M1 under Strategy II is the lowest. However, when θ is enough large, M1 is more profitable under Strategy N and M2 does not take any advantage under Strategy I.
Proposition 4.
When  c 1 c 2 < θ < c 1 c 2 2 c + c 2 1 , we can attain the analysis of the influence of  θ  on the optimal profit of cooperative alliance under three cooperative strategies:
(a) 
The monotonicity of the optimal profit of the cooperative alliance: π 1 N   +   π s N θ > 0 ;   π s 1 Ι θ > 0 ;   π 2 N + π s N θ > 0 ;   π s 2 Π θ > 0 ;
(b) 
Comparative analysis of the optimal profit of cooperative alliance: when  θ ~ 0.2 , 0.25 ,   π s 2 Π > π 2 N + π s N > π s 1 Ι > π 1 N + π s N ; when  θ ~ 0.25 , 0.3 ,  π s 1 Ι > π s 2 Π > π 1 N + π s N > π 2 N + π s N ; when  θ ~ 0.3 , 0.4 ,  π s 1 Ι > π 1 N + π s N > π s 2 Π > π 2 N + π s N .
When c 1 c 2 < θ < c 1 c 2 2 c + c 2 1 , Proposition 4(a) demonstrates that the optimal profit of the cooperative alliance increases with the leasing preference coefficient θ . Regardless of the value of θ , the optimal total profit of supply chain members under Strategy N is always smaller than that of cooperative alliance in 4(b). When the leasing preference coefficient θ is small, the profit of S2 under Strategy II is greater than that of any other strategy. When θ is greater, the cooperative alliance S1 under Strategy I has the largest profit.
Proposition 5.
When  c 1 c 2 < θ < c 1 c 2 2 c + c 2 1 , the analysis of the impact of  θ  on the optimal profit of the entire supply chain under three cooperative strategies:
(a) 
Monotonicity of the optimal profit of the whole supply chain:  π 1 N + π 2 N + π s N θ > 0 ;  π s 1 Ι + π 2 Ι θ > 0 ;  π 1 Π + π s 2 Π θ > 0 ;
(b) 
The comparison of the optimal profit of the whole supply chain: when  θ ~ 0.2 , 0.25 ,  π 1 Π + π s 2 Π > π 1 N + π 2 N + π s N > π s 1 Ι + π 2 Ι ; when  θ ~ 0.25 , 0.4 ,  π s 1 Ι + π 2 Ι > π 1 N + π 2 N + π s N > π 1 Π + π s 2 Π .
In Proposition 5, when c 1 c 2 < θ < c 1 c 2 2 c + c 2 1 , the overall optimal profit of the supply chain in (a) increases monotonically on the leasing preference coefficient θ . In (b), regardless of the size of θ , the optimal total profit of the supply chain under Strategy N is always between the optimal profit of the cooperative alliance. When θ is small, the supply chain under Strategy II achieves the maximum optimal profit; when θ is large, the overall profit of the supply chain under Strategy I is the most impressive.
Combined with Propositions 1 to 4, it can be seen that: (1) The wholesale price of the power battery provided by the battery supplier for the manufacturer M1 is always greater than that provided for the manufacturer M2. (2) Strategies I and II impelled manufacturers M1 and M2 to reduce the price of EVs of unit leasing and fixed leasing in some degree, and also intensified the competition between the two manufacturers in the leasing price of EVs. (3) Strategy I can increase the demand of consumers for unit leasing EVs to a certain extent, and greatly improves the optimal profit of the M1; in the meantime, weakening the demand of consumers for fixed leasing EVs and the optimal profit of the M2, Strategy II achieves the opposite conclusion with Strategy I.

5. Conclusions

The paper takes the supply chain system composed of two competing EV manufacturers (manufacturers M1 and M2) and battery supplier S as the research object, and constructs three cooperative strategy models between them: Strategy N (S and two manufacturers are not cooperative); Strategy I (S and M1 cooperate with each other) and Strategy II (the cooperation strategy between S and M2). The optimal equilibrium decision and pricing of each supply chain member under different strategy models are explored and then the results provide the following conclusions and insights:
(1)
Under Strategy N: The EV lease prices provided by the two manufacturers are all high. When the leasing preference coefficient θ is small, the optimal profit of the M2 under Strategy N is the largest; when θ is large, M1 is more profitable under Strategy N. Regardless of the value of θ, the optimal total profit of the supply chain members under Strategy N is always less than that of the cooperative alliance, and the overall optimal total profit of the supply chain is always between the two cooperative alliances.
(2)
Under Strategy I: When the leasing preference coefficient θ is large, the consumers who choose to rent EVs per unit under Strategy I benefited the most. At this time, M1 and the cooperative alliance S1 and the entire supply chain all have made considerable profits.
(3)
Under Strategy II: When the leasing preference coefficient θ is small, the demand of consumers for fixed leasing EVs under Strategy II is the strongest, and the profit of cooperative alliance S2 is greater than that of any other strategies. Constantly, the supply chain as a whole achieves the maximum optimal profit.
At the same time, the research results can provide the following management implications:
(1)
Manufacturer M1: When the leasing preference coefficient θ is large, the optimal profit of M1 under Strategy I can be improved; and under Strategy N, the M1 is the best beneficiaries.
(2)
Manufacturer M2: When θ is small, M2 selects Strategy N and can obtain the maximum optimal profit.
(3)
Battery provider S: When θ is small, selecting Strategy II can be very beneficial to the profit of the cooperative alliance S2 increases; when the θ is large, using Strategy I can increase the profit of the cooperative alliance S1.
(4)
EV supply chain: When θ is small, the entire supply chain under Strategy II achieves the maximum profit; when θ is large, under Strategy I, the entire supply chain is the most favorable.
This research can provide a certain reference for the vertical cooperation strategy and pricing decision for EV supply chain members, and also provide relevant leasing pricing insights for EV manufacturers. However there, this paper only studies the cooperation strategy between EV manufacturers and battery suppliers, and does not involve the optimal pricing decision between manufacturers and retailers. Accordingly, considering the dual-channel car leasing strategy and cooperative decision-making strategy about the entire supply chain that is contains EV manufacturers, retailers and battery suppliers is the direction of future research.

Funding

This research received no external funding.

Data Availability Statement

The original data presented in the study are openly available in [NIO annual report on NIO’s official website] at [https://www.nio.cn/ accessed on 1 January 2024].

Conflicts of Interest

The authors declare no conflict of interest.

References

  1. Cao, Y.; Wei, P.P.; Li, Q.S. Research on Procurement and Quality Decision in Competitive Supply Chain. Chin. J. Manag. Sci. 2021, 29, 184–194. [Google Scholar]
  2. Cui, Y.; Li, Y.C.; Fu, X.B.; Tang, Y.H.; Zhong, W.Z. Double-layer Optimal Scheduling of Micro-grid System with Charging and Swapping Stations Based on Battery Swap Service Pricing Strategy and Dynamic Regulation. Power Syst. Technol. 2023, 47, 1999–2008. [Google Scholar]
  3. Ding, Z.; Lu, Y.; Lai, K.; Yang, M.; Lee, W.J. Optimal coordinated operation scheduling for electric vehicle aggregator and charging stations in an integrated electricity-transportation system. Electr. Power Energy Syst. 2020, 121, 106040. [Google Scholar] [CrossRef]
  4. Fan, Z.P.; Huang, S.; Wang, X.H. The vertical cooperation and pricing strategies of electric vehicle supply chain under brand competition. Comput. Ind. Eng. 2020, 152, 106968. [Google Scholar] [CrossRef]
  5. Guo, H.; Zhang, H.; Lu, J.; Zeng, R.; Han, T. Multi-party Evolution Stability Analysis of Electric Vehicles-Microgrid Interaction Mechanism. Intell. Comput. Theor. Appl. 2022, 133, 13–26. [Google Scholar]
  6. Huang, X.M.; Yang, S.; Shi, X.L. How Corporate Social Responsibility and External Stakeholder Concerns Affect Green Supply Chain Cooperation among Manufacturers: An Interpretive Structural Modeling Analysis. Sustainability 2021, 13, 2518. [Google Scholar] [CrossRef]
  7. Jian, J.; Hu, H.Y.; Zhang, F.T. Closed-loop supply chain competition strategy considering remanufacturing design. Comput. Integr. Manuf. Syst. 2022, 28, 3692–3706. [Google Scholar]
  8. Li, H.; Shang, M.; Qin, X.H.; Li, R.; Tan, Y. Optimal cap setting and pricing in supply chains under vertical-horizontal cooperation and cap-and-trade regulation. Rairo-Oper. Res. 2021, 55, 2487–2508. [Google Scholar] [CrossRef]
  9. Liang, K.R.; Li, D.F. Impact of Coopetition Modes on online distribution strategy in platform Supply Chain. Chin. J. Manag. Sci. 2022, 30, 306–316. [Google Scholar]
  10. Liu, Z.Y.; Liu, Y.; Li, H.A. Coordination Mechanism of Supply Chain with a Retailer and Two Competitive Suppliers. Complexity 2020, 2, 1–14. [Google Scholar] [CrossRef]
  11. Chao, L.; Qianqian, W.; Mengyuan, Z.; Junlin, Y. Research on Competitive Pricing and Emission Reduction Strategies of Automobile Manufacturers under the “Double Points” Policy. Chin. J. Manag. Sci. 2022, 30, 65–76. [Google Scholar]
  12. Lu, Q.; Liu, B.N.; Yu, K.K. Effect of supplier-buyer cooperation on supply chain financing availability of SMEs. Int. J. Logist. -Res. Appl. 2021, 25, 1244–1262. [Google Scholar] [CrossRef]
  13. Lu, Z.; Shi, L.; Geng, L.; Zhang, J.; Li, X.; Guo, X. Non-cooperative game pricing strategy for maximizing social welfare in electrified transportation networks. Int. J. Electr. Power Energy Syst. 2021, 130, 106980. [Google Scholar] [CrossRef]
  14. Lu, Z.P.; Yao, Y.F.; Lu, C.Y. Research on Pricing Strategies for New Energy Electric Vehicle Exchange Models under Differential Supply Chain Structure. Syst. Eng. 2022, 40, 28–37. [Google Scholar]
  15. Saha, S.; Nielsen, I. Strategic Integration Decision under Supply Chain Competition in the Presence of Online Channel. Symmetry 2021, 13, 58. [Google Scholar] [CrossRef]
  16. Shang, W.F.; Wang, B.Y.; Xia, D.F. A game between green and non-green supply chains considering two-way government intervention and manufacturer competition. Front. Environ. Sci. 2022, 10, 1002124. [Google Scholar] [CrossRef]
  17. Shi, J.; Yu, N.P.; Gao, H.O. Bidding strategy for wireless charging roads with energy storage in real-time markets. Appl. Energy 2022, 327, 120035. [Google Scholar] [CrossRef]
  18. Su, X.; Zhang, H.; Guo, S.B. The Applications and Complexity Analysis Based on Network Embedding Behaviors under Evolutionary Game Framework. Complexity 2020, 7, 1–23. [Google Scholar] [CrossRef]
  19. Wang, B.; Xie, M.; Ma, G.; Ding, W.; Yang, D.; Yue, H.; Zhang, Q. Research on Electric Vehicle Aggregators Participating in Demand Response Pricing Strategy and Benefit Distribution. In Proceedings of the 2022 IEEE/IAS Industrial and Commercial Power System Asia (I&CPS Asia), Shanghai, China, 8–11 July 2022; pp. 1821–1826. [Google Scholar]
  20. Wang, H.; Zheng, T.; Sun, W.; Khan, M.Q. Research on the pricing strategy of park electric vehicle agent considering carbon trading. Appl. Energy 2023, 340, 121017. [Google Scholar] [CrossRef]
  21. Xu, S.X.; Xie, B.; Qin, W. Pricing and Investment Strategies for Electric Vehicle Charging and Exchange Modes. J. Transp. Syst. Eng. Inf. Technol. 2021, 21, 184–189. [Google Scholar]
  22. Yang, J.; Lin, Y.; Wu, F.; Chen, L. Subsidy and Pricing Model of Electric Vehicle Sharing Based on Two-Stage Stackelberg Game-A Case Study in China. Appl. Sci. 2019, 9, 1631. [Google Scholar] [CrossRef]
  23. Yi, Y.Y.; Chen, J. Pricing strategies for “trade-in for new fuel vehicles” and “trade-in for new energy vehicles” programs under different supply chain models. J. Ind. Eng. 2023, 37, 80–91. [Google Scholar]
  24. Yuan, K.F.; Wen, S.; Wu, G.Q.; Li, C. Pricing decision of power battery supply chain considering gradient utilization under BaaS business model. Comput. Integr. Manuf. Syst. 2023, 10, 1–21. [Google Scholar]
  25. Zeng, N.M.; Zeng, D.L.; Ren, T.H. Equilibrium decision for competition Supply Chains with Supply Risk. J. Manag. Sci. 2023, 26, 176–192. [Google Scholar]
  26. Zhang, Y.F.; Qin, Y. Carbon emission reduction cooperation of three-echelon supply chain under consumer environmental awareness and cap-and-trade regulation. Environ. Sci. Pollut. Res. 2022, 29, 82411–82438. [Google Scholar] [CrossRef] [PubMed]
  27. Zhang, Y.F.; Qin, Y. Carbon emission reductions, pricing and social welfare of three-echelon supply chain considering consumer environmental awareness under carbon tax policy. Front. Environ. Sci. 2022, 10, 969613. [Google Scholar] [CrossRef]
  28. Zhao, X.; Peng, B.; Zheng, C.; Wan, A. Closed-loop supply chain pricing strategy for electric vehicle batteries recycling in China. Environ. Dev. Sustain. 2021, 24, 7725–7752. [Google Scholar] [CrossRef]
Figure 1. Three strategies for cooperation between battery suppliers and EV manufacturers. (a) Strategy N; (b) Strategy I; (c) Strategy II.
Wevj 15 00242 g001
Figure 2. The impact of θ on the optimal decision making of EV supply chain members. (a) The impact of θ on optimal wholesale price; (b) The impact of θ on optimal leasing price; (c) The impact of θ on optimal demand; (d) The impact of θ on Manufacturer’s profit; (e) The impact of θ on Cooperative alliance’s profit; (f) The impact of θ on Supply Chain’s profit.
Wevj 15 00242 g002
Table 1. Model symbol settings and meanings.
NotationsDescription
p i Consumer lease prices for EVs ( i = 1 represents the unit lease of EV provided by M1; i = 2 represents the fixed lease of EV provided by)
w i The wholesale price of batteries provided by the battery supplier ( i = 1 represents M1; i = 2 represents M2)
  θ Consumer preference coefficient for unit lease EVs provided by manufacturer M1 ( 0 < θ < 1 )
v Consumer valuation of leased EVs
n The times for consumers, unit lease of EVs
u i The utility of consumers leasing EVes ( i = 1 represents M1; i = 2 represents M2)
c Production costs of battery suppliers
c i Manufacturers’ remaining production costs other than battery production costs ( i = 1 represents M1; i = 2 represents M2)
D i Consumers demand for leasing EVs ( i = 1 represents M1; i = 2 represents M2)
π i The total profit of the manufacturer ( i = 1 represents M1; i = 2 represents M2; i = s represents battery supplier S)
π s i The cooperation alliance total profit of battery supplier and manufacturers ( i = 1 represents M1; i = 2 represents M2)
Table 2. The Impact on the optimal prices of EV supply chain members.
θ w 1 N w 2 N = w 2 Ι w 1 Π p 1 N p 1 Ι p 1 Π p 2 N p 2 Ι p 2 Π
0.20.50.490.50.0370.73780.0360.730.0360.71
0.250.5250.490.5250.0380.73750.0370.7250.0380.71
0.30.550.490.550.0390.73710.0380.720.0390.71
0.350.5750.490.5750.0410.73680.0390.7160.0410.71
0.40.60.490.60.0430.73650.040.7120.0420.71
Data source: NIO annual report on NIO’s official website, https://www.nio.cn/ accessed on 1 January 2024.
Disclaimer/Publisher’s Note: The statements, opinions and data contained in all publications are solely those of the individual author(s) and contributor(s) and not of MDPI and/or the editor(s). MDPI and/or the editor(s) disclaim responsibility for any injury to people or property resulting from any ideas, methods, instructions or products referred to in the content.

