
Energy Consumption Estimation Method of Battery Electric Buses Based on Real-World Driving Data

 ,
,  ,
,
Abstract
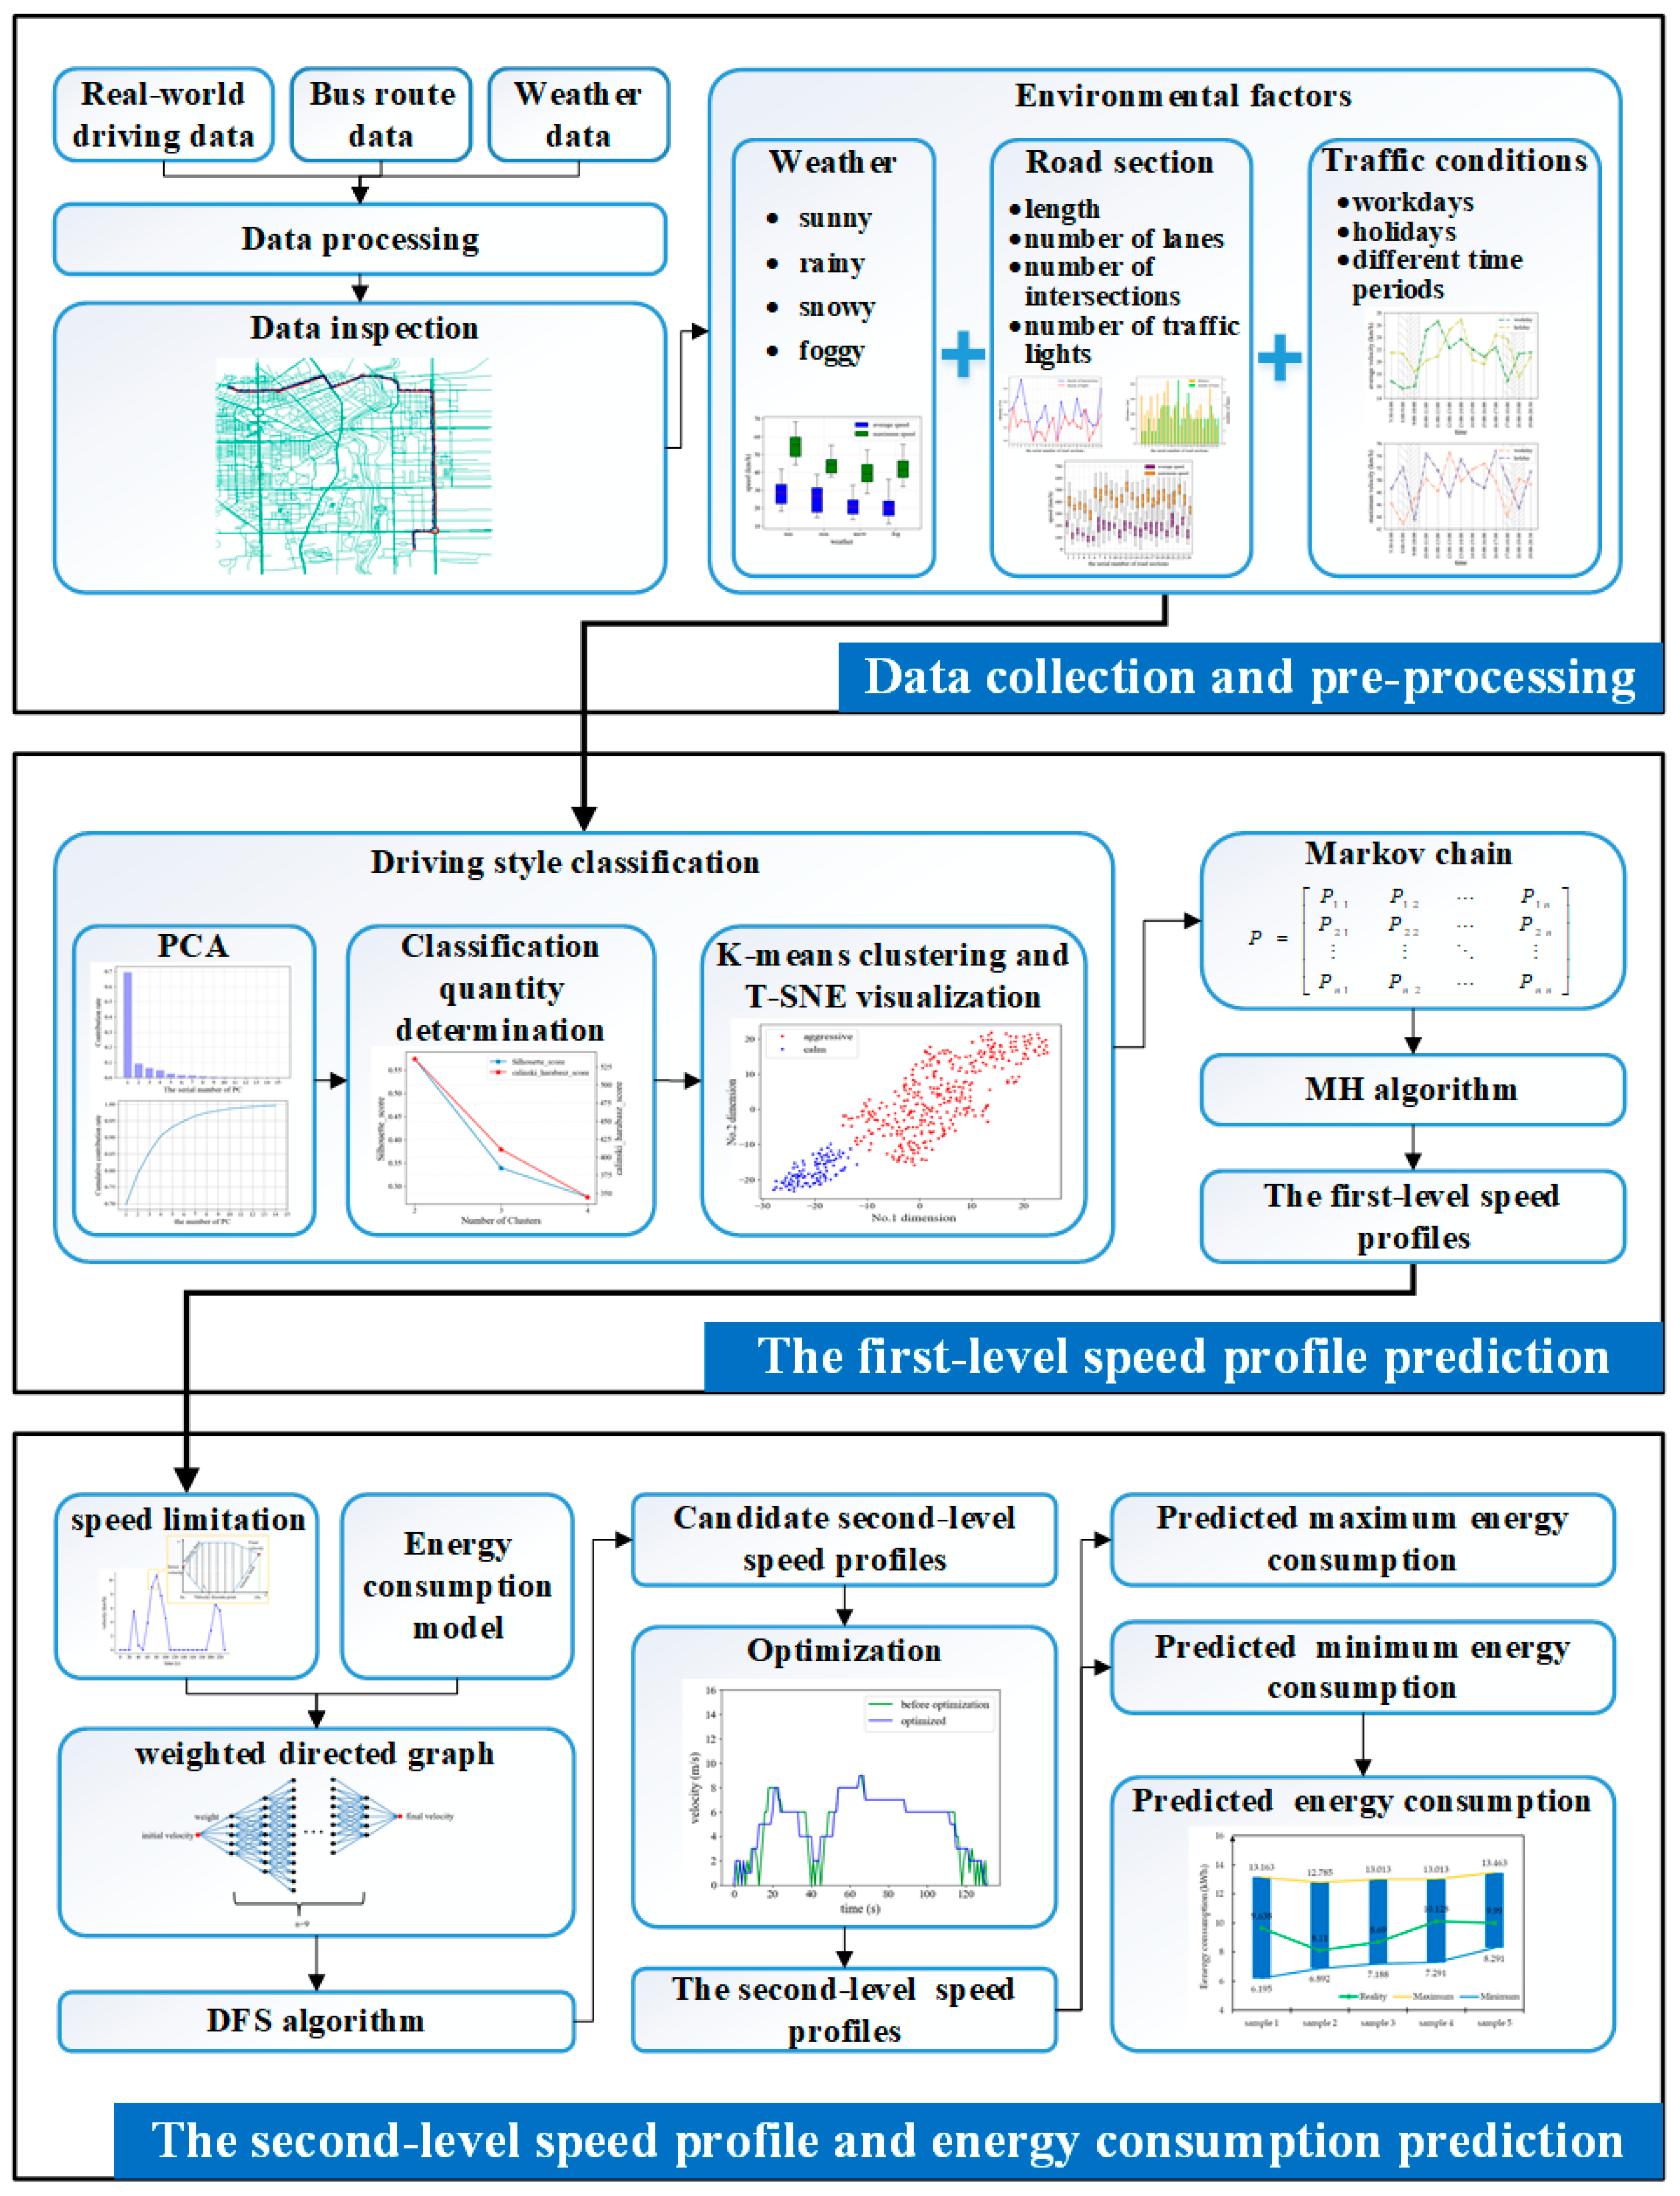
:1. Introduction
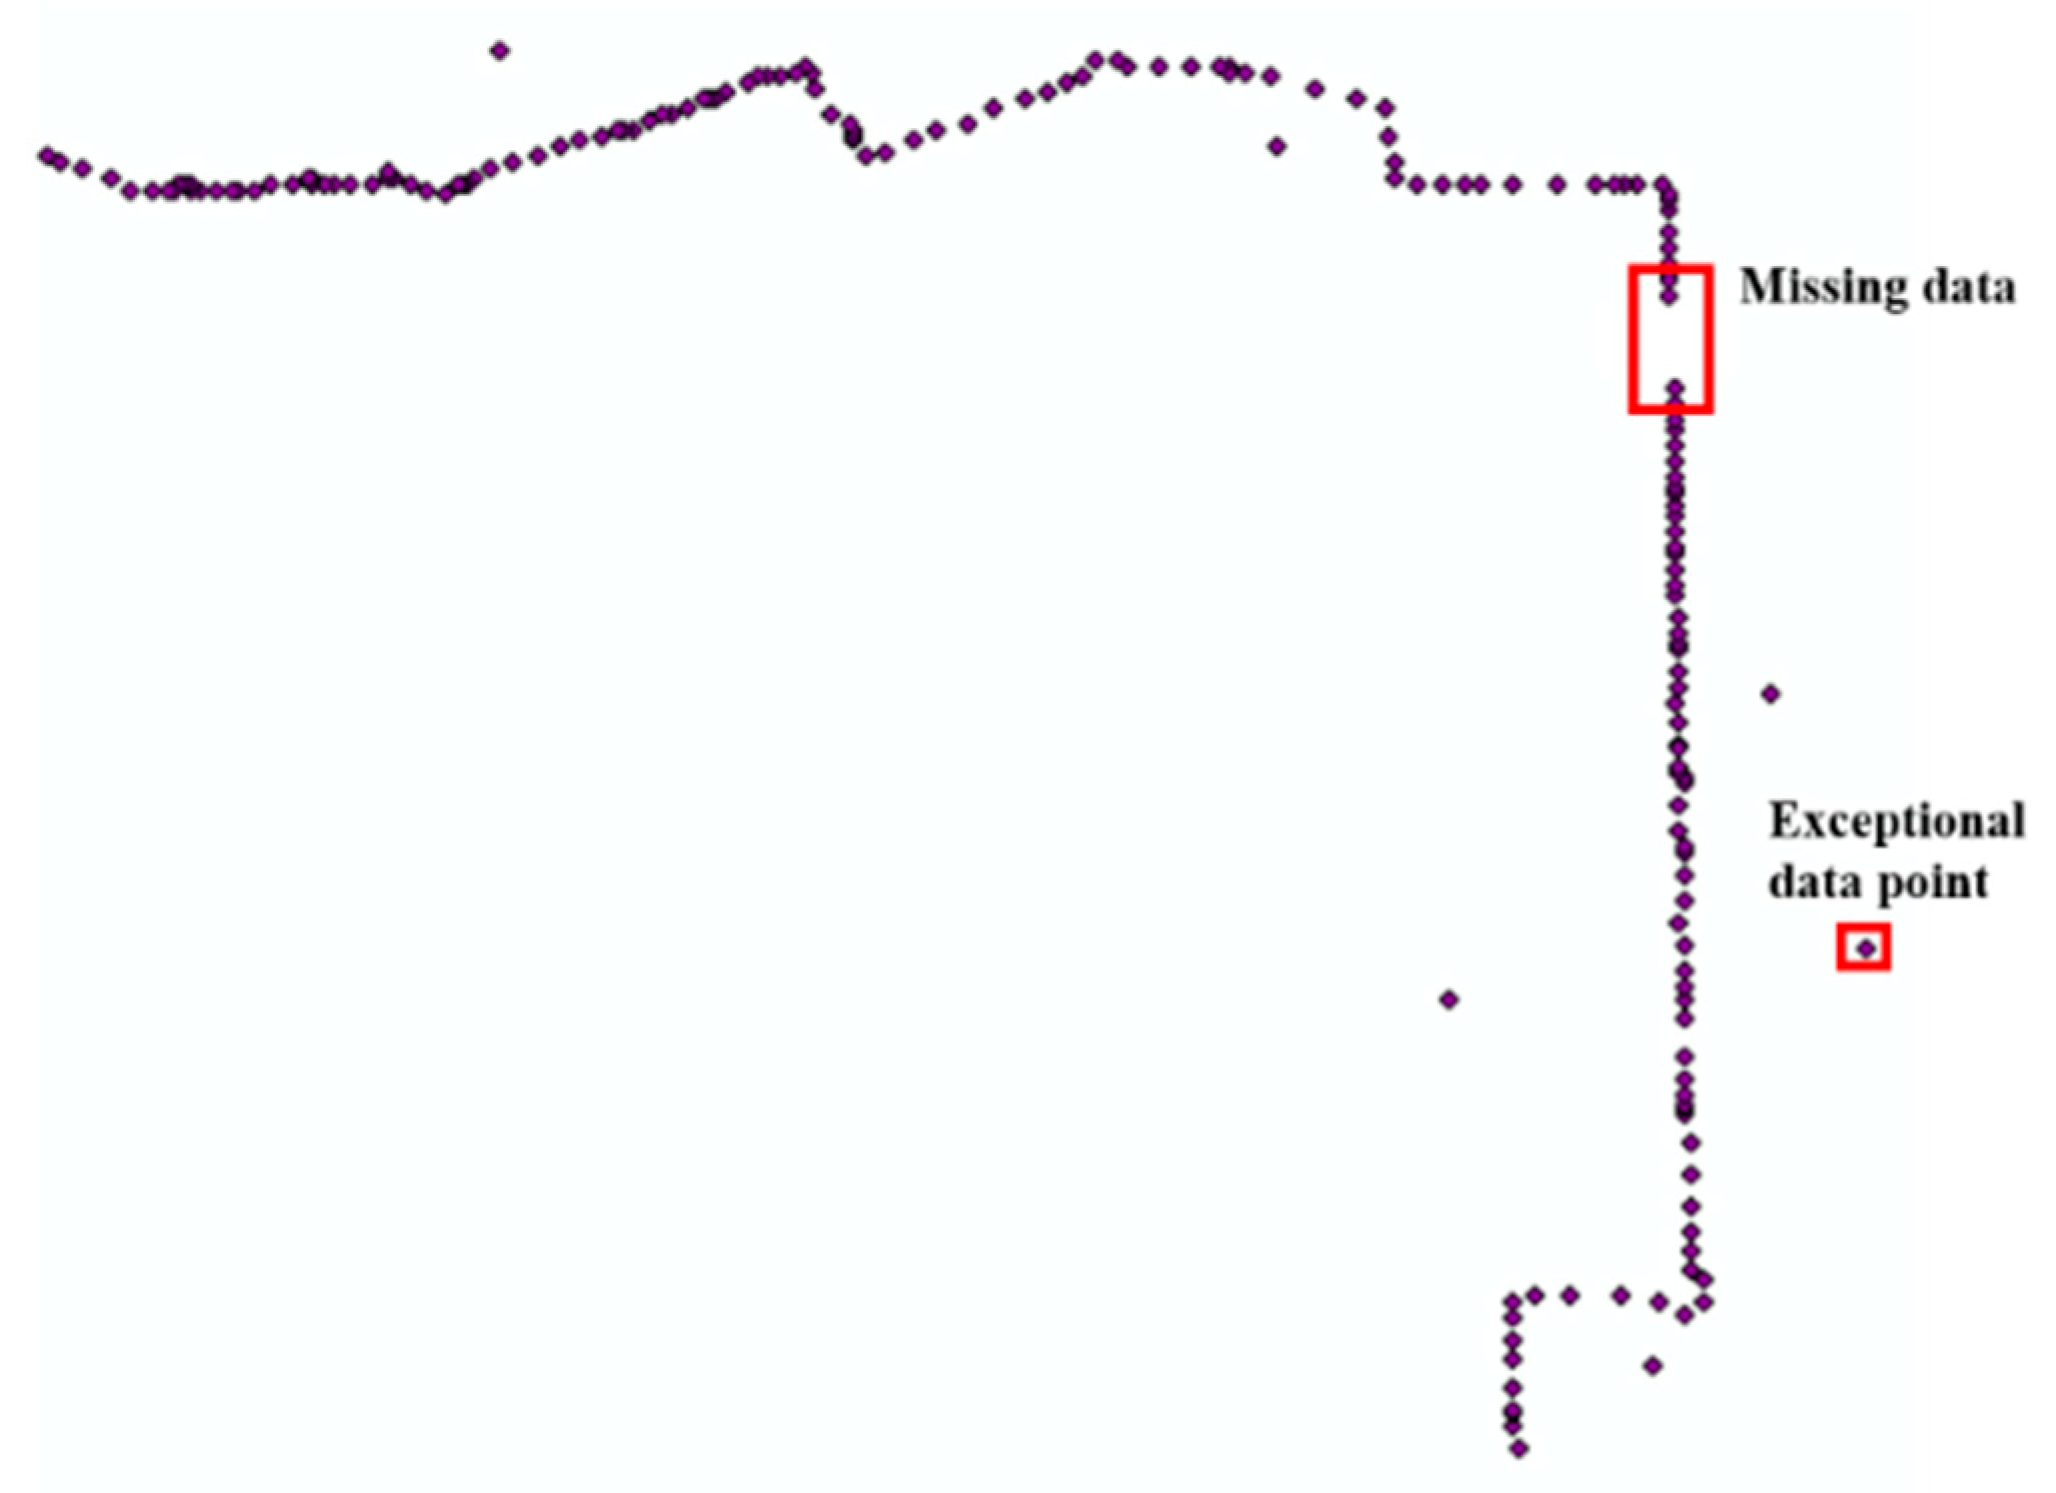
2. Data Collection and Pre-Processing
- The driving data for each complete route of each BEB are divided according to the vehicle identification number (VIN) of the BEBs and the latitude and longitude data of the starting point and the ending point.
- Then, the driving data for each complete route of each BEB are divided into road sections according to the latitude and longitude data of each station.
- The driving data of all BEBs on the same road section in chronological order are integrated, and then we obtain the driving data of all BEBs on the same road section in each time period.
- Match the driving data of each road section with the fixed attributes (length, number of lanes, number of intersections, etc.) and the weather data for one hour or three hours. Finally, the driving data, fixed attributes, and weather data of each road section are obtained.
3. The First-Level Speed Profile Construction
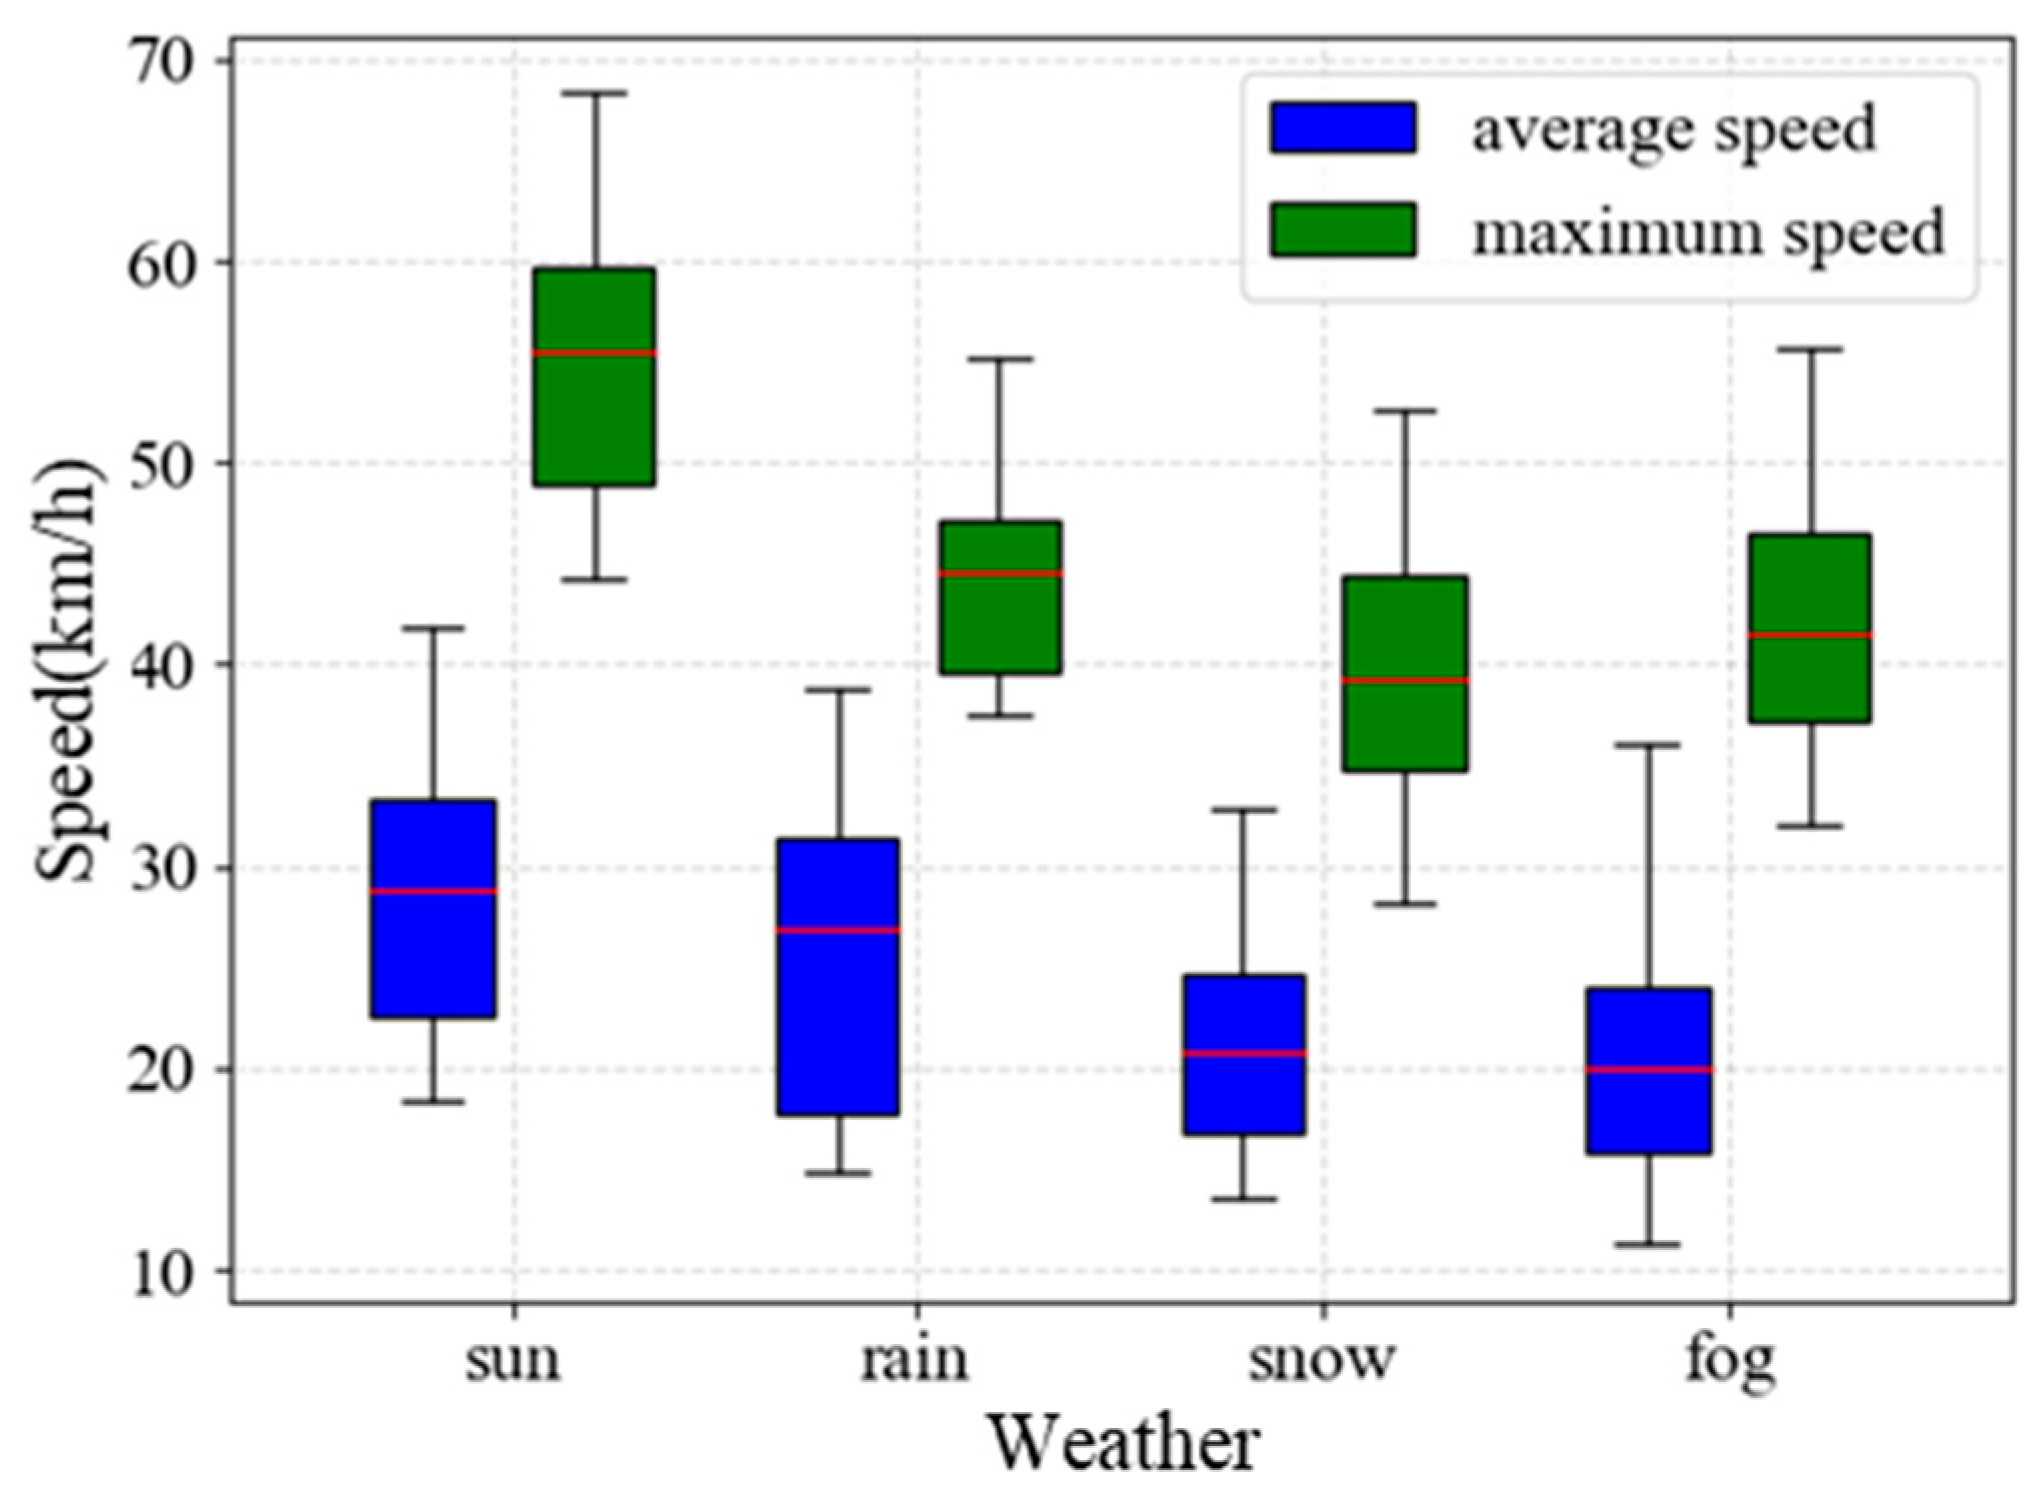
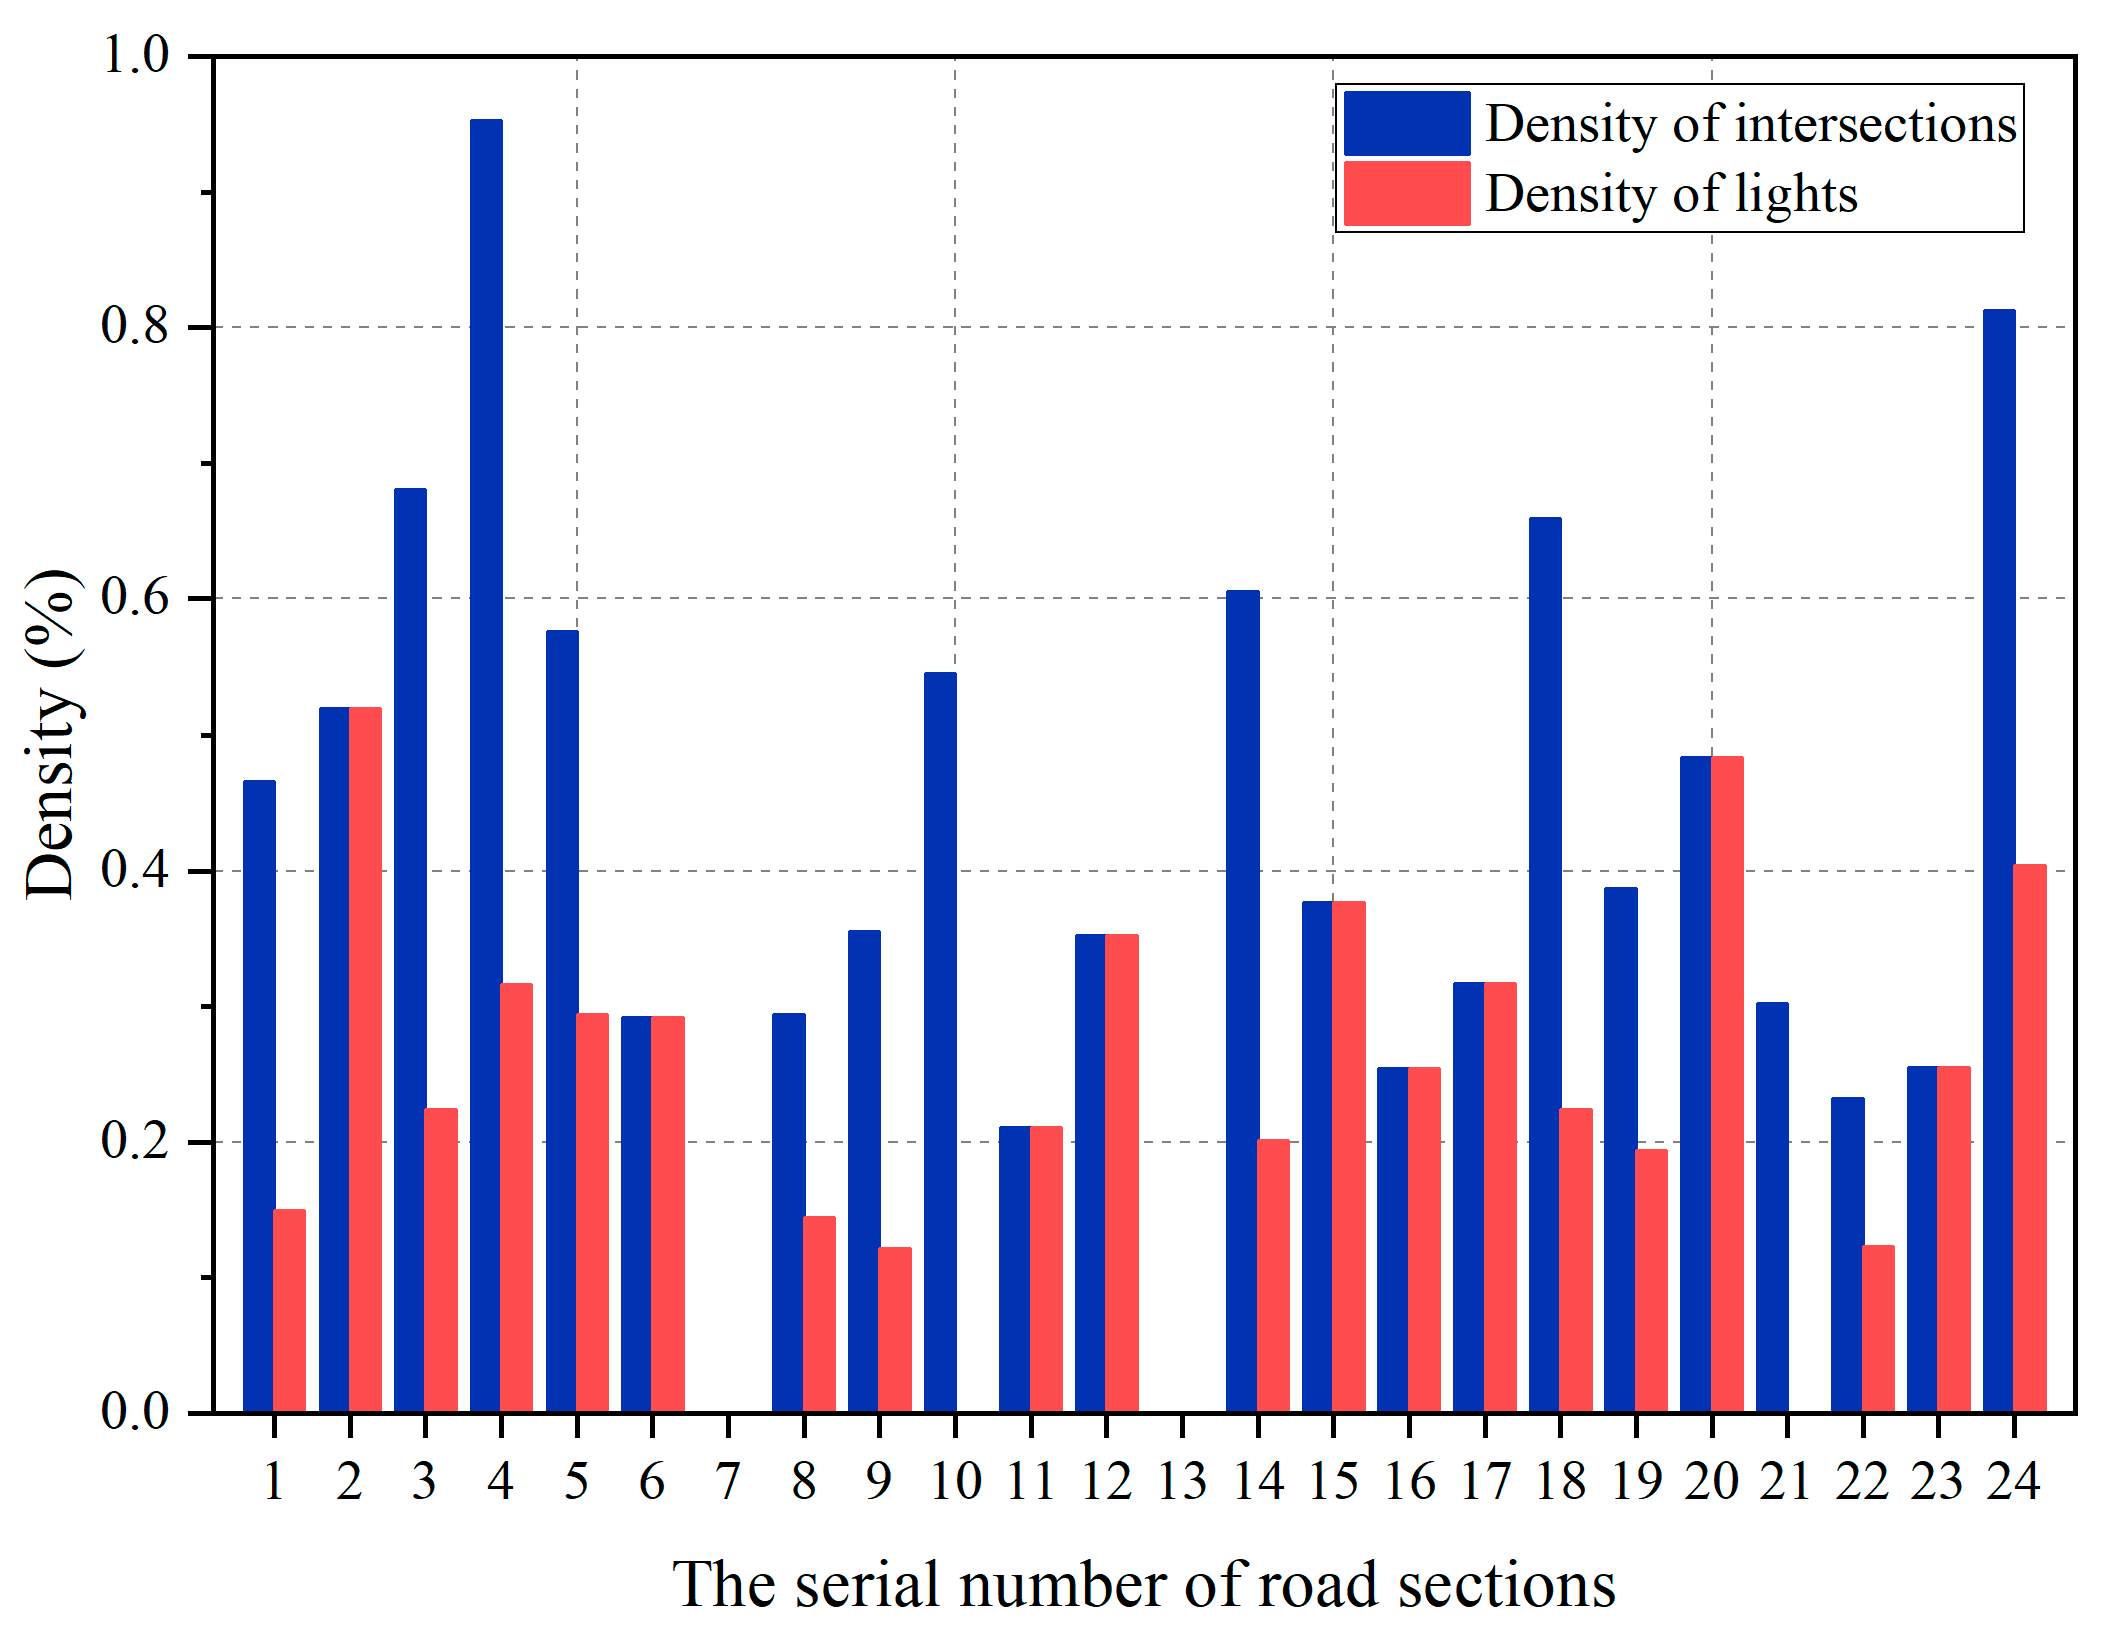
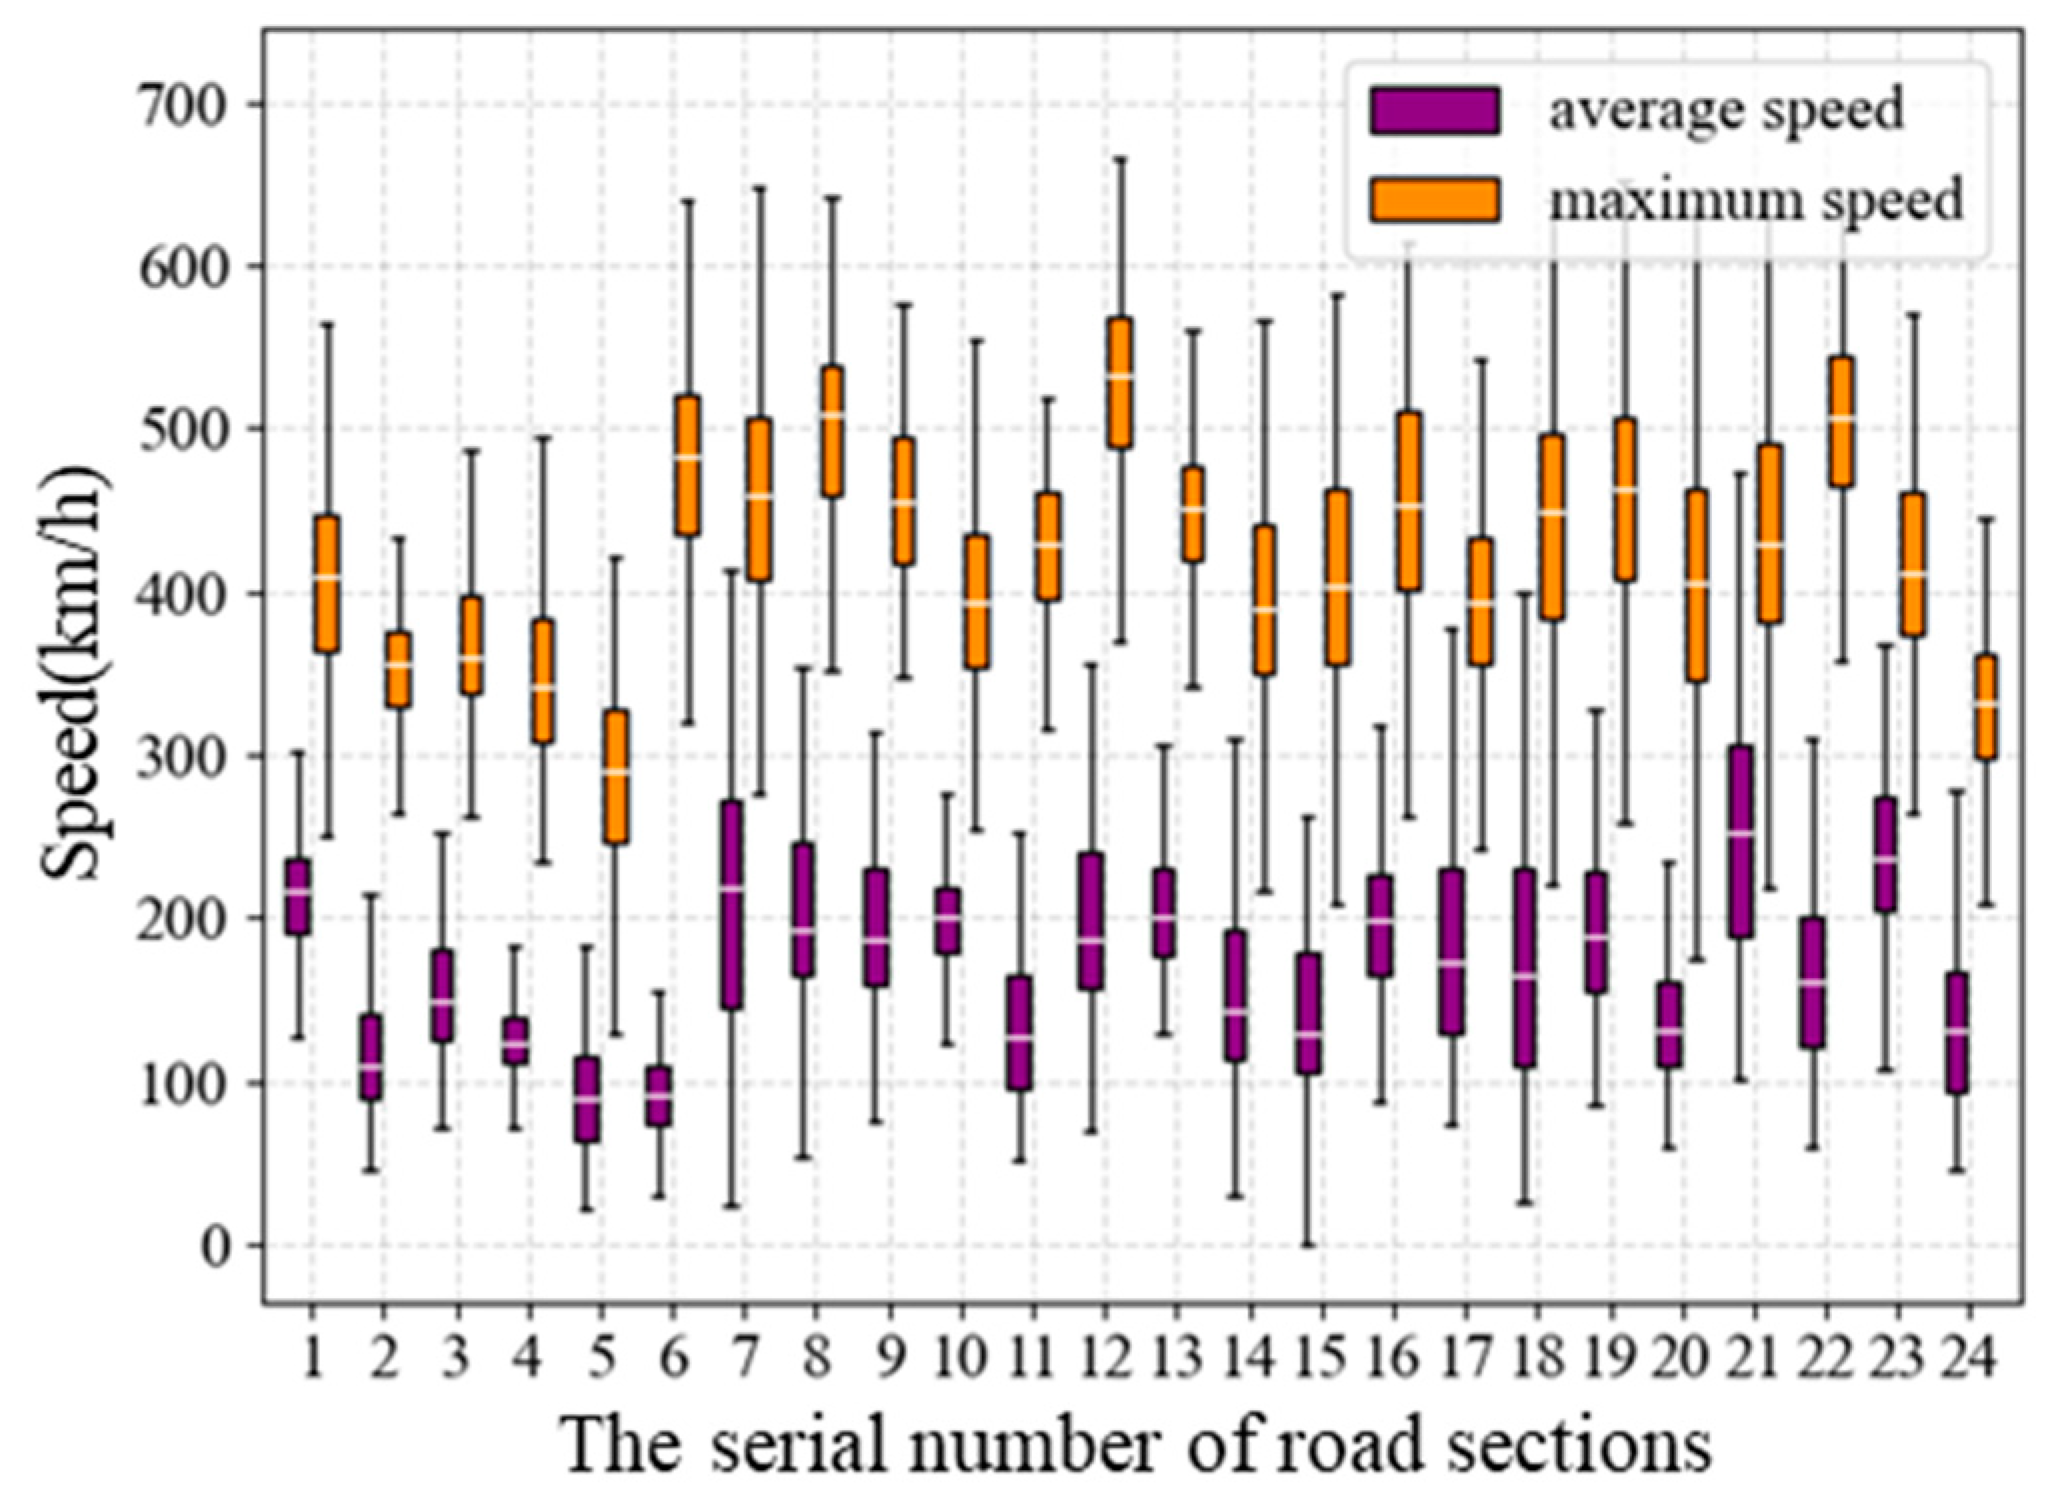
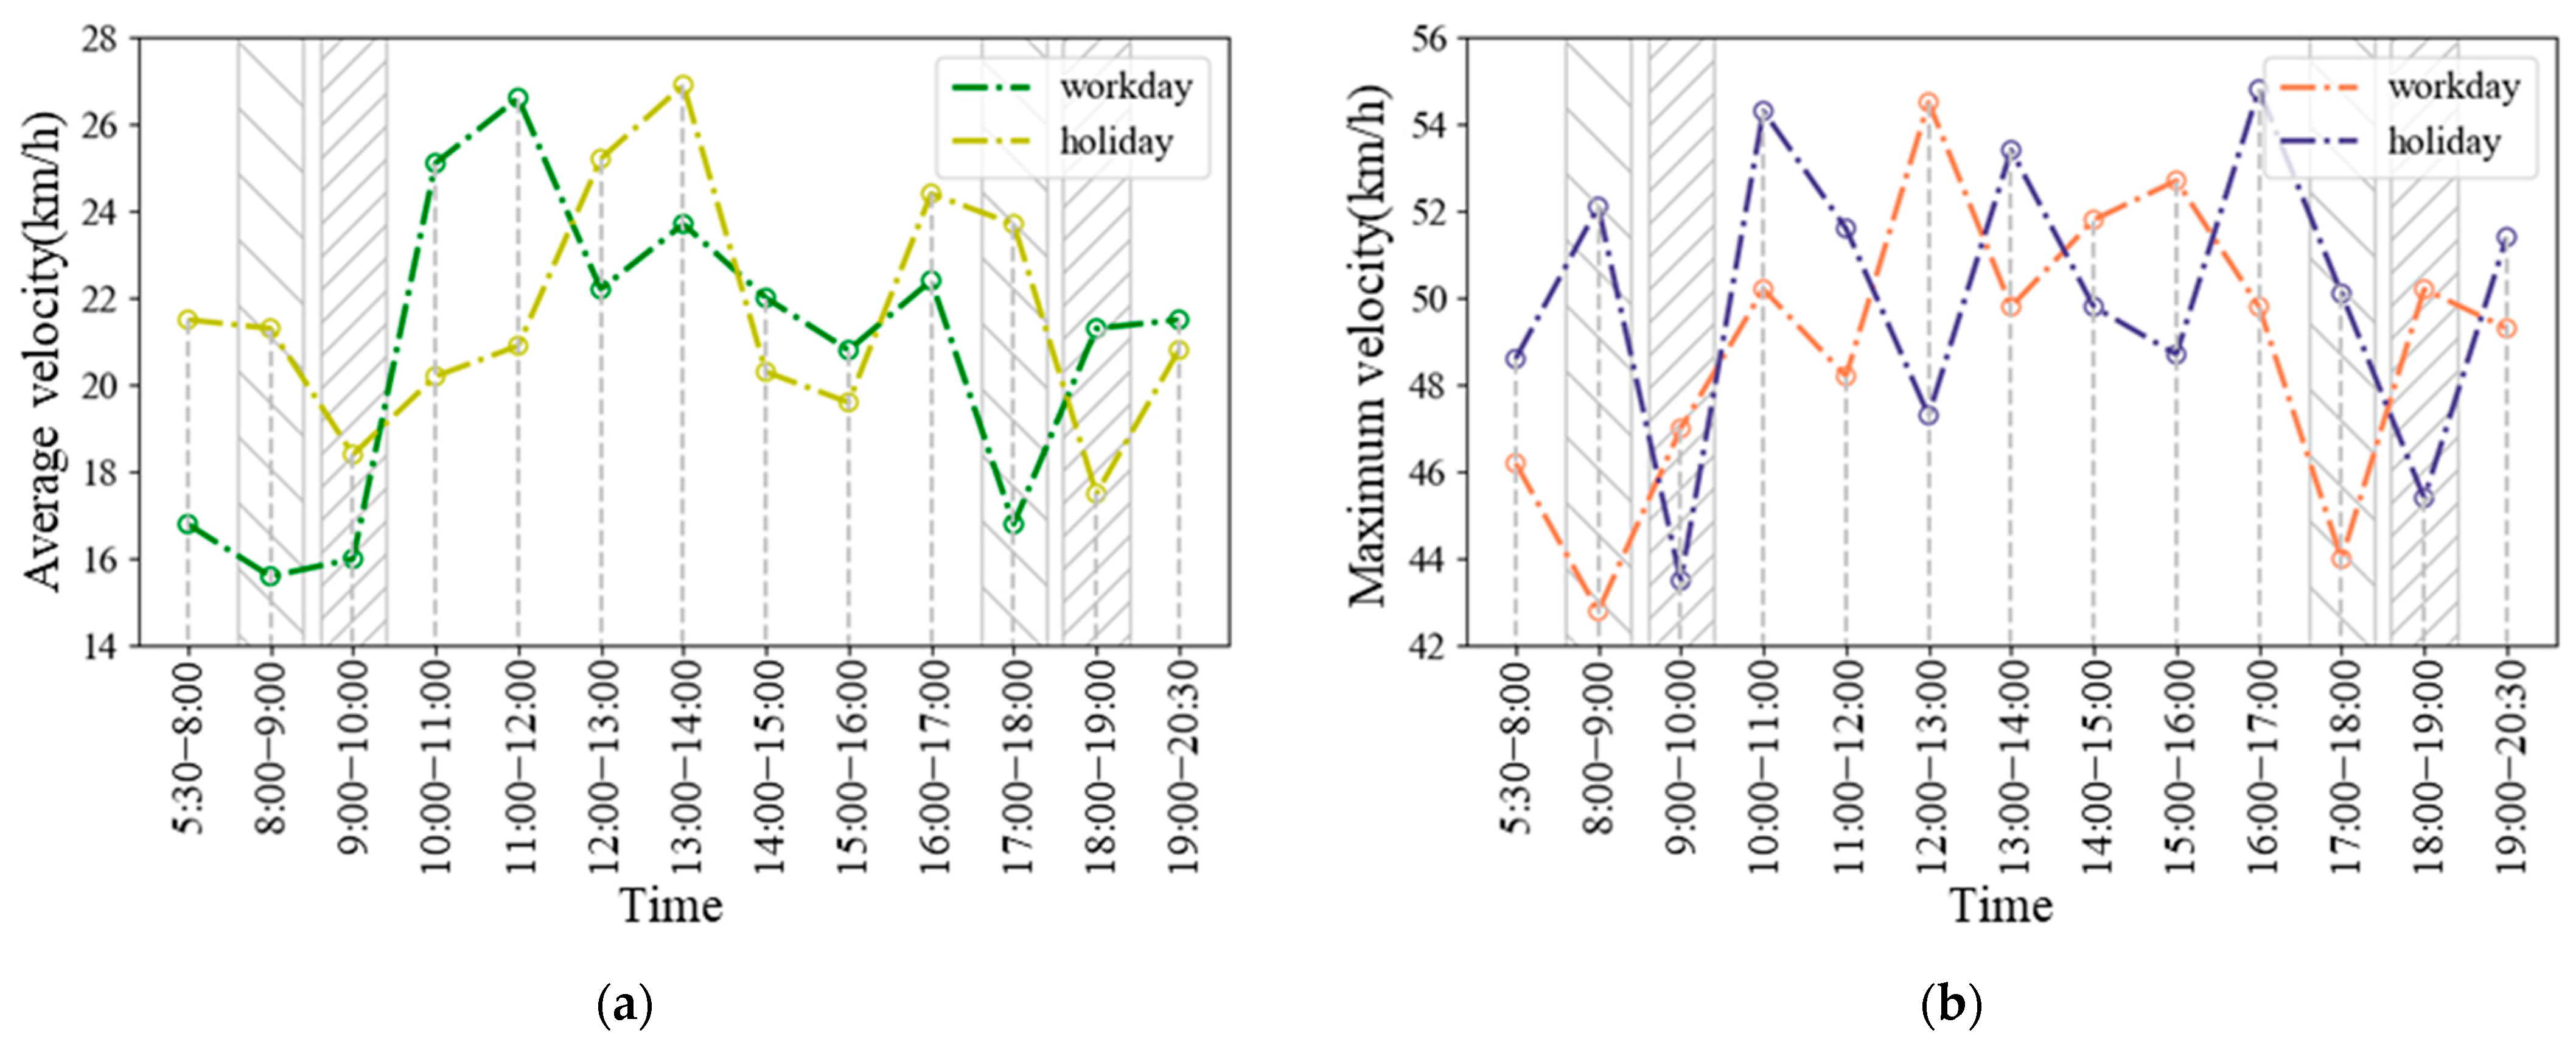
3.1. The Influence of Environmental Factors on Speed
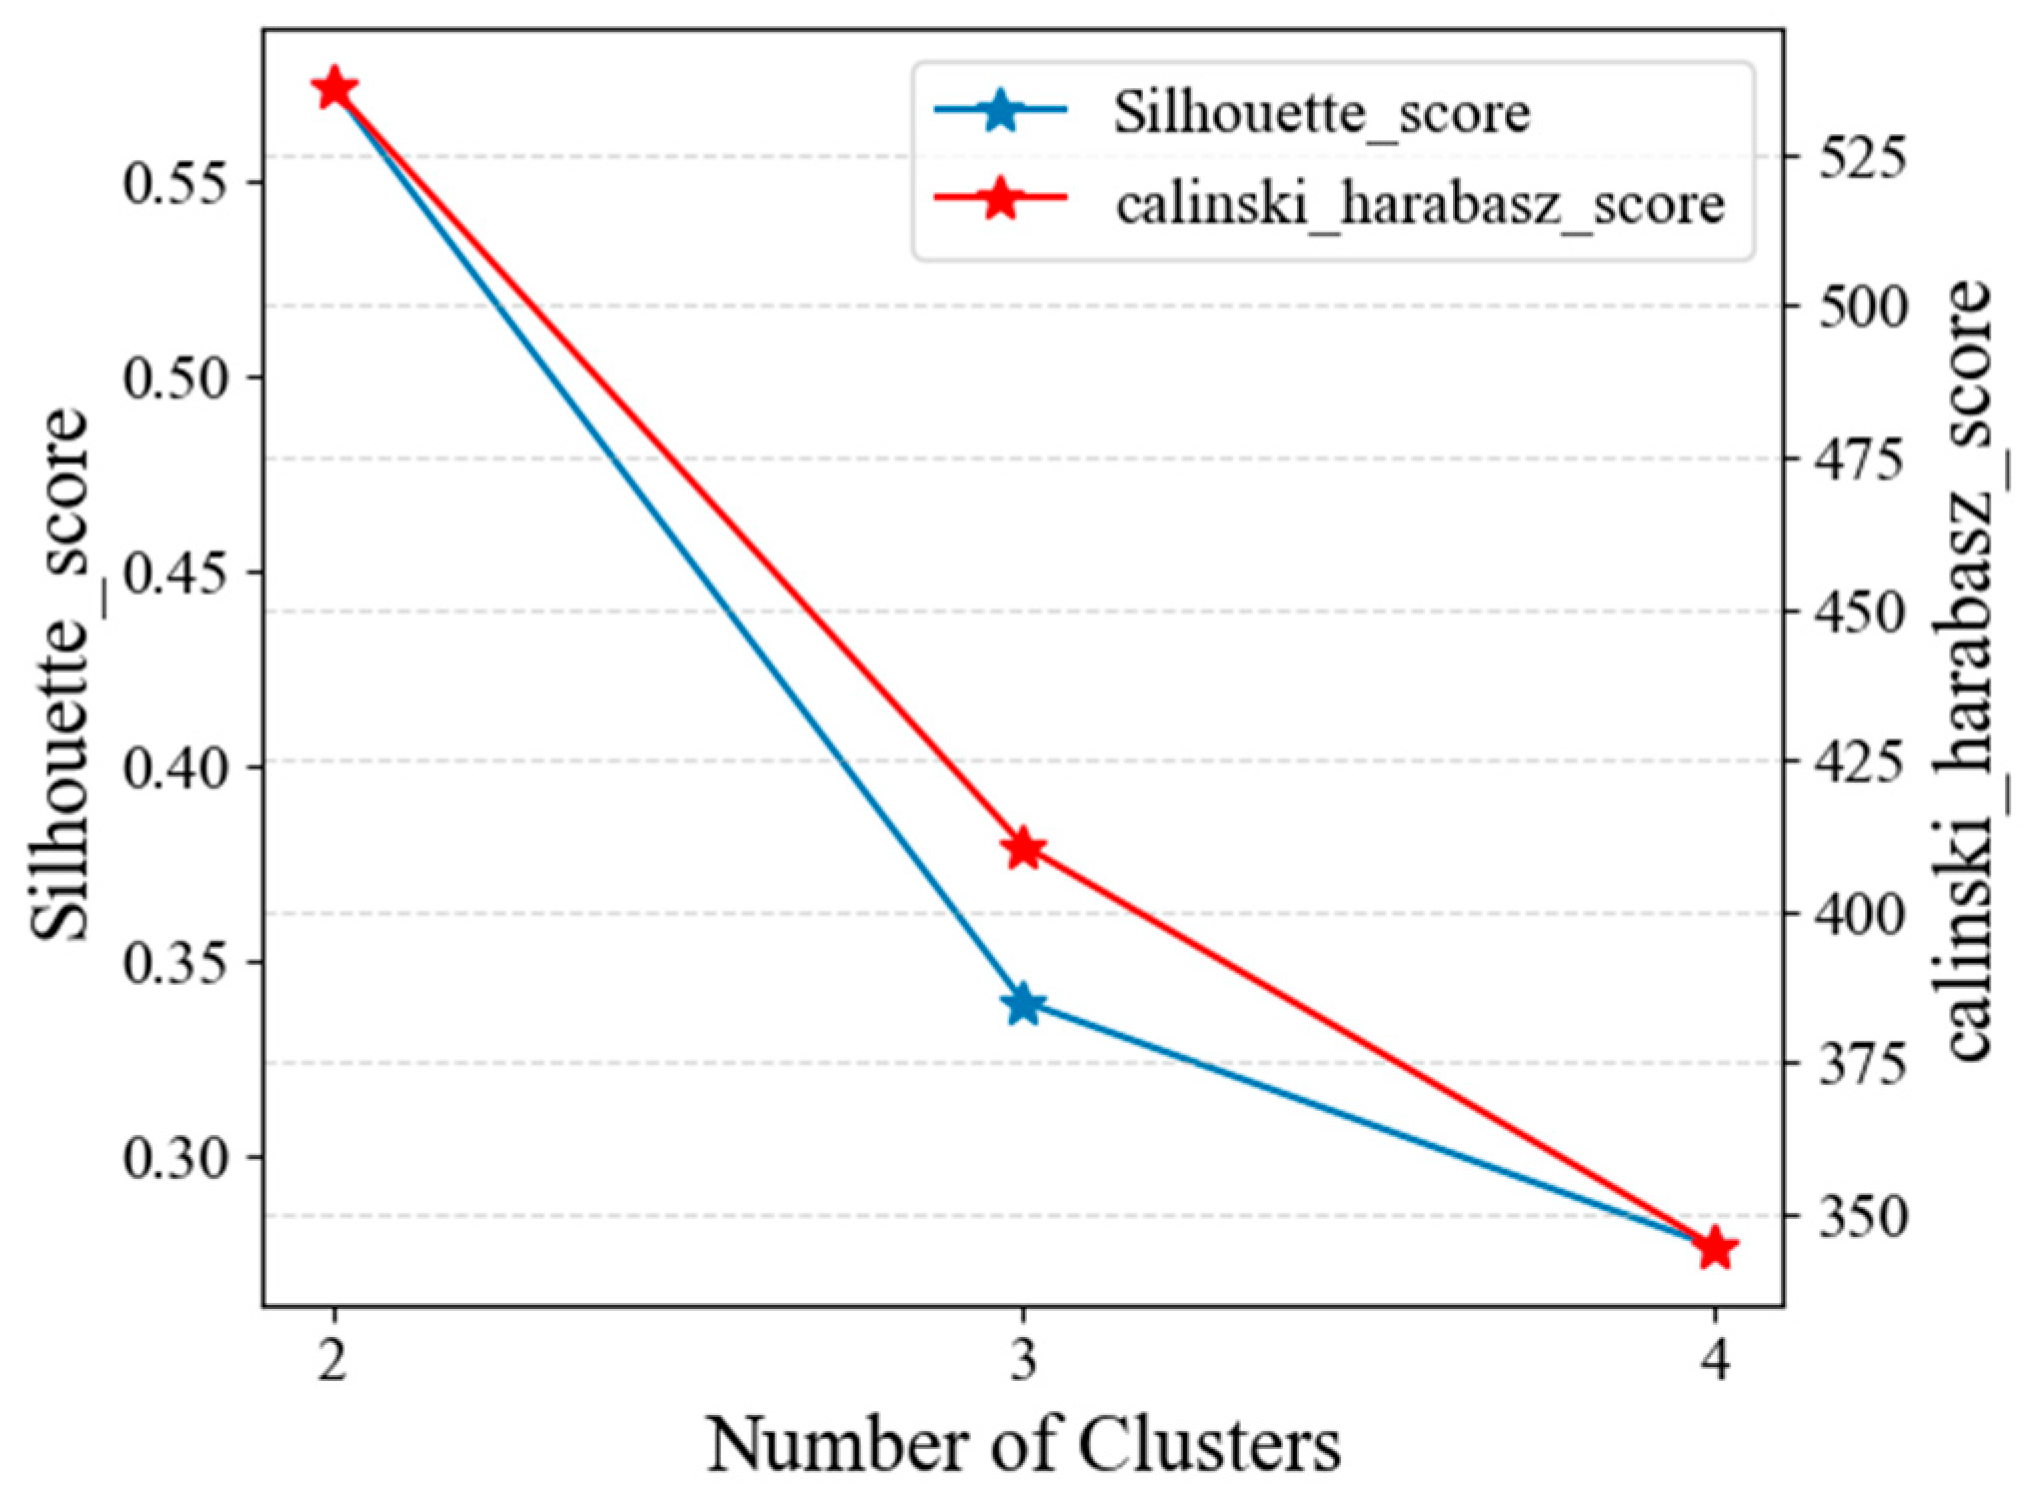
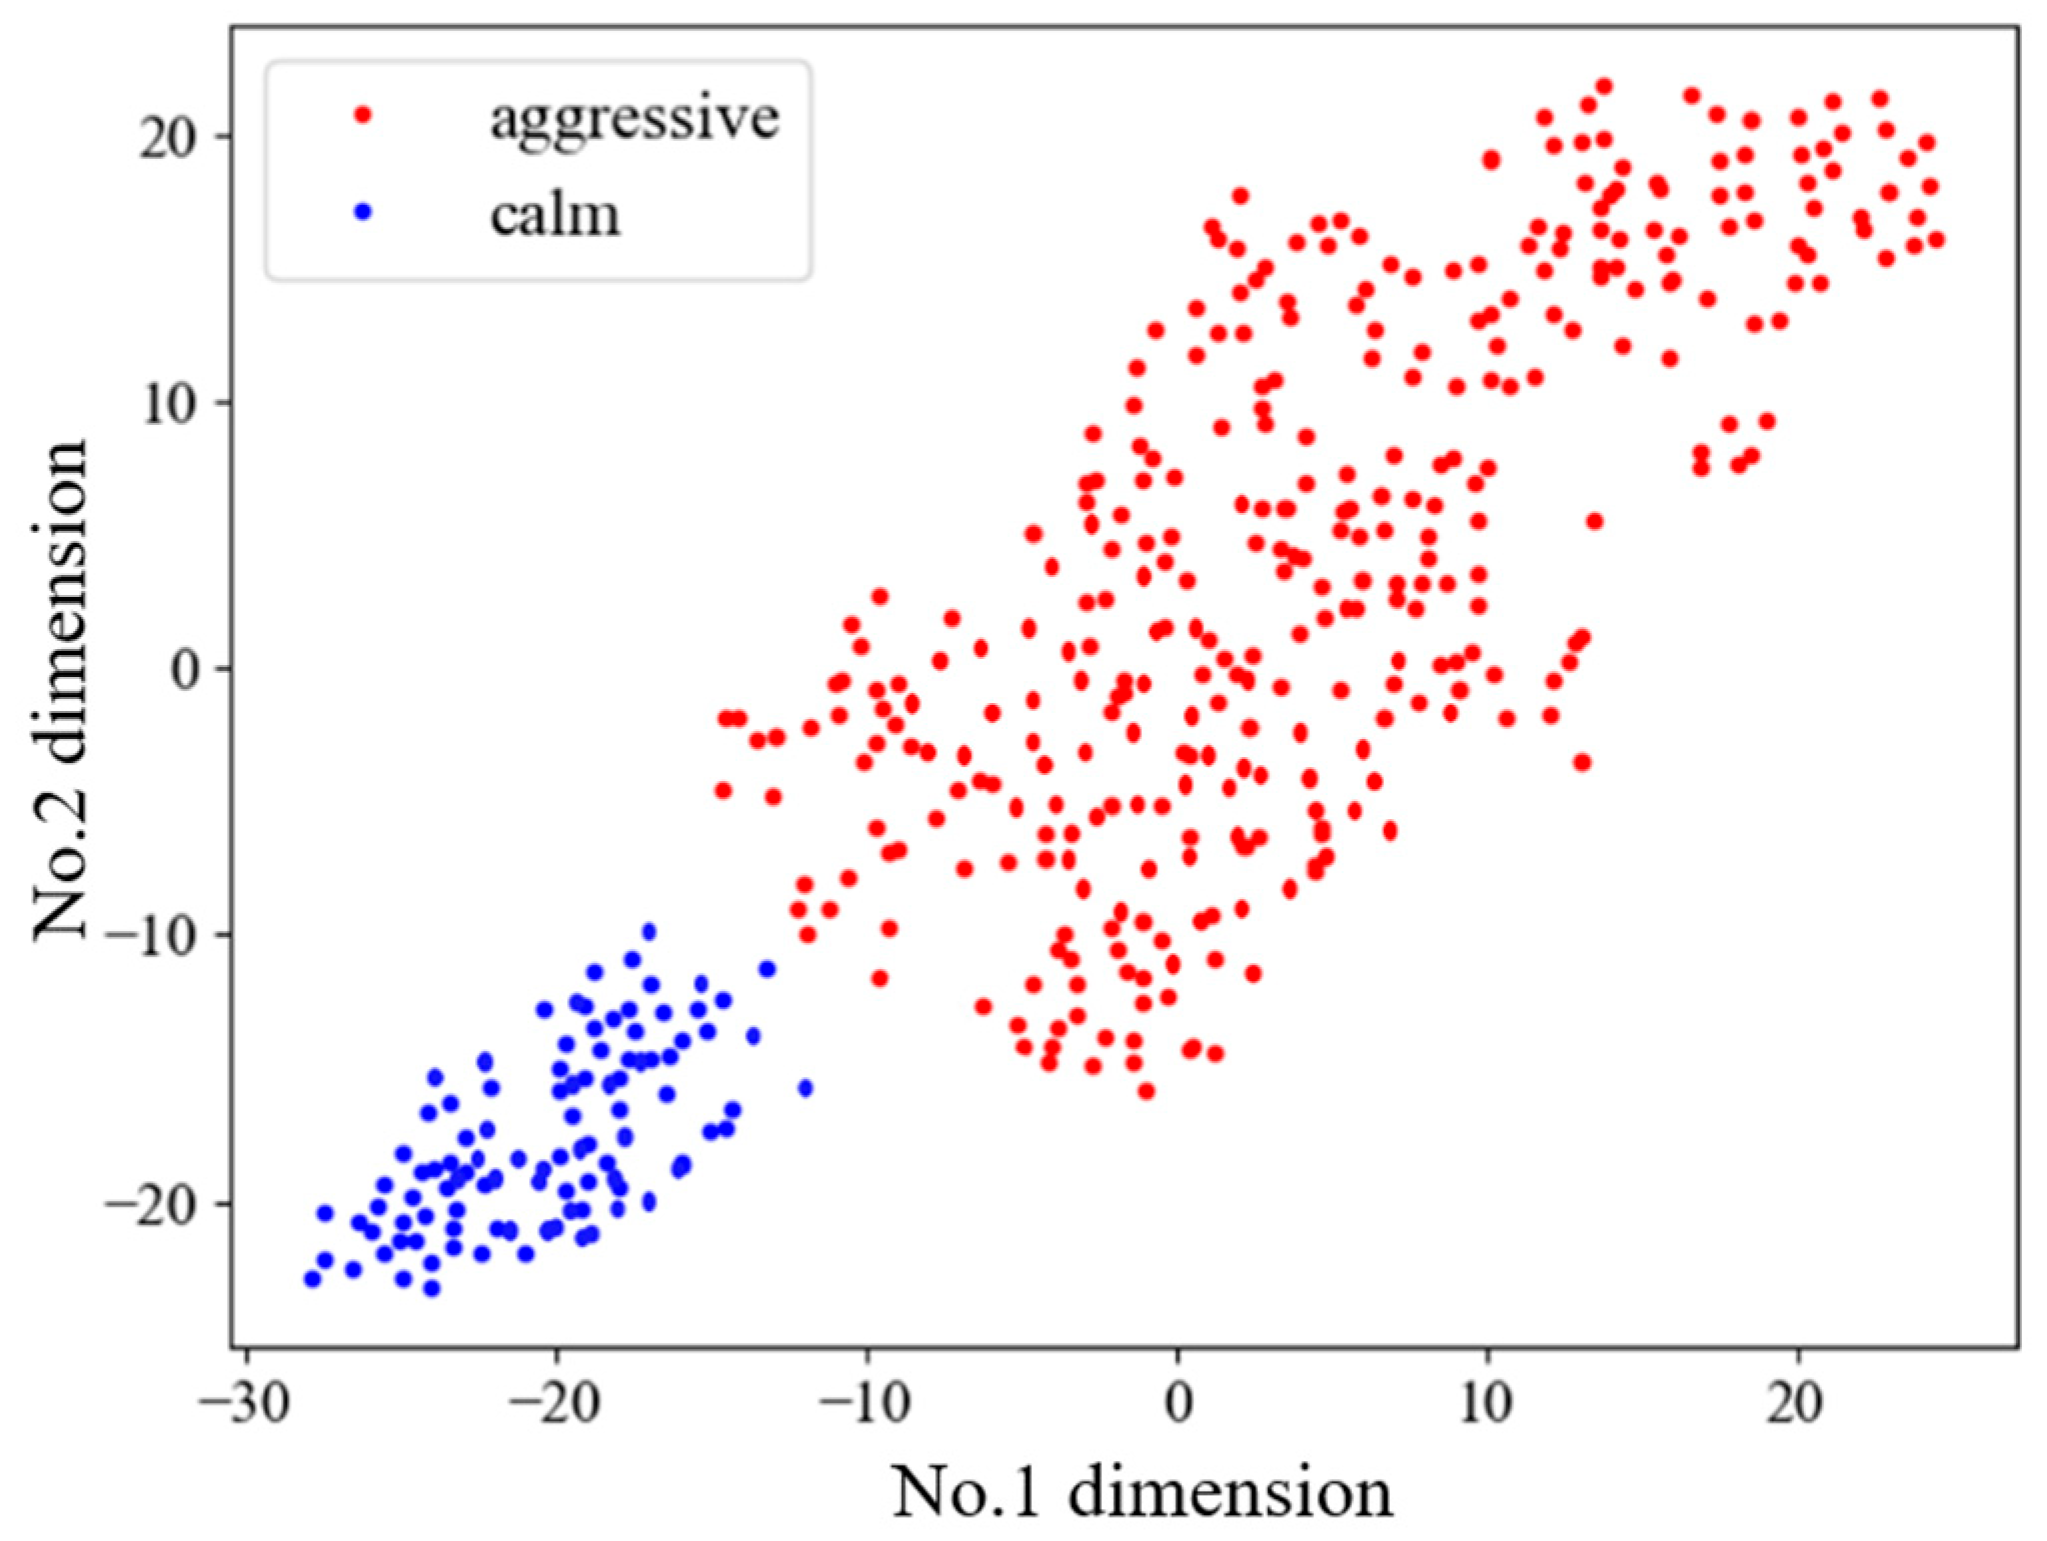
3.2. Driving Style Classification
- Randomly determine cluster center points.
- Calculate the Euclidean distance between the data point and the cluster center.
- Assign each data point to the category of the cluster center with the smallest distance, then calculate the average of all data points in the category as the new cluster center.
- Iterative until the cluster center of each category no longer changes and the data will not be redistributed.
3.3. The First-Level Speed Profile Prediction
- Road section level is 1, aggressive driving style
- Road section level is 2, aggressive driving style
- Road section level is 3, aggressive driving style
- Road section level is 1, calm driving style
- Road section level is 2, calm driving style
- Road section level is 3, calm driving style
- Classify the kinematic fragments to different speed states according to the average speed. Here, we divide the speed states into six in intervals of , and label them with .
- The transfer probability between speed states is calculated based on their time sequence. Considering the large number of samples of historical data, the maximum likelihood estimation is used to calculate the transfer probability between speed states, as shown in Equation (10).

- 3.
- Then, the TPM of the six types of historical data is obtained as shown in Equation (12):
- 4.
- According to the TPM, the matrix that denotes the steady state distribution of the Markov chain is obtained as shown in Equation (13):
- A certain acceleration fragment is randomly selected from the set of kinematic fragments of the road section and the corresponding driving style as the starting fragment of the speed profile. This acceleration fragment needs to meet: the initial speed of 0 and the maximum speed cannot exceed the constraints formed by the environmental factors in Table 4. According to the average speed of the kinematic fragment, the corresponding state label is determined as .
- According to the current state labels and , the next moment state label is obtained by sampling from the uniform distribution .
- Calculate acceptance rate , if , then accept the transfer at the next moment, that is, . Otherwise, the transfer is not accepted, and re-sampling proceeds according to the state labels and until .
- After determining the state label at the next moment, select a kinematic fragment marked with the state label that meets two conditions: the difference between the initial speed of it and the final speed of the previous kinematic fragment is less than 1 km/h, and its maximum speed cannot exceed the constraints formed by the environmental factors in Table 4.
- The obtained kinematic fragment is added to the end of the speed profile, and the state label of the kinematic fragment is taken as the current state and the kinematic fragment at the next moment continues to be predicted according to the above method. Until the travel distance corresponding to the speed profile reaches the actual distance of , the predicting ends.
4. The Second-Level Speed Profile and Energy Consumption Prediction
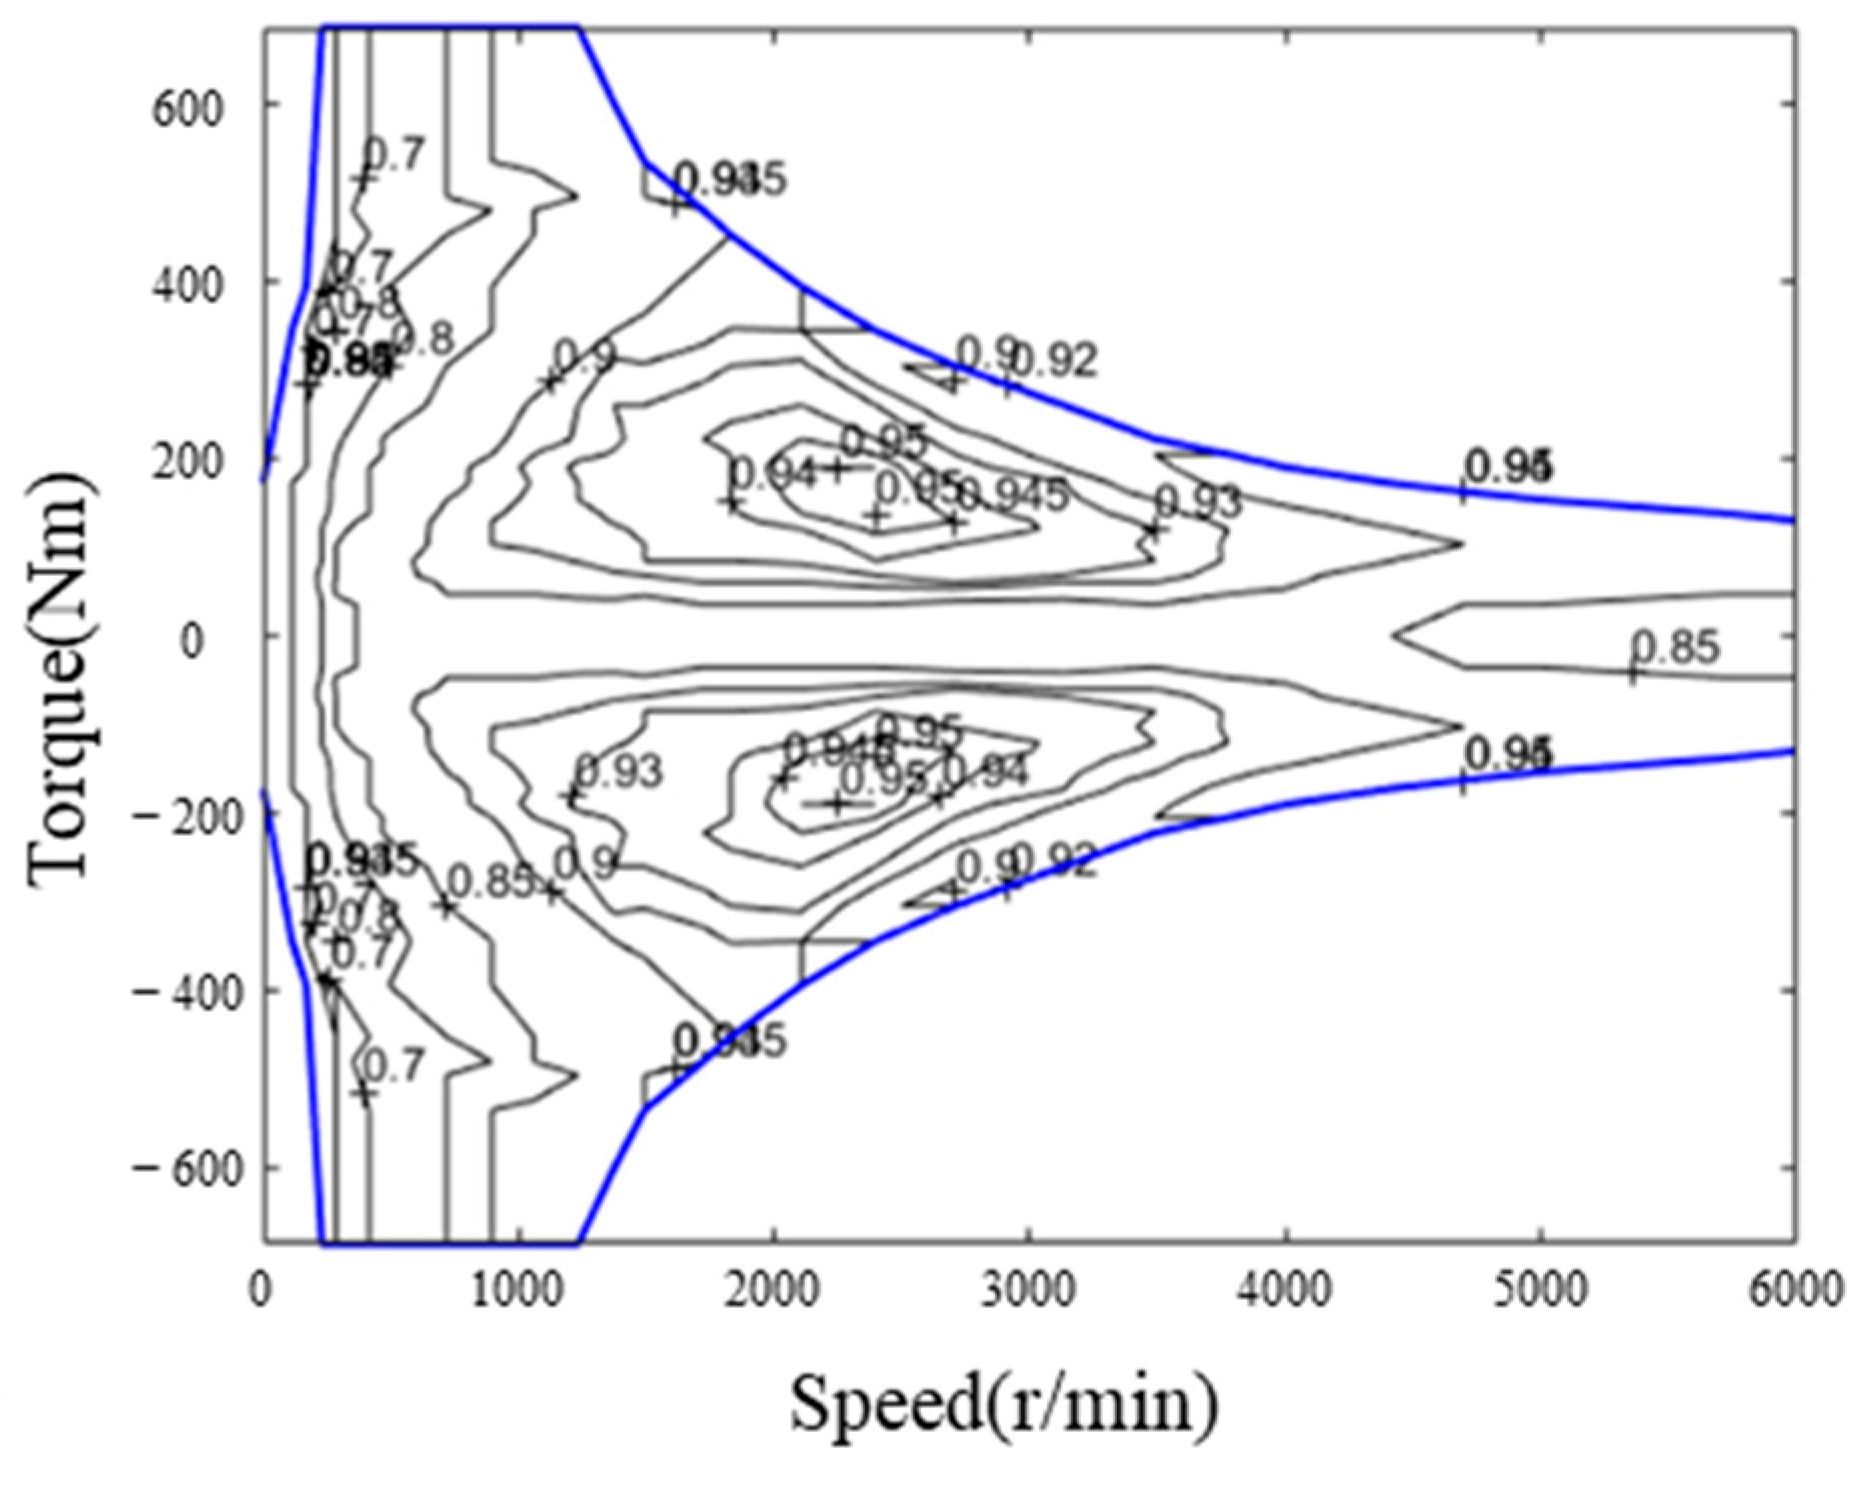
4.1. Establishment of the Energy Consumption Model
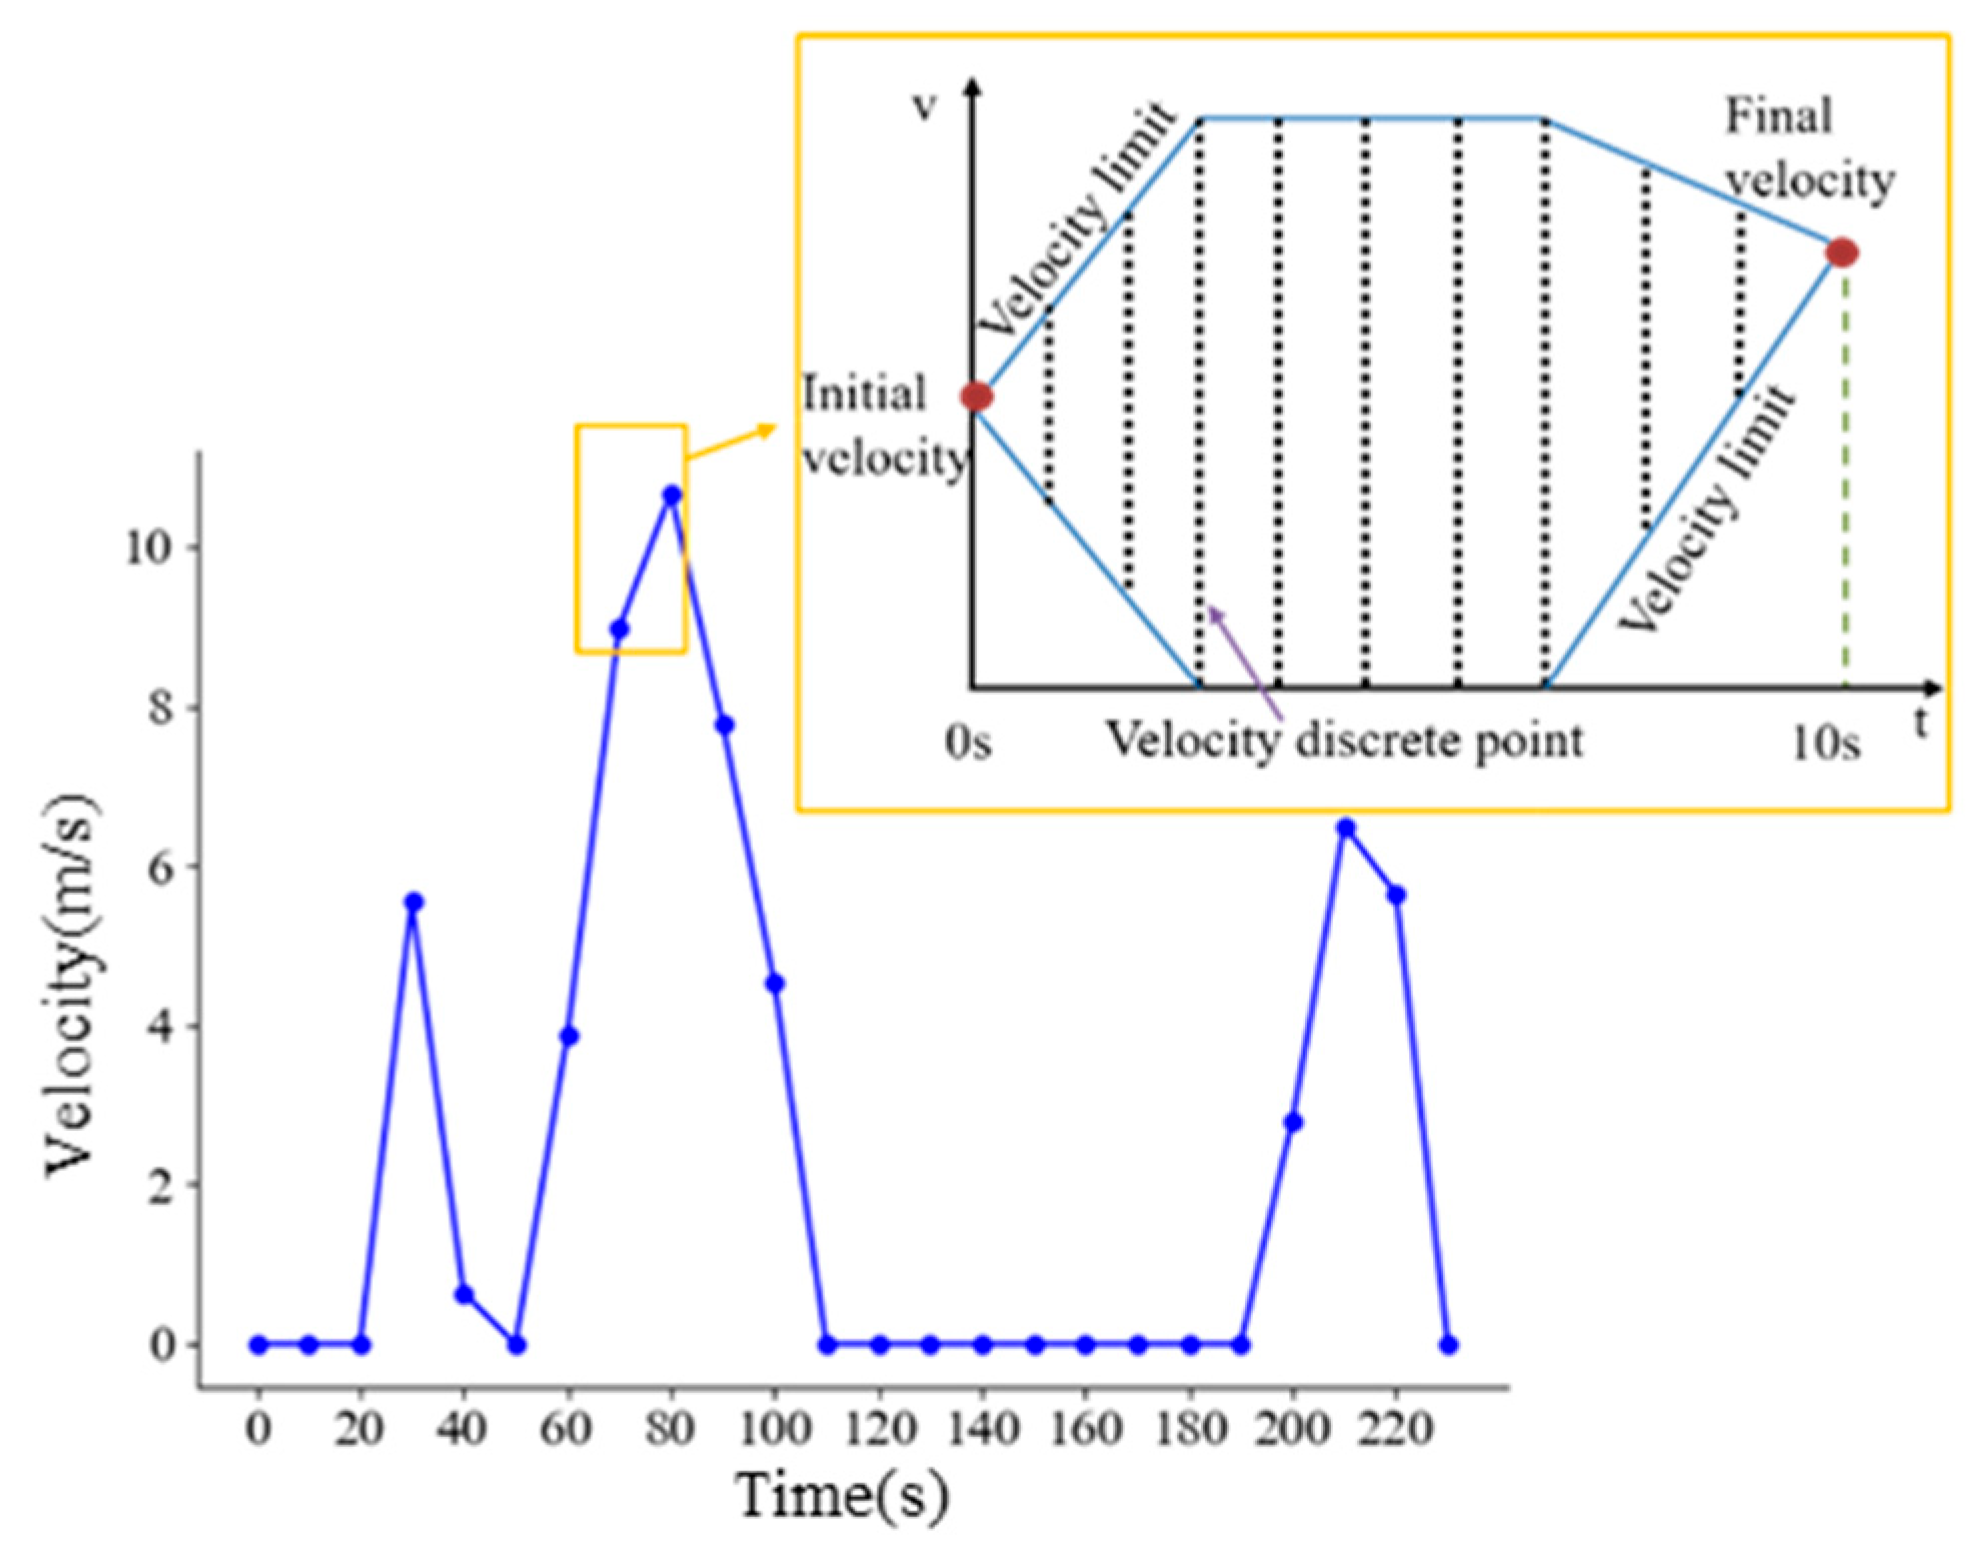
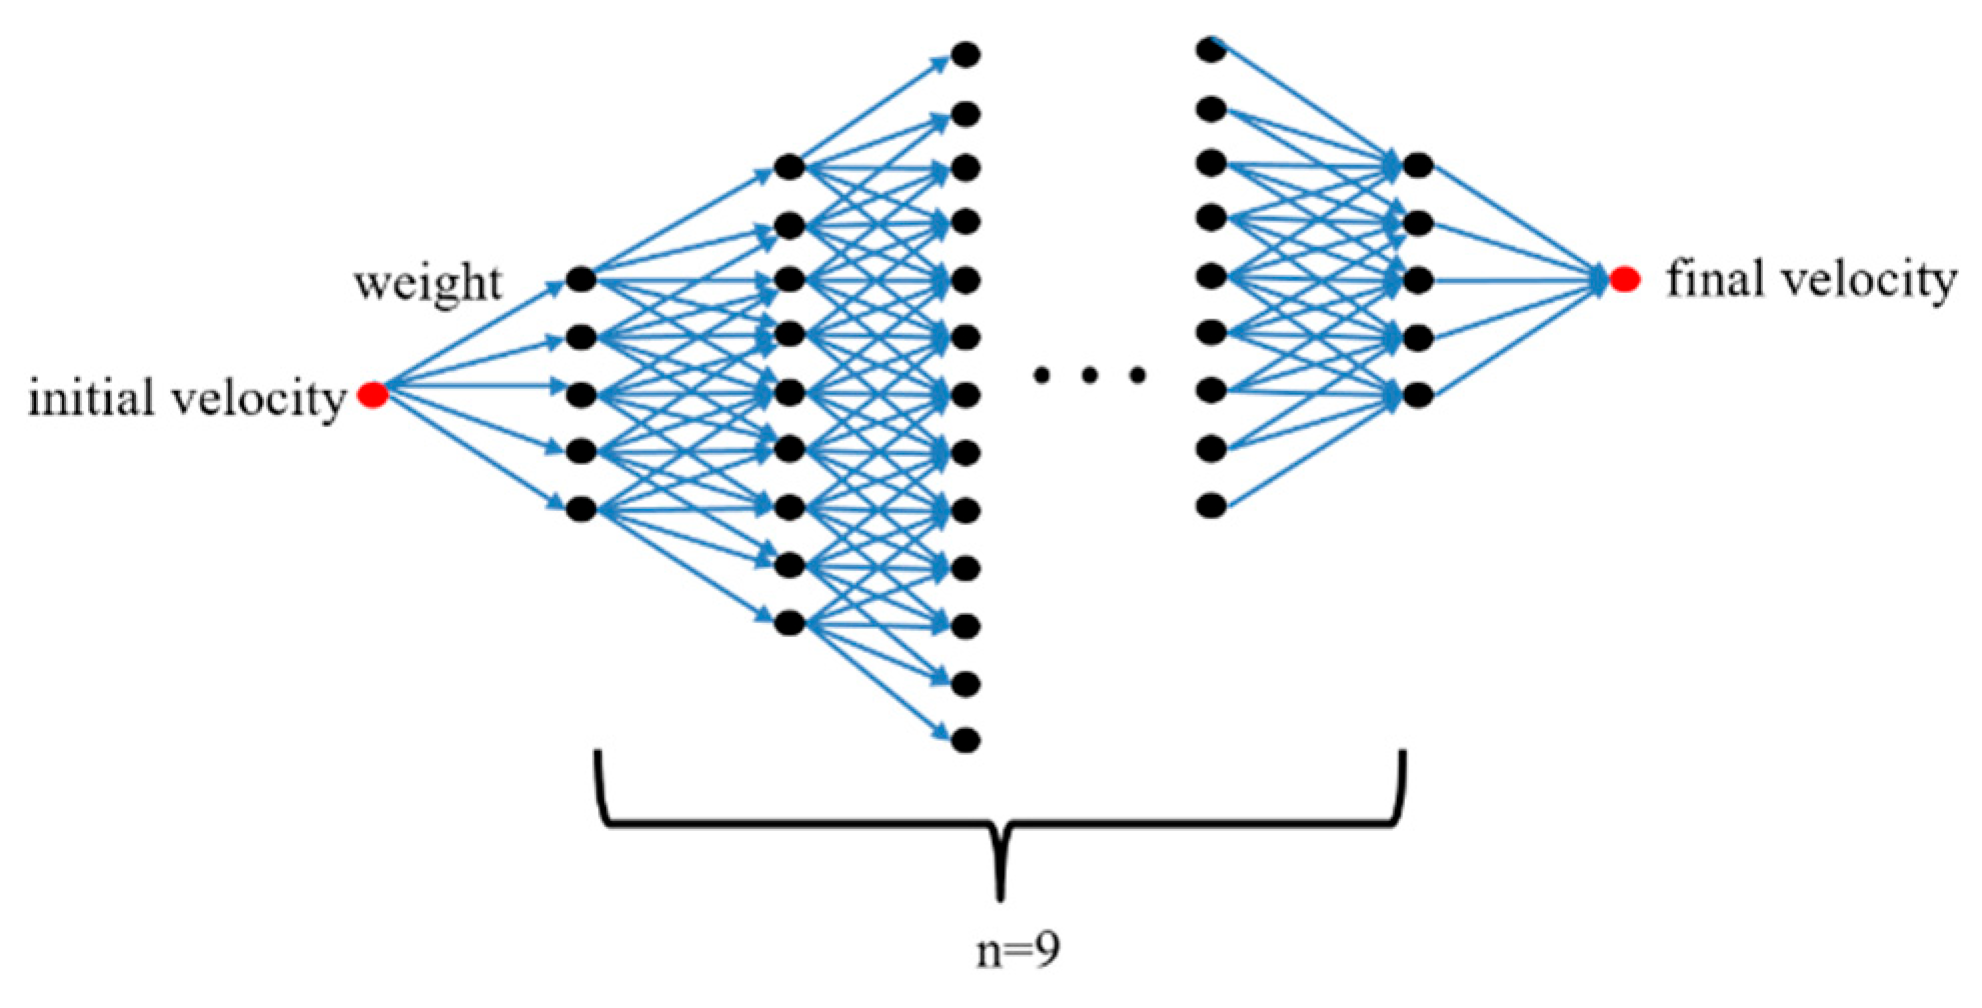
4.2. The Second-Level Speed Profile Prediction
- Limit the speed points filled in each part
- From the starting speed point, according to the acceleration and the maximum speed limit, the speed range of the next segment is obtained based on the previous segment and so on, until it stops at the last segment of the final speed point. The speed range of each segment is .
- Starting from the last speed point, according to the acceleration and the maximum speed limit, the speed range of the previous segment is obtained by backward deduction, and so on, until it stops at the next segment of the starting speed point. The speed range of each segment is .
- In the above two steps, the two speed ranges from the forward and reverse directions of each segment are obtained. We take the intersection of the two speed ranges: the maximum speed of the segment can be obtained by and the minimum speed of the segment can be obtained by . Finally, the speed limit range that meets the constraint conditions at each segment is obtained, that is, .
- 2.
- Convert each segment into a weighted directed graph and store the adjacency relationship and weight information of the speed points
- 3.
- Use the Depth-First-Search (DFS) algorithm to determine the speed points filled in each part corresponding to the maximum and minimum energy consumption
- Set the distance constraints: When looking for the speed points, one should not only consider energy consumption but also the travel distance corresponding to the speed profile. The travel distance under each segment of each part is different because the segments are discretized by the same time interval. As a result, under the same segment, different speed profiles will lead to different travel distances. However, the travel distance of each road section is fixed. Therefore, it is necessary to set the travel distance as a constraint condition. The speed profiles selected from the second-level speed profiles formed by the speed points after they are discretized should satisfy the distance constraint. Denote the length of a road section as s and the first-level speed profile obtained from Section 3 as , then this speed profile is divided into n parts in which the new speed points will be filled with a time interval of 1 s. The corresponding distance constraint of each part is shown in Equations (21) and (22):
- Obtain the candidate second-level speed profiles: Suppose the starting speed point is the source point. At this time, the set of speed points is . Add an adjacent point in the next segment of the , . Then add an adjacent point in the next segment of the , , and repeat this until the added speed point is the final speed , and finally .
- Store the speed profile that meets the conditions and the corresponding energy consumption: For a certain speed profile, and the corresponding travel distance is . If satisfies the distance constraint condition of step 1, then this speed profile and the corresponding energy consumption are recorded.
- Traverse all possible speed profiles: If a certain speed profile is obtained, look for a speed point that can generate a new adjacent point along the opposite direction of its speed point generation sequence, and expand it to form a new speed profile, then go to step 3. Repeat this process until all possible speed profiles in the weighted directed graph have been traversed.
- Obtain the second-level speed profiles we want: sort the energy consumption and select the speed profile corresponding to the highest or lowest energy consumption according to different driving styles.
- 4.
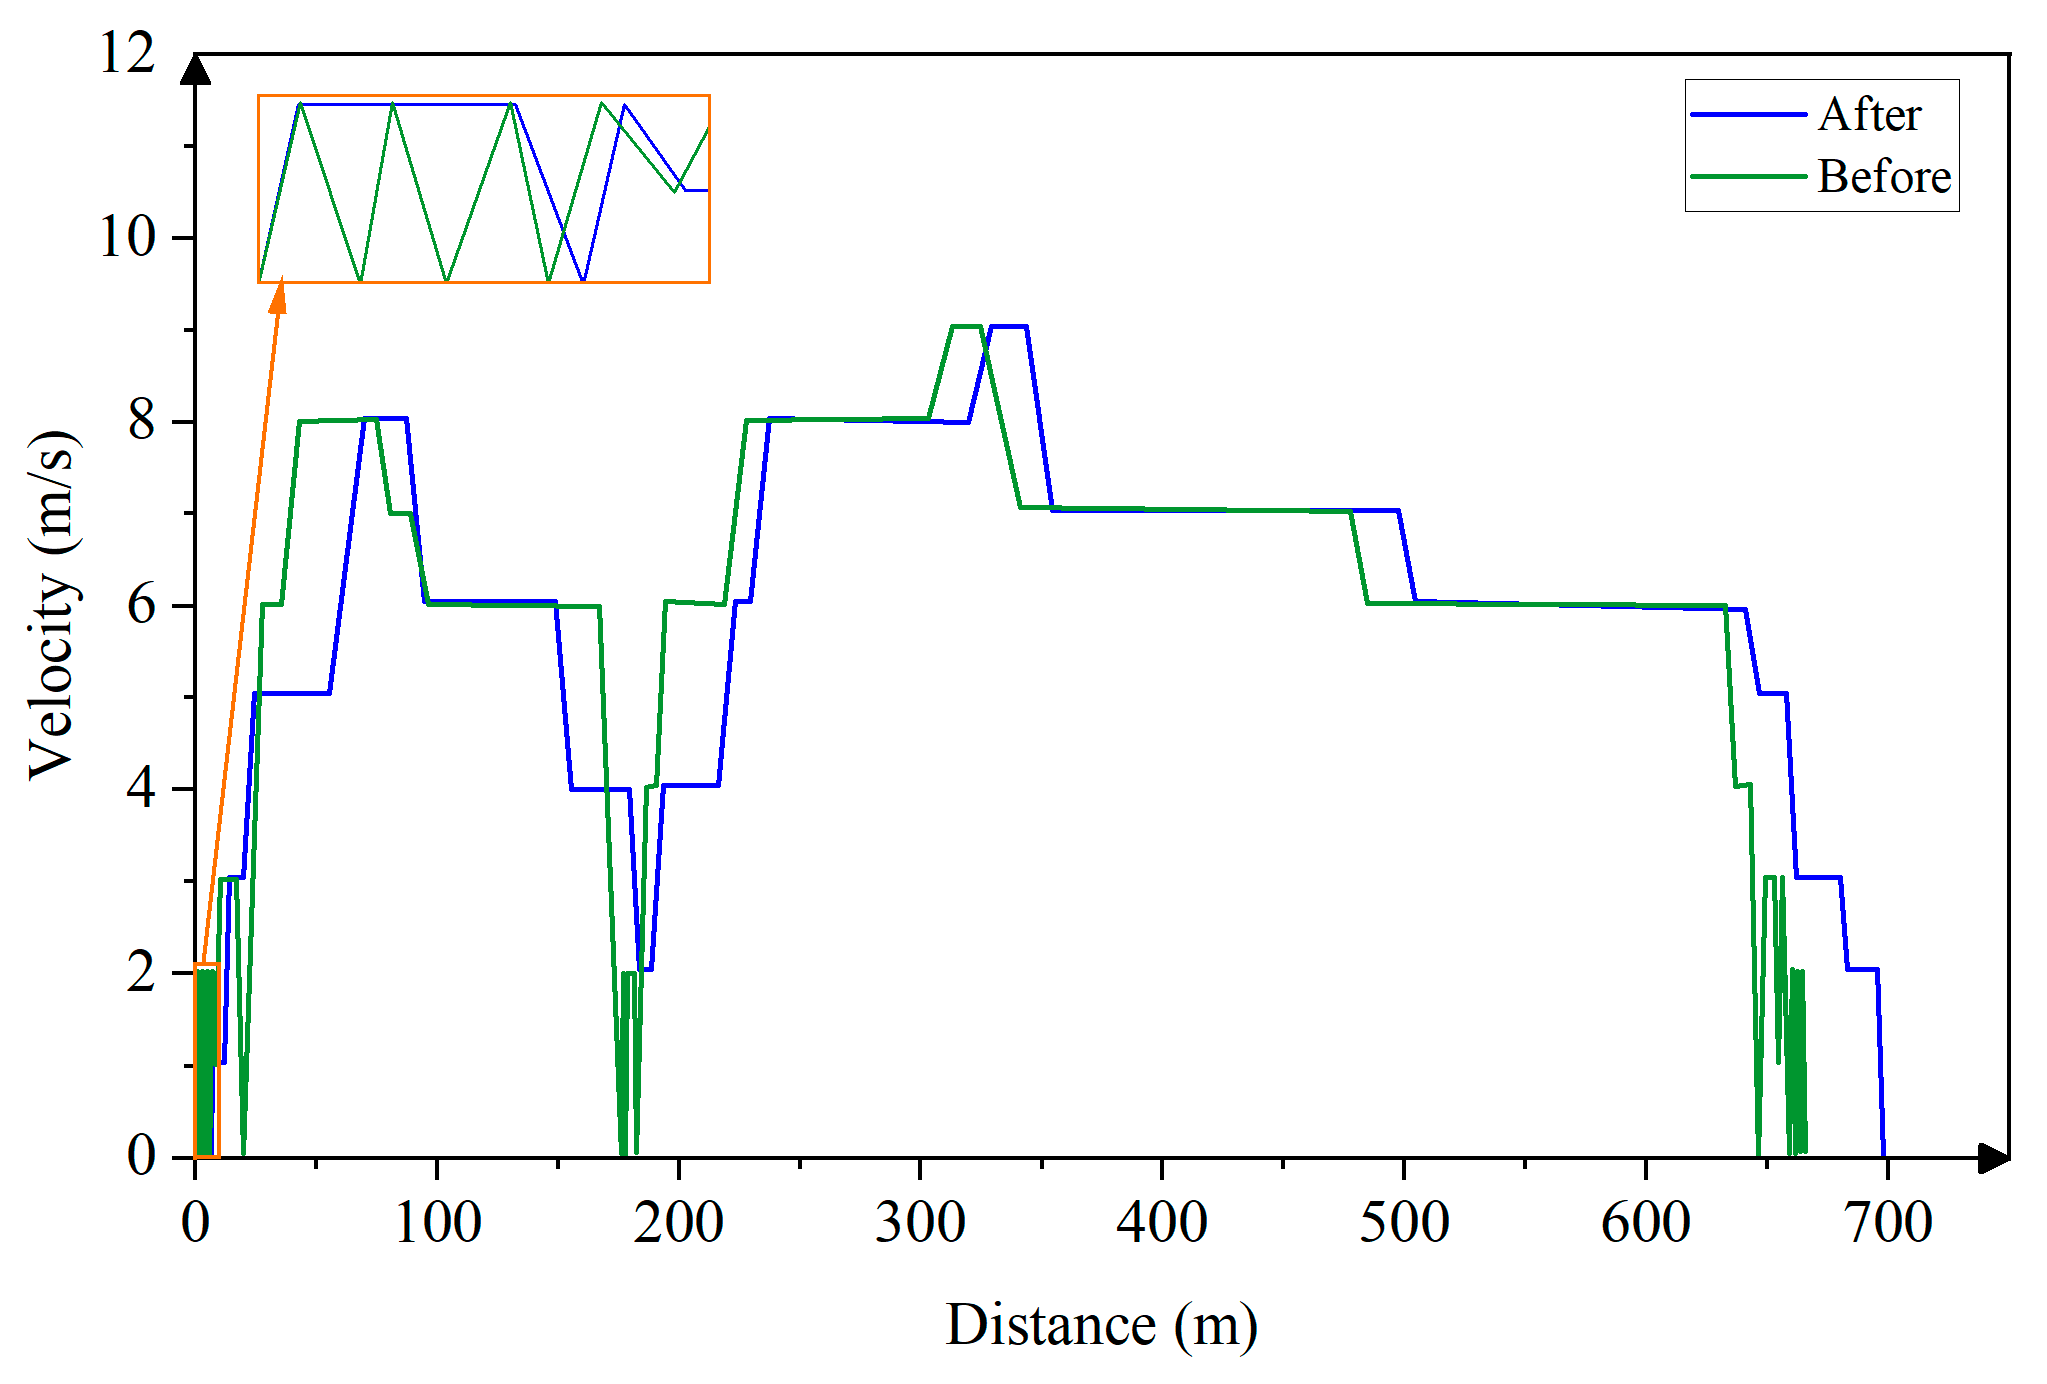
- Re-select the speed profiles corresponding to the minimum energy consumption.
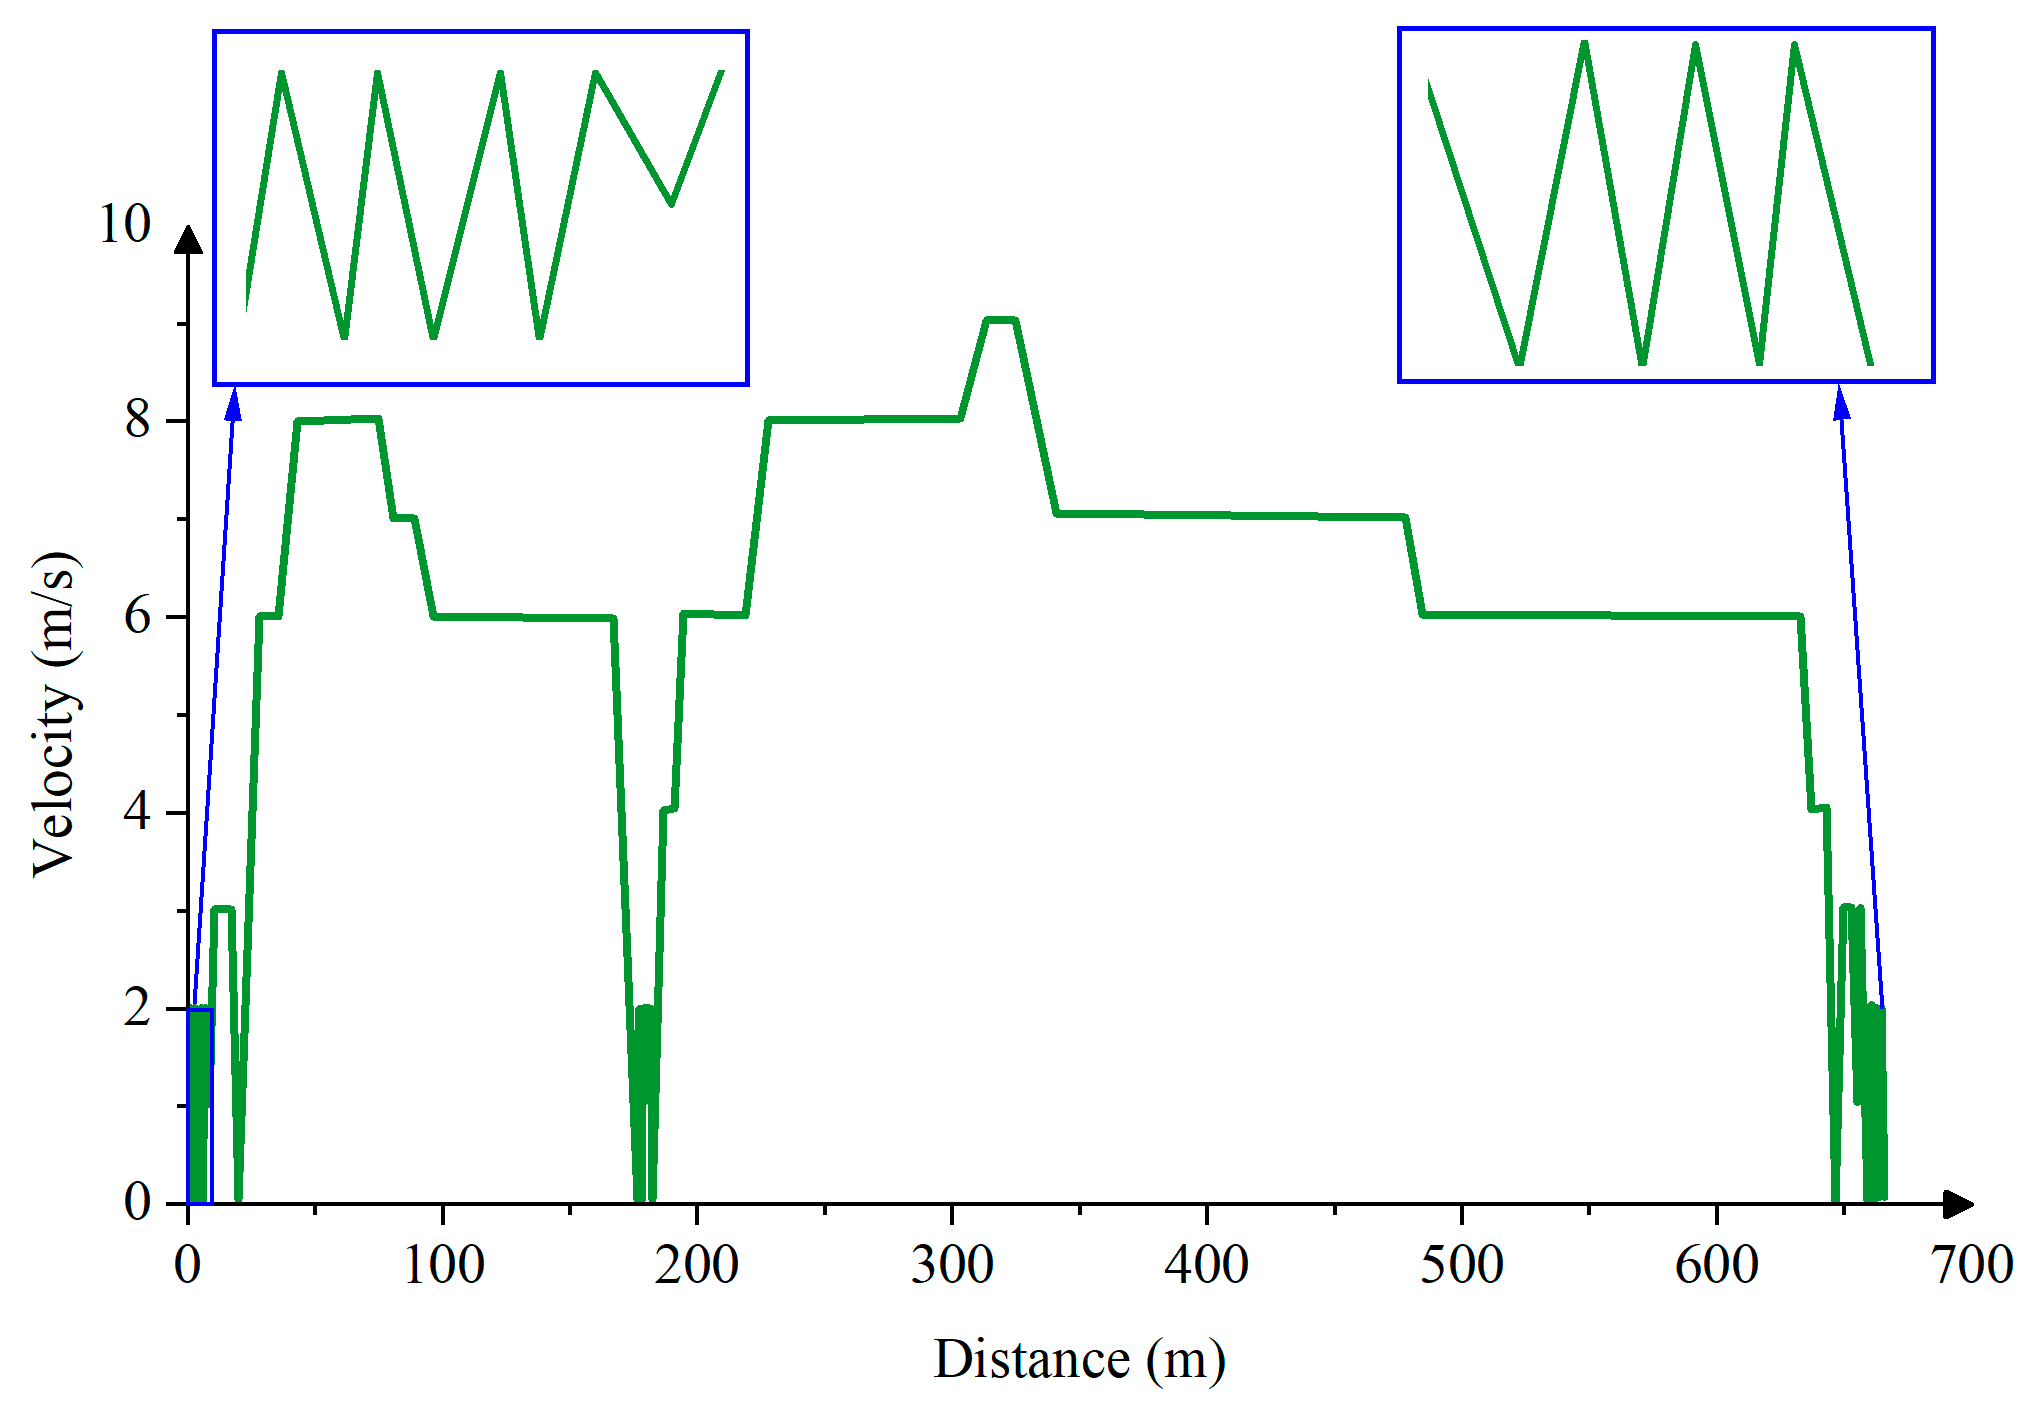
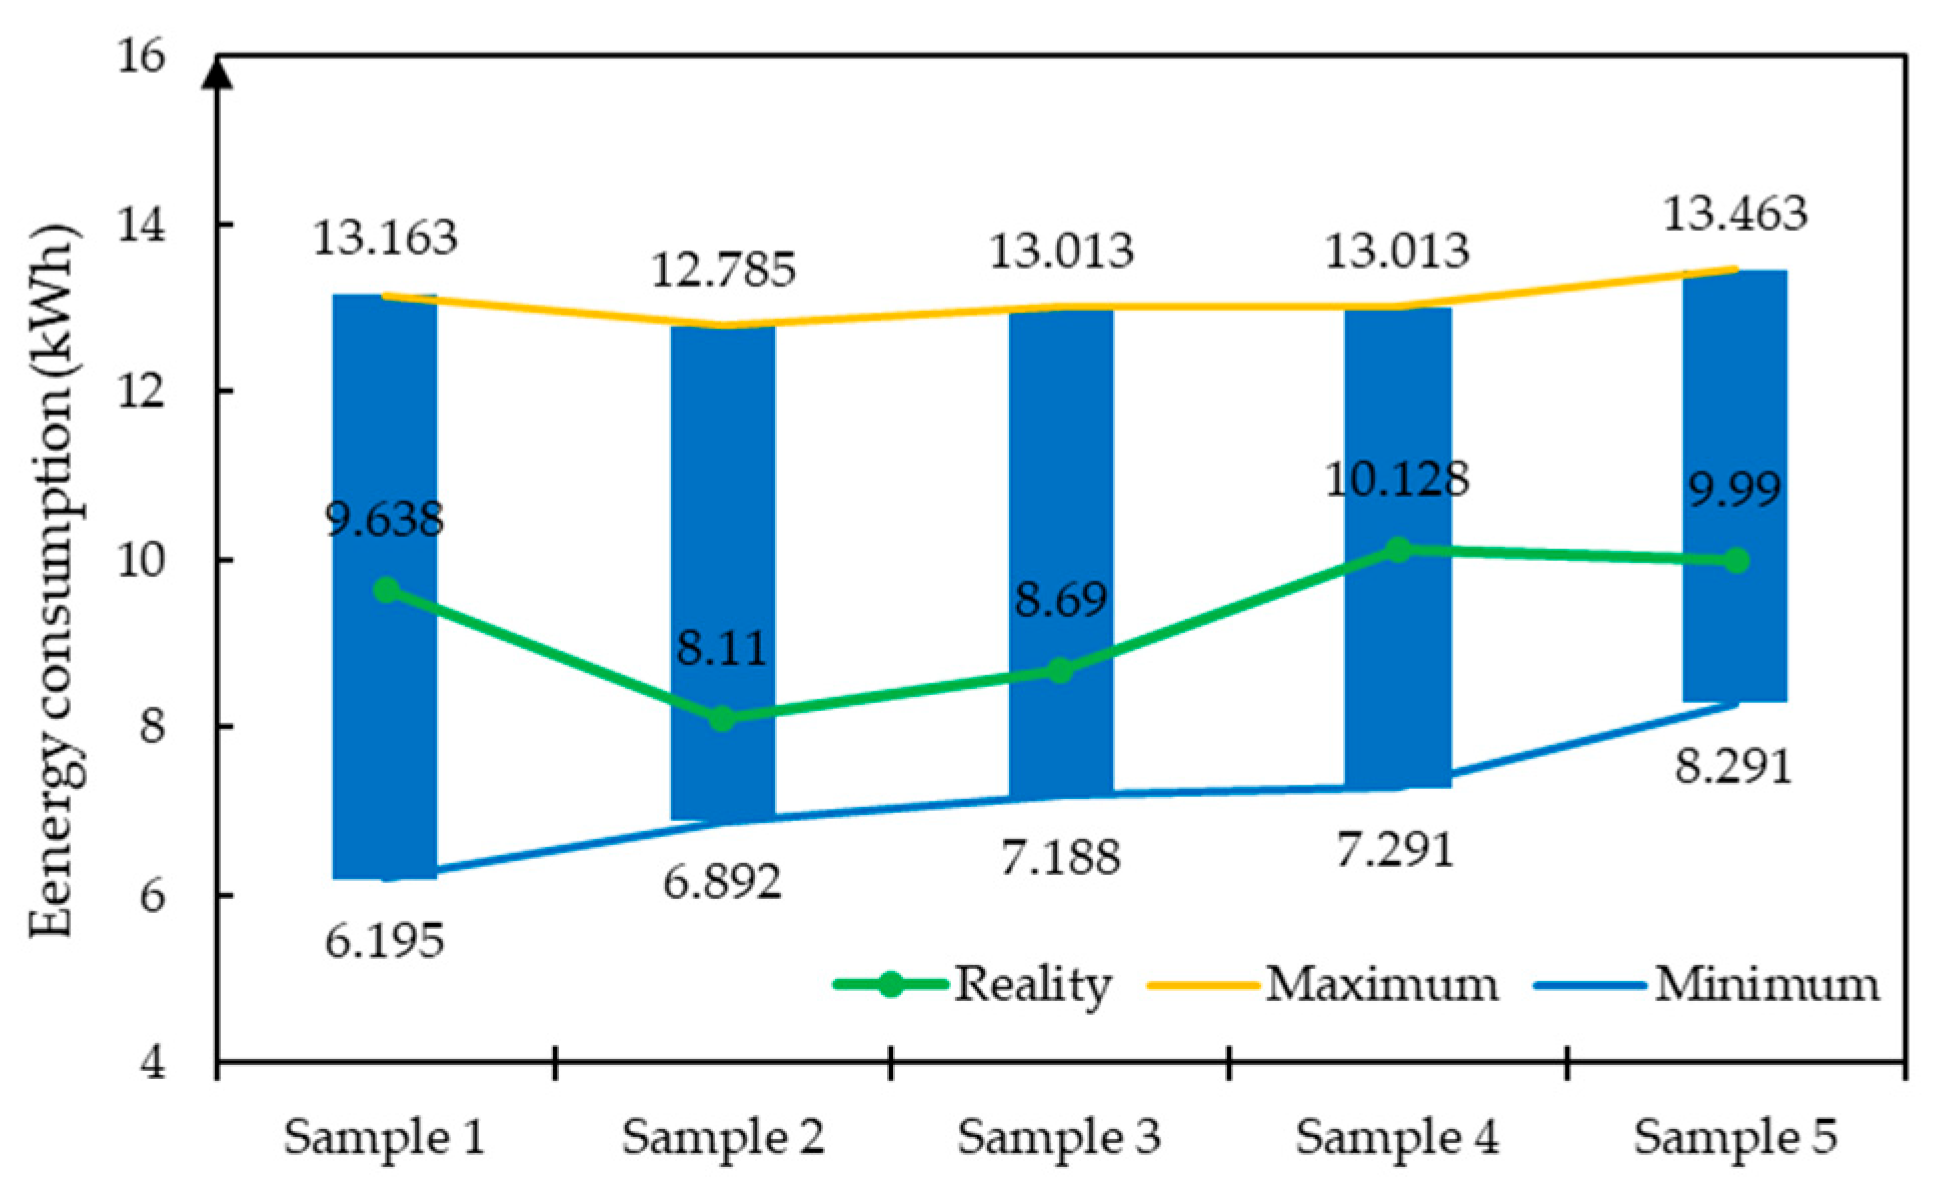
4.3. Estimation Results and Validation
5. Discussion and Conclusions
Author Contributions
Funding
Data Availability Statement
Conflicts of Interest
References
- Lajunen, A.; Lipman, T. Lifecycle cost assessment and carbon dioxide emissions of diesel, natural gas, hybrid electric, fuel cell hybrid and electric transit buses. Energy 2016, 106, 329–342. [Google Scholar] [CrossRef]
- Basso, R.; Kulcsar, B.; Egardt, B.; Lindroth, P.; Sanchez-Diaz, I. Energy consumption estimation integrated into the Electric Vehicle Routing Problem. Transp. Res. 2019, 69, 141–167. [Google Scholar] [CrossRef]
- Xing, J.; Chu, L.; Hou, Z.; Sun, W.; Zhang, Y. Energy Management Strategy Based on a Novel Speed Prediction Method. Sensors 2021, 21, 8273. [Google Scholar] [CrossRef] [PubMed]
- Boynuegri, A.R.; Uzunoglu, M.; Erdinc, O.; Gokalp, E. A new perspective in grid connection of electric vehicles: Different operating modes for elimination of energy quality problems. Appl. Energy 2014, 132, 435–451. [Google Scholar] [CrossRef]
- Liu, D.; Zeng, P.; Cui, S.; Song, C. Deep Reinforcement Learning for Charging Scheduling of Electric Vehicles Considering Distribution Network Voltage Stability. Sensors 2023, 23, 1618. [Google Scholar] [CrossRef] [PubMed]
- Qi, X.; Wu, G.; Boriboonsomsin, K.; Barth, M.J. Data-driven decomposition analysis and estimation of link-level electric vehicle energy consumption under real-world traffic conditions. Transp. Res. Part D Transp. Environ. 2018, 64, 36–52. [Google Scholar] [CrossRef]
- Gupta, S.; Deshpande, S.R.; Tulpule, P.; Canova, M.; Rizzoni, G. An Enhanced Driver Model for Evaluating Fuel Economy on Real-World Routes. IFAC-PapersOnLine 2019, 52, 574–579. [Google Scholar] [CrossRef]
- Li, P.; Zhang, Y.; Zhang, Y.; Zhang, K.; Jiang, M. The effects of dynamic traffic conditions, route characteristics and environmental conditions on trip-based electricity consumption prediction of electric bus. Energy 2021, 218, 119437. [Google Scholar] [CrossRef]
- Ellison, A.B.; Greaves, S.P.; Bliemer, M. Driver behaviour profiles for road safety analysis. Accid. Anal. Prev. 2015, 76, 118–132. [Google Scholar] [CrossRef] [PubMed]
- Marc, G.; Tobias, M.; Thomas, H. Estimation of the energy demand of electric buses based on real-world data for large-scale public transport networks. Appl. Energy 2018, 230, 344–356. [Google Scholar]
- EI-Taweel, N.A.; Zidan, A.; Farag, H.E.Z. Novel Electric Bus Energy Consumption Model Based on Probabilistic Synthetic Speed Profile Integrated With HVAC. IEEE Trans. Intell. Transp. Syst. 2021, 22, 1517–1531. [Google Scholar] [CrossRef]
- Rogge, M.; Evelien, V.; Larsen, A.; Sauer, D.U. Electric bus fleet size and mix problem with optimization of charging infrastructure. Appl. Energy 2018, 211, 282–295. [Google Scholar] [CrossRef]
- Pamula, T.; Pamula, D. Prediction of Electric Buses Energy Consumption from Trip Parameters Using Deep Learning. Energies 2022, 15, 1747–1765. [Google Scholar] [CrossRef]
- Huang, Y.; Wang, H.; Khajepour, A.; He, H.; Ji, J. Model predictive control power management strategies for HEVs: A review. J. Power Sources 2017, 341, 91–106. [Google Scholar] [CrossRef]
- Shin, J.; Sunwoo, M. Vehicle Speed Prediction Using a Markov Chain With Speed Constraints. IEEE Trans. Intell. Transp. Syst. 2019, 20, 3201–3211. [Google Scholar] [CrossRef]
- Zhang, J.; Wang, Z.; Liu, P.; Zhang, Z. Energy consumption analysis and prediction of electric vehicles based on real-world driving data. Appl. Energy 2020, 275, 115408. [Google Scholar] [CrossRef]
- Sun, C.; Hu, X.; Moura, S.J.; Sun, F. Velocity Predictors for Predictive Energy Management in Hybrid Electric Vehicles. IEEE Trans. Control Syst. Technol. 2015, 23, 1197–1204. [Google Scholar]
- Wang, J.; Chen, R.; He, Z. Traffic speed prediction for urban transportation network: A path based deep learning approach. Transp. Res. Part C Emerg. Technol. 2019, 100, 372–385. [Google Scholar] [CrossRef]
- Gu, Y.; Lu, W.; Qin, L.; Li, M.; Shao, Z. Short-term prediction of lane-level traffic speeds: A fusion deep learning model. Transp. Res. Part C Emerg. Technol. 2019, 106, 1–16. [Google Scholar] [CrossRef]
- Lin, X.; Zhang, G.; Wei, S. Velocity prediction using Markov Chain combined with driving pattern recognition and applied to Dual-Motor Electric Vehicle energy consumption evaluation. Transp. Res. Part C Emerg. Technol. 2021, 101, 106998. [Google Scholar] [CrossRef]
- Morlock, F.; Rolle, B.; Bauer, M.; Sawodny, O. Forecasts of Electric Vehicle Energy Consumption Based on Characteristic Speed Profiles and Real-Time Traffic Data. IEEE Trans. Veh. Technol. 2020, 69, 1404–1418. [Google Scholar] [CrossRef]
- Fiori, C.; Ahn, K.; Rakha, H.A. Power-based electric vehicle energy consumption model: Model development and validation. Appl. Energy 2016, 168, 257–268. [Google Scholar] [CrossRef]
- Guo, Z.; Chu, L.; Hou, Z.; Wang, Y.; Hu, J.; Sun, W. A Dual Distribution Control Method for Multi-Power Components Energy Output of 4WD Electric Vehicles. Sensors 2022, 22, 9597. [Google Scholar] [CrossRef]
- Ilyès, M.; Fotouhi, A.; Ewin, N. Electric vehicle energy consumption modelling and estimation—A case study. Int. J. Energy Res. 2021, 45, 501–520. [Google Scholar]
- Wu, X.; Freese, D.; Cabrera, A.; Kitch, W.A. Electric vehicles’ energy consumption measurement and estimation. Transp. Res. Part D Transp. Environ. 2015, 34, 52–67. [Google Scholar] [CrossRef]
- Olli, V.; Joni, M. Feasibility of electric buses in public transport. World Electr. Veh. J. 2015, 7, 357–365. [Google Scholar] [CrossRef]
- Liu, K.; Wang, J.; Yamamoto, T.; Morikawa, T. Exploring the interactive effects of ambient temperature and vehicle auxiliary loads on electric vehicle energy consumption. Appl. Energy 2018, 227, 324–331. [Google Scholar] [CrossRef]
- Cauwer, C.D.; Mierlo, J.V.; Coosemans, T. Energy Consumption Prediction for Electric Vehicles Based on Real-World Data. Energies 2015, 8, 8573–8593. [Google Scholar] [CrossRef]
- Ullah, I.; Liu, K.; Yamamoto, T.; Zahid, M.; Jamal, A. Electric vehicle energy consumption prediction using stacked generalization: An ensemble learning approach. Int. J. Green Energy 2021, 18, 896–909. [Google Scholar] [CrossRef]
- Yao, J.; Moawad, A. Vehicle energy consumption estimation using large scale simulations and machine learning methods. Transp. Res. Part C Emerg. Technol. 2019, 101, 276–296. [Google Scholar] [CrossRef]
- GB/T 32960.3-2016; Technical Specifications of Remote Service and Management System for Electric Vehicles—Part 3: Communication Protocol and Data Format. Standardization Administration of China: Beijing, China, 2016.
- Mohammadnazar, A.; Arvin, R.; Khattak, A.J. Classifying travelers’ driving style using basic safety messages generated by connected vehicles: Application of unsupervised machine learning. Transp. Res. Part C Emerg. Technol. 2021, 122, 102917. [Google Scholar] [CrossRef]
- Martinez, C.M.; Heucke, M.; Wang, F.Y.; Gao, B.; Cao, D. Driving Style Recognition for Intelligent Vehicle Control and Advanced Driver Assistance: A Survey. IEEE Trans. Intell. Transp. Syst. 2018, 19, 666–676. [Google Scholar] [CrossRef]
- Useche, S.A.; Cendales, B.; Alonso, F.; Pastor, J.C.; Montoro, L. Validation of the Multidimensional Driving Style Inventory (MDSI) in professional drivers: How does it work in transportation workers? Transp. Res. Part F Psychol. Behav. 2019, 67, 155–163. [Google Scholar] [CrossRef]
- Padmarajan, B.V.; Mcgordon, A.; Jennings, P.A. An investigation on the effect of driver style and driving events on energy demand of a PHEV. World Electr. Veh. J. 2012, 5, 173–181. [Google Scholar] [CrossRef]
- Mantouka, E.G.; Barmpounakis, E.N.; Vlahogianni, E.I. Identifying driving safety profiles from smartphone data using unsupervised learning. Saf. Sci. 2019, 119, 84–90. [Google Scholar] [CrossRef]
- Bejani, M.M.; Ghatee, M. A context aware system for driving style evaluation by an ensemble learning on smartphone sensors data. Transp. Res. Part C Emerg. Technol. 2018, 89, 303–320. [Google Scholar] [CrossRef]
- Wang, Z.; Zhang, J.; Liu, P.; Qu, C.; Li, X. Driving Cycle Construction for Electric Vehicles Based on Markov Chain and Monte Carlo Method: A Case Study in Beijing. Appl. Energy 2019, 253, 113514. [Google Scholar] [CrossRef]
- GB/T 4970-2009; Method of Running Test—Automotive Ride Comfort. Standardization Administration of China: Beijing, China, 2009.


| VIN | Time | Accumulated Range (0.1 km) | Velocity (0.1 km/h) | Longitude (0.0000001°) | Latitude (0.0000001°) | … |
|---|---|---|---|---|---|---|
| a28d15… | 20200309085620 | 389274 | 340 | 125364133 | 43848481 | … |
| ee7f6c… | 20200309085622 | 395804 | 21 | 125369614 | 43879980 | … |
| 73ac7b… | 20200309085622 | 371595 | 252 | 125370243 | 43878843 | … |
| 2d48de… | 20200309085622 | 377382 | 17 | 125346695 | 43894232 | … |
| a28d15… | 20200309085622 | 388709 | 53 | 125346810 | 43894345 | … |
| ee7f6c… | 20200309085623 | 360104 | 567 | 125321736 | 43890836 | … |
| Index | Bus Station | Length (m) | Number of Lanes | Number of Intersections | Number of Lights |
|---|---|---|---|---|---|
| 1 | The Children’s Hospital→Cultural Street | 650 | 1 | 3 | 1 |
| 2 | Cultural Street→City Hospital | 390 | 1 | 2 | 2 |
| 3 | City Hospital→Dajing Road | 450 | 2 | 3 | 1 |
| … | … | … | … | … | … |
| 24 | The Fourth Zone→Technical Secondary School | 250 | 2 | 2 | 1 |
| Level | No. |
|---|---|
| 1 | 2, 4, 5, 6 |
| 2 | 3, 11, 14, 15, 17, 18, 20, 22, 24 |
| 3 | 1, 7, 8, 9, 10, 12, 13, 16, 19, 21, 23 |
| No. | Workdays (or Holidays) | Weather | Time Period | Maximum Velocity (km/h) |
|---|---|---|---|---|
| 1 | workdays | sunny | 5:50–8:00 | 48 |
| 1 | workdays | sunny | 8:00–9:00 | 42 |
| 9:00–10:00 | 52 | |||
| 10:00–11:00 | 55 | |||
| 11:00–12:00 | 50 | |||
| 12:00–13:00 | 45 | |||
| 13:00–14:00 | 47 | |||
| 14:00–15:00 | 41 | |||
| 15:00–16:00 | 53 | |||
| 16:00–17:00 | 46 | |||
| 17:00–18:00 | 40 | |||
| 18:00–19:00 | 42 | |||
| 19:00–20:30 | 56 |
| Drivers’ Number | Average Velocity (km/h) | Velocity Standard Deviation | Maximum Velocity (km/h) | Average Accelerator Pedal Stroke Value (%) | Average Decelerator Pedal Stroke Value (%) | ⋯ |
|---|---|---|---|---|---|---|
| 0506_22487a_4 | 18.15 | 18.56 | 56.6 | 49.00 | 34.44 | … |
| 0506_2c62b9_4 | 21.05 | 18.39 | 60.2 | 48.48 | 32.95 | … |
| 0506_7a0784_4 | 15.72 | 16.79 | 55.7 | 33.85 | 30.79 | … |
| 0506_c032c0_4 | 19.97 | 15.81 | 46 | 40.47 | 31.25 | … |
| 0507_22487a_4 | 17.39 | 17.43 | 53.8 | 48.91 | 27.96 | … |
| 0508_22487a_3 | 16.58 | 15.92 | 49.1 | 35.78 | 31.00 | … |
| … | … | … | … | … | … | … |
| Label | Average Velocity (km/h) | Velocity Standard Deviation | Maximum Velocity (km/h) | Average Accelerator Pedal Stroke Value (%) | Average Decelerator Pedal Stroke Value (%) | ⋯ |
|---|---|---|---|---|---|---|
| 0 | 18.04 | 17.54 | 57.67 | 50.37 | 31.88 | ⋯ |
| 1 | 16.52 | 15.55 | 51.86 | 33.19 | 27.88 | ⋯ |
| Driver | Label |
|---|---|
| 0506_22487a_4 | 0 |
| 0506_2c62b9_4 | 0 |
| 0506_7a0784_4 | 1 |
| 0506_c032c0_4 | 0 |
| 0507_22487a_4 | 0 |
| 0508_22487a_3 | 0 |
| … | … |
| Parameter | Value | Unit |
|---|---|---|
| 1.18 | kg/m3 | |
| 0.7 | - | |
| 8.3 | m2 | |
| 10,700 | kg | |
| 0.008 | - | |
| 1.1 | - | |
| 0.96 | - | |
| 0.95 | - | |
| 0.99 | - | |
| 0.5 | - | |
| 400 | AH | |
| 6180 | V |
Disclaimer/Publisher’s Note: The statements, opinions and data contained in all publications are solely those of the individual author(s) and contributor(s) and not of MDPI and/or the editor(s). MDPI and/or the editor(s) disclaim responsibility for any injury to people or property resulting from any ideas, methods, instructions or products referred to in the content. |
© 2024 by the authors. Licensee MDPI, Basel, Switzerland. This article is an open access article distributed under the terms and conditions of the Creative Commons Attribution (CC BY) license (https://creativecommons.org/licenses/by/4.0/).
Share and Cite
Wang, P.; Liu, Q.; Xu, N.; Ou, Y.; Wang, Y.; Meng, Z.; Liu, N.; Fu, J.; Li, J. Energy Consumption Estimation Method of Battery Electric Buses Based on Real-World Driving Data. World Electr. Veh. J. 2024, 15, 314. https://doi.org/10.3390/wevj15070314
Wang P, Liu Q, Xu N, Ou Y, Wang Y, Meng Z, Liu N, Fu J, Li J. Energy Consumption Estimation Method of Battery Electric Buses Based on Real-World Driving Data. World Electric Vehicle Journal. 2024; 15(7):314. https://doi.org/10.3390/wevj15070314
Chicago/Turabian StyleWang, Peng, Qiao Liu, Nan Xu, Yang Ou, Yi Wang, Zaiqiang Meng, Ning Liu, Jiyao Fu, and Jincheng Li. 2024. "Energy Consumption Estimation Method of Battery Electric Buses Based on Real-World Driving Data" World Electric Vehicle Journal 15, no. 7: 314. https://doi.org/10.3390/wevj15070314
APA StyleWang, P., Liu, Q., Xu, N., Ou, Y., Wang, Y., Meng, Z., Liu, N., Fu, J., & Li, J. (2024). Energy Consumption Estimation Method of Battery Electric Buses Based on Real-World Driving Data. World Electric Vehicle Journal, 15(7), 314. https://doi.org/10.3390/wevj15070314