

Visual Detection of Traffic Incident through Automatic Monitoring of Vehicle Activities
 , ,
, ,  ,
, 
Abstract
:1. Introduction
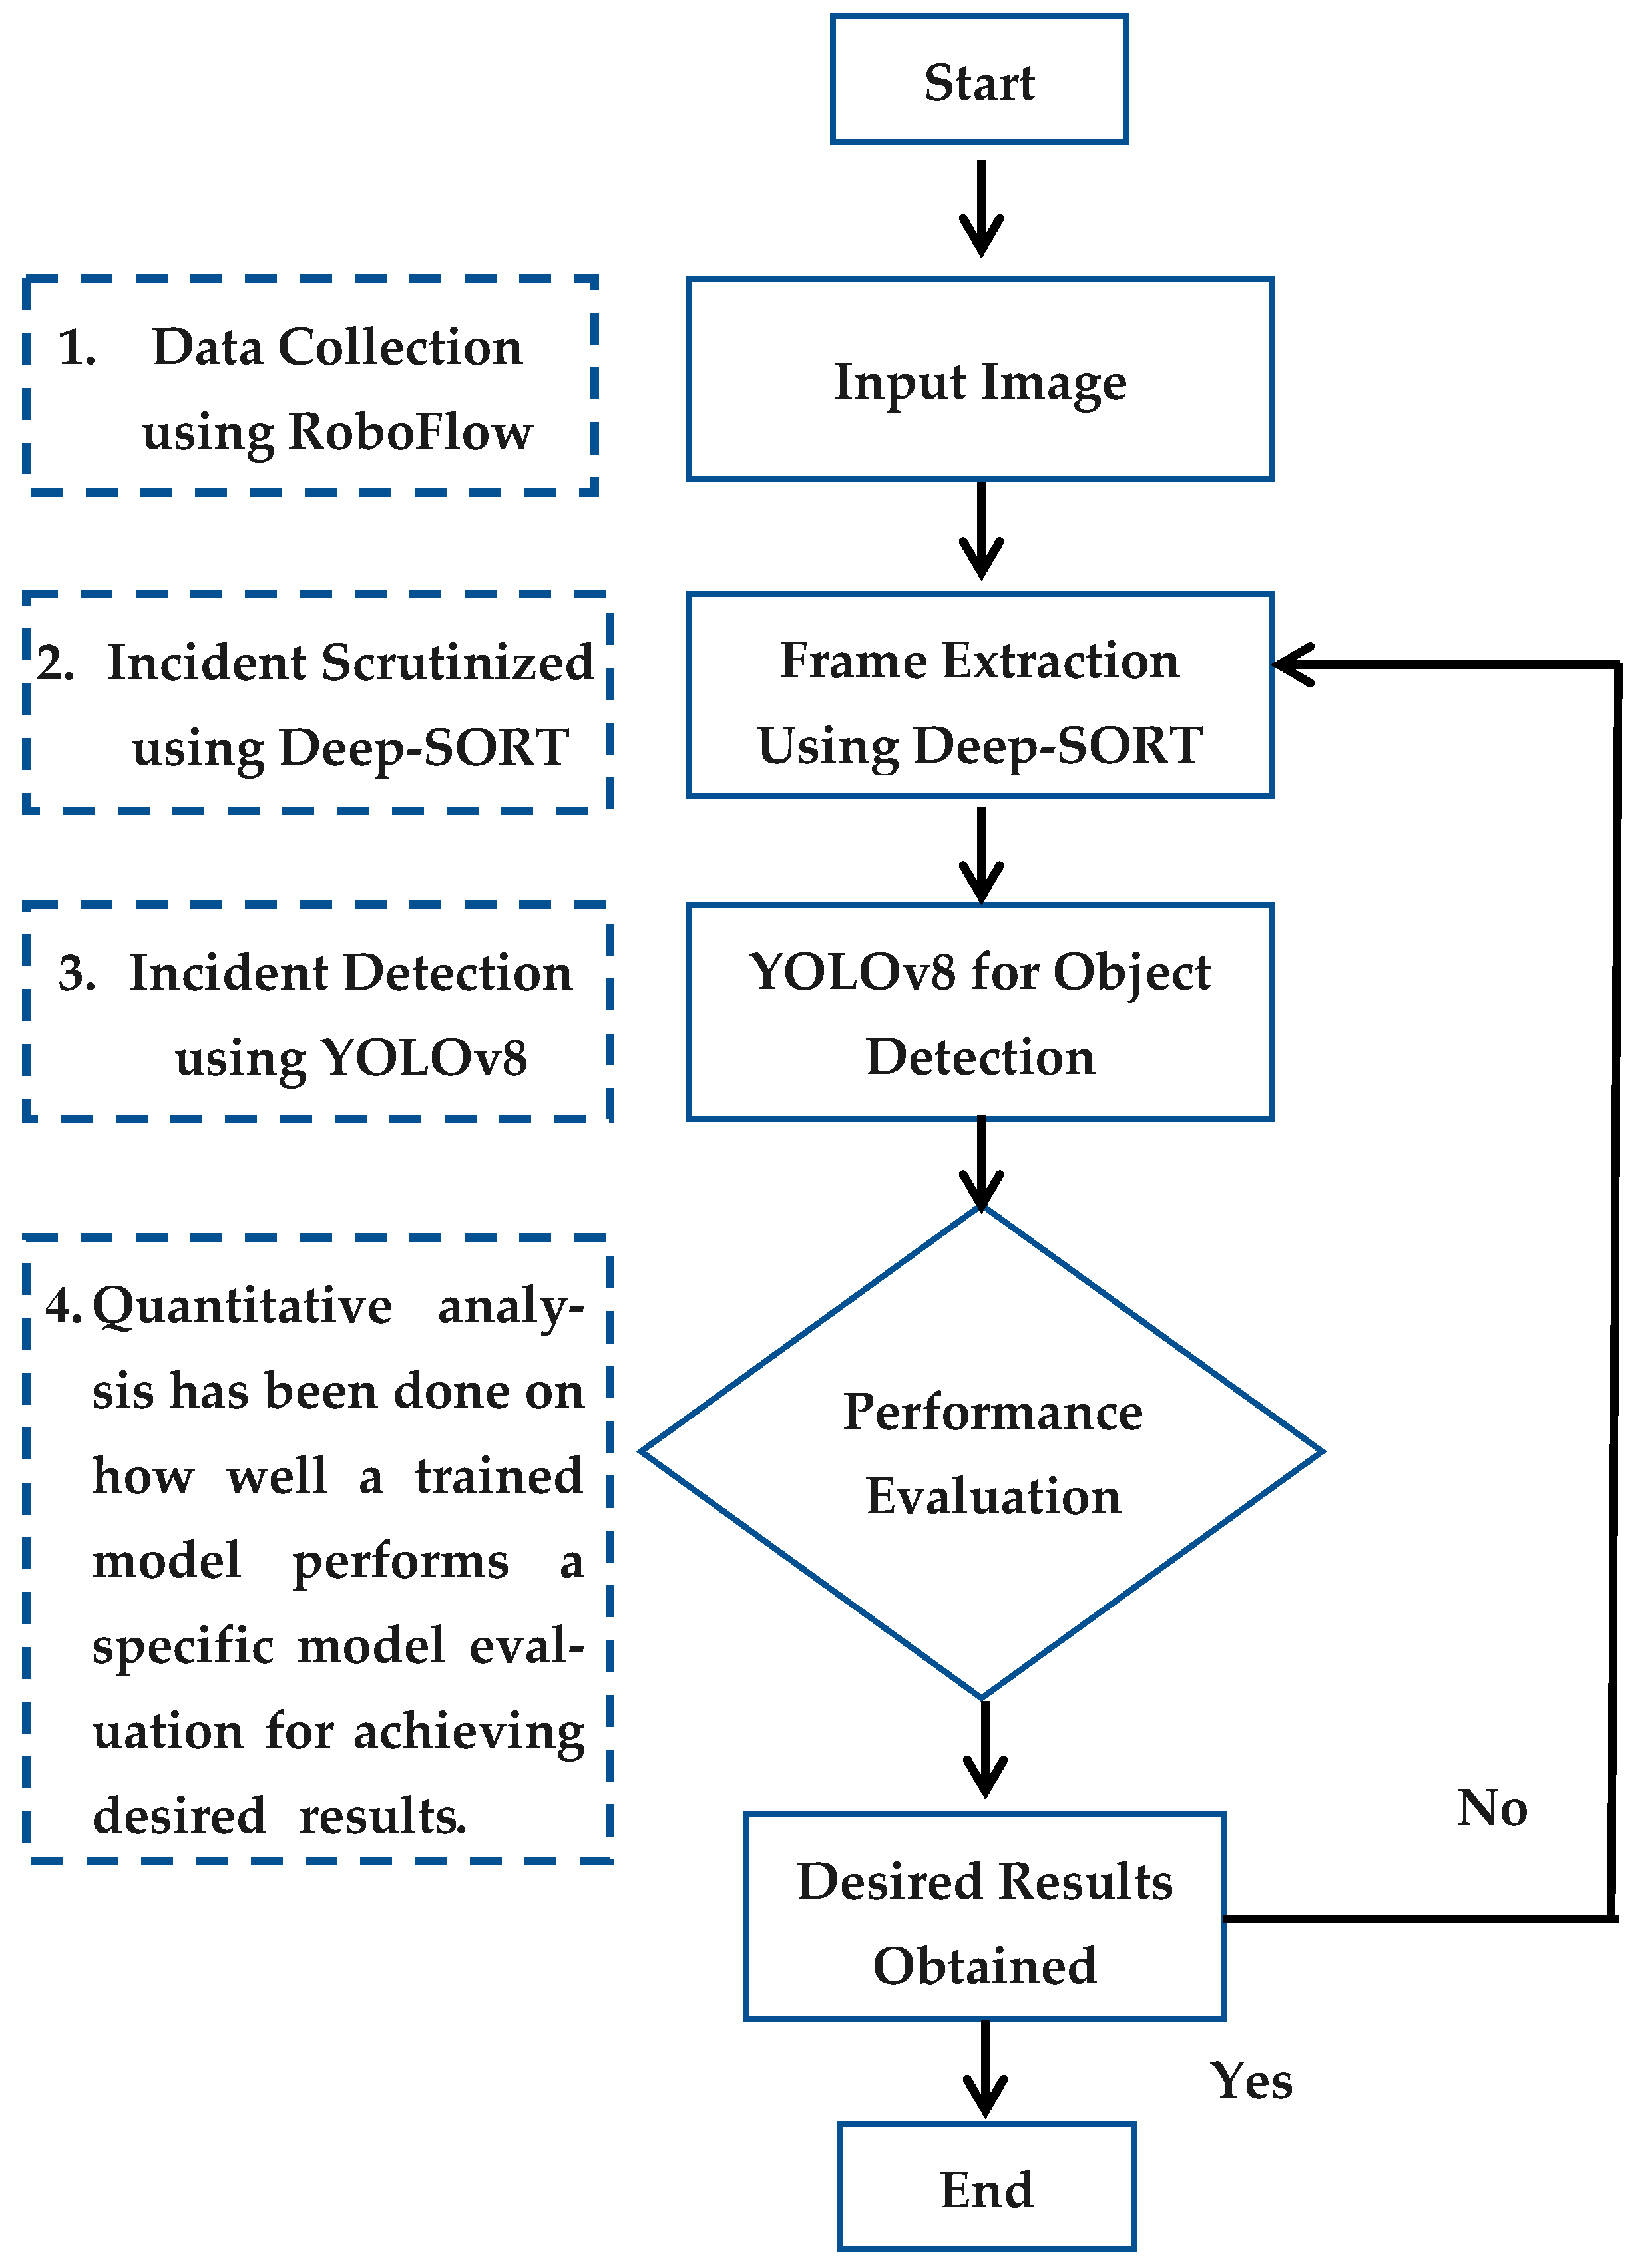
- Video streams from road surveillance cameras are collected as input data using Roboflow.
- Video frames are preprocessed to enhance image quality and reduce noise through Deep-SORT.
- The YOLOv8 model is initialized with pre-trained weights obtained from a large dataset. The model is fine-tuned using the labeled dataset. After training, the model is capable of real-time accident detection.
- Upon accident detection, immediate alerts are generated and directed to relevant authorities or integrated into broader traffic management systems.
2. Research Method
2.1. Setting for Yolo Implementation
2.2. Dataset
2.3. Data Annotation
2.4. Data Augmentation
2.5. Model Training
2.6. System Integration
3. Results and Discussion
3.1. Training and Validation Phase
3.2. Recall–Confidence
3.3. Precision–Confidence
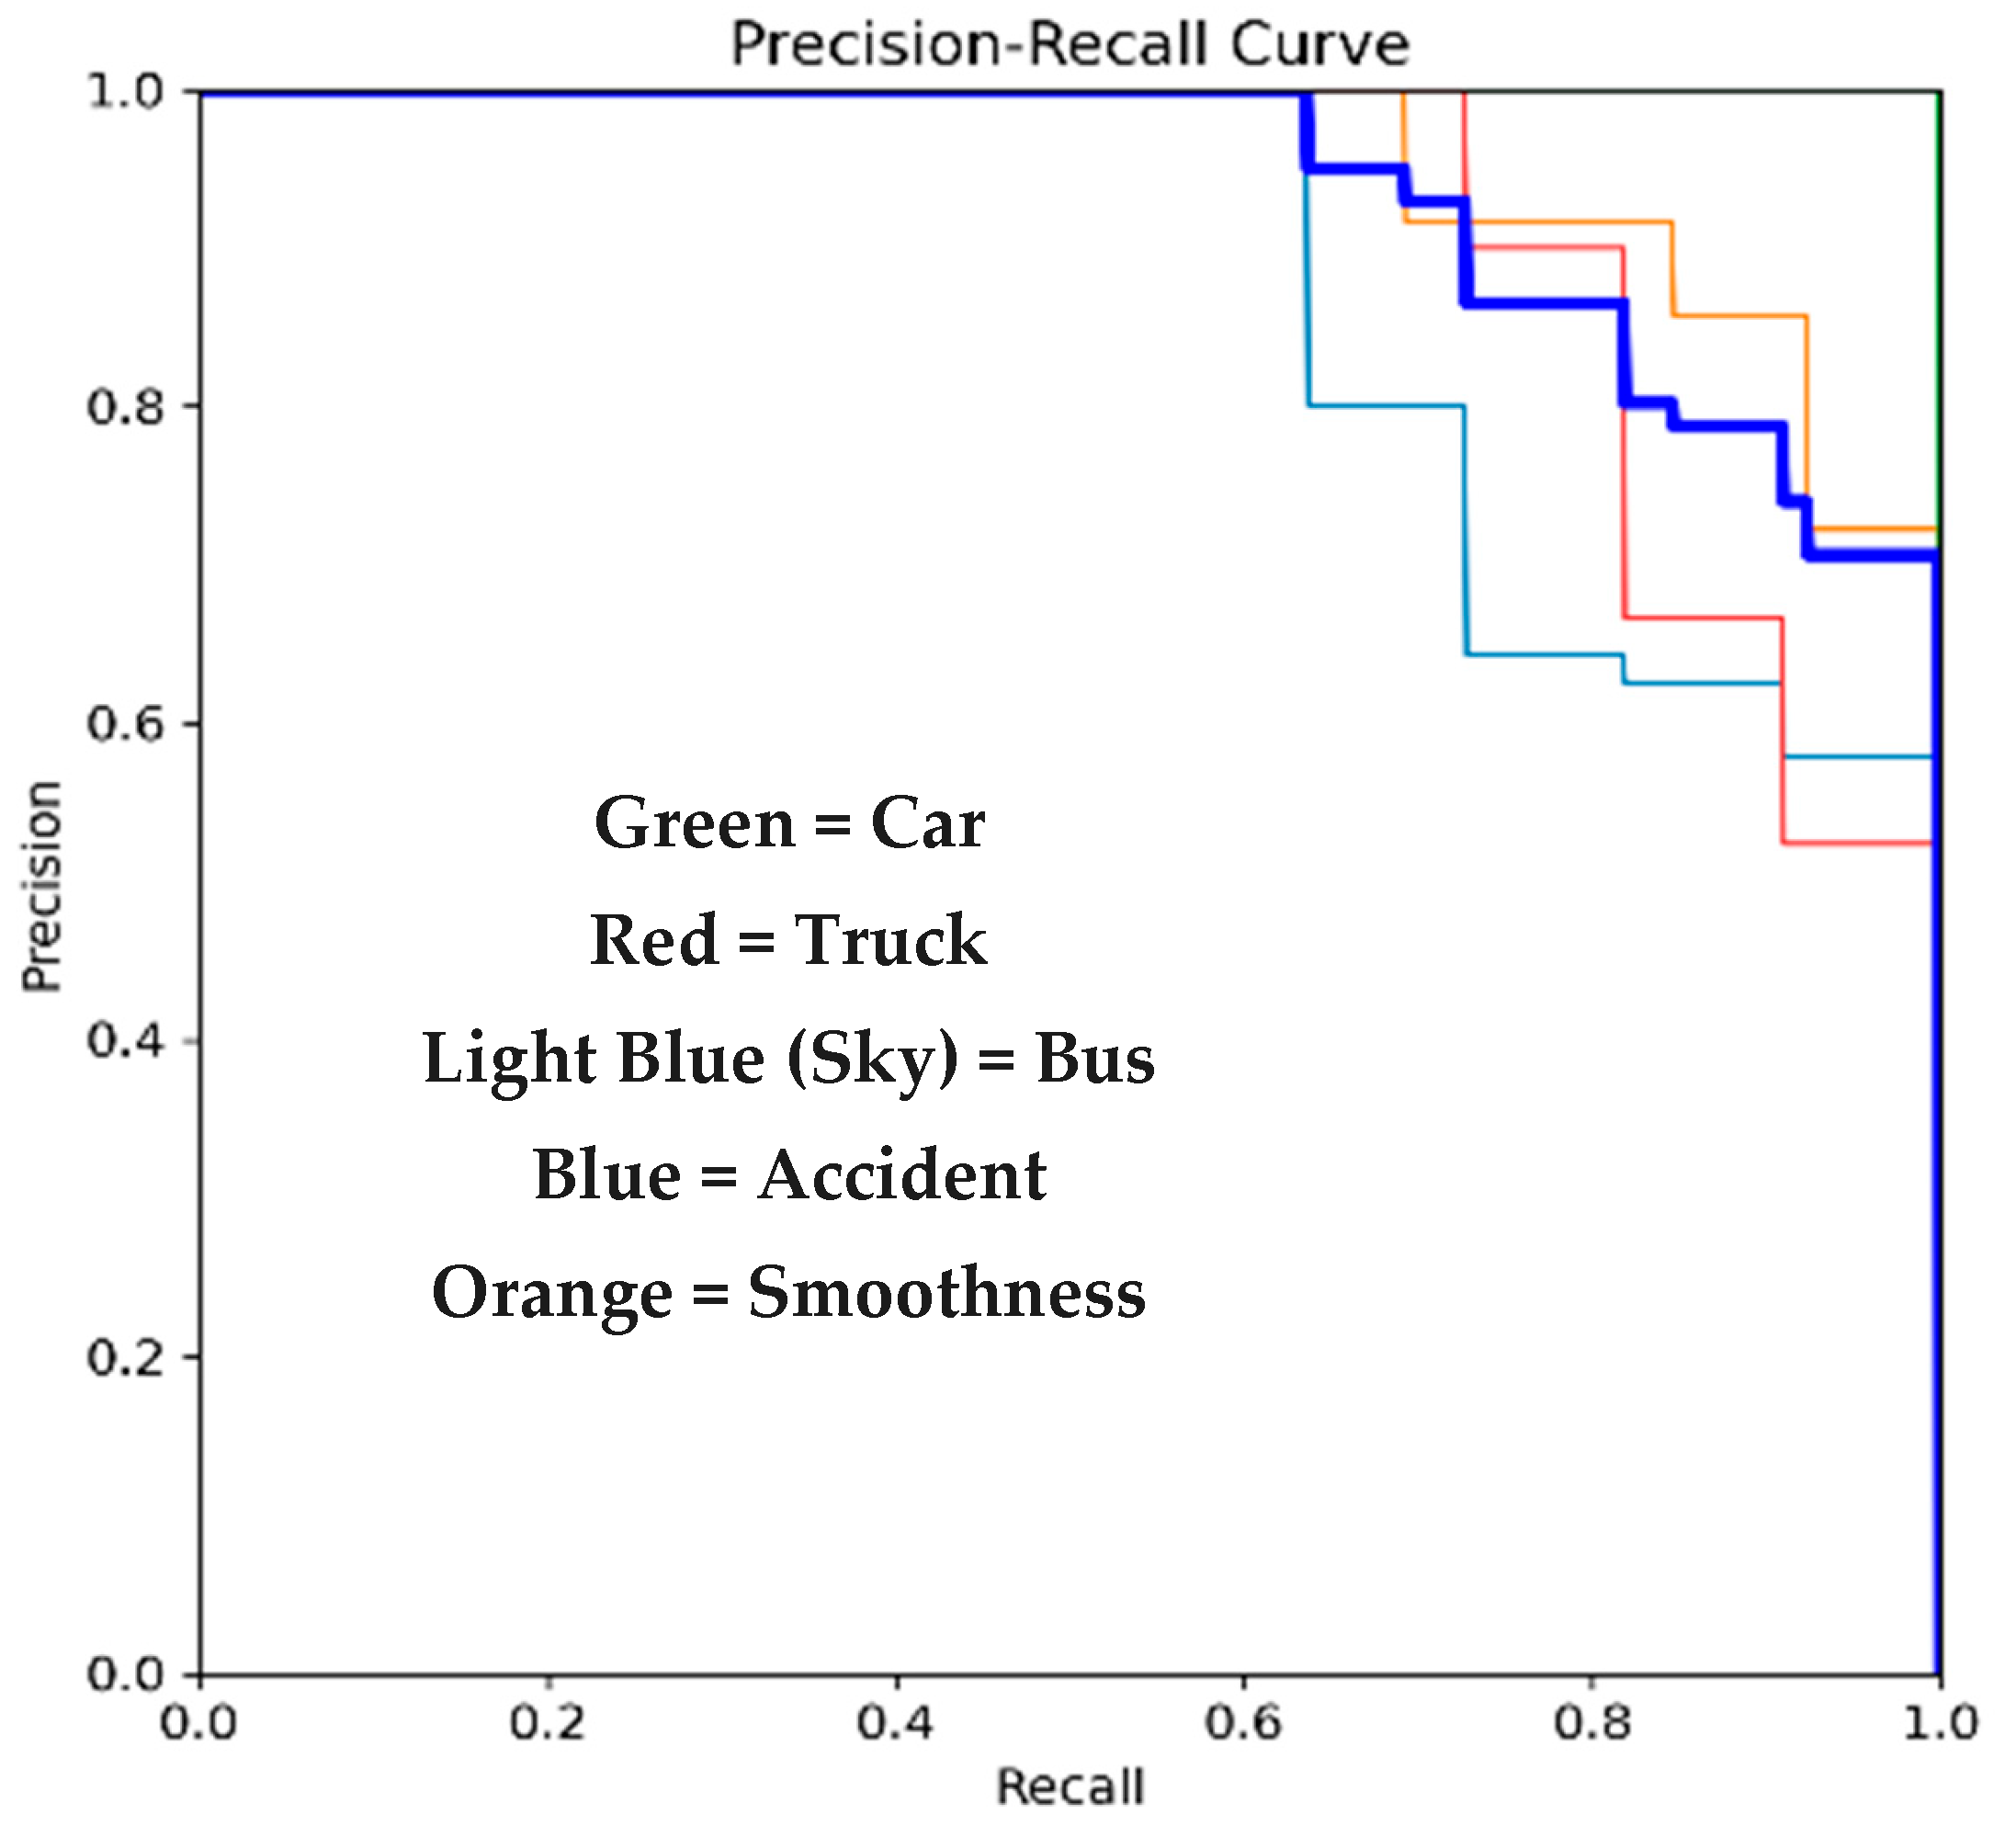
3.4. Precision–Recall
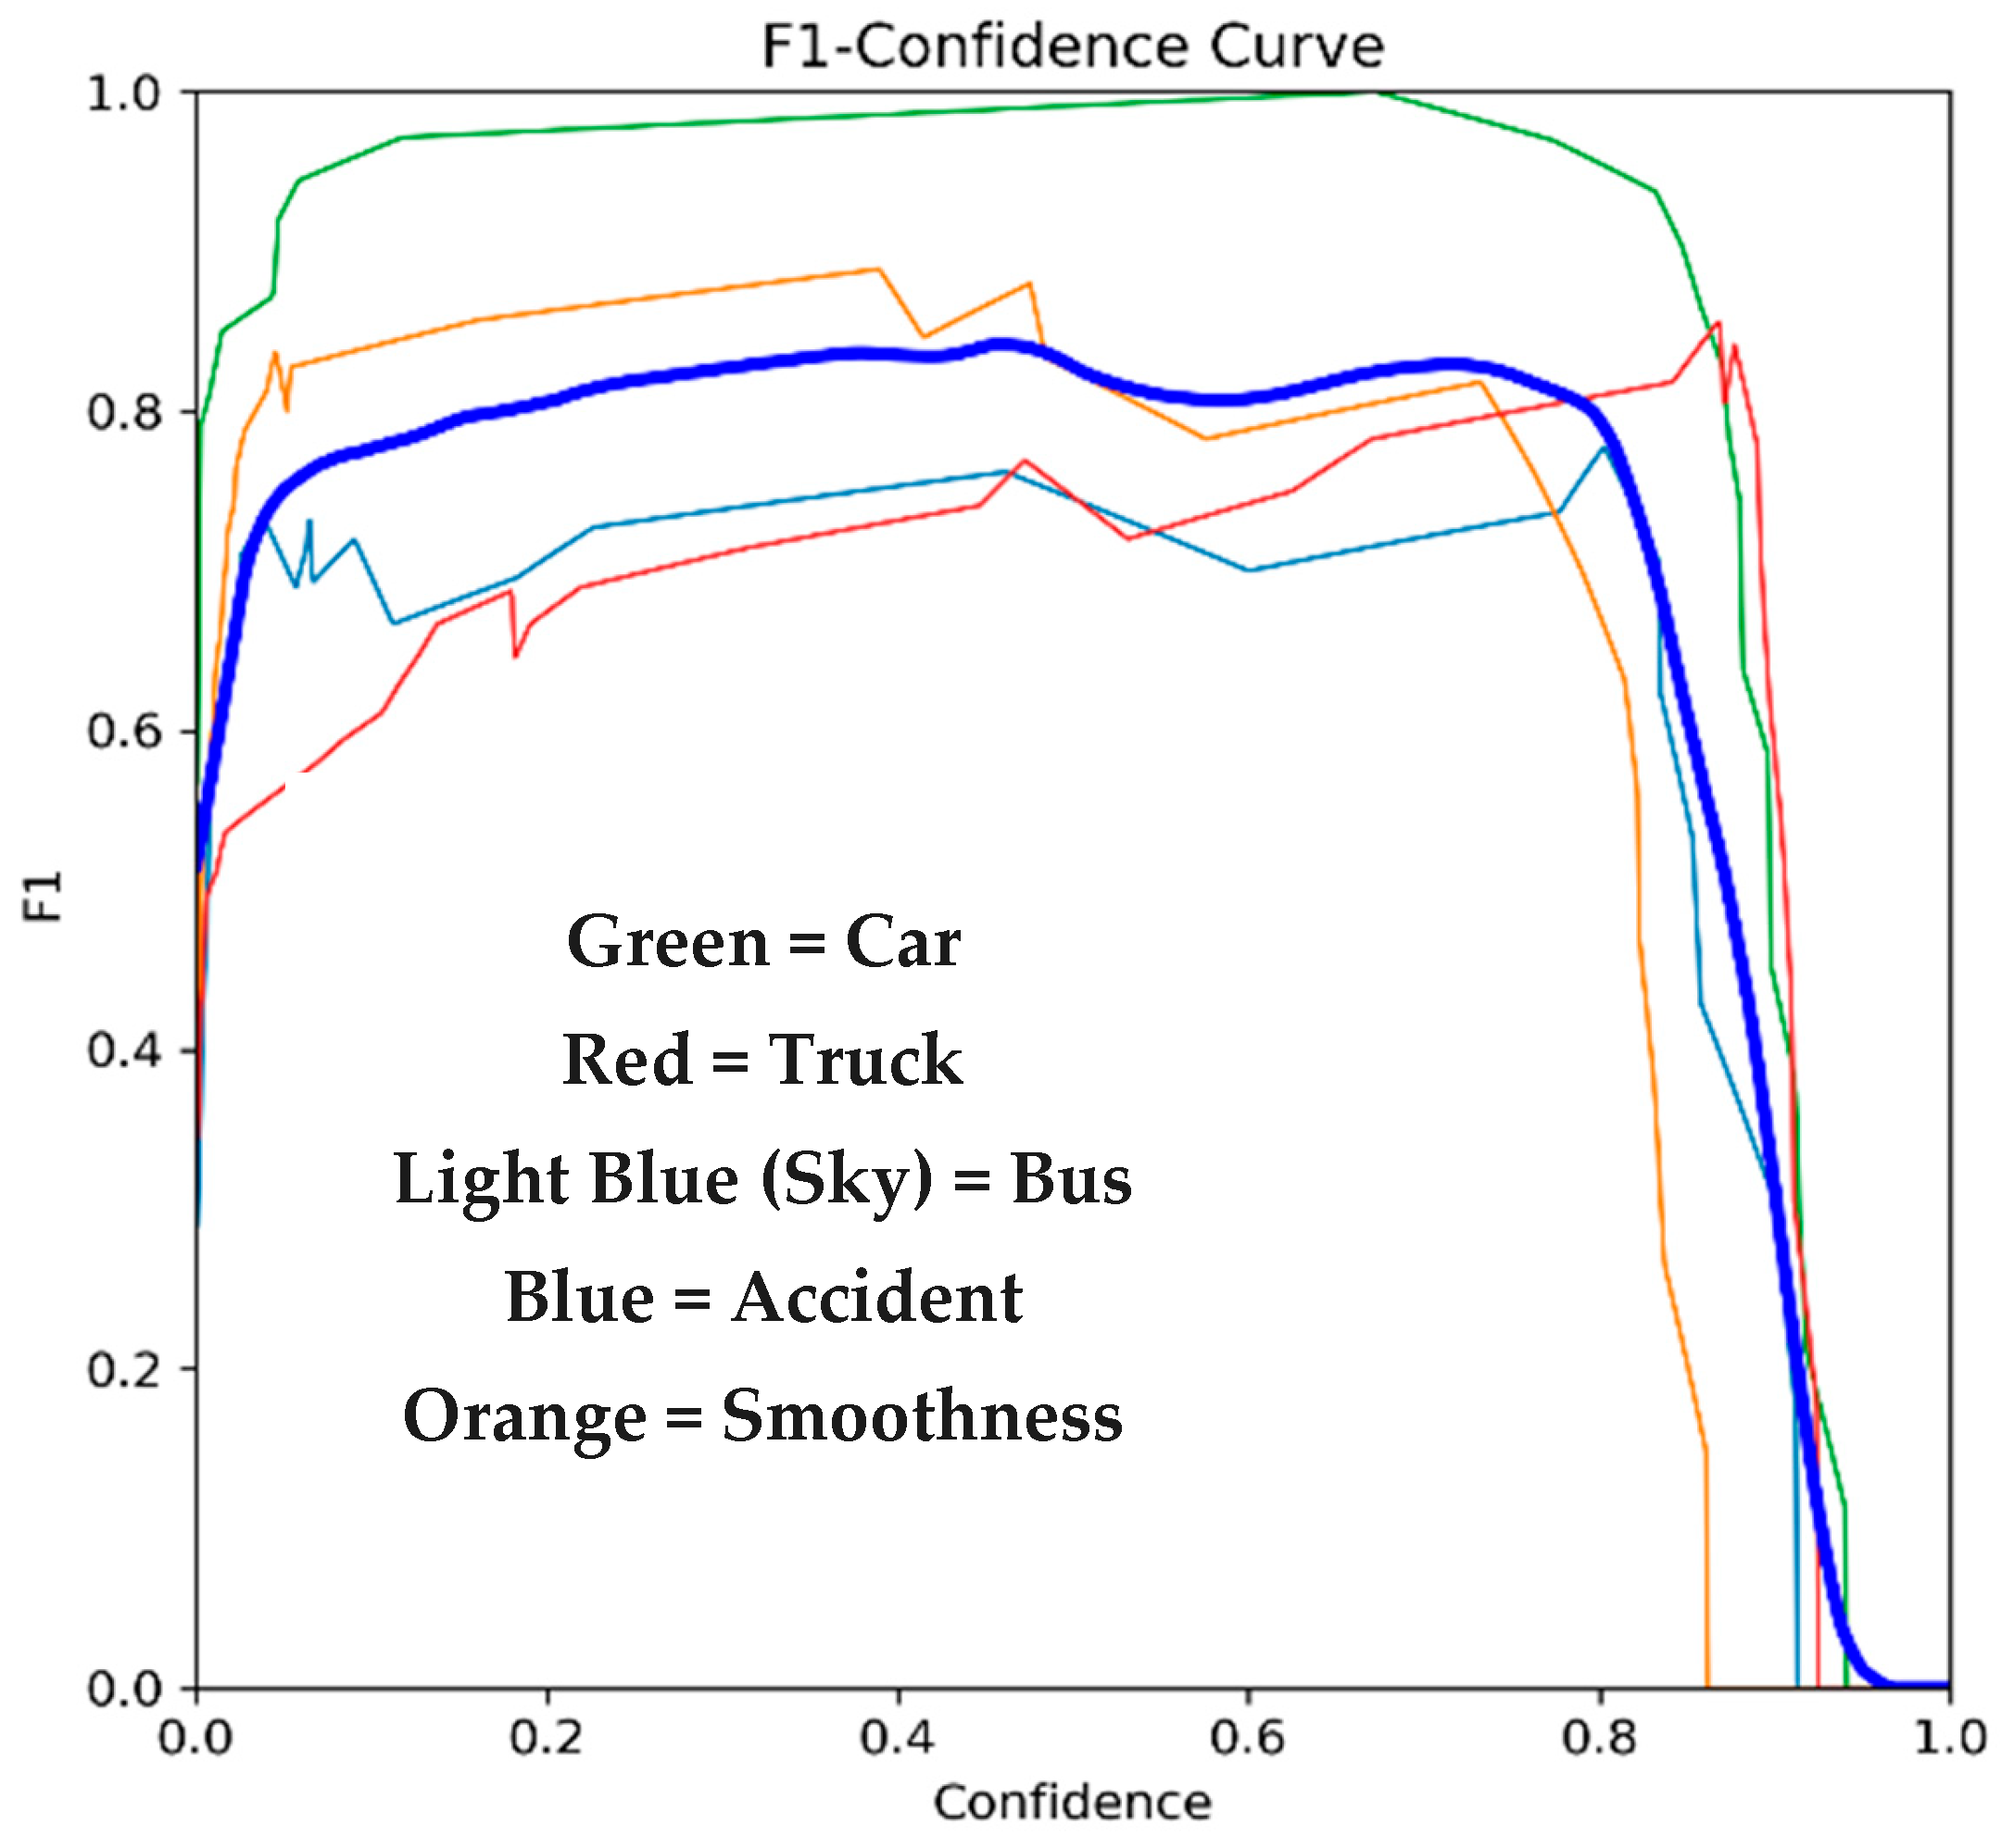
3.5. F1 Score
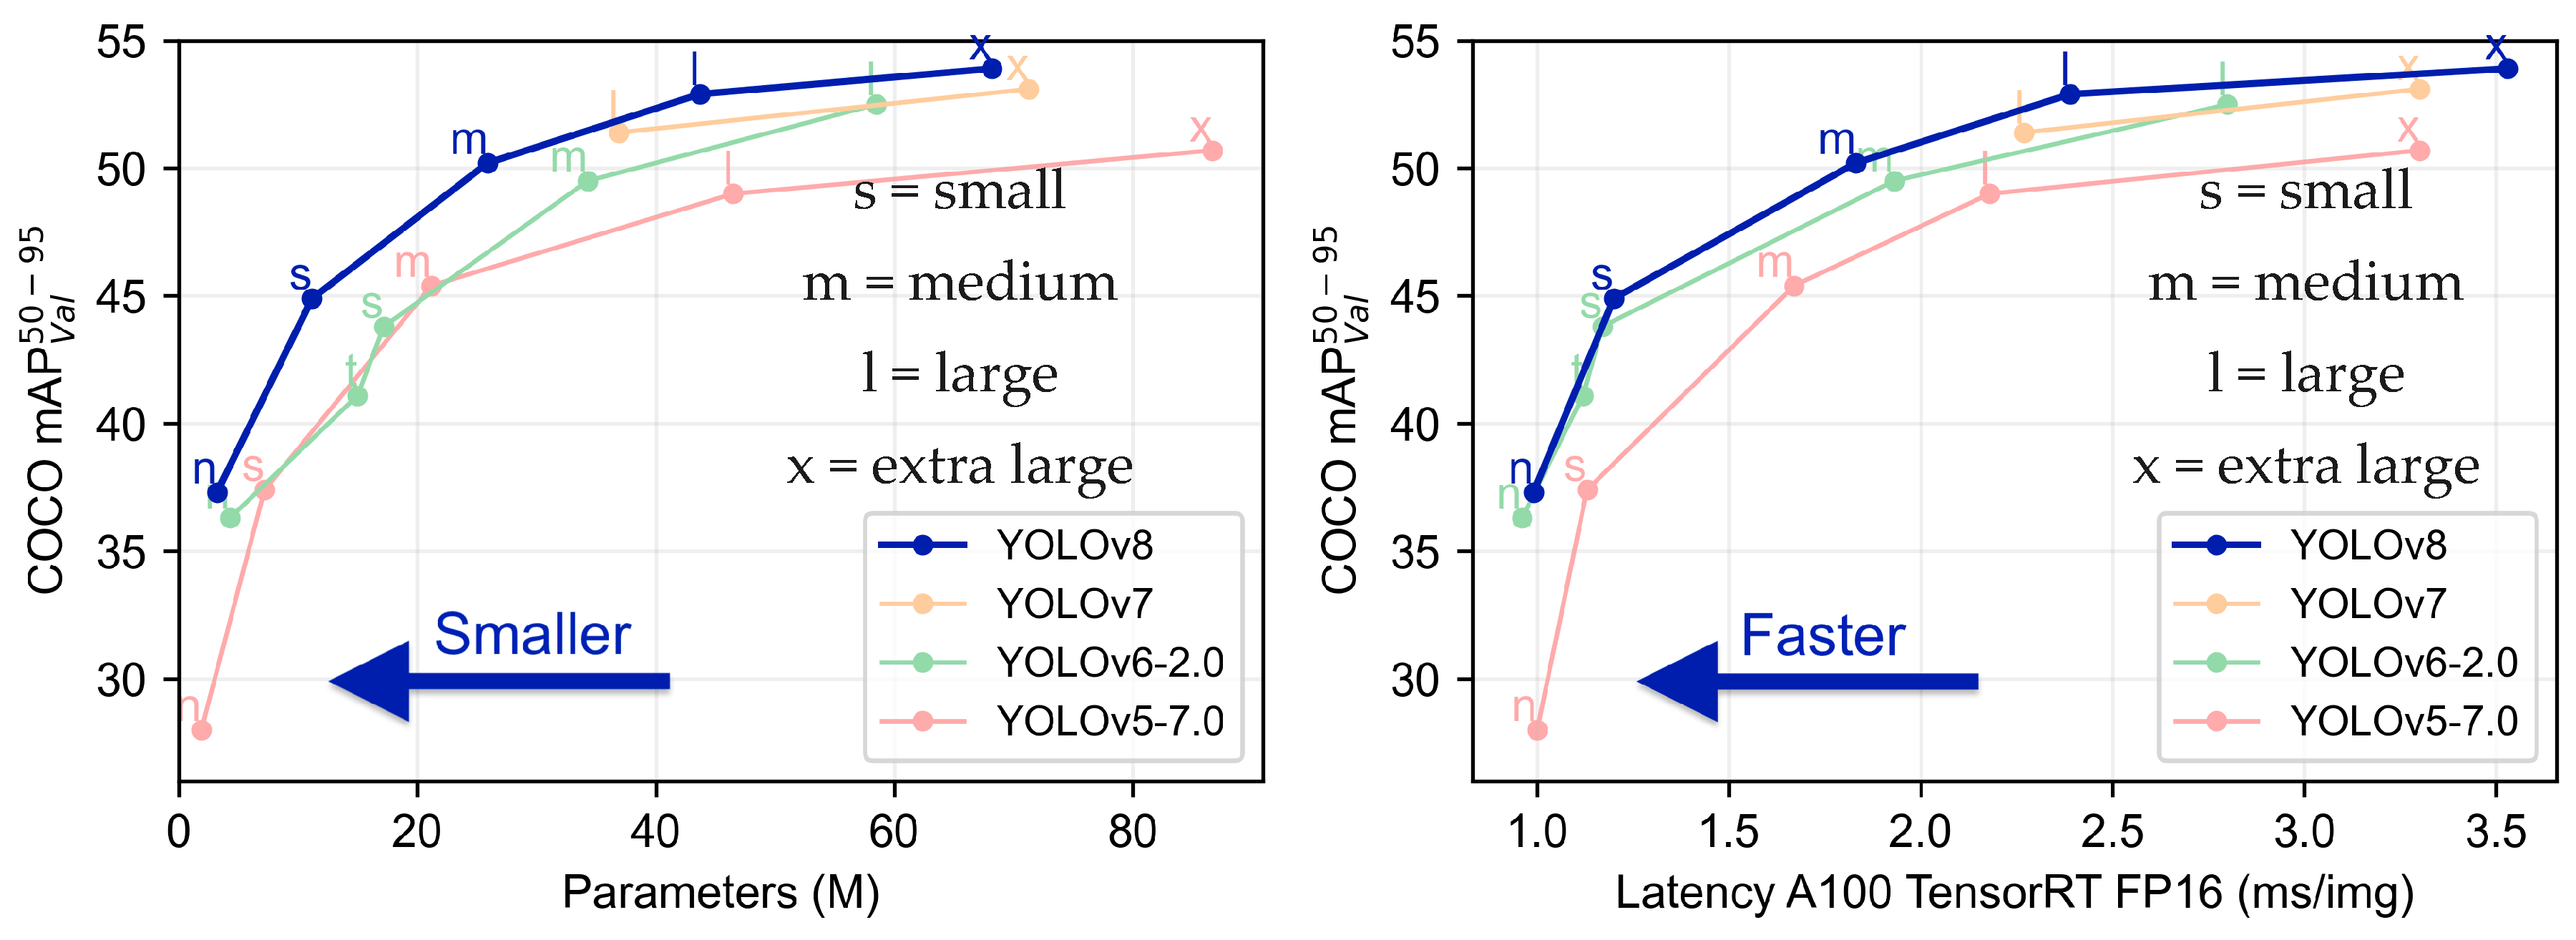
3.6. Comparative Analysis
4. Conclusions
Author Contributions
Funding
Data Availability Statement
Conflicts of Interest
References
- Singh, S.K. Road traffic accidents in India: Issues and challenges. Transp. Res. Procedia 2017, 25, 4708–4719. [Google Scholar] [CrossRef]
- Chand, A.; Jayesh, S.; Bhasi, A. Road traffic accidents: An overview of data sources, analysis techniques and contributing factors. Mater. Today Proc. 2021, 47, 5135–5141. [Google Scholar] [CrossRef]
- Goniewicz, K.; Goniewicz, M.; Pawłowski, W.; Fiedor, P. Road accident rates: Strategies and programmes for improving road traffic safety. Eur. J. Trauma Emerg. Surg. 2016, 42, 433–438. [Google Scholar] [CrossRef]
- Fontaras, G.; Zacharof, N.-G.; Ciuffo, B. Fuel consumption and CO2 emissions from passenger cars in Europe–Laboratory versus real-world emissions. Prog. Energy Combust. Sci. 2017, 60, 97–131. [Google Scholar] [CrossRef]
- Sacchi, R.; Bauer, C.; Cox, B.; Mutel, C. When, where and how can the electrification of passenger cars reduce greenhouse gas emissions? Renew. Sustain. Energy Rev. 2022, 162, 112475. [Google Scholar] [CrossRef]
- Knobloch, F.; Hanssen, S.V.; Lam, A.; Pollitt, H.; Salas, P.; Chewpreecha, U.; Huijbregts, M.A.; Mercure, J.-F. Net emission reductions from electric cars and heat pumps in 59 world regions over time. Nat. Sustain. 2020, 3, 437–447. [Google Scholar] [CrossRef]
- Yasin, Y.J.; Grivna, M.; Abu-Zidan, F.M. Global impact of COVID-19 pandemic on road traffic collisions. World J. Emerg. Surg. 2021, 16, 51. [Google Scholar] [CrossRef] [PubMed]
- Muguro, J.K.; Sasaki, M.; Matsushita, K.; Njeri, W. Trend analysis and fatality causes in Kenyan roads: A review of road traffic accident data between 2015 and 2020. Cogent Eng. 2020, 7, 1797981. [Google Scholar] [CrossRef]
- Shaik, M.E.; Islam, M.M.; Hossain, Q.S. A review on neural network techniques for the prediction of road traffic accident severity. Asian Transp. Stud. 2021, 7, 100040. [Google Scholar] [CrossRef]
- Chang, F.-R.; Huang, H.-L.; Schwebel, D.C.; Chan, A.H.; Hu, G.-Q. Global road traffic injury statistics: Challenges, mechanisms and solutions. Chin. J. Traumatol. 2020, 23, 216–218. [Google Scholar] [CrossRef]
- Khan, M.A.; Grivna, M.; Nauman, J.; Soteriades, E.S.; Cevik, A.A.; Hashim, M.J.; Govender, R.; Al Azeezi, S.R. Global incidence and mortality patterns of pedestrian road traffic injuries by sociodemographic index, with forecasting: Findings from the global burden of diseases, injuries, and risk factors 2017 study. Int. J. Environ. Res. Public Health 2020, 17, 2135. [Google Scholar] [CrossRef] [PubMed]
- Rajasekaran, R.B.; Rajasekaran, S.; Vaishya, R. The role of social advocacy in reducing road traffic accidents in India. J. Clin. Orthop. Trauma 2021, 12, 2–3. [Google Scholar] [CrossRef]
- Handiso, A.; Mekebo, G.G.; Galdassa, A. Trends and determinants of road traffic accident human death in Kembata Tembaro zone, SNNPR, Ethiopia. Sci. J. Appl. Math. Stat. 2022, 10, 85–89. [Google Scholar]
- Guevara, L.; Auat Cheein, F. The role of 5G technologies: Challenges in smart cities and intelligent transportation systems. Sustainability 2020, 12, 6469. [Google Scholar] [CrossRef]
- Javed, A.R.; Shahzad, F.; ur Rehman, S.; Zikria, Y.B.; Razzak, I.; Jalil, Z.; Xu, G. Future smart cities: Requirements, emerging technologies, applications, challenges, and future aspects. Cities 2022, 129, 103794. [Google Scholar] [CrossRef]
- Kumar, H.; Singh, M.K.; Gupta, M.; Madaan, J. Moving towards smart cities: Solutions that lead to the Smart City Transformation Framework. Technol. Forecast. Soc. Chang. 2020, 153, 119281. [Google Scholar] [CrossRef]
- Gohar, A.; Nencioni, G. The role of 5G technologies in a smart city: The case for intelligent transportation system. Sustainability 2021, 13, 5188. [Google Scholar] [CrossRef]
- Manfreda, A.; Ljubi, K.; Groznik, A. Autonomous vehicles in the smart city era: An empirical study of adoption factors important for millennials. Int. J. Inf. Manag. 2021, 58, 102050. [Google Scholar] [CrossRef]
- Sarang, S.A.; Raza, M.A.; Panhwar, M.; Khan, M.; Abbas, G.; Touti, E.; Altamimi, A.; Wijaya, A.A. Maximizing solar power generation through conventional and digital MPPT techniques: A comparative analysis. Sci. Rep. 2024, 14, 8944. [Google Scholar] [CrossRef]
- Lai, C.S.; Jia, Y.; Dong, Z.; Wang, D.; Tao, Y.; Lai, Q.H.; Wong, R.T.; Zobaa, A.F.; Wu, R.; Lai, L.L. A review of technical standards for smart cities. Clean Technol. 2020, 2, 290–310. [Google Scholar] [CrossRef]
- Aljohani, M.; Olariu, S.; Alali, A.; Jain, S. A survey of parking solutions for smart cities. IEEE Trans. Intell. Transp. Syst. 2021, 23, 10012–10029. [Google Scholar] [CrossRef]
- Nikitas, A.; Michalakopoulou, K.; Njoya, E.T.; Karampatzakis, D. Artificial intelligence, transport and the smart city: Definitions and dimensions of a new mobility era. Sustainability 2020, 12, 2789. [Google Scholar] [CrossRef]
- Mohamed, N.; Al-Jaroodi, J.; Jawhar, I.; Idries, A.; Mohammed, F. Unmanned aerial vehicles applications in future smart cities. Technol. Forecast. Soc. Chang. 2020, 153, 119293. [Google Scholar] [CrossRef]
- Kashef, M.; Visvizi, A.; Troisi, O. Smart city as a smart service system: Human-computer interaction and smart city surveillance systems. Comput. Hum. Behav. 2021, 124, 106923. [Google Scholar] [CrossRef]
- Zhou, Q.; Zhu, M.; Qiao, Y.; Zhang, X.; Chen, J. Achieving resilience through smart cities? Evidence from China. Habitat Int. 2021, 111, 102348. [Google Scholar] [CrossRef]
- Bhushan, B.; Khamparia, A.; Sagayam, K.M.; Sharma, S.K.; Ahad, M.A.; Debnath, N.C. Blockchain for smart cities: A review of architectures, integration trends and future research directions. Sustain. Cities Soc. 2020, 61, 102360. [Google Scholar] [CrossRef]
- Kandt, J.; Batty, M. Smart cities, big data and urban policy: Towards urban analytics for the long run. Cities 2021, 109, 102992. [Google Scholar] [CrossRef]
- Chu, J.; Zhang, C.; Yan, M.; Zhang, H.; Ge, T. TRD-YOLO: A real-time, high-performance small traffic sign detection algorithm. Sensors 2023, 23, 3871. [Google Scholar] [CrossRef]
- Li, X.; Shi, B.; Nie, T.; Zhang, K.; Wang, W. Multi-object recognition method based on improved yolov2 model. Inf. Technol. Control. 2021, 50, 13–27. [Google Scholar]
- Ayob, A.; Khairuddin, K.; Mustafah, Y.; Salisa, A.; Kadir, K. Analysis of pruned neural networks (MobileNetV2-YOLO v2) for underwater object detection. In Proceedings of the 11th National Technical Seminar on Unmanned System Technology 2019: NUSYS’19; Springer: Berlin/Heidelberg, Germany, 2021; pp. 87–98. [Google Scholar]
- Huang, Y.-Q.; Zheng, J.-C.; Sun, S.-D.; Yang, C.-F.; Liu, J. Optimized YOLOv3 algorithm and its application in traffic flow detections. Appl. Sci. 2020, 10, 3079. [Google Scholar] [CrossRef]
- Zhang, H.; Qin, L.; Li, J.; Guo, Y.; Zhou, Y.; Zhang, J.; Xu, Z. Real-time detection method for small traffic signs based on Yolov3. IEEE Access 2020, 8, 64145–64156. [Google Scholar] [CrossRef]
- Dewi, C.; Chen, R.-C.; Liu, Y.-T.; Jiang, X.; Hartomo, K.D. Yolo V4 for advanced traffic sign recognition with synthetic training data generated by various GAN. IEEE Access 2021, 9, 97228–97242. [Google Scholar] [CrossRef]
- Dewi, C.; Chen, R.-C.; Jiang, X.; Yu, H. Deep convolutional neural network for enhancing traffic sign recognition developed on Yolo V4. Multimed. Tools Appl. 2022, 81, 37821–37845. [Google Scholar] [CrossRef]
- Wang, Q.; Zhang, Q.; Liang, X.; Wang, Y.; Zhou, C.; Mikulovich, V.I. Traffic lights detection and recognition method based on the improved YOLOv4 algorithm. Sensors 2021, 22, 200. [Google Scholar] [CrossRef]
- Huang, Y.; Zhang, H. A safety vehicle detection mechanism based on YOLOv5. In Proceedings of the 2021 IEEE 6th international conference on smart cloud (SmartCloud), Newark, NJ, USA, 6–8 November 2021; pp. 1–6. [Google Scholar]
- Murthy, J.S.; Siddesh, G.; Lai, W.-C.; Parameshachari, B.; Patil, S.N.; Hemalatha, K. Objectdetect: A real-time object detection framework for advanced driver assistant systems using yolov5. Wirel. Commun. Mob. Comput. 2022, 2022, 9444360. [Google Scholar] [CrossRef]
- Aboah, A. A vision-based system for traffic anomaly detection using deep learning and decision trees. In Proceedings of the IEEE/CVF Conference on Computer Vision and Pattern Recognition, Virtual, 19–25 June 2021; pp. 4207–4212. [Google Scholar]
- John, A.; Meva, D. Comparative Study of Various Algorithms for Vehicle Detection and Counting in Traffic. In Proceedings of the International Conference on Advancements in Smart Computing and Information Security, Rajkot, India, 24–26 November 2022; pp. 271–286. [Google Scholar]
- Kaya, Ö.; Çodur, M.Y.; Mustafaraj, E. Automatic detection of pedestrian crosswalk with faster r-cnn and yolov7. Buildings 2023, 13, 1070. [Google Scholar] [CrossRef]
- Li, S.; Wang, S.; Wang, P. A small object detection algorithm for traffic signs based on improved YOLOv7. Sensors 2023, 23, 7145. [Google Scholar] [CrossRef]
- Balasundaram, A.; Shaik, A.; Prasad, A.; Pratheepan, Y. On-road obstacle detection in real time environment using an ensemble deep learning model. Signal Image Video Process. 2024, 18, 5387–5400. [Google Scholar] [CrossRef]
- Pitts, H. Warehouse Robot Detection for Human Safety Using YOLOv8. In Proceedings of the SoutheastCon 2024, Atlanta, GA, USA, 15–24 March 2024; pp. 1184–1188. [Google Scholar]
- Hou, X.; Wang, Y.; Chau, L.-P. Vehicle tracking using deep sort with low confidence track filtering. In Proceedings of the 2019 16th IEEE International Conference on Advanced Video and Signal Based Surveillance (AVSS), Taipei, Taiwan, 18–21 September 2019; pp. 1–6. [Google Scholar]
- Liu, H.; Pei, Y.; Bei, Q.; Deng, L. Improved DeepSORT Algorithm Based on Multi-Feature Fusion. Appl. Syst. Innov. 2022, 5, 55. [Google Scholar] [CrossRef]
- Gai, Y.; He, W.; Zhou, Z. Pedestrian target tracking based on DeepSORT with YOLOv5. In Proceedings of the 2021 2nd International Conference on Computer Engineering and Intelligent Control (ICCEIC), Chongqing, China, 12–14 November 2021; pp. 1–5. [Google Scholar]
- Jie, Y.; Leonidas, L.; Mumtaz, F.; Ali, M. Ship detection and tracking in inland waterways using improved YOLOv3 and Deep SORT. Symmetry 2021, 13, 308. [Google Scholar] [CrossRef]
- Wang, Y.; Zhang, K.; Wang, L.; Wu, L. An Improved YOLOv8 Algorithm for Rail Surface Defect Detection. IEEE Access 2024, 44984–44997. [Google Scholar] [CrossRef]
- Yang, S.; Wang, W.; Gao, S.; Deng, Z. Strawberry ripeness detection based on YOLOv8 algorithm fused with LW-Swin Transformer. Comput. Electron. Agric. 2023, 215, 108360. [Google Scholar] [CrossRef]
- Talaat, F.M.; ZainEldin, H. An improved fire detection approach based on YOLO-v8 for smart cities. Neural Comput. Appl. 2023, 35, 20939–20954. [Google Scholar] [CrossRef]
- Xiao, B.; Nguyen, M.; Yan, W.Q. Fruit ripeness identification using YOLOv8 model. Multimed. Tools Appl. 2024, 83, 28039–28056. [Google Scholar] [CrossRef]
- Liu, L.; Li, P.; Wang, D.; Zhu, S. A wind turbine damage detection algorithm designed based on YOLOv8. Appl. Soft Comput. 2024, 154, 111364. [Google Scholar] [CrossRef]
- Wen, Y.; Gao, X.; Luo, L.; Li, J. Improved YOLOv8-Based Target Precision Detection Algorithm for Train Wheel Tread Defects. Sensors 2024, 24, 3477. [Google Scholar] [CrossRef]
- Wang, H.; Yang, H.; Chen, H.; Wang, J.; Zhou, X.; Xu, Y. A Remote Sensing Image Target Detection Algorithm Based on Improved YOLOv8. Appl. Sci. 2024, 14, 1557. [Google Scholar] [CrossRef]
- Boudjit, K.; Ramzan, N. Human detection based on deep learning YOLO-v2 for real-time UAV applications. J. Exp. Theor. Artif. Intell. 2022, 34, 527–544. [Google Scholar] [CrossRef]
- Saranya, K.C.; Thangavelu, A.; Chidambaram, A.; Arumugam, S.; Govindraj, S. Cyclist detection using tiny yolo v2. In Soft Computing for Problem Solving: SocProS 2018; Springer: Berlin/Heidelberg, Germany, 2020; Volume 2, pp. 969–979. [Google Scholar]
- Han, X.; Chang, J.; Wang, K. Real-time object detection based on YOLO-v2 for tiny vehicle object. Procedia Comput. Sci. 2021, 183, 61–72. [Google Scholar] [CrossRef]
- Hou, X.; Zhang, Y.; Hou, J. Application of YOLO V2 in construction vehicle detection. In Proceedings of the International Conference on Natural Computation, Fuzzy Systems and Knowledge Discovery, Xi’an, China, 1–3 August 2020; pp. 1249–1256. [Google Scholar]
- Alsanad, H.R.; Ucan, O.N.; Ilyas, M.; Khan, A.U.R.; Bayat, O. Real-time fuel truck detection algorithm based on deep convolutional neural network. IEEE Access 2020, 8, 118808–118817. [Google Scholar] [CrossRef]
- Gai, R.; Chen, N.; Yuan, H. A detection algorithm for cherry fruits based on the improved YOLO-v4 model. Neural Comput. Appl. 2023, 35, 13895–13906. [Google Scholar] [CrossRef]
- Kumar, S.; Gupta, H.; Yadav, D.; Ansari, I.A.; Verma, O.P. YOLOv4 algorithm for the real-time detection of fire and personal protective equipments at construction sites. Multimed. Tools Appl. 2022, 81, 22163–22183. [Google Scholar] [CrossRef]
- Tan, L.; Lv, X.; Lian, X.; Wang, G. YOLOv4_Drone: UAV image target detection based on an improved YOLOv4 algorithm. Comput. Electr. Eng. 2021, 93, 107261. [Google Scholar] [CrossRef]
- Zeng, L.; Duan, X.; Pan, Y.; Deng, M. Research on the algorithm of helmet-wearing detection based on the optimized yolov4. Vis. Comput. 2023, 39, 2165–2175. [Google Scholar] [CrossRef]
- Khan, M.; Raza, M.A.; Jumani, T.A.; Mirsaeidi, S.; Abbas, G.; Touti, E.-D.; Alshahir, A. Modeling of Intelligent Controllers for Solar Photovoltaic System Under Varying Irradiation Condition. Front. Energy Res. 2023, 11, 1288486. [Google Scholar] [CrossRef]
- Dong, C.; Du, G. An enhanced real-time human pose estimation method based on modified YOLOv8 framework. Sci. Rep. 2024, 14, 8012. [Google Scholar] [CrossRef]
- Zhai, X.; Huang, Z.; Li, T.; Liu, H.; Wang, S. YOLO-Drone: An Optimized YOLOv8 Network for Tiny UAV Object Detection. Electronics 2023, 12, 3664. [Google Scholar] [CrossRef]
- Khan, M.; Aamir, M.; Hussain, A.; Badar, Y.; Sharif, M.; Faisal, M. Enhancing Solar Power Forecasting in Multi-Weather Conditions Using Deep Neural Networks. In Proceedings of the 2023 2nd International Conference on Emerging Trends in Electrical, Control, and Telecommunication Engineering (ETECTE), Lahore, Pakistan, 27–29 November 2023; pp. 1–11. [Google Scholar]
- Zeng, Q.; Zhou, G.; Wan, L.; Wang, L.; Xuan, G.; Shao, Y. Detection of Coal and Gangue Based on Improved YOLOv8. Sensors 2024, 24, 1246. [Google Scholar] [CrossRef] [PubMed]
- Lalinia, M.; Sahafi, A. Colorectal polyp detection in colonoscopy images using YOLO-V8 network. Signal Image Video Process. 2024, 18, 2047–2058. [Google Scholar] [CrossRef]
- Ye, R.; Gao, Q.; Qian, Y.; Sun, J.; Li, T. Improved Yolov8 and Sahi Model for the Collaborative Detection of Small Targets at the Micro Scale: A Case Study of Pest Detection in Tea. Agronomy 2024, 14, 1034. [Google Scholar] [CrossRef]
- Kumar, N.; Acharya, D.; Lohani, D. An IoT-based vehicle accident detection and classification system using sensor fusion. IEEE Internet Things J. 2020, 8, 869–880. [Google Scholar] [CrossRef]
- Pillai, M.S.; Chaudhary, G.; Khari, M.; Crespo, R.G. Real-time image enhancement for an automatic automobile accident detection through CCTV using deep learning. Soft Comput. 2021, 25, 11929–11940. [Google Scholar] [CrossRef]
- Huang, T.; Wang, S.; Sharma, A. Highway crash detection and risk estimation using deep learning. Accid. Anal. Prev. 2020, 135, 105392. [Google Scholar] [CrossRef] [PubMed]
- Li, L.; Lin, Y.; Du, B.; Yang, F.; Ran, B. Real-time traffic incident detection based on a hybrid deep learning model. Transp. A Transp. Sci. 2022, 18, 78–98. [Google Scholar] [CrossRef]
- Zaitouny, A.; Fragkou, A.D.; Stemler, T.; Walker, D.M.; Sun, Y.; Karakasidis, T.; Nathanail, E.; Small, M. Multiple sensors data integration for traffic incident detection using the quadrant scan. Sensors 2022, 22, 2933. [Google Scholar] [CrossRef]
- Jaspin, K.; Bright, A.A.; Legin, M.L. Accident Detection and Severity Classification System using YOLO Model. In Proceedings of the 2024 3rd International Conference on Applied Artificial Intelligence and Computing (ICAAIC), Salem, India, 5–7 June 2024; pp. 1160–1167. [Google Scholar]
- Nusari, A.N.M.; Ozbek, I.Y.; Oral, E.A. Automatic Vehicle Accident Detection and Classification from Images: A Comparison of YOLOv9 and YOLO-NAS Algorithms. In Proceedings of the 2024 32nd Signal Processing and Communications Applications Conference (SIU), Mersin, Turkiye, 15–18 May 2024; pp. 1–4. [Google Scholar]
- Chung, Y.L.; Lin, C.K. Application of a model that combines the YOLOv3 object detection algorithm and canny edge detection algorithm to detect highway accidents. Symmetry 2020, 12, 1875. [Google Scholar] [CrossRef]


| S. No. | Reference | Study Year | Study Model | Study Purpose |
|---|---|---|---|---|
| 1 | [28] | 2023 | YOLOv2 | This article proposes an approach for detecting Chinese traffic signs using a deep convolutional network. |
| 2 | [29] | 2021 | YOLOv2 | In order to address the traditional traffic incident detection, YOLOv2 algorithm is proposed in this study. |
| 3 | [30] | 2021 | YOLOv2 | In this research, an enhanced model of YOLOv2, which aims to address the shortcomings in its inability to recognize small targets, is proposed. The enhanced model is able to identify more little things than the original model for the same image that contains small objects. This new approach could identify items more reliably in photos with complicated backgrounds. To put it briefly, this enhanced model becomes more sensitive to small objects and improves recognition accuracy. |
| 4 | [31] | 2020 | YOLOv3 | Vehicle detection using images and video capturing is an important task for sustainable transportation. However, to achieve this, YOLOv3-DL model is built on the Tensorflow framework. |
| 5 | [32] | 2020 | YOLOv3 | Traffic sign detection scheme is proposed in this study using YOLOv3 for real-time detection with high precision. |
| 6 | [33] | 2021 | YOLOv4 | With enough annotated training data, Convolutional Neural Networks (CNNs) reach the pinnacle of traffic sign identification. The dataset uses CNN to assess the overall visual system’s quality. Sadly, there are not many databases available for traffic signs from most countries in the world. In this case, more realistic and diverse training images could be generated via Generative Adversarial Networks (GANs) to complement the real image arrangement. |
| 7 | [34] | 2022 | YOLOv4 | This research analyzes object detection techniques like Yolo V4 and Yolo V4-tiny merged with Spatial Pyramid Pooling (SPP). In this work, the significance of the SPP principle is assessed in terms of improving the efficiency with which Yolo V4 and Yolo V4-tiny backbone networks extract features and learn object features. |
| 8 | [35] | 2021 | YOLOv4 | YOLOv4 model is proposed in this study for making accurate detection of traffic incidents to avoid accidents. |
| 9 | [36] | 2021 | YOLOv5 | Digital driving system is proposed using YOLOv5 model that predicts the multi-scale objects in the traffic. |
| 10 | [37] | 2022 | YOLOv5 | A lot of conjecture has recently surrounded advanced driver-assistance systems (ADASs), which give drivers the greatest possible driving experience. Today’s traffic accidents are often caused by unsafe driving conditions, which are detected by ADAS technology. |
| 11 | [38] | 2021 | YOLOv5 | The ability to identify irregularities like traffic accidents in real time is proposed in this study for intelligent traffic monitoring system using deep learning approach. |
| 12 | [39] | 2022 | YOLOv6 | There are a lot of accidents and long lines of traffic on Indian roads these days. All things considered, traffic management is a crucial issue that affects us frequently. Utilizing expertise, such as IoT and image processing, can facilitate the movement of an efficient traffic monitoring system. In order to prevent collisions between cars during traffic signals, we can assess the density of the traffic and plan the flow of vehicles at crosswalks such that no collisions occur and traffic on both sides of the road is given equal priority. |
| 13 | [39] | 2022 | YOLOv6 | Pothole detection tests have demonstrated the immense potential of CNNs using YOLOv6 as the main objective of this study. |
| 14 | [40] | 2023 | YOLOv7 | Considering when cars, pedestrians, and micromobility vehicles collide at right angles on an urban road network, the authors took pedestrian crosswalks into consideration. These road segments are places where automobiles pass perpendicular to the path of vulnerable individuals. It is intended to provide a warning system for cars and pedestrians in these locations to prevent accidents. This process involves several steps, including concurrently alerting drivers, people with disabilities, and distracted pedestrians to the dangers of cell phone addiction. |
| 15 | [41] | 2023 | YOLOv7 | In computer vision, traffic sign detection is an essential job with broad applications in autonomous driving. This work provides a small-object detection technique for traffic signs based on the modified YOLOv7. |
| 16 | [42] | 2024 | YOLOv7 | A possible substitute for pothole detection could be a deep learning- and computer vision-based method. In order to identify different roadblocks, the suggested system uses the CNN with YOLOv7 algorithms. |
| 17 | Our Proposed Study | 2024 | YOLOv8 | None of the earlier studies utilized YOLOv8 model for traffic incident detection, which can handle the challenging task given the dynamic nature of urban traffic and the multitude of events that can occur. However, in this study, Roboflow is used for the data compilation and preparing the image data for computer vision models. The initial dataset comprised 523 images, with 335 images designated for training, 144 for validation, and 44 for testing purposes. Then, Deep Simple Online and Real-time Tracking (Deep-SORT) algorithm is developed to scrutinize scenes at different temporal layers and provide continuous information about vehicular behavior. Then, YOLOv8 model detects the actual traffic incident. |
| Model | Accuracy (mAP) | Speed (FPS) |
|---|---|---|
| YOLOv4 | High | Moderate |
| YOLOv5 | High | High |
| YOLOv6 | High | High |
| YOLOv7 | Very High | Moderate |
| YOLOv8 | Very High | Very High |
Disclaimer/Publisher’s Note: The statements, opinions and data contained in all publications are solely those of the individual author(s) and contributor(s) and not of MDPI and/or the editor(s). MDPI and/or the editor(s) disclaim responsibility for any injury to people or property resulting from any ideas, methods, instructions or products referred to in the content. |
© 2024 by the authors. Licensee MDPI, Basel, Switzerland. This article is an open access article distributed under the terms and conditions of the Creative Commons Attribution (CC BY) license (https://creativecommons.org/licenses/by/4.0/).
Share and Cite
Karim, A.; Raza, M.A.; Alharthi, Y.Z.; Abbas, G.; Othmen, S.; Hossain, M.S.; Nahar, A.; Mercorelli, P. Visual Detection of Traffic Incident through Automatic Monitoring of Vehicle Activities. World Electr. Veh. J. 2024, 15, 382. https://doi.org/10.3390/wevj15090382
Karim A, Raza MA, Alharthi YZ, Abbas G, Othmen S, Hossain MS, Nahar A, Mercorelli P. Visual Detection of Traffic Incident through Automatic Monitoring of Vehicle Activities. World Electric Vehicle Journal. 2024; 15(9):382. https://doi.org/10.3390/wevj15090382
Chicago/Turabian StyleKarim, Abdul, Muhammad Amir Raza, Yahya Z. Alharthi, Ghulam Abbas, Salwa Othmen, Md. Shouquat Hossain, Afroza Nahar, and Paolo Mercorelli. 2024. "Visual Detection of Traffic Incident through Automatic Monitoring of Vehicle Activities" World Electric Vehicle Journal 15, no. 9: 382. https://doi.org/10.3390/wevj15090382