Article

Proposal of a Cost-Effective and Adaptive Customized Driver Inattention Detection Model Using Time Series Analysis and Computer Vision

Department of Artificial Intelligence & Software, Kangwon National University, 346, Jungang-ro, Samcheok-si 25913, Gangwon-do, Republic of Korea
*
Author to whom correspondence should be addressed.
World Electr. Veh. J. 2024, 15(9), 400; https://doi.org/10.3390/wevj15090400
Submission received: 14 June 2024 / Revised: 20 August 2024 / Accepted: 25 August 2024 / Published: 3 September 2024

Abstract

:
Advanced Driver Assistance Systems, such as Forward Collision Warning and Lane Departure Warning, play a crucial role in accident prevention by alerting drivers to potential hazards. With the advent of fully autonomous driving technology that requires no driver input, there is now a greater emphasis on monitoring the state of vehicle occupants. This is particularly important because, in emergency situations where control must suddenly be transferred to an unprepared occupant, the risk of accidents increases significantly. To mitigate this risk, new monitoring technologies are being developed to analyze driver behavior and detect states of inattention or drowsiness. In response to the emerging demands of driver monitoring technology, we have developed the Customized Driver Inattention Detection Model (CDIDM). This model employs video analysis and statistical techniques to accurately and rapidly classify information on drivers’ gazes. The CDIDM framework defines the components of inattentive or drowsy driving based on the Driver Monitoring System (DMS) safety standards set by the European New Car Assessment Programme (EuroNCAP). By defining six driving behavior-related scenarios, we have improved the accuracy of driver inattention assessment. The CDIDM estimates the driver’s gaze while simultaneously analyzing data in real-time. To minimize computational resource usage, this model incorporates a series of preprocessing steps that facilitate efficient time series data analysis, utilizing techniques such as DTW Barycenter Averaging (DBA) and K-means clustering. This results in a robust driver attention monitoring model based on time series classification.

1. Introduction

The main types of Information Technology in vehicles include Advanced Driver Assistance Systems (ADASs) such as Lane Departure Warning, Adaptive Cruise Control, and Forward Collision Warning. Additionally, along with autonomous driving technology, the importance of Driver Monitoring Systems in enhancing driver safety is increasingly acknowledged.
Autonomous driving technology is currently at SAE (Society of Automotive Engineers) Level 3, a stage of conditional autonomy that requires driver intervention in dangerous situations. This stage is still transitional and imperfect, which could cause driver inattention and lead to dangerous traffic situations. For example, in the United States, while there were 89 autonomous driving-related accidents over the three years from 2019 to 2021, this number significantly increased to 87 cases in 2022 alone [1].
Driver Monitoring Systems have become a crucial element in the automotive industry due to the advancement of autonomous driving technology. DMS plays a vital role in preventing accidents in autonomous driving by continuously assessing the driver’s state, attention, and readiness for control transfer [2]. These systems collect and analyze data from cameras, vehicle sensors, and other physiological indicators, including brain wave signals [3,4,5].
Recent developments in DMS technology focus on addressing the challenges posed by Level 3 autonomous vehicles, where the transition between automated and manual driving is critical [6]. State-of-the-art DMS can detect driver distraction, drowsiness, and cognitive load, providing real-time warnings and interventions when necessary. Recent advancements in artificial intelligence technology have significantly improved the accuracy and reliability of these systems [7,8].
In response to these trends, automotive regulatory bodies and safety organizations are incorporating various standards and regulations for managing control transfer in autonomous vehicles into their assessment protocols, as outlined below.
UN Regulation No.157—This regulation covers vehicle safety systems, fail-safe responses, human–machine interfaces, and incident detection. In particular, it specifies the requirements for driver availability recognition systems, assessing driver availability based on various criteria such as vehicle control inputs, eye blinking, and conscious head movements. If a driver fails to meet at least two of these criteria within 30 s, they are considered unavailable [3].
ISO/CD TS 5283-1—This standard provides driver monitoring guidelines based on the concept of driver availability, emphasizing safe control transfer between autonomous driving levels 2 and 3. It addresses ergonomic factors, measurable criteria, threshold setting, and the effectiveness of system interventions [9].
EuroNCAP (European New Car Assessment Programme)—EuroNCAP integrates driver monitoring systems into its safety assessment protocol, focusing on occupant state monitoring. It distinguishes between indirect monitoring, which evaluates the driver’s state through vehicle operation data, and direct monitoring, which observes the driver’s face using cameras. In particular, as shown in Table 1, it defines DMS evaluation criteria by categorizing the driver’s state into distraction, fatigue, and unresponsiveness [10].
Distraction while driving refers to anything that reduces the driver’s attention. To assess distraction, the driver’s gaze movements are classified into two types: Long Distraction, which is when the driver does not look ahead for more than 3 s, and Short Distraction, which is when the cumulative time of not looking ahead within 30 s exceeds 10 s.
Fatigue is a behavior that increases as driving time lengthens and is primarily evaluated by observing signs of drowsiness, microsleep, and sleep through changes in eye state. While EuroNCAP defines drowsiness separately from inattention, in the CDIDM, drowsiness is also classified and treated as a form of inattentive behavior. However, since gaze tracking is impossible when the eyes are closed, it was not included in the inattention scenarios and was implemented to be classified through PERCLOS. To measure drowsiness, the Stanford Sleepiness Scale, Karolinska Sleepiness Scale, and Visual Analogue Scale are generally used. EuroNCAP has adopted the Karolinska Sleepiness Scale as the standard for measuring drowsiness. Table 2 below describes the Karolinska Sleepiness Scale, which is classified into 10 distinct levels [11].
In the field of Driver Monitoring Systems (DMS), EuroNCAP defines drowsiness as Karolinska Sleepiness Scale (KSS) level 7, and at level 8, a system warning is required. However, no criteria are provided for microsleep, characterized by eye closure lasting more than 3 s. If eye closure exceeds 6 s or the driver does not look ahead within 3 s after a warning, the system classifies the driver as unresponsive. In this paper, when the driver’s gaze could not be measured due to eye closure, we calculated PERCLOS using the eye closure ratio and classified the Karolinska Sleepiness Scale according to EuroNCAP’s DMS evaluation criteria. To comply with safety standards and effectively integrate DMS into vehicles, the following challenges must be addressed:
Technical precision: It is important to accurately monitor the driver’s eye state, which is difficult due to typical vibrations and shaking in a driving environment.
Diversity in device placement: The positions of the center console, side mirrors, and rear-view mirror vary by vehicle, which can affect the assessment of driver behavior based on their physical conditions and interactions with these devices.
Optimization and emergency response: The driver state assessment algorithm must be optimized from preprocessing to final evaluation, ensuring prompt warnings in emergencies while meeting the reliability and resource constraints of recording devices.
The methodology proposed in this paper tracks and evaluates the driver’s eye movements through real-time video analysis based on EuroNCAP’s DMS requirements. This method uses detailed eye and face direction data to detect inattention and includes the following innovations:
  • Detailed eye movement tracking: Accurate measurement of gaze movement is crucial for assessing driver attention.
  • Customized monitoring: This is a customized system that combines eye tracking with the empirical analysis of repeated interactions with key vehicle devices, such as the side mirrors, rear-view mirror, and center console.
  • Hybrid Model: By utilizing deep learning models for video analysis to collect visual information about the driver and applying this to a machine learning-based time series classification model, we can strengthen the classification model in a device environment.
  • Performance verification: The evaluation algorithm follows EuroNCAP’s DMS criteria and is tested under actual driving conditions, considering various practical variables and providing real performance results.
This paper first reviews DMS-related research, then introduces realistic scenarios for DMS, outlines some problem-solving methods, and concludes by presenting our results.

2. Related Work

There are two methods for monitoring a driver’s state: indirect monitoring and direct monitoring. Indirect monitoring is a method of estimating the driver’s state through vehicle sensor data such as steering wheel operation, speed, braking, and lane position. This method has the advantage of not disturbing the driver while monitoring them, but it also has the critical disadvantage of not being able to determine the driver’s state during autonomous driving. Direct monitoring methods include assessing the driver’s state by analyzing brain activity through the collection of Electroencephalogram (EEG) signals and judging the driver’s state through an analysis of image data collected via a camera.
Regarding EEG signal analysis-based driver monitoring technology, Abdulhamit Subasi [12] proposed a method of analyzing EEG signals through wavelet transform and then classifying arousal levels using ANN. Jiao, Yingying, et al. [13] achieved 98% accuracy in detecting driver drowsiness using GAN and LSTM neural networks. This method of analyzing EEG signals has the advantage of accurately detecting the driver’s state, but the driver has to wear a device to collect brain wave signals. To overcome this disadvantage, studies have been conducted on the collection of EEG signals using wireless or wearable devices [14,15]. Lin, Chin-Teng, et al. [14] devised a mobile wireless brain wave system based on dry brain-wave sensors that can predict the driver’s state in real-time, and Li, Gang, et al. [8] proposed a fully wearable EEG system that detects driver drowsiness using a Bluetooth-enabled EEG headband and a commercial smartwatch. However, its accuracy is somewhat low, between 84 and 91%, and the issue of driver discomfort is still not resolved as they still need to wear a headband.
Recently, with the technological advancement of artificial intelligence, image analysis solutions have become increasingly abundant. Driver video analysis can now be conducted with a certain level of accuracy while minimizing discomfort compared to the EEG signal analysis method, and research on image analysis-based driver state monitoring is being actively conducted.
The driver monitoring system using direct monitoring to analyze driver video is largely divided into determining driver inattention and drowsiness.
Driver inattention detection is mainly based on facial expressions and gaze tracking. Tango, Fabio, and Marco Botta [16] compared and verified the performance of various ML models in Real-Time Driver Distraction Detection (DDD) and confirmed that SVM outperforms all other ML methods. Liang et al. [17] detected drivers’ cognitive distraction using Bayesian networks and verified that dynamic models considering the drivers’ time dependency perform better than static models. However, these studies have limitations in that they do not reflect various environmental conditions, such as camera angles and the driver’s physical condition and behavior patterns.
Drowsiness detection judges drowsiness based on eye blinking. The indicator used here is PERCLOS, which represents the ratio of eye closure. Hu Shuyan et al. [18] predicted drowsiness using SVM (Support Vector Machine) from eyelid-related parameters extracted from EOG (Electrooculography) data collected in the EU Project SENSATION’s driving simulator. Dasgupta et al. [19] constructed a real-time driver drowsiness detection system reflecting various conditions of actual driving situations, such as lighting, facial rotation, and vehicle vibration. They confirmed a processing speed of 9.5 fps and drowsiness detection accuracy of over 97% in actual driving environments, proving that it is possible to achieve an accuracy level close to that of EEG signal analysis-based DDS, even with the driver video analysis method. However, recent driver monitoring system evaluation criteria also require the classification of driver inattention status.
Jo Jaeik et al. [20] proposed a method to minimize computational costs and eye detection errors while enabling the detection of both drowsiness and inattention by designing a system to detect drowsiness when the driver is looking ahead and distraction when they are not looking ahead. However, classifying drowsiness and driver inattention status based on whether they are looking ahead has limitations in terms of reliability. Grace, Richard, et al. [21] presented a method of estimating driver status by combining PERCLOS, which is the ratio of eyelid closure, with driver performance-based data such as steering, lane, acceleration, and video-based data analysis results; however, driving data cannot be used for vehicle control transfer as they cannot determine the driver’s status during autonomous driving.
Recent studies [22,23,24,25] have attempted to detect driver inattention using deep learning models, but they work by learning and detecting images of inattentive behavior itself, such as mobile phone operation or vehicle button operation. This method has the limitation of not being able to detect undefined, inattentive behavior patterns.
In this paper, we propose a driver-customized monitoring system that is robust to various variables, such as the physical condition of the vehicle and driver, while following EuroNCAP’s DMS evaluation criteria. Specifically, we extract one-dimensional gaze vector information through real-time preprocessing from the driver’s video information and utilize DTW Barycenter Averaging (DBA) and K-means clustering techniques to classify both the gaze vector information and sequence information of each frame. Finally, to classify inattentive behavior, we define driving-related behavior scenarios and realistically improve the accuracy of driver inattention detection by excluding the deviation of the driver’s gaze from the road ahead due to driving-related behavior from the inattention judgment criteria.

3. Proposed System

3.1. Workflow

Figure 1 provides an overview of the CDIDM used to determine driver inattention or drowsiness, explaining the analysis process in four stages.
In the first stage, key edge points are detected based on the center of the screen, and these points are used to stabilize the image. Subsequently, using the facial area extracted by the YOLO model, the face angle is estimated, and the ROI is extracted. The face rotation angle is also calculated in this process.
The second stage involves face landmark detection. This identifies the coordinates of the eyelids and pupils. From the pupil coordinates, the gaze direction is estimated, and vector values for eye movement are extracted. Additionally, the PERCLOS calculation is performed at this stage.
In the third stage, dimensionality reduction is carried out. The vector values extracted earlier undergo a preprocessing stage that facilitates time series classification. During this process, common pattern movement data are recalculated for improved learning. Moving averaging techniques are also applied to smooth the data.
The final stage determines the driver’s inattention and drowsiness state. The driver’s inattention is ultimately determined by evaluating its similarity with the classified common pattern movement data. Drowsiness is assessed by calculating PERCLOS using the facial landmark values used for inattention detection and classifying it according to the criteria defined by EuroNCAP.
The key point is that this system continuously evolves. As data on the common pattern movements of the driver’s gaze are reinforced through the accumulation of repeated driving data, a driver-customized monitoring model is established. This adaptive approach allows for increasingly accurate and personalized detection of the driver’s state over time.
Step 1 is the stage in which source data are secured for the extraction of gaze information, where the direction of the face is calculated based on the extracted key facial landmark values. The direction of the face is determined by calculating the rotation matrix based on a total of six values: the left/right eye corners, lip ends, chin, and nose, as shown in Figure 2b [26]. The process for calculating the rotation matrix is as follows: First, a rotation vector is generated using the solvePnP function of OpenCV-python v4.9.0, and this is passed to the Rodrigues function to calculate the rotation matrix. Finally, the rotation matrix is decomposed through the RQDecomp3x3 function to calculate the Euler angles, as shown in Figure 2a, thereby determining the direction of the face [27].
Step 2 involves extracting gaze information based on pupil position data along with the facial direction data calculated in Step 1 and calculating PERCLOS to determine drowsiness.
Gaze information extraction begins with detecting the facial region (Face ROI) from the input image using a YOLO model and identifying key landmark points. Next, a 3D face model is fitted based on the detected 2D facial landmarks, taking into account camera parameters to estimate the face’s position and orientation in 3D space. Through this 3D face model, the head’s 3D rotation (r) and the eyes’ 3D positions (t) are calculated. This extracted 3D information then undergoes a normalization process to ensure consistent results across various input conditions [28]. Based on the normalized data, the left eye angle vector (le), right eye angle vector (re), and head angle vector (h) are each derived. These calculated eye angle vectors (le, re) and head angle vectors (h) are then combined with consideration of their respective weights, reflecting the importance of each element in this process. Finally, as a result of this vector summation, a gaze vector (g) is generated, representing the driver’s gaze direction in 3D space. Figure 3 visually explains this process.
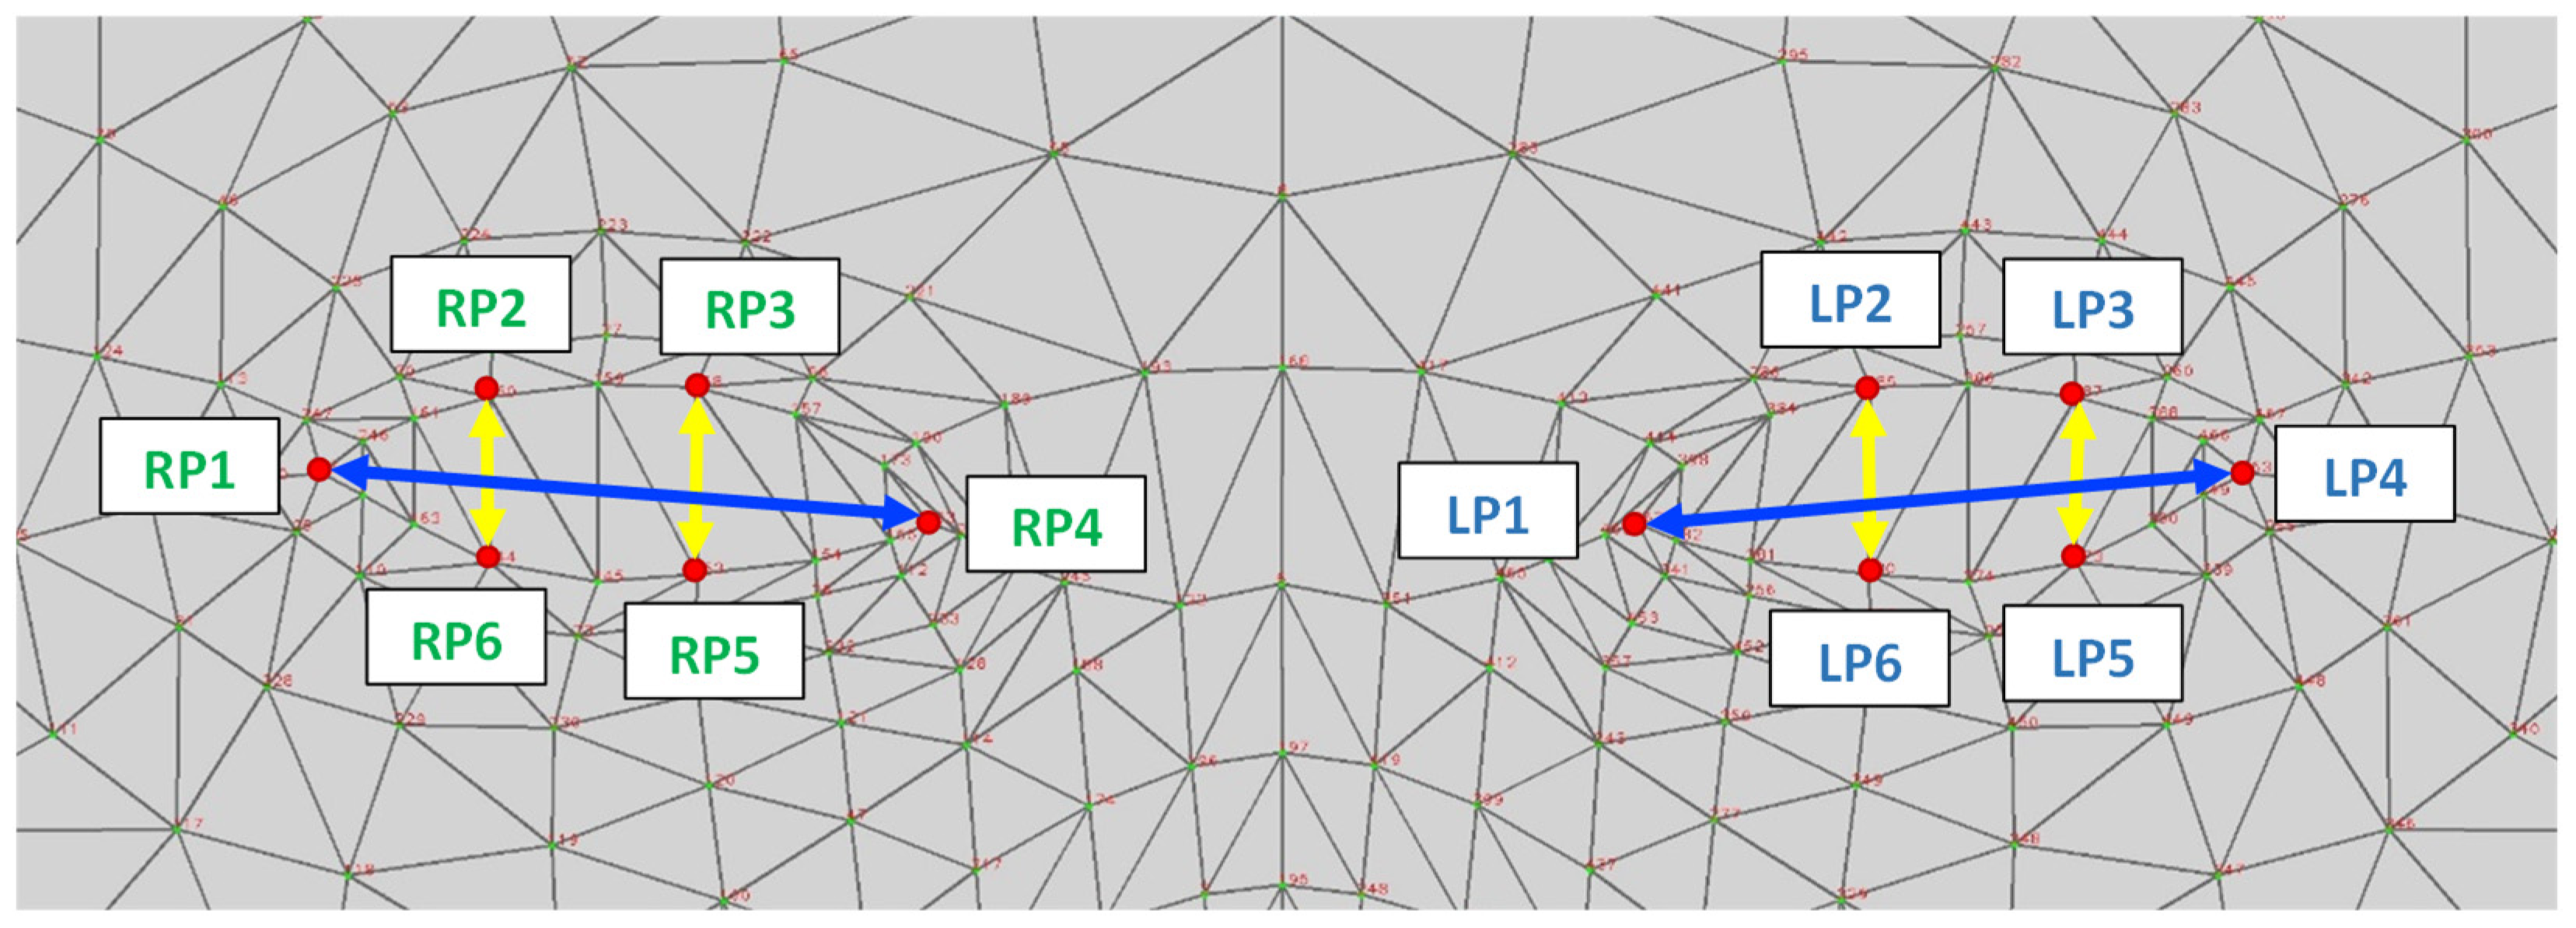
The determination of driver drowsiness is achieved by calculating PERCLOS using the eye coordinate values extracted in Step 1. PERCLOS is a representative indicator that can measure drowsiness, defined as the ratio of time when the eyes are more than 80% closed over a period of 3 min [29]. The equation for calculating the Eye Aspect Ratio (EAR) is as follows, and the key points used are the 12 coordinate values for the left (LP1~6) and right (RP1~6) eyes, shown as red dots in Figure 4. In the figure, yellow arrows indicate the vertical distances between the upper and lower eyelids, while blue arrows represent the horizontal distance between the outer and inner corners of each eye. These vertical and horizontal distances are used to calculate the EAR through the formula below.
E A R = | R P 2 R P 6 | + | R P 3 R P 5 | 2 | R P 4 R P 1 |
P E R C L O S = C u m u l a t i v e   t i m e   o f   e y e   c l o s u r e M e a s u r e m e n t   t i m e
Finally, if the driver’s PERCLOS value is 0.15 or higher, it is determined to be a drowsiness state of level 7 or higher based on the Karolinska Sleepiness Scale [30]. Additionally, according to EuroNCAP’s DMS criteria, if a state where the EAR is 0.8 or higher continues for 3 s or more, it is classified as a sleep state.

3.2. Data Collection

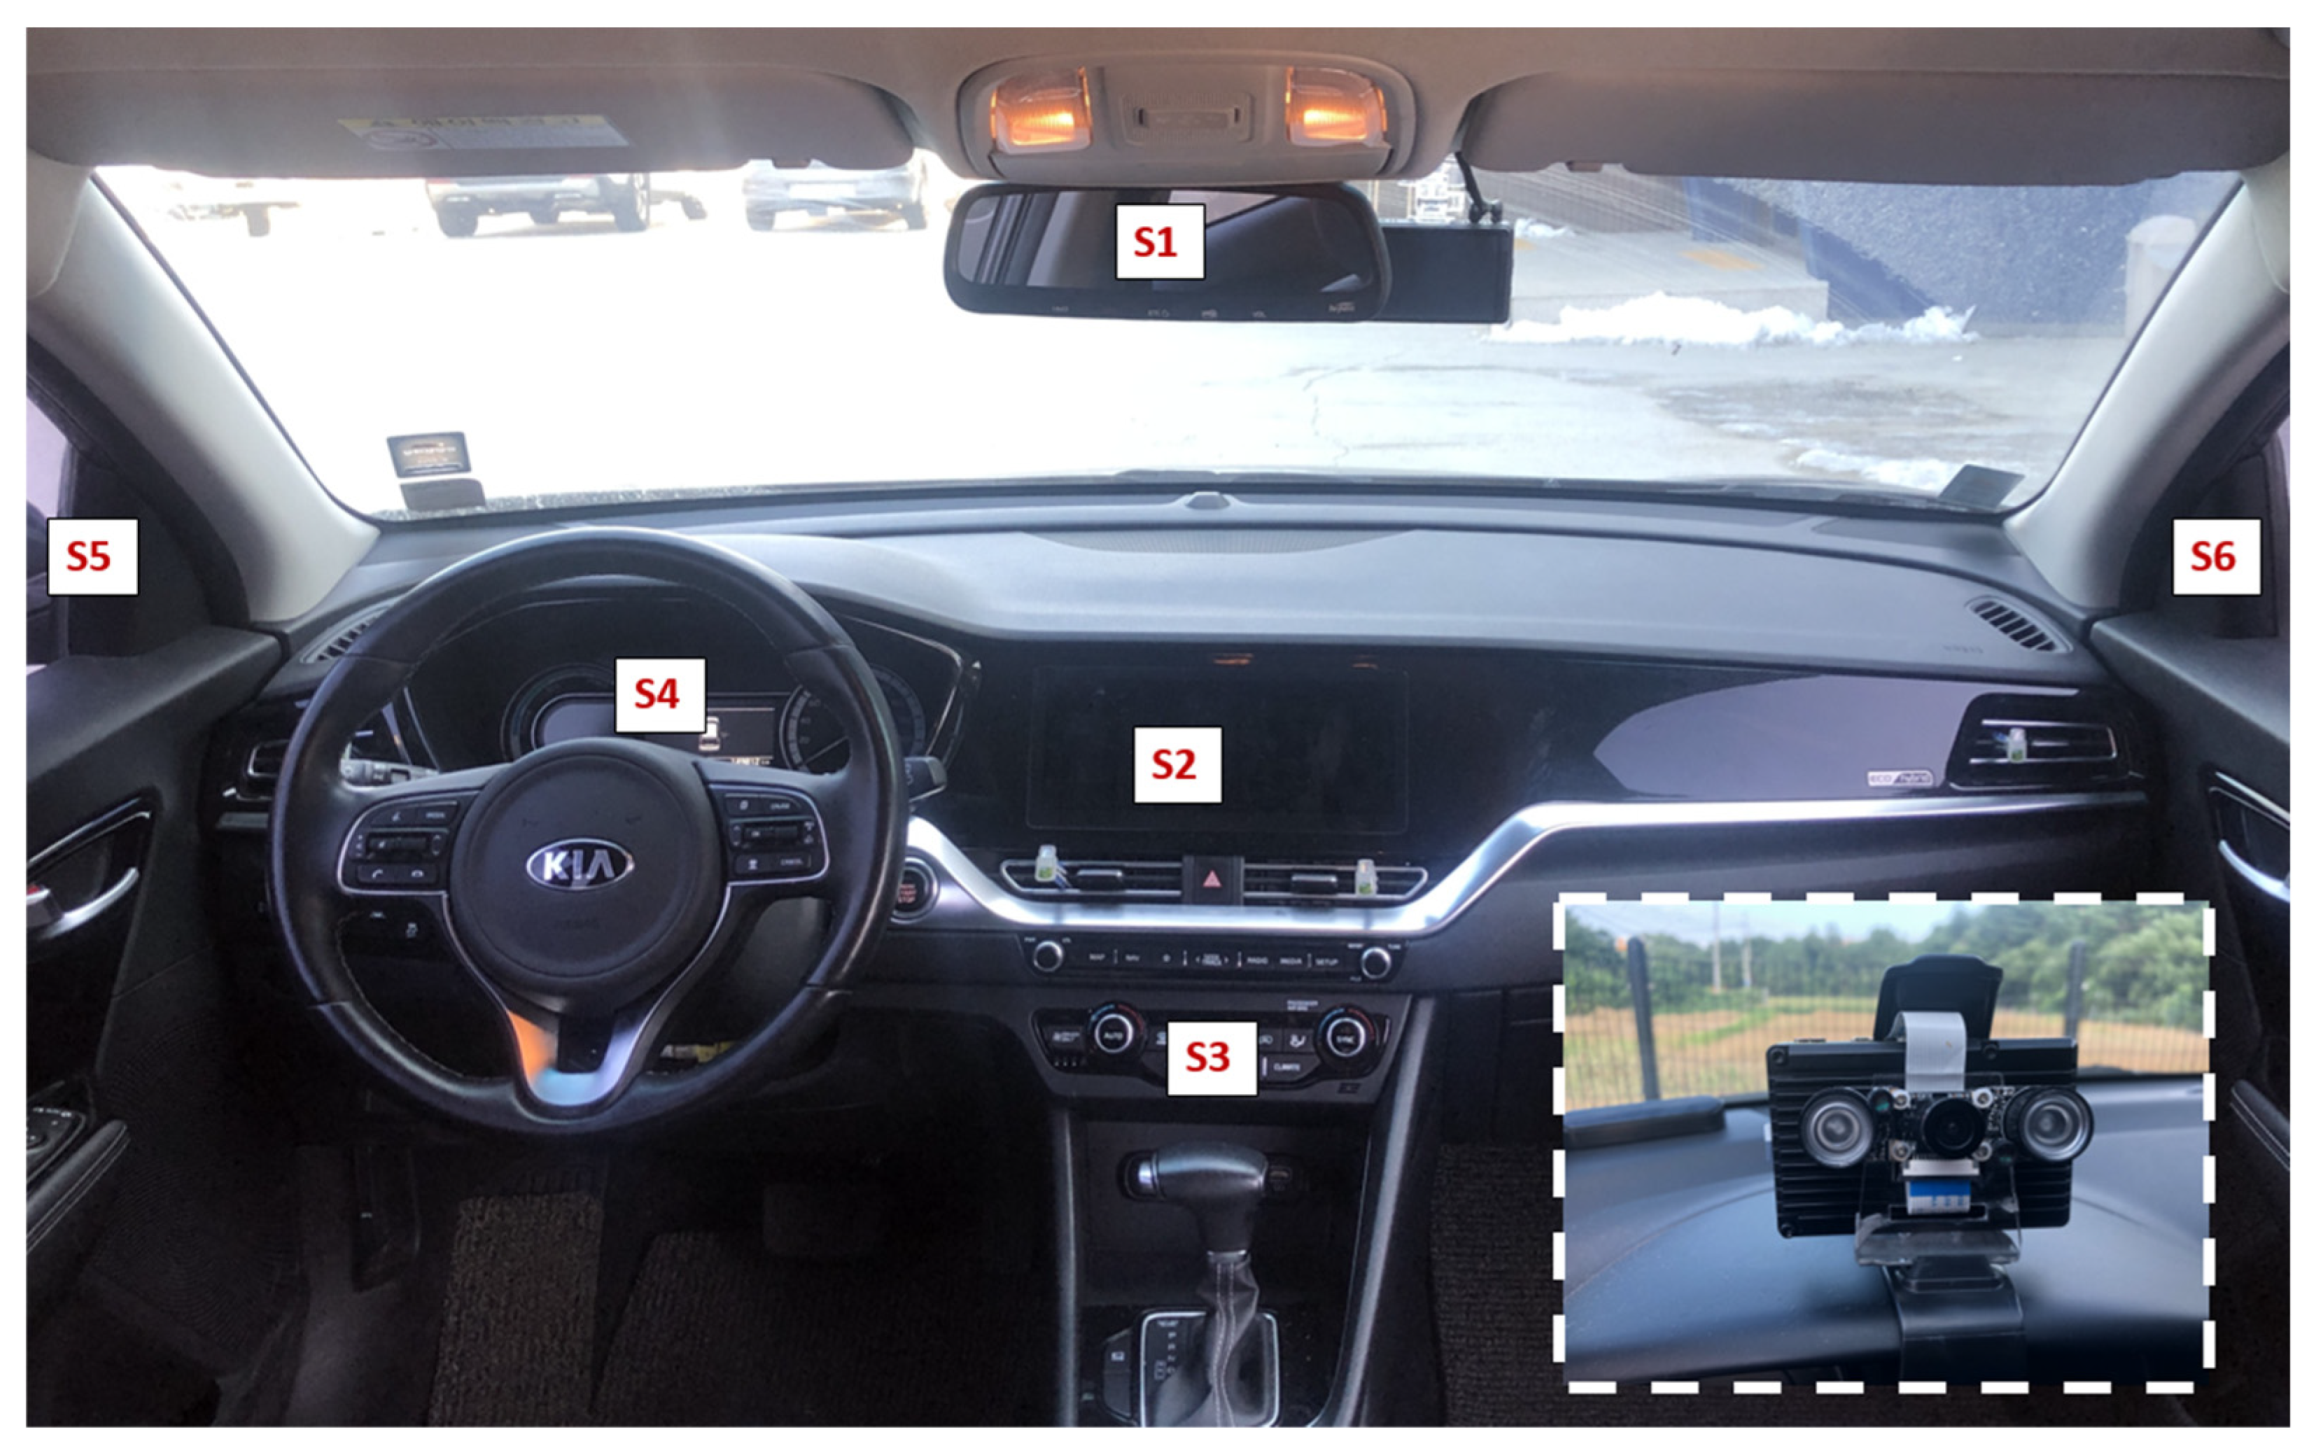
To determine whether the driver’s behavior is related to driving based on visual information, we defined six scenarios and collected data accordingly. As depicted in Figure 5, we defined behavior related to driving as cases where the gaze deviates from the front due to checking the rear-view mirror or console or actions performed for vehicle operation.
In Figure 5, S1 through S6 represent scenarios where the driver is looking at the rear-view mirror, instrument cluster, center console, steering wheel, left side mirror, and right side mirror, respectively.
These scenarios represent common situations where a driver’s attention may shift from the road ahead for legitimate driving-related reasons. The inset image shows the camera setup used to capture the driver’s behavior. The aim of this classification was to ensure the reliability of the driver monitoring system by reducing unnecessary driver warnings through the recognition of driving-related behaviors that involve not looking ahead. By understanding these scenarios, the system can differentiate between necessary driving actions and potentially dangerous distractions, thus improving the accuracy and usefulness of driver alerts.
As shown in Table 3, data were collected by filming actual driving videos in four types of vehicles, including a full-size SUV, a compact SUV, a truck, and a sedan, with ten drivers. The device used for video recording was a Raspberry Pi 4 Model B product connected to a NOIR camera module, collecting video at a resolution of 640 × 480 p. From the collected videos, landmark data for key facial positions were extracted and secured for each vehicle type and driver.
Table 4, Table 5 and Table 6 below show the datasets used to estimate the drivers’ gaze. First, following Step 1 in Figure 1, we obtained facial direction data, including the Euler angles (pitch, yaw, and roll).
Using the eyelid landmark values used for PERCLOS calculation in Figure 4 and the pupil coordinate values from Table 4, we calculated the ratio indicating how far the pupil was positioned from the center of the eye in the up/down and left/right directions. The results are listed as the gaze values for the left and right pupils in Table 5. Subsequently, by applying an arctangent to the ratio values of pupil position from the eye center, we obtained the angle of gaze direction for both the left and right pupils. Then, using the Euclidean distance between the eye center and the pupil, we estimated the final coordinate values ( G x , G y ) where the gaze was directed.
G x = I x + D A cos atan C y , C x H y + H p
G y = I y + D A sin atan C y , C x H p + H y
  • I represents the specific coordinate values within the eye. It provides precise positions relative to the x and y coordinate axes.
  • D is the measured distance from the geometric center of the eye to the pupil, indicating how far the eyeball is from the center of the eye.
  • A is a constant representing the physical distance from the camera to the subject’s face. It is used to scale measurements within the image.
  • C represents the length of one side of the Region of Interest (ROI) bounding box surrounding the face. It is important for normalizing eye positions to a standard size across various images and scenarios.
  • H represents the angle of the head, where Hy denotes the cosine value of the yaw angle and Hp denotes the cosine value of the pitch angle.
Table 5 shows the data obtained from Scenario 1. These data display the relative position ratios of the eye to the eye center and the gaze values calculated with this formula. These ratios and gaze values help us to understand the direction and intensity of the gaze in the given scenario.
The magnitudes of the gaze vector values for the left and right eyes listed in Table 6 were reduced to a single gaze vector value through vector summation operations. The resulting values are represented as SUM_x and SUM_y in Table 6. For each gaze vector value, a Cartesian coordinate system in pixel units was applied, and a single value was derived by numerating from the top left corner. This grid number value is listed as GridValue in Table 6, and its normalized form is indicated as NORM.
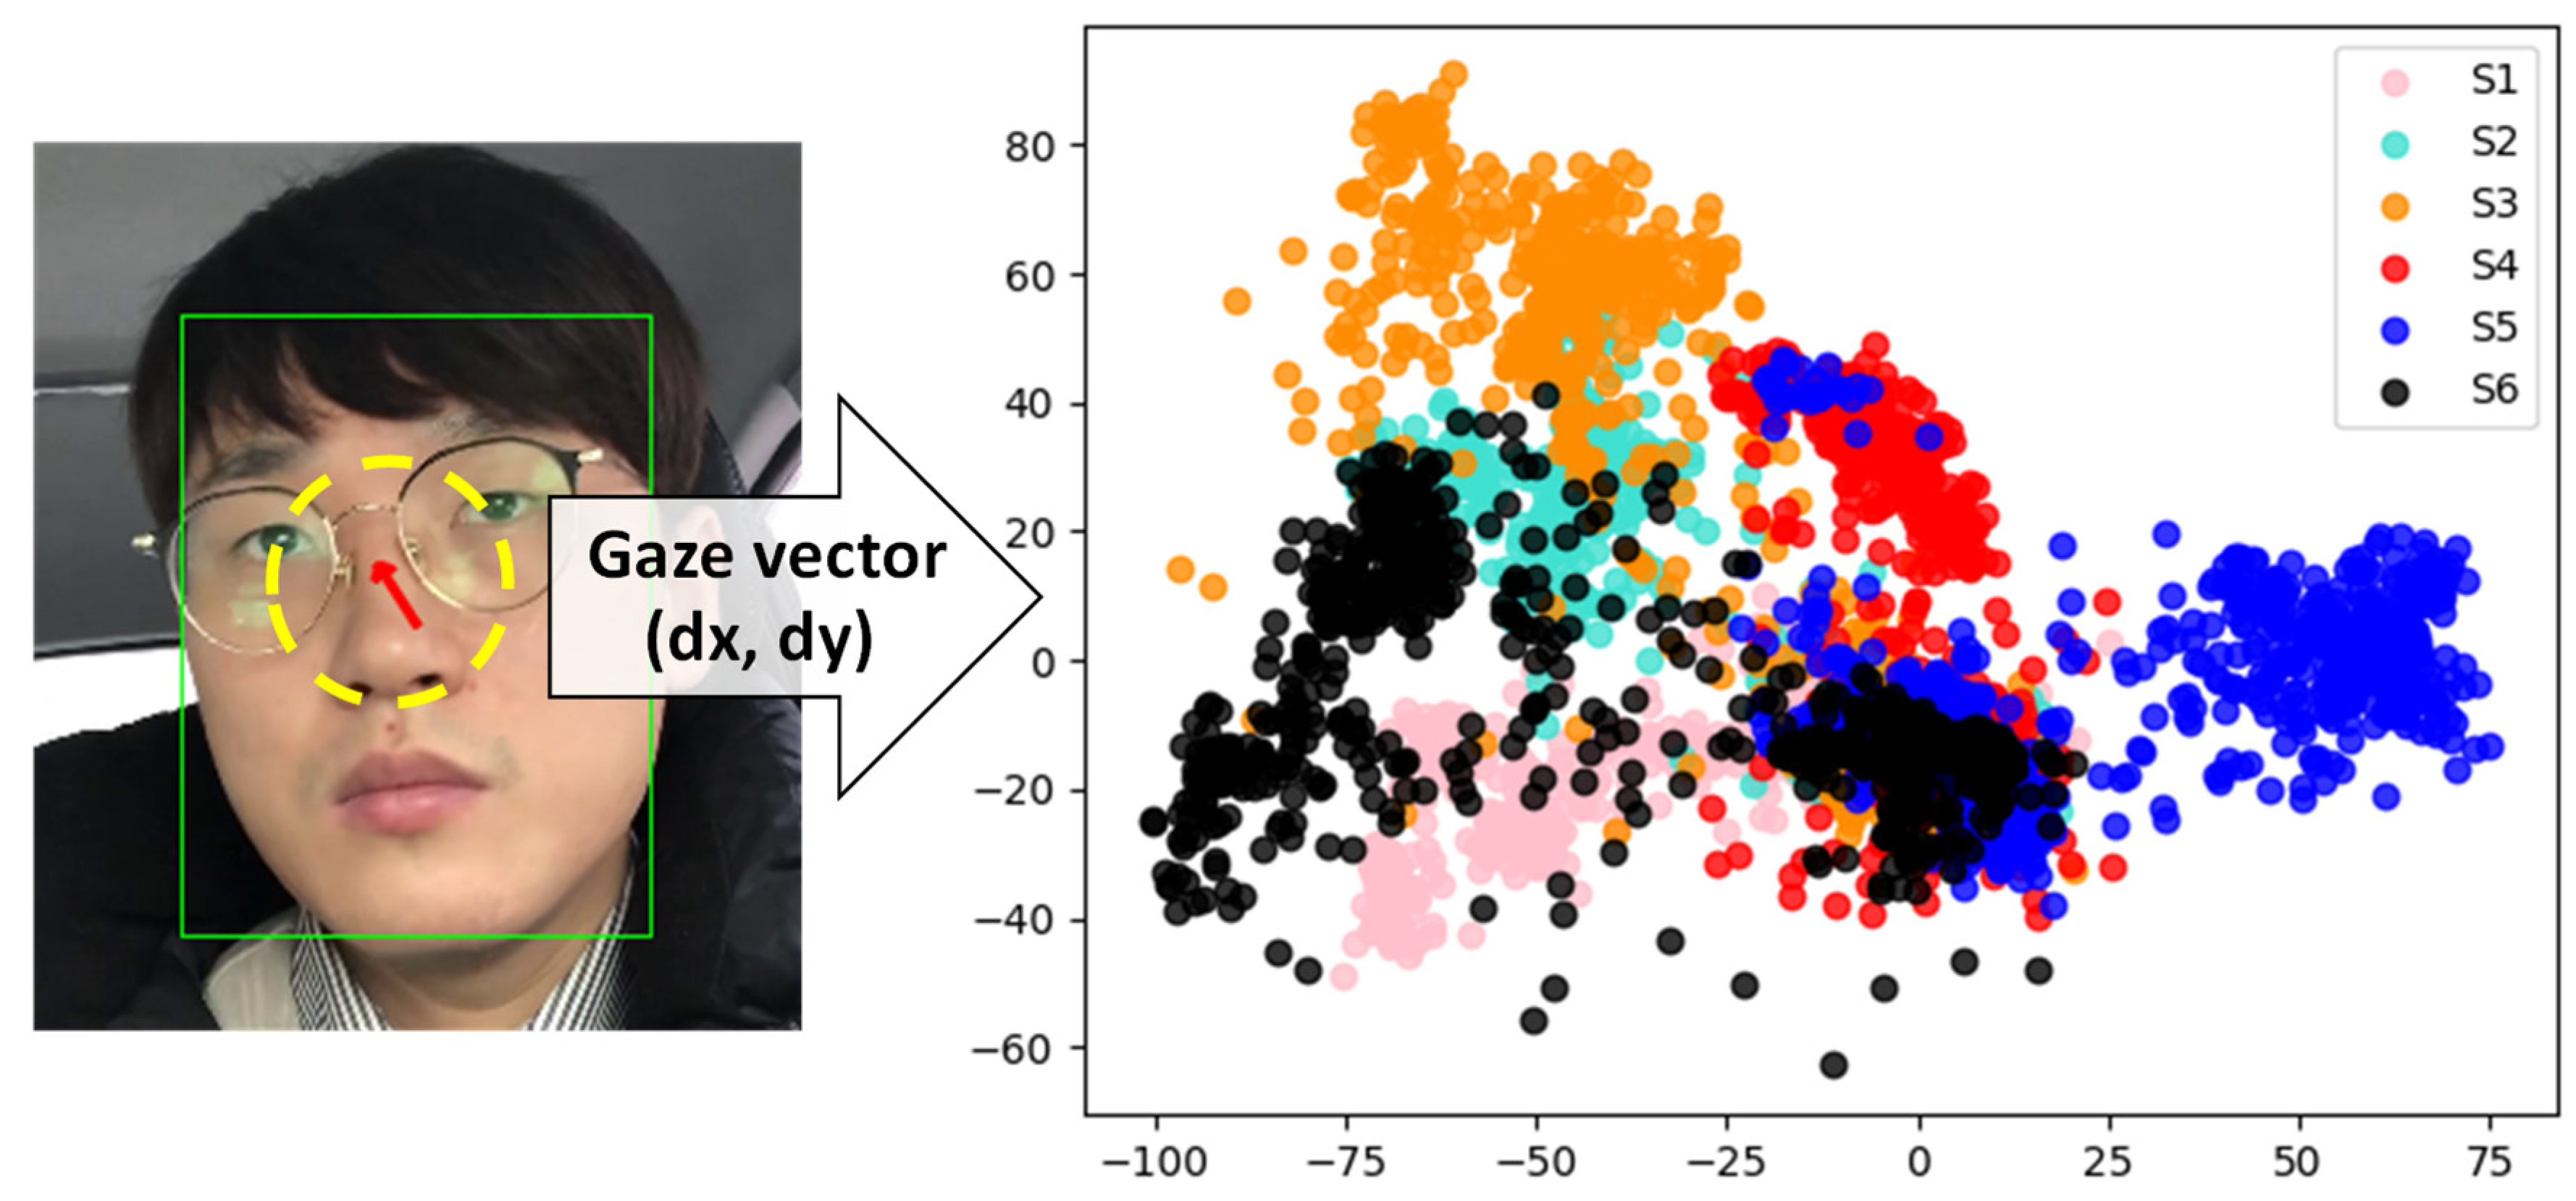
Figure 6 visually represents the single gaze vector values from Table 6 on the x and y axes, illustrating the characteristics of the collected driver gaze data. In the left image, the red arrows indicate the gaze vector (dx, dy). These arrows represent the direction and magnitude of the driver’s gaze. The right image shows the gaze movements for six scenarios (S1 through S6) depicted as a color-coded scatter plot. Each point in the scatter plot corresponds to a gaze vector, with its position indicating the horizontal (x) and vertical (y) components of the driver’s gaze direction.
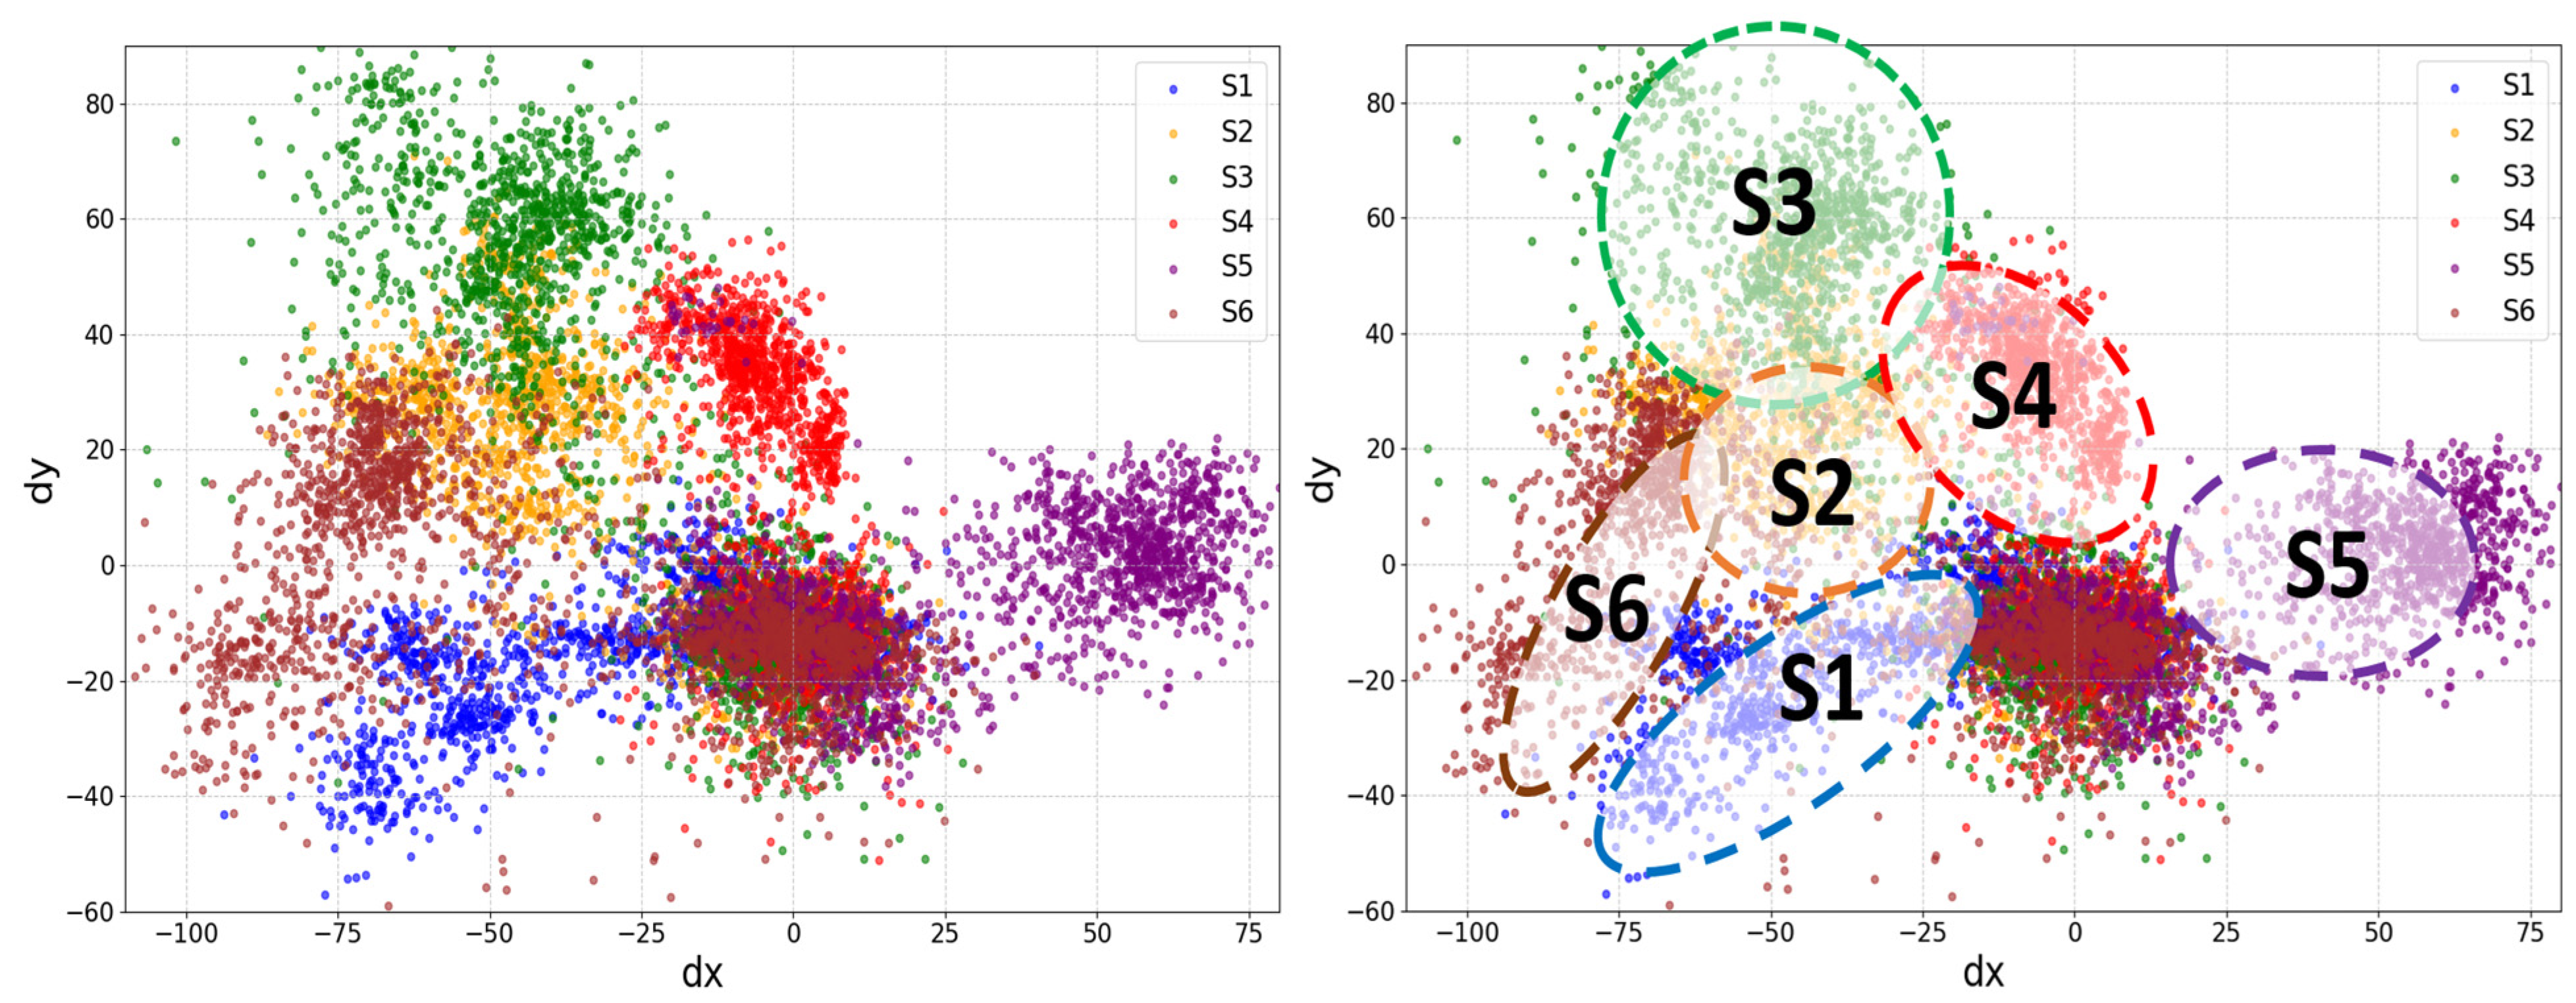
The image presented in Figure 7 illustrates the distribution of gaze vector components (dx, dy) for six distinct driver behavior scenarios, each represented by a different color. This visualization provides compelling evidence for the differentiation of driver attention states based on eye movement patterns. The scenarios are labeled as S1 through S6, where S1 represents the driver looking at the rear-view mirror, S2 indicates the driver focusing on the instrument cluster, S3 shows the driver’s gaze directed at the center console, S4 depicts the driver looking at the steering wheel, S5 signifies the driver observing the left side mirror, and S6 represents the driver checking the right side mirror. The right panel of the figure highlights these distinct clusters, demonstrating how each scenario results in a unique pattern of eye movements and gaze directions.
As observed in the scatter plot, each scenario (S1 through S6) occupies a relatively distinct region in the two-dimensional space defined by the horizontal (dx) and vertical (dy) components of gaze vectors. The left panel shows the raw data points, while the right panel overlays approximate boundaries for each scenario cluster, enhancing the visual separation between behaviors.
The clear clustering of data points corresponding to each scenario demonstrates that driver gaze patterns exhibit characteristic signatures depending on the specific driving-related task or attention state. For instance, scenario S3 (shown in green) appears to involve more upward and rightward gaze movements, possibly corresponding to checking the gear shift or center console. In contrast, scenarios S5 and S6 show concentrations of gaze vectors on the left and right sides of the central gaze point, respectively. This distribution likely indicates behaviors such as checking side mirrors or looking at the vehicle’s periphery, suggesting the driver’s attention to the lateral surroundings of the vehicle.
Importantly, while there is some overlap between clusters, particularly in central regions where multiple behaviors may share common gaze directions, the overall separation is substantial. This separation suggests that these gaze vector distributions can serve as a robust basis for classifying driver behaviors and attention states.
The distinguishability of these clusters supports the hypothesis that when a driver’s gaze deviates from the straight-ahead position, the nature of this deviation can be used to infer whether the eye movement is related to a specific driving task or potentially indicative of distraction or inattention.
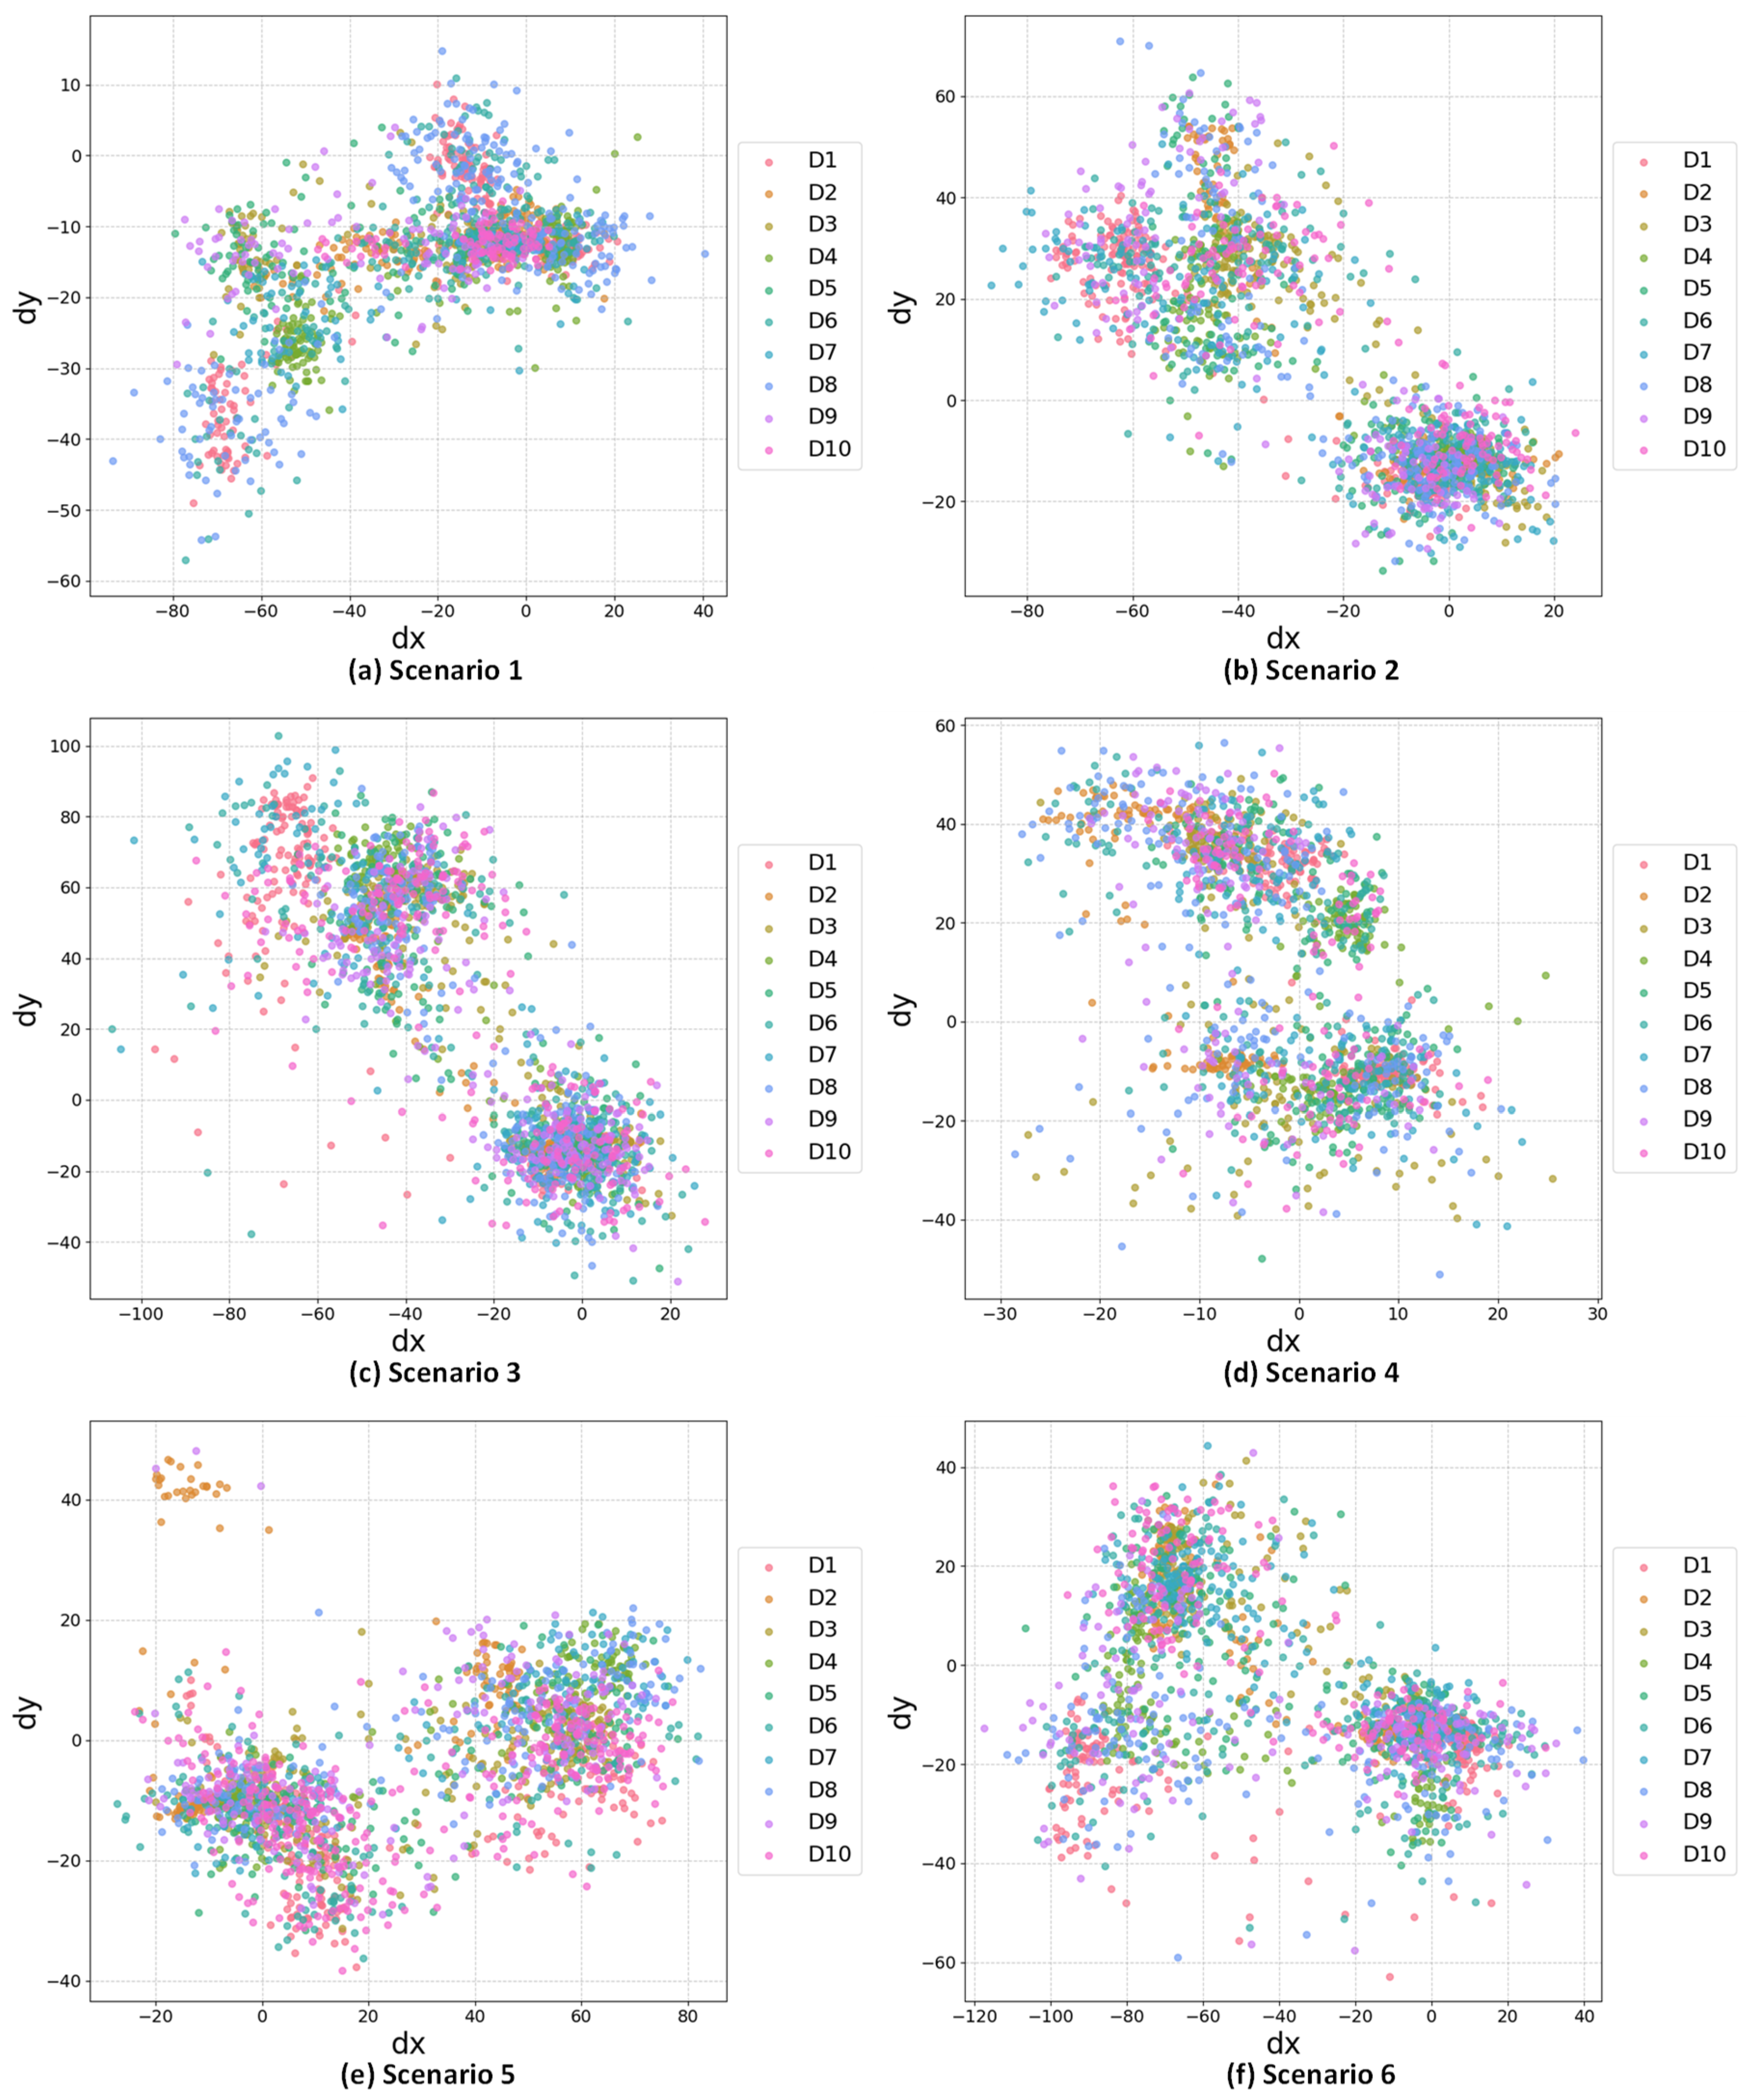
Figure 8 presents a comprehensive visualization of gaze vector distributions for six distinct driving-related behavior scenarios, each representing data from ten different drivers. This multifaceted representation offers valuable insights into the consistency and variability of gaze patterns across different individuals and driving conditions.
The scatter plots for each scenario demonstrate characteristic clustering patterns, corroborating the findings observed in Figure 7. This consistency across drivers and vehicles reinforces the robustness of scenario-specific gaze behaviors.
Importantly, while each scenario exhibits a characteristic overall pattern, there is noticeable variability between drivers, as indicated by the color-coded data points. This inter-driver variability likely stems from differences in physical characteristics, driving habits, and potentially the specific vehicles used in the study.
The consistency of overall patterns across drivers, despite individual variations, strongly suggests that these scenario-specific gaze behaviors are generalizable. This finding has significant implications for the development of robust driver monitoring systems. It indicates that a generalized model based on these scenario-specific patterns could provide a solid foundation for detecting and classifying driver behaviors, while personalized data learning could further enhance accuracy.
Moreover, the observed patterns typically show a deviation from the forward position followed by a return, which aligns with expected driving behaviors where drivers periodically check various areas of the vehicle or surroundings before returning their gaze to the road ahead.
In conclusion, Figure 8 provides compelling evidence that driver gaze patterns, while subject to individual variability, exhibit consistent scenario-specific characteristics. This supports the feasibility of developing sophisticated driver monitoring systems capable of accurately classifying various attention states across a diverse driver population. This study also suggests that accumulating more data over time for individual drivers could further refine these classifications, potentially leading to highly accurate, personalized driver attention monitoring systems.
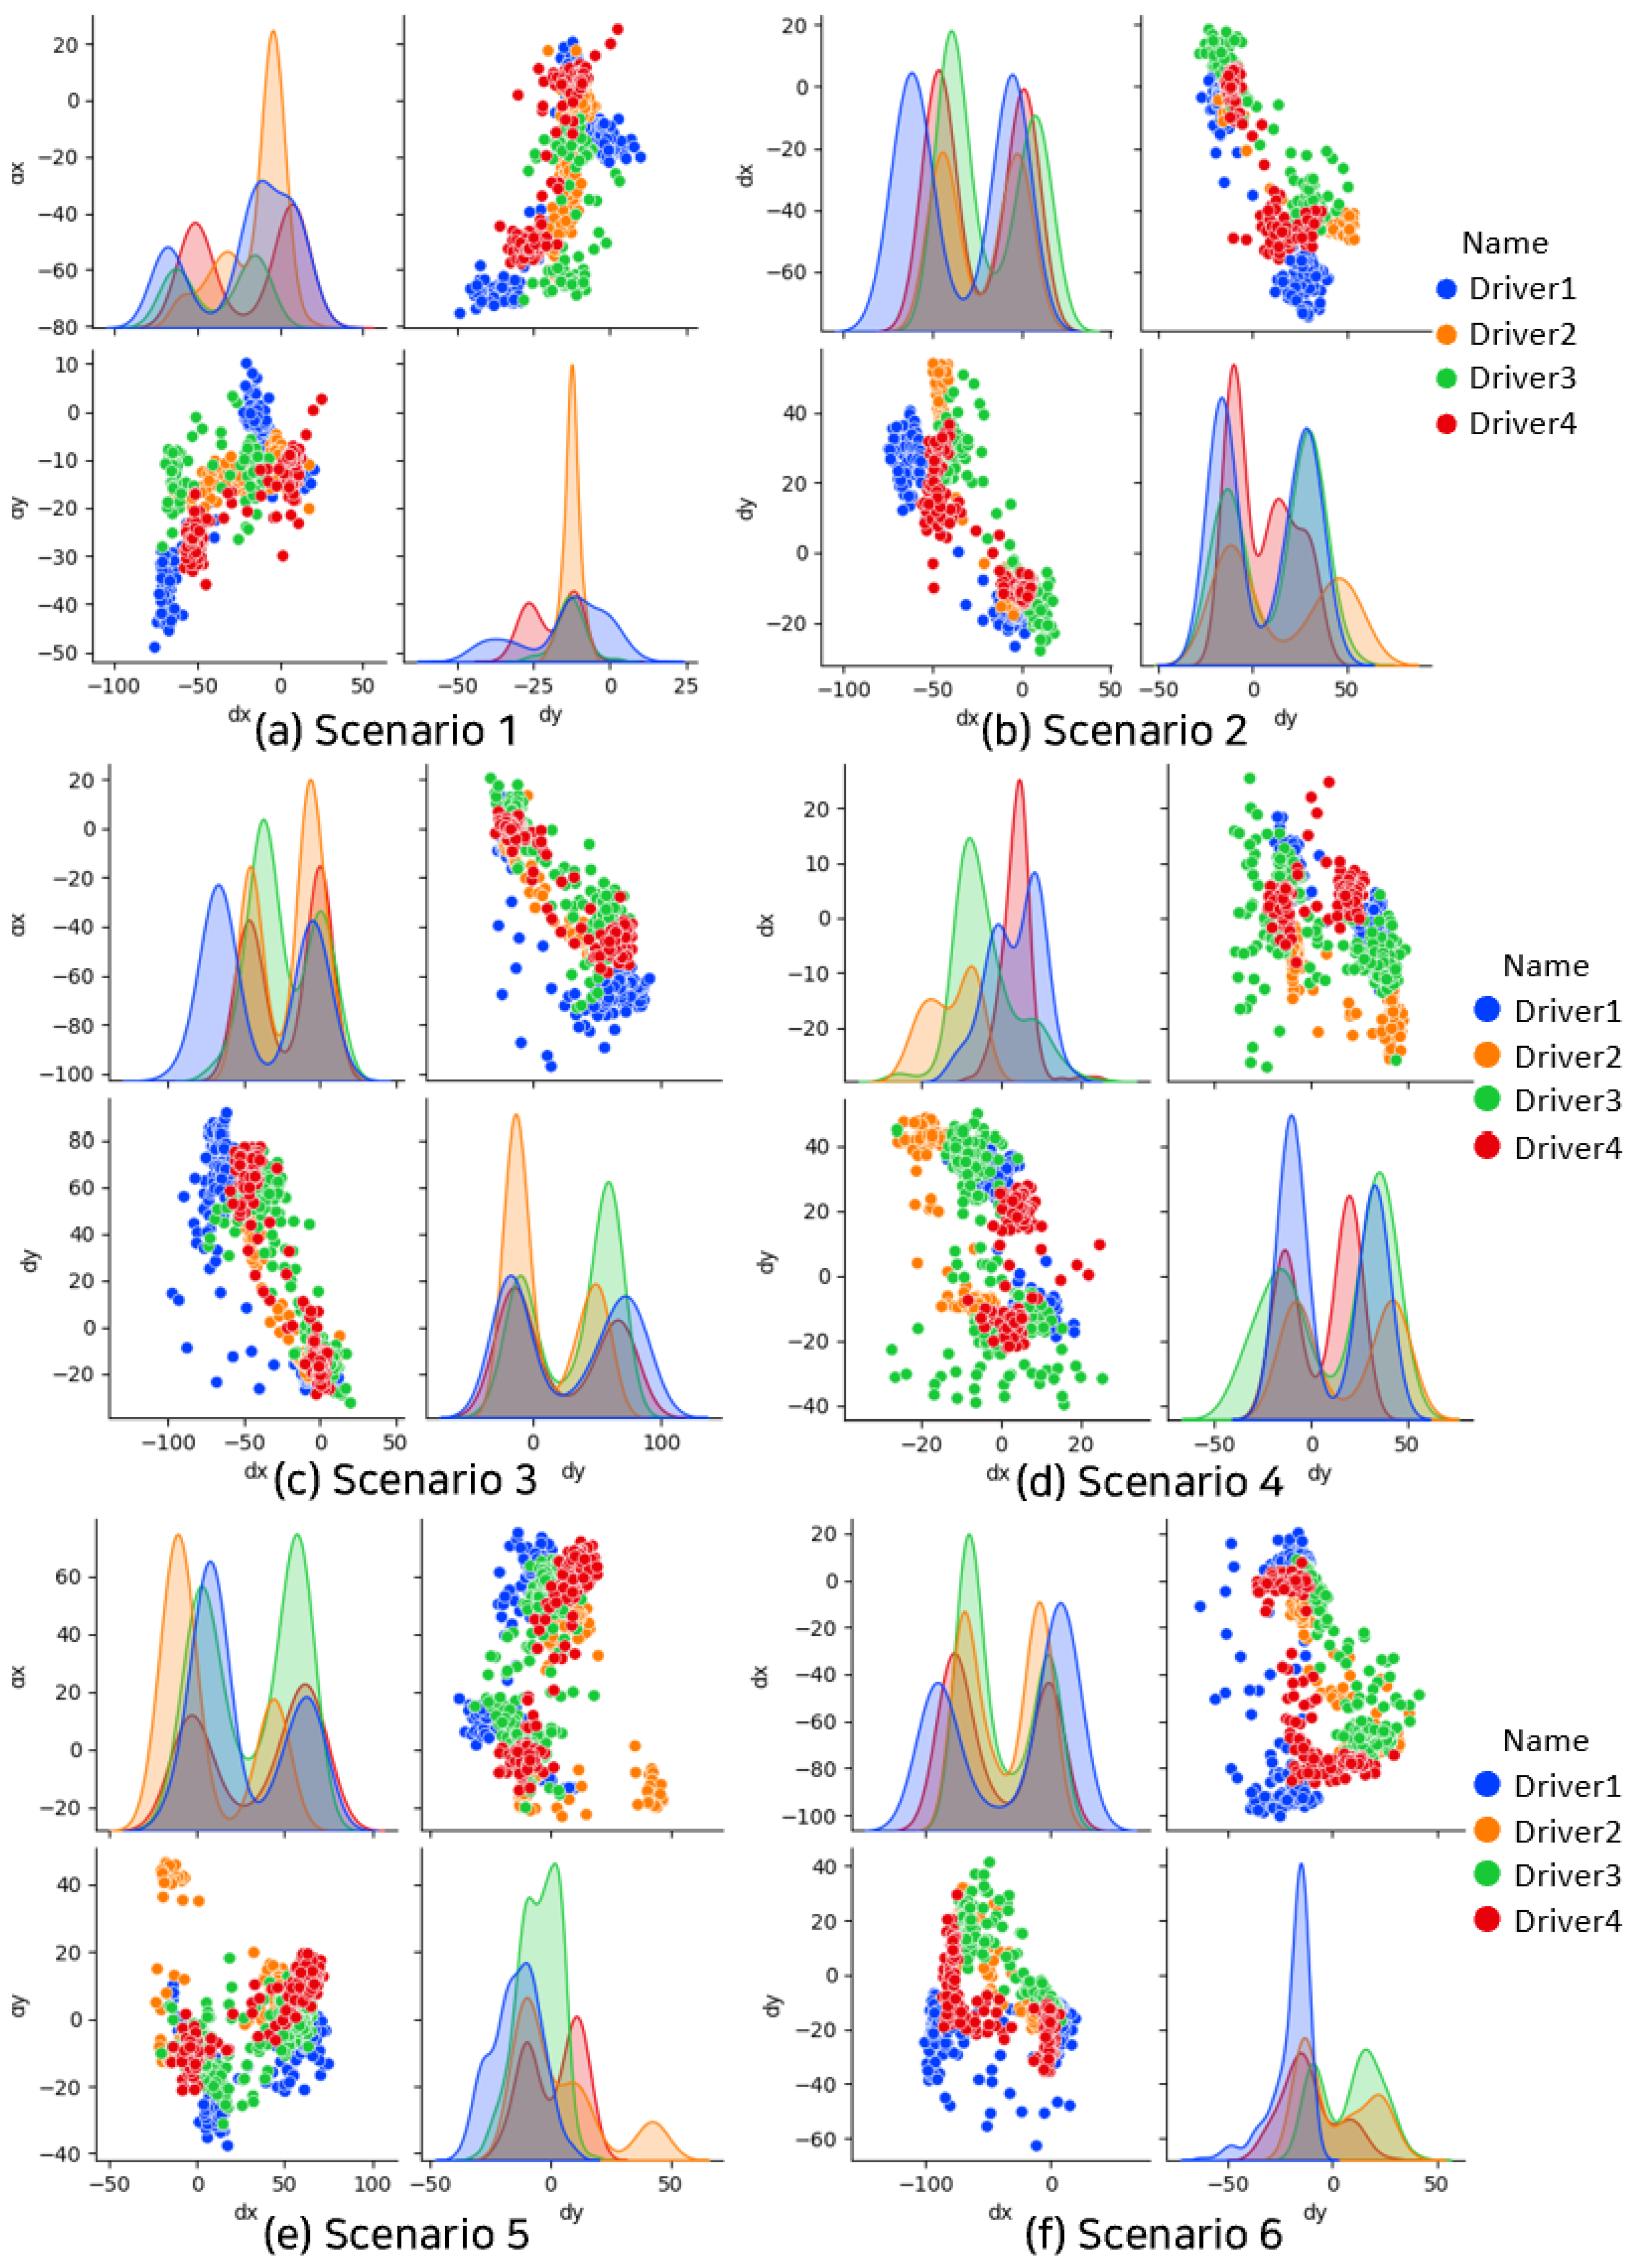
Figure 9 provides a comprehensive visualization of the correlation distribution between dx and dy coordinate values, representing gaze movement vectors for four drivers across six driving behavior scenarios. The figure consists of graphs showing dx and dy scatter plots for each driver, along with individual kernel density estimation (KDE) curves for dx and dy. These KDE curves, displayed on the sides of each scatter plot, illustrate the distinct density patterns of gaze movements along the x and y axes respectively. The varying shapes and peaks of these curves reveal unique concentration patterns of gaze for each scenario and driver. By analyzing these distinct patterns, it becomes possible to characterize and differentiate the gaze behaviors associated with each driving scenario. Each driver is distinguished by a unique color in both the scatter plots and the corresponding KDE curves, allowing for easy comparison across individuals and scenarios.
Key observations from this figure include:
  • Inter-driver variability: Within each scenario, the scatter plots reveal distinct clustering patterns for each driver, indicating persistent individual differences in gaze behavior even under similar driving conditions. This is further supported by the varied shapes and peaks of the KDE curves for each driver.
  • Scenario-specific patterns: The overall distribution of gaze vectors shows marked differences across scenarios, suggesting that different driving tasks elicit distinct gaze behaviors. For instance, Scenario 3 exhibits a more diffuse pattern compared to the tighter clustering in Scenario 1.
  • Bimodal distributions: In several scenarios (e.g., S3, S5), the KDE curves for dy exhibit bimodal distributions for some drivers. This could indicate alternating attention between two vertical points of interest, such as the road ahead and the dashboard.
  • Density hotspots: Areas of high point density in the scatter plots, often corresponding to peaks in the KDE curves, represent frequently occurring gaze positions. These hotspots could be indicative of key areas of visual attention for specific driving tasks.
The observed patterns and variations across drivers and scenarios underscore the complexity of driver gaze behavior and the potential for data-driven approaches in developing sophisticated driver monitoring systems. The consistent presence of identifiable patterns within scenarios, despite individual variations, suggests that scenario-specific models could form a robust foundation for gaze behavior classification. Furthermore, the clear inter-driver differences highlight the potential value of personalized calibration in such systems to enhance accuracy and reliability.
To classify eye movement vectors while preserving sequence information, these vectors must be converted into one-dimensional time series data. For this purpose, as described in Table 6, we constructed one-dimensional time series data using the synthesis results of gaze vector values gridded and enumerated in pixel units within a Cartesian coordinate system. These data were preprocessed through normalization. Table 7 shows that the conversion to one-dimensional time series data effectively represents the original data without significant loss. The explained variance ratio ranges from a minimum of 0.83 to a maximum of 0.94, demonstrating that the integrity of the one-dimensional time series data can be maintained with minimal data loss.

3.3. Data Preprocessing

Data converted into a one-dimensional time series undergo preprocessing to enhance accuracy and speed. This process aims to emphasize inherent patterns within the data, making analysis easier. The preprocessing sequence consists of several key steps. Figure 10 visually illustrates how the data changes through this process.
First, Figure 10a displays seven different gaze information sets, each represented by a distinct color, which represent data collected from the same driving scenario repeated multiple times.
Next, change extraction is performed. This step calculates the change from one data point to the next within the sequence. Figure 10b illustrates this process, showing how it emphasizes significant changes in the data, which is crucial for pattern recognition. The graph demonstrates the transformation of subtle variations in the original gaze vector dataset Figure 10a into more pronounced spikes, representing changes.
Next, a moving average is applied to mitigate data fluctuations, reduce noise, and reveal underlying trends. This is followed by standardization, which adjusts the mean of the data to 0 and its standard deviation to 1. Figure 10c shows the result of these processes, where the data now display clear patterns with normalized amplitudes, facilitating easier comparison across different sequences.
The final preprocessing step involves extracting common patterns using techniques such as Dynamic Behavior Analysis (DBA). Figure 10d presents a derived common pattern that represents characteristic behavior shared across multiple sequences. This pattern serves as a template for classification and further analysis.
Upon completion of these preprocessing steps, the refined data are re-circulated into the learning process. This recirculation strengthens the classification model, enabling it to recognize and respond more adeptly to similar patterns in future datasets. Through this iterative process, the reinforced pattern data are expanded and undergo the same series of preprocessing steps, ensuring they maintain the integrity and clarity necessary for accurate classification in each new iteration.
Figure 10 provides a visual summary of this preprocessing workflow, illustrating the transformation from raw gaze vector data to refined, analyzable patterns. This systematic approach enhances the model’s ability to detect and classify complex gaze behaviors, potentially improving the accuracy and reliability of driver monitoring systems.

3.4. Driver Inattention Estimation

Time Series Classification (TSC) has been recognized as one of the most challenging problems in data mining [26]. With the advancement of IoT technology, the explosive increase in data generation has led to a corresponding increase in demand for analysis solutions. As a result, research and development in the TSC field have become active, and hundreds of algorithms have been proposed to date [31,32].
Conventional machine learning (ML) algorithms rely on processing on cloud or centralized servers [33]. However, this approach is not appropriate in cases where data processing speed is crucial, such as in driver monitoring systems in the automotive industry. To address this issue, we propose a driver monitoring system that uses on-device learning technology [4]. This system incorporates and optimizes the driver’s behavior patterns directly into the ML model, including the DBA (DTW Barycenter Averaging) and K-means clustering models proposed by Petitjean and François [5].
The CDIDM finalizes time series data on the rate of change in gaze vectors. When these data are classified using the K-means clustering model, they are effectively divided into three distinct categories. Figure 11 shows the results of classifying gaze data through the CDIDM. The data on the right show a total of seven sets of gaze data to be classified, consisting of two sets of gaze data from scenario 5, two sets of forward gaze data, and three sets of other gaze movement data. The graph on the left shows the results of the seven analyzed data classified into three time series consisting of driving-related gaze data, forward gaze data, and driver inattention data.
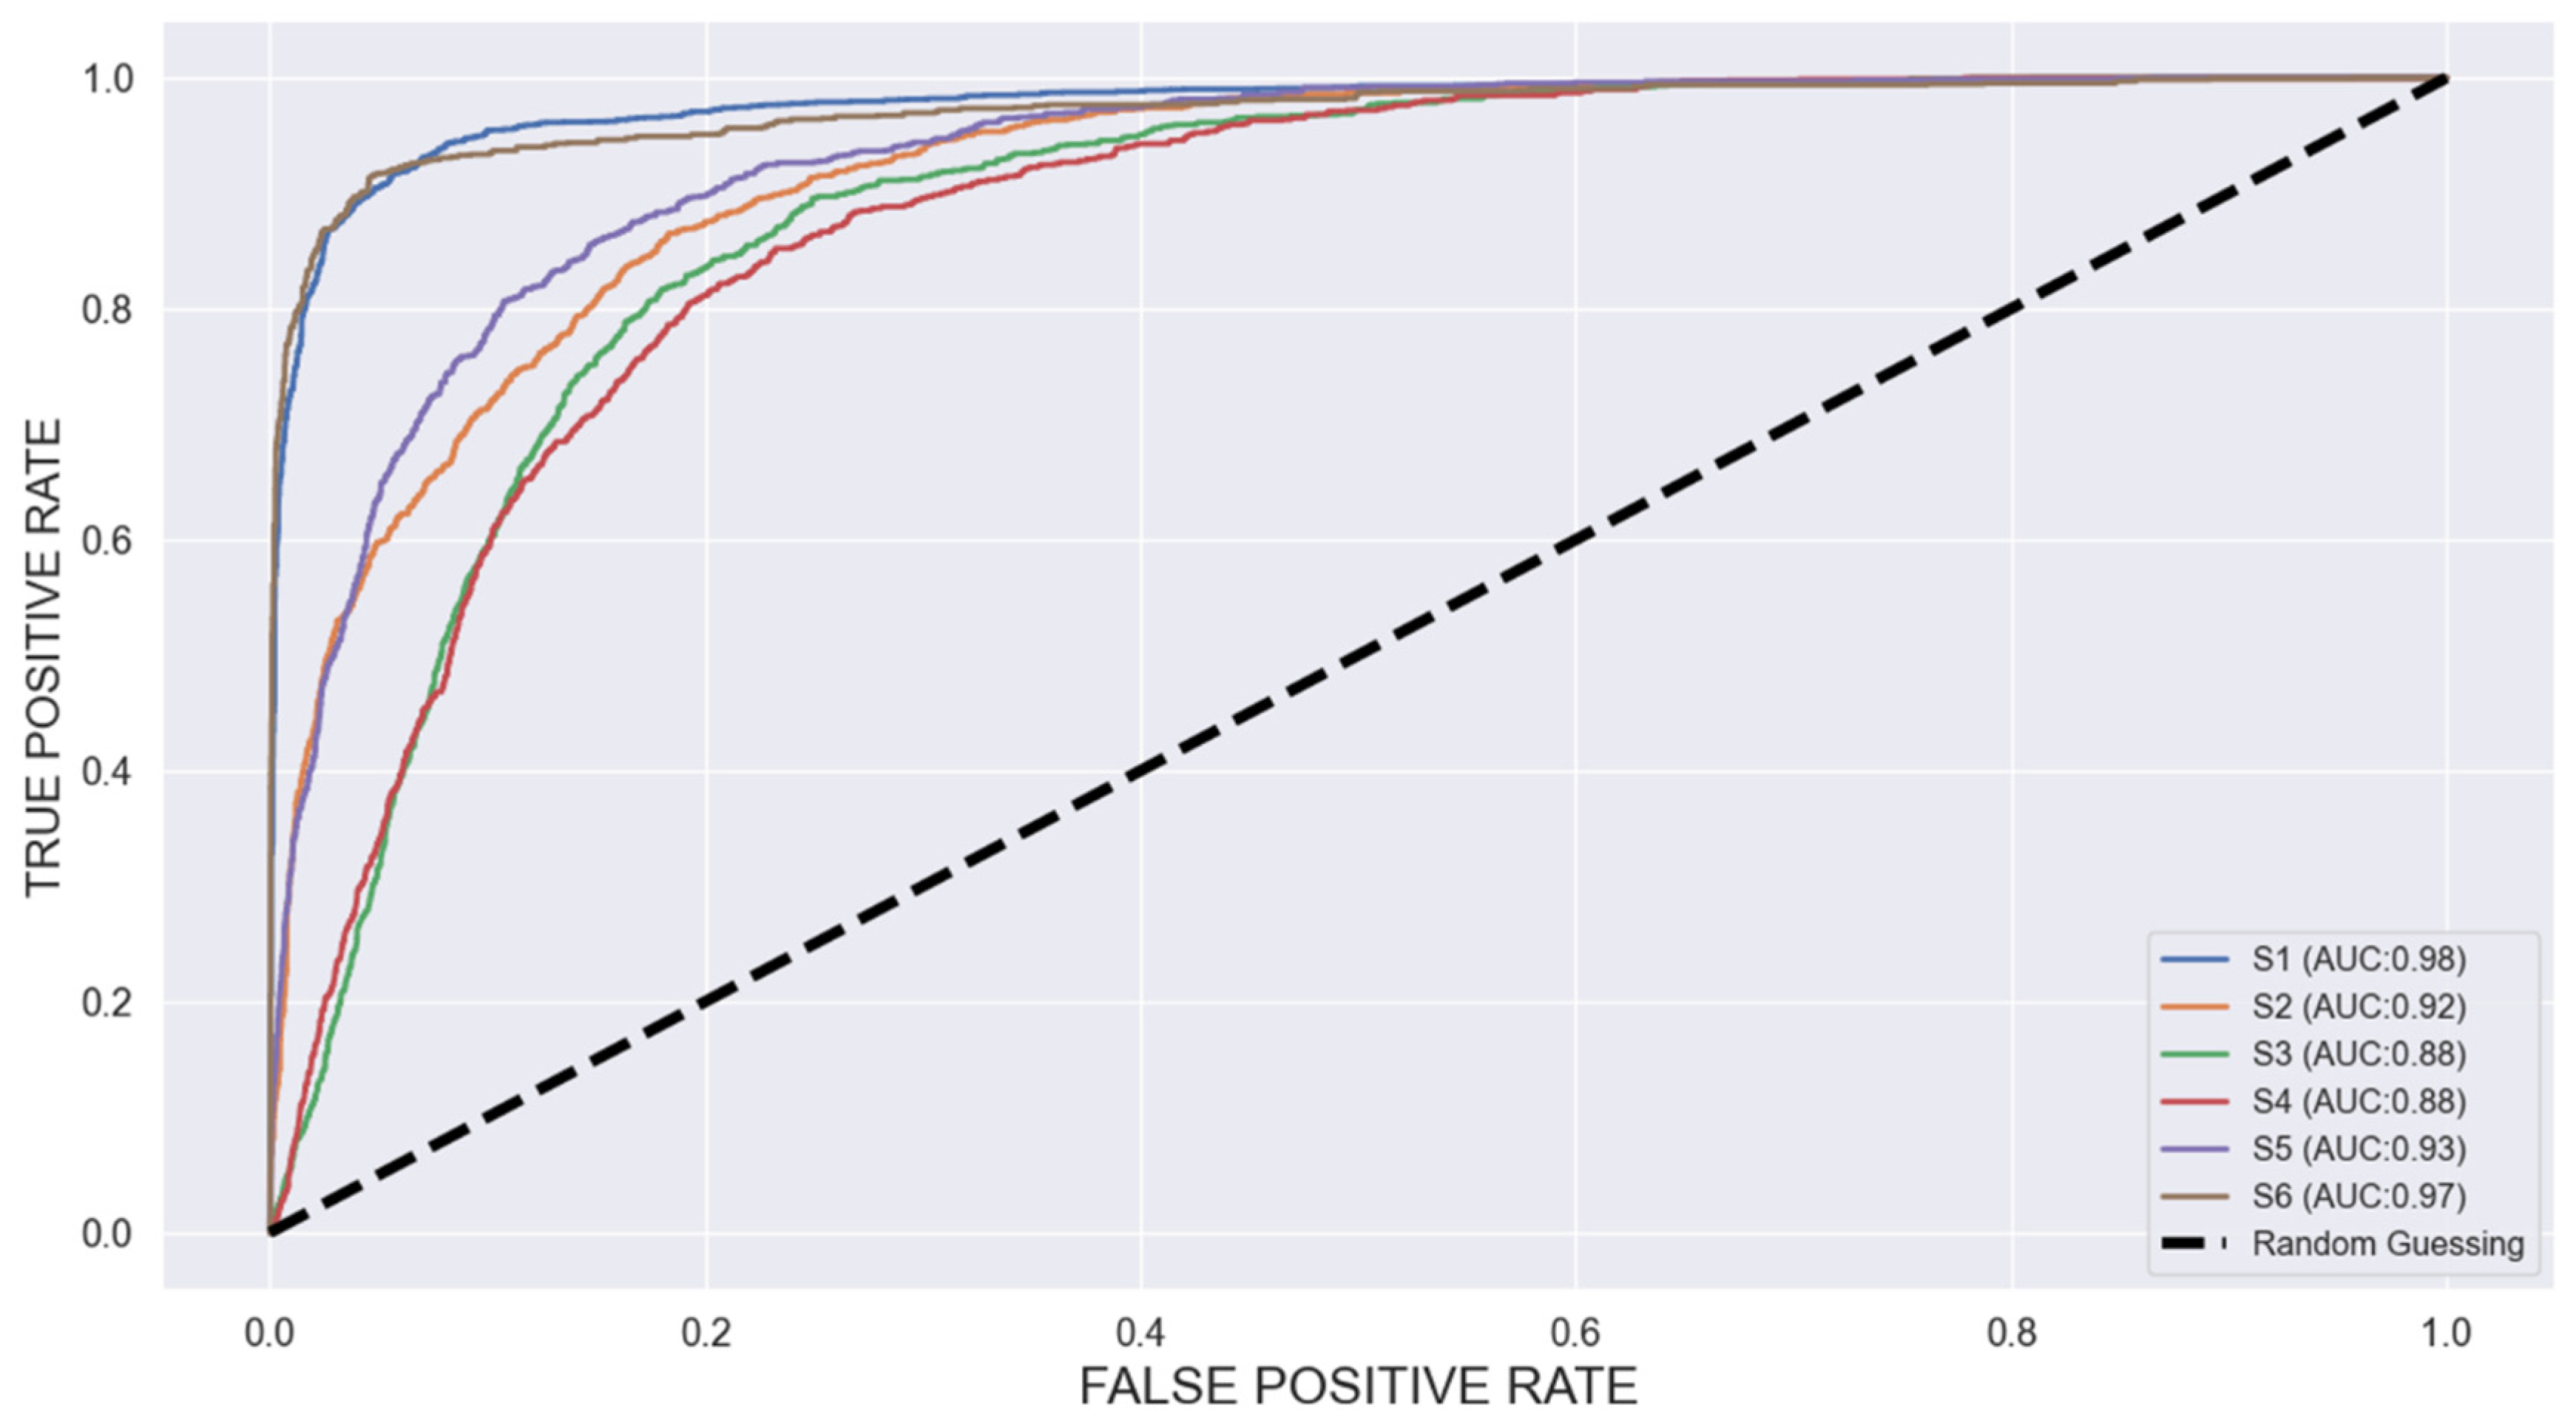
Figure 12 shows the results of classifying the drivers’ gaze data into six predefined driving-related gaze movements based on time series analysis techniques. Figure 12 shows the results of classifying the drivers’ gaze data into six predefined driving-related gaze movements based on time series analysis techniques, categorized into six scenarios. The test was conducted by selecting and labeling videos corresponding to the scenarios from footage of ten drivers operating eight types of vehicles, extracting gaze information from the videos, and dividing it to build a total of 12,648 Test DataSet items. Based on this, the classification accuracy was derived, resulting in a final ROC Score of 0.92, achieving satisfactory classification results.
The AUC values for scenarios such as checking the vehicle infotainment system (S2), operating the center console (S3), and checking the instrument panel (S4) are 0.92, 0.88, and 0.88, respectively, showing relatively lower accuracy compared to the other scenarios. This lower accuracy is attributed to the complexity of the classification process due to the proximity of the related locations. Furthermore, there are still limitations in accurately recognizing gaze positions due to the low resolution of 480 p. However, when the gaze information is dichotomized into non-driving-related and driving-focused categories, we confirm that the accuracy improves to 97%.
Table 8 shows the classification accuracy between gaze data for each scenario and inattention data for each driver. The results demonstrate that as the amount of data increases, the classification accuracy for each scenario improves. Furthermore, it can be observed that the classification accuracy between scenarios and inattention data has improved more significantly than the classification between scenarios, achieving up to 97% accuracy.
Table 9 presents a comparison of accuracy among driver inattention classification models. Our Customized Gaze Estimation Model (CDIDM) achieves 97% accuracy, which is slightly lower than some other models that reach 98%. However, it’s important to note that unlike other models, CDIDM can classify not only driver drowsiness but also inattentiveness. Moreover, considering our model’s potential for enhancement through data accumulation, we believe it remains competitive in the field. While the table shows that EEG signal analysis [3] and gaze estimation (PERCLOS) [15] methods achieve 98% accuracy, our model offers a more comprehensive approach to driver monitoring. Furthermore, we anticipate that CDIDM’s classification accuracy will improve even further as hardware performance advances, enabling real-time analysis of high-resolution video images. This potential for enhancement underscores the scalability and future-proof nature of our proposed model.

4. Results and Discussion

To demonstrate the effectiveness of CDIDM’s continuous learning capability, we conducted a longitudinal study using a subset of participant data. Figure 13 illustrates the improvement in accuracy as the system accumulates data from individual drivers.
As shown in the figure, the system initially achieved an average accuracy of 92% in detecting driver inattention with only 100 gaze datasets per participant. We then incrementally added 100 datasets at each stage and evaluated their accuracy. The results show that when the accumulated data reached 1000 sets, the system achieved 95% accuracy. Ultimately, as evidenced by Driver1′s classification results in Table 8, we confirmed that an accuracy of 97% could be attained with over 2000 datasets. This demonstrates significant performance improvement as more data are collected and the system continues to learn.
This trend clearly illustrates the system’s ability to adapt and enhance its performance over time, effectively addressing the initial limitation of a small participant pool. The personalized nature of this learning process ensures that the system becomes increasingly robust to each individual driver’s behaviors and patterns, resulting in more accurate and reliable inattention detection. These data not only validate the effectiveness of our continuous learning approach but also highlight the potential for even further improvements with extended use.

5. Conclusions

In this paper, we validated the performance of the Customized Driver Inattention Detection Model (CDIDM) using a Raspberry Pi 4 Model B equipped with a Broadcom BCM2711 chipset and 8 GB LPDDR4-3200 SDRAM, integrated with an intelligent camera module featuring Intel’s Myriad X Vision Processing Unit (VPU) with 4 TOPS processing capability. This hardware configuration achieved processing speeds exceeding 20 fps at 640 x480p resolution, confirming the feasibility of real-time driver monitoring services.
CDIDM utilizes the YOLO v8 model, optimized for edge devices, to perform efficient facial tracking. When deployed on the Myriad X VPU, our system demonstrated robust performance across various driving scenarios, maintaining real-time processing capabilities essential for prompt driver inattention detection and warnings.
Although the current study was conducted with a limited number of participants, it shows promising potential for real-world application by confirming accuracy improvements for individuals through the accumulation of empirical data. The combination of affordable hardware (Raspberry Pi 4) with specialized AI accelerators (Myriad X VPU) presents a cost-effective yet powerful solution for advanced driver monitoring systems. This approach bridges the gap between high-cost specialized equipment and the need for accessible real-time driver safety technologies.
The CDIDM proposed in our research offers a practical and scalable solution for real-time driver monitoring and warning provision. Its ability to perform complex visual analysis tasks while maintaining high frame rates demonstrates its potential for integration into actual vehicular systems. Future research will focus on three key areas: First, expand the participant pool and test the system under diverse real-world driving conditions to enhance reliability and generalizability. Second, explore the system’s adaptability to various vehicle types and embedded automotive platforms to ensure broad applicability. Lastly, we plan to develop a next-generation integrated driver monitoring system by incorporating vehicle internal state information via on-board diagnostics (OBD) and real-time road condition data using V2X communication protocols. This comprehensive approach will enable CDIDM to consider driver state, vehicle performance, and environmental factors holistically. By integrating these multifaceted data sources, we anticipate significantly improving CDIDM’s accuracy, reliability, and practicality, further advancing its potential as a crucial component in advanced driver assistance systems and autonomous driving technologies.
In conclusion, our research contributes to the field of automotive safety by presenting an innovative and cost-effective approach to driver inattention detection. The performance of CDIDM and its potential for widespread deployment position it as a promising technology that we anticipate will enhance road safety and support the development of more sophisticated driver assistance systems.

Author Contributions

Conceptualization, C.K. and S.S.; methodology, C.K. and S.S.; software, S.S.; validation, S.S.; formal analysis, S.S.; investigation, S.S.; resources, S.S.; data curation, S.S.; writing—original draft preparation, S.S.; writing—review and editing, S.S.; visualization, S.S.; supervision, C.K.; project administration, C.K.; funding acquisition, C.K. All authors have read and agreed to the published version of the manuscript.

Funding

This research received no external funding.

Data Availability Statement

Due to the nature of this research, participants of this study did not agree for their data to be shared publicly, so supporting data is not available.

Conflicts of Interest

The authors declare no conflict of interest.

References

  1. Autonomous Vehicles—California DMV. Available online: https://www.dmv.ca.gov/portal/vehicle-industry-services/autonomous-vehicles/ (accessed on 10 March 2023).
  2. AbuAli, N.; Abou-zeid, H. Driver Behavior Modeling: Developments and Future Directions. Int. J. Veh. Technol. 2016, 2016, 6952791. [Google Scholar] [CrossRef]
  3. UN Regulation No. 157 Uniform Provisions Concerning the Approval of Vehicles with Regard to Automated Lane Keeping Systems, E/ECE/TRANS/505/Rev.3/Add.151; UNECE: Geneva, Switzerland, 2022; Available online: https://unece.org/ (accessed on 22 February 2024).
  4. Kartynnik, Y.; Ablavatski, A.; Grishchenko, I.; Grundmann, M. Real-time facial surface geometry from monocular video on mobile GPUs. arXiv 2019, arXiv:1907.06724. [Google Scholar]
  5. Petitjean, F.; Ketterlin, A.; Gançarski, P. A global averaging method for dynamic time warping, with ap-plications to clustering. Pattern Recognit. 2011, 44.3, 678–693. [Google Scholar] [CrossRef]
  6. Vogelpohl, T.; Kühn, M.; Hummel, T.; Vollrath, M. Asleep at the automated wheel—Sleepiness and fatigue during highly automated driving. Accid. Anal. Prev. 2019, 126, 70–84. [Google Scholar] [CrossRef] [PubMed]
  7. Zhao, C.; Gao, Y.; He, J.; Lian, J. Recognition of driver distraction based on improved YOLOv5 target detection. Accid. Anal. Prev. 2022, 165, 106505. [Google Scholar]
  8. Deng, Y.; Wu, C.H. A Hybrid CNN-LSTM Approach for Real-Time Driver Fatigue Detection. IEEE Trans. Intell. Transp. Syst. 2023, 24, 5123–5133. [Google Scholar]
  9. ISO/AWI TR 5283-1; Road Vehicles-Driver Readiness and Intervention Management-Part 1: Partial Automation (Level 2) [Un-der Development]. ISO: Geneva, Switzerland, 2021.
  10. EuroNCAP. Euro NCAP Assessment Protocol-SA—Safe Driving, v10.2; Euro NCAP: Leuven, Belgium, 2023. [Google Scholar]
  11. Shahid, A.; Wilkinson, K.; Marcu, S.; Shapiro, C.M. (Eds.) Karolinska sleepiness scale (KSS). In STOP, THAT and One Hundred Other Sleep Scales; Springer: Berlin/Heidelberg, Germany, 2012; pp. 209–210. [Google Scholar]
  12. Subasi, A. Automatic recognition of alertness level from EEG by using neural network and wavelet coefficients. Expert Syst. Appl. 2005, 28, 701–711. [Google Scholar] [CrossRef]
  13. Jiao, Y.; Deng, Y.; Luo, Y.; Lu, B.L. Driver sleepiness detection from EEG and EOG signals using GAN and LSTM net-works. Neurocomputing 2020, 408, 100–111. [Google Scholar] [CrossRef]
  14. Lin, C.T.; Chuang, C.H.; Huang, C.S.; Tsai, S.F.; Lu, S.W.; Chen, Y.H.; Ko, L.W. Wireless and wearable EEG system for evaluating driver vigilance. IEEE Trans. Biomed. Circuits Syst. 2014, 8, 165–176. [Google Scholar]
  15. Li, G.; Boon-Leng, L.; Wan-Young, C. Smartwatch-based wearable EEG system for driver drowsiness detection. IEEE Sens. J. 2015, 15, 7169–7180. [Google Scholar]
  16. Tango, F.; Botta, M. Real-time detection system of driver distraction using machine learning. IEEE Trans. Intell. Transp. Syst. 2013, 14, 894–905. [Google Scholar] [CrossRef]
  17. Liang, Y.; Lee, J.D.; Reyes, M.L. Nonintrusive Detection of Driver Cognitive Distraction in Real Time Using Bayesian Networks. Transp. Res. Rec. 2007, 2018, 1–8. [Google Scholar] [CrossRef]
  18. Hu, S.; Gangtie, Z. Driver drowsiness detection with eyelid related parameters by support vector ma-chine. Expert Syst. Appl. 2009, 36, 7651–7658. [Google Scholar] [CrossRef]
  19. Dasgupta, A.; George, A.; Happy, S.L.; Routray, A. A vision-based system for monitoring the loss of attention in automotive drivers. IEEE Transac-Tions Intell. Transp. Syst. 2013, 14, 1825–1838. [Google Scholar] [CrossRef]
  20. Jo, J.; Lee, S.J.; Jung, H.G.; Park, K.R.; Kim, J. Vision-based method for detecting driver drowsiness and distraction in driver monitoring system. Opt. Eng. 2011, 50, 127202. [Google Scholar] [CrossRef]
  21. Grace, R.; Byrne, V.E.; Bierman, D.M.; Legrand, J.M.; Gricourt, D.; Davis, B.K.; Staszewski, J.J.; Carnahan, B. A drowsy driver detection system for heavy vehicles. In Proceedings of the 17th DASC. AIAA/IEEE/SAE. Digital Avionics Systems Conference. Proceedings (Cat. No. 98CH36267), Bellevue, WA, USA, 31 October–7 November 1998; IEEE: New York, NY, USA, 1998; Volume 2. [Google Scholar]
  22. Wang, J.; Wu, Z. Driver distraction detection via multi-scale domain adaptation network. IET Intell. Transp. Syst. 2023, 17, 1742–1751. [Google Scholar] [CrossRef]
  23. Wang, X.; Xu, R.; Zhang, S.; Zhuang, Y.; Wang, Y. Driver distraction detection based on vehicle dynamics using naturalistic driving data. Transp. Res. Part C Emerg. Technol. 2022, 136, 103561. [Google Scholar] [CrossRef]
  24. Aljohani, A.A. Real-time driver distraction recognition: A hybrid genetic deep network based approach. Alex. Eng. J. 2023, 66, 377–389. [Google Scholar] [CrossRef]
  25. Shen, H.Z.; Lin, H.Y. Driver distraction detection for daytime and nighttime with unpaired visible and infrared image translation. In Proceedings of the 2023 IEEE/RSJ International Conference on Intelligent Robots and Systems (IROS), Detroit, MI, USA, 1–5 October 2023; IEEE: New York, NY, USA, 2023. [Google Scholar]
  26. Zhang, X.; Sugano, Y.; Fritz, M.; Bulling, A. Mpiigaze: Real-world dataset and deep appearance-based gaze estimation. IEEE Trans. Pattern Anal. Mach. Intell. 2017, 41, 162–175. [Google Scholar] [CrossRef]
  27. Dubey, D.; Tomar, G.S. Image alignment in pose variations of human faces by using corner detection method and its application for PIFR system. Wirel. Pers. Commun. 2022, 124, 147–162. [Google Scholar] [CrossRef]
  28. Al-Nuimi, A.M.; Mohammed, G.J. Face direction estimation based on mediapipe landmarks. In Proceedings of the 2021 7th International Conference on Contemporary Information Technology and Mathematics (ICCITM), Mosul, Iraq, 25–26 August 2021; IEEE: New York, NY, USA, 2021. [Google Scholar]
  29. Hayami, T.; Matsunaga, K.; Shidoji, K.; Matsuki, Y. Detecting drowsiness while driving by measuring eye movement-a pilot study. In Proceedings of the IEEE 5th International Conference on Intelligent Transportation Systems, Singapore, 6 September 2002; IEEE: New York, NY, USA, 2002. [Google Scholar]
  30. Sommer, D.; Golz, M. Evaluation of PERCLOS based current fatigue monitoring technologies. In Proceedings of the 2010 Annual International Conference of the IEEE Engineering in Medicine and Biology, Buenos Aires, Argentina, 31 August–4 September 2010; IEEE: New York, NY, USA, 2010. [Google Scholar]
  31. Esling, P.; Agon, C. Time-series data mining. ACM Comput. Surv. 2012, 45, 1–34. [Google Scholar] [CrossRef]
  32. Bagnall, A.; Lines, J.; Bostrom, A.; Large, J.; Keogh, E. The great time series classification bake off: A review and experimental evaluation of recent algo-rithmic advances. Data Min. Knowl. Discov. 2017, 31, 606–660. [Google Scholar] [CrossRef] [PubMed]
  33. Tekin, N.; Aris, A.; Acar, A.; Uluagac, S.; Gungor, V.C. A review of on-device machine learning for IoT: An energy perspective. Ad Hoc Netw. 2023, 153, 103348. [Google Scholar] [CrossRef]
  34. Liao, Y.; Li, S.E.; Li, G.; Wang, W.; Cheng, B.; Chen, F. Detection of driver cognitive distraction: An SVM based real-time algorithm and its comparison study in typical driving scenarios. In Proceedings of the 2016 IEEE Intelligent Vehicles Symposium (IV), Gothenburg, Sweden, 19–22 June 2016; pp. 394–399. [Google Scholar]
  35. Li, Z.; Chen, L.; Nie, L.; Yang, S.X. A novel learning model of driver fatigue features representation for steering wheel angle. IEEE Trans. Veh. Technol. 2021, 71, 269–281. [Google Scholar] [CrossRef]
Figure 1. Workflow of driver inattention detection system.
Wevj 15 00400 g001
Figure 2. (a) Euler angles for head position estimation; (b) major facial landmarks for calculating Euler angles.
Wevj 15 00400 g002
Figure 3. The Gaze Estimation Data Extraction Process for Detecting Driver Inattention.
Wevj 15 00400 g003
Figure 4. Eye movement tracking points for calculating PERCLOS.
Wevj 15 00400 g004
Figure 5. Driving-related behavioral scenario points and data collection device.
Wevj 15 00400 g005
Figure 6. Distribution of gaze movement vector values by scenario.
Wevj 15 00400 g006
Figure 7. Scenario-specific gaze vector cluster distribution.
Wevj 15 00400 g007
Figure 8. Scatter plot of gaze movements vs. driving behavior.
Wevj 15 00400 g008
Figure 9. Correlation matrix of gaze vector values.
Wevj 15 00400 g009
Figure 10. Preprocessing of driver gaze data.
Wevj 15 00400 g010
Figure 11. Driver gaze time series data classification results.
Wevj 15 00400 g011
Figure 12. Gaze movement estimation model ROC curve by scenario.
Wevj 15 00400 g012
Figure 13. CDIDM Accuracy Improvement Over Time.
Wevj 15 00400 g013
Table 1. Driver state detection requirements for DMS evaluation.
Inattention TypesDistraction ScenariosCriteria
DistractionLong DistractionAway from the forward road/non-driving taskWhen the gaze consistently fixates on a location other than the forward direction for more than three seconds
Short Distraction
(VATS)
Away from the forward road /non-driving taskWhen the gaze diverges for a cumulative duration of 10 s within a 30-s timeframe
Away from road
(multi-location)
FatigueDrowsinessKSS (Karolinska Sleepiness Scale) level > 7
MicrosleepWhen there is a blink duration of less than 3 s
SleepWhen there is sustained eye closure lasting more than 3 s
Unresponsive DriverWhen the gaze is averted from the forward direction or when the eyes are closed for more than 6 s
Table 2. Karolinska Sleepiness Scale (KSS).
LevelDescription
1Extremely alert
2Very alert
3Alert
4Rather alert
5Neither alert nor sleepy
6Some signs of sleepiness
7Sleepy, but no effort is required to stay awake
8Sleepy, but some effort is required to stay awake
9Very sleepy, great effort required to stay awake, fighting sleep
10Extremely sleepy and cannot stay awake
Table 3. Face tracking dataset for gaze estimation.
Automobile InformationDriver Information
TypeSegmentManufacturerModelGenderAgeHeight
(cm)
Weight
(kg)
SUVDKIASORRENTOMale4317468
SUVCKIANiroMale3717165
Truck1 tonKIABongo3Male4418282
SedanCHyundaiElantraFemale3016253
SedanCKIAK3Male4416862
SUVJHyundaiTucsonMale2617684
SedanFBMW720 dMale5217780
SUVJHyundaiTucsonFemale4016058
VanMKIACarnivalMale4117583
CompactAKIAMorningFemale3815661
Table 4. Facial Euler angles and iris position information for gaze estimation.
SeqPitchYawRollIris_LxIris_LyIris_RxIris_Ry
10.0761 −0.0562 −0.0248 575.2844 327.6482 654.3644 336.1082
20.0788 −0.0484 −0.0267 583.3813 324.1810 660.4034 333.9849
30.0769 −0.0465 −0.0343 589.4077 321.4966 664.8054 332.6090
40.0798 −0.0394 −0.0304 593.2281 319.6493 667.5866 331.8580
50.0604 −0.0697 −0.0244 595.3186 318.7085 669.1718 331.6109
60.0540 −0.0439 −0.0273 596.2318 318.4063 669.9681 331.7222
70.0722 −0.0409 −0.0347 596.6299 318.4297 670.4521 331.8593
80.0616 −0.0389 −0.0263 596.8526 318.5858 670.6852 331.9431
90.0614 −0.0466 −0.0285 596.7946 318.7040 670.8551 331.9021
100.0652−0.0356−0.0300596.7021318.6856670.9465331.7718
Table 5. Eye tracking and gaze estimation coordinate value data.
SeqGaze_LxGaze_LyGaze_RxGaze_Ry
1575.28 327.65 654.36 336.11
2583.38 324.18 660.40 333.98
3589.41 321.50 664.81 332.61
4593.23 319.65 667.59 331.86
5595.32 318.71 669.17 331.61
6596.23 318.41 669.97 331.72
7596.63 318.43 670.45 331.86
8596.85 318.59 670.69 331.94
9596.79 318.70 670.86 331.90
10596.70 318.69 670.95 331.77
Table 6. Nummerical Encoding of Gaze Data Using Projected Vectors on a Pixel-Based Grid System.
SeqVector_LxVector_LyVector_RxVector_RySUM_xSUM_yGridValueNORM
149166−21115−20226,935 0.812
265−882−35147−43209,766 0.738
376−1482−45158−59197,822 0.686
479−2280−53159−75185,878 0.634
582−2878−56160−84179,160 0.605
682−3082−55164−85178,413 0.602
783−3085−53168−83179,906 0.608
883−2693−49176−75185,878 0.634
984−2297−43181−65193,343 0.667
182−21102−45184−66192,597 0.663
Table 7. Variance ratios of Principal Component Analysis results.
Eigen VectorExplained VarianceExplained Variance Ratio
S1[−0.97133103, −0.23773099]736.92429050.93258419
S2[0.75592334, −0.65466014]1067.506323380.92779933
S3[−0.55115528, 0.8344027 ]1954.739976710.94382174
S4[0.21681727, −0.97621221]587.619890580.91274915
S5[0.98644338, 0.16410198]883.0089340.83827288
S6[0.97293209, −0.23109122]1431.985547550.85216792
Table 8. Inattention Classification Results by Scenario and Driver.
DriverAmountS1S2S3S4S5S6AVG
Driver1261099989495979997
Drvier2191497959394969595
Driver387096929091939092
Driver4113097939192949493
Driver5103193979596959795
Driver6101694969897959695
Driver796593949695939293
Driver8118596959798969895
Driver990492949395929193
Driver10102393969495949395
AVG98949292959594
Table 9. Comparison of accuracy in driver negligence classification models.
RemarksAccuracy
Customized Gaze Estimation Model (CDIDM)97%
EEG signal analysis [3]98%
EEG headband and smartwatch [10]84%
Gaze estimation (PERCLOS) [15]98%
Driving performance and eye movement [34]93%
Steering wheel sensor and speed [35]98%
Disclaimer/Publisher’s Note: The statements, opinions and data contained in all publications are solely those of the individual author(s) and contributor(s) and not of MDPI and/or the editor(s). MDPI and/or the editor(s) disclaim responsibility for any injury to people or property resulting from any ideas, methods, instructions or products referred to in the content.