Abstract
This study investigates the impacts of autonomous vehicles (AVs) on the insurance industry from the viewpoint of insurance companies, highlighting the necessity for adaptation due to technological advancements. The research is motivated by the gap in understanding between traditional insurers and automaker-backed insurance services regarding AV implications. The purpose is to identify potential impacts, evaluate the level of concern among diverse insurance companies, and examine their differing perspectives. The methodology includes a literature review, the Analytic Hierarchy Process (AHP), and Spearman correlation analysis. The literature review clarifies the definition of AVs and their impacts on traditional insurance. The AHP assesses the level of concern among insurance companies, and Spearman correlation analysis explores the similarities and differences in perspectives. The findings show that insurance companies largely agree on the transformative impacts of AVs. The primary effects are in “Updates in Insurance Business Operations” and the “Emergence of New Risks”, with less impact on “Changes in the Insurance Market”. A major concern is the complexity of multi-party liability claims. Companies differ in their focus on specific impacts like legal frameworks or system malfunctions, but share concerns about multi-party liability, system malfunctions, and legal gaps. The study anticipates minor impacts on market dynamics and traditional insurance models. The conclusions emphasize that AVs will significantly impact the insurance industry, requiring innovation and adaptation to maintain competitiveness. This includes developing new products, optimizing processes, and collaborating with stakeholders. The study has several implications: customized insurance products, optimized no-fault claims processes, collaborations with automakers and tech firms, data-driven risk assessments, enhanced risk management, and adapting traditional models. Recommendations include building loss experience databases, adopting no-fault insurance, strategic partnerships, developing customized products, strengthening risk management and cybersecurity, monitoring regulations, adjusting traditional models, focusing on product liability insurance, and training professionals.
1. Introduction
The rapid growth of internet technology and innovations like 5G connectivity, cloud computing, and edge processing have reshaped the automotive industry. These advancements have enabled revolutionary changes in manufacturing and vehicle capabilities [1,2]. Coupled with automation, artificial intelligence (AI), and machine learning, they have transformed AVs into dynamic platforms equipped with real-time data analytics, advanced sensor fusion, and vehicle-to-everything (V2X) communication systems [3,4].
As autonomous driving technologies advance, they align seamlessly with the growing adoption of electric vehicles (EVs). With simplified powertrain systems, superior energy efficiency, and compatibility with electronic controls, EVs provide an ideal platform for autonomy [5]. These synergies allow for features like optimized route planning, energy recovery, and enhanced driving ranges, amplifying the environmental and economic benefits of autonomous electric vehicles (AEVs) [6]. Furthermore, global decarbonization policies and the planned phase-out of internal combustion engines support the transition to AEVs, which is further demonstrated by companies like Tesla and Waymo leading the charge [7,8].
The integration of autonomous technologies and electrification brings significant societal benefits. These include reductions in traffic accidents, urban congestion, and carbon emissions, alongside improvements in mobility and air quality [9]. By enhancing urban mobility solutions, particularly in smart cities and shared transportation systems, AEVs are poised to transform logistics and redefine urban landscapes. Major investments by companies such as Tesla, BMW, Google, and Amazon further reinforce this trajectory toward a decarbonized and intelligent transportation future.
This transformative potential is reflected in the rapid growth and adoption of autonomous vehicle technologies, as highlighted by market projections. Table 1 and Table 2 illustrate the substantial growth in the Global Autonomous Vehicle Market, with market size expected to surge from $1500.3 billion in 2022 to $13,632.4 billion by 2030, and a compound annual growth rate (CAGR) of 20.52% forecasted by 2028. These figures underscore the pivotal role of autonomous vehicles in shaping the future of sustainable and intelligent transportation systems.

Table 1.
Autonomous Vehicle Market Size, data source from Ref [10].
Table 2.
Global Autonomous Vehicle Market, data source from Ref [11].
Autonomous vehicles, often described as “wheeled AI robots”, achieve self-driving capabilities through sophisticated onboard systems that integrate AI, advanced control architectures, and cutting-edge sensor technologies [12]. These systems combine data from LiDAR, radar, GPS, visual sensors, and other technologies to assess their surroundings and make real-time decisions [3,13]. By analyzing road conditions, traffic signals, and potential obstacles, AVs deliver precise control over steering, acceleration, and braking, creating a dynamic and adaptive driving experience.
The automotive industry’s integration of advanced technologies is not only redefining vehicle design and functionality, but also transforming related ecosystems like insurance. As transportation becomes smarter and safer, traditional auto insurance models face significant challenges, pushing automakers to innovate in addressing risk and coverage. In response, several major automakers have developed proprietary insurance services tailored to their vehicles’ unique features, using in-house data and technology to provide customized solutions.
Tesla has introduced Tesla Insurance, a service designed to offer rates that reflect the specific safety features and repair costs of its vehicles. By utilizing real-time data from its cars, Tesla assesses driving behavior to provide personalized premiums. This ensures that rates align with the safety capabilities of its vehicles and the habits of individual drivers. As of 2023, Tesla Insurance operates in multiple U.S. states, including Arizona, California, Colorado, Illinois, Maryland, Minnesota, Nevada, Ohio, Oregon, Texas, Utah, and Virginia [14].
General Motors has followed suit with the launch of OnStar Insurance Services, leveraging its OnStar telematics system to offer insurance products. By analyzing vehicle data and driving behavior, GM provides personalized insurance rates aimed at promoting safer driving habits. The initial rollout began with GM employees in Arizona, with plans to expand further [15].
In Asia, Toyota has launched Toyota Auto Insurance through its exclusive agency, Toyota Insurance Management Solutions (TIMS). This service offers coverage tailored specifically to Toyota vehicles, integrating benefits like Toyota Care Roadside Assistance and ensuring the use of Toyota Genuine Parts for repairs. Initially introduced in selected U.S. states, the program has plans for further expansion [16] (PYMNTS, 2021).
These developments demonstrate how automakers are reshaping insurance models by utilizing their technological capabilities and vehicle data. By aligning coverage with the unique attributes of their vehicles and evolving customer expectations, automakers are playing a pivotal role in defining the future of insurance in an era of smarter, safer mobility.
While automotive manufacturers and system suppliers have been preparing for AV technology and several major automakers have developed proprietary insurance services tailored to their vehicles’ unique characteristics, many traditional insurers have been slow to conduct in-depth research on the potential changes and impacts AVs may bring to the insurance industry [17]. Similarly, the finance and insurance sectors in Taiwan have yet to fully mature in their understanding and development of financial technology topics. There is a scarcity of advanced financial or insurance technology case studies and research, particularly those integrating information and communication technology, the Internet of Things, artificial intelligence, and big data, all of which are integral to AVs [18].
Therefore, the cognitive gap in understanding the impact of introducing autonomous vehicles between traditional insurance companies and automaker-backed insurance services underscores the necessity and motivation for this study.
In order to explore the potential impacts of autonomous vehicles on the insurance business and understand the perspectives of insurance companies with different backgrounds, this study’s objectives are as follows:
- To identify the potential impacts of autonomous vehicles on the insurance business;
- To evaluate the level of concern among insurance companies with different backgrounds regarding these impacts;
- To examine the similarities and differences in perspectives among insurance companies with different backgrounds regarding these impacts.
2. Literature Review
Based on the research objectives, the literature review focuses on clarifying the definition of AVs, followed by an exploration of their impacts on the traditional automobile insurance business from the perspectives of major automakers.
2.1. What Are Autonomous Vehicles
According to a 2023 report by the China Insurance Technology Development White Paper, the terms “autonomous driving” and “driverless driving” are often confused. The key distinction lies in the degree of human involvement. Passengers in a driverless vehicle merely sit inside without worrying about driving, as the vehicle “drives itself” to the destination. Conversely, an autonomous vehicle can take over driving tasks, but may return control to the driver when necessary [19]. The National Highway Traffic Safety Administration (NHTSA) and the Society of Automotive Engineers (SAE) categorize autonomous driving into five levels:
- Level 1—Vehicles perform minor maneuvers like acceleration, but the driver remains in control;
- Level 2—Vehicles can undertake safety actions autonomously, but the driver must remain alert;
- Level 3—Vehicles handle driving tasks in specific conditions, but may hand control back to the driver;
- Level 4—Vehicles can drive autonomously most of the time, except in unmapped areas or severe weather;
- Level 5—Fully autonomous driving with no human intervention, i.e., driverless.
In practical terms, discussions about autonomous vehicles typically refer to Level 3 or Level 4, while driverless vehicles correspond to Level 5 [20]. Thus, autonomous vehicles are not necessarily driverless. Broadly, driverless vehicles can be considered a subset of Level 5 autonomous vehicles.
2.2. Impact on the Traditional Insurance Business
The widespread adoption of autonomous vehicles (AVs) is poised to fundamentally reshape the automotive and insurance industries. According to actuarial estimates from KPMG, automobile accident rates in the United States are expected to decline by 80% by 2040. This substantial reduction will result in fewer accidents, injuries, and property damage, driving a decline in revenue from traditional auto insurance premiums. Consequently, the personal auto insurance market is projected to shrink, with insurance revenues shifting toward product liability, commercial insurance, and cyber insurance for networked systems [21].
While accident rates will decrease, the advanced technology embedded in AVs will lead to higher repair costs compared to traditional vehicles. These repair expenses are initially expected to rise due to the complexity of AV systems, but may decrease over time as technology costs decline and repair processes become more efficient [22]. The high cost of owning an AV will emphasize the exclusivity of personal car ownership, which, combined with the increasing popularity of ridesharing and shared mobility services, is likely to reduce private vehicle ownership rates. This shift will further impact personal auto insurance revenues, though increased demand for shared mobility services and rental fleets may drive growth in commercial auto liability insurance [23,24,25].
Urban areas are expected to experience higher adoption rates of AVs and shared mobility services, while rural regions may remain reliant on privately owned vehicles. These regional differences will require insurers to tailor AV-related insurance products to meet varying market demands [26]. Additionally, as AVs shift accident liability from drivers to vehicle manufacturers, automakers are expected to take on greater responsibility for accidents involving their vehicles. This liability transition is prompting manufacturers to bundle insurance policies with AV purchases, integrating insurance costs into vehicle prices. Tesla has already adopted this model, offering lifetime, exclusive insurance as part of the purchase price of its new vehicles [27,28,29].
The rise of AVs presents a significant disruption for traditional auto insurers. Companies that fail to adapt quickly and flexibly may see their current business models become obsolete, potentially causing instability in the broader property insurance market [30]. Insurers must innovate and reevaluate their operations, including underwriting practices, claims processing, and premium structures. Liability determination will become more complex, extending beyond individual drivers to include vehicle manufacturers, technology suppliers, infrastructure providers, and other stakeholders in the AV ecosystem [31,32].
In the AV era, insurers must prioritize advanced data collection to identify responsible parties in accidents. For instance, Tokio Marine & Nichido Fire Insurance in Japan has implemented a no-fault insurance model for AVs, compensating policyholders first and then exercising subrogation rights to recover claims from liable parties [33]. Insurers will also need to adapt underwriting processes to address new variables, such as vehicle safety standards, cyberattack vulnerabilities, and the reliability of satellite imagery in different regions [34]. The lack of historical data for AVs poses additional challenges in estimating loss probabilities and setting appropriate premiums [35].
Product liability insurance is expected to see significant growth as AV-related claims become a major component of total insurance losses. These claims may involve multiple stakeholders, including AV manufacturers, suppliers of critical technologies, and automobile dealerships [36,37]. Insurers must develop specialized policies and collaborate with manufacturers and other stakeholders to address these complexities effectively. Operational innovations, such as refined claims processes and adjusted premium structures, will be essential to meet the evolving risks associated with AVs [38,39].
In addition to reshaping the insurance market and operational practices, the adoption of AVs introduces new risks. These include potential system flaws or network malfunctions that could lead to accidents, as well as vulnerabilities to cyberattacks, which could result in vehicles being hijacked or stolen [40,41]. Other risks include sudden interruptions in satellite signals and accidents caused by outdated vehicle data [42]. Increased vehicle usage rates in shared mobility systems may also accelerate wear and tear, leading to more frequent mechanical failures and a higher likelihood of accidents [43].
The regulatory landscape poses additional challenges for AV-related insurance. Insurers and stakeholders have emphasized the need for comprehensive laws to address the unique risks and liabilities associated with AVs. However, the slow pace of legislative development may hinder the resolution of legal challenges arising from AV accidents [44].
From the perspective of major automakers, the shift in liability from drivers to manufacturers represents a significant transformation in the insurance landscape. Automakers are likely to play a more prominent role in the insurance market, developing bundled insurance solutions, integrating insurance costs into vehicle pricing, and collaborating with insurers to address new risks. This expanded responsibility will require automakers to innovate and adapt to their evolving roles in the era of autonomous vehicles.
Based on these developments, the widespread adoption of AVs is expected to fundamentally reshape the insurance market. Accident rates will decline significantly, reducing the demand for traditional personal auto insurance and driving a shift in revenue toward product liability and commercial and cyber insurance. Insurers will face challenges in liability determination, underwriting, and data collection, requiring operational overhauls and innovations. The growth of product liability insurance, along with the increasing involvement of automakers in the insurance landscape, highlights the need for collaboration and adaptation across the industry. As AV technology continues to evolve, insurers, manufacturers, and regulators must work together to address the opportunities and challenges presented by this transformative shift.
2.3. Impacts of Autonomous Vehicles on the Automobile Insurance Business from the Perspective of Major Automakers
The advent of AVs is poised to revolutionize not only transportation, but also the traditional automobile insurance market. Major automakers such as Toyota, Ford, General Motors (GM), BMW, Mercedes-Benz, Tesla, and Volkswagen have invested heavily in developing AV technology and establishing proprietary insurance services tailored to their vehicles’ unique characteristics [45,46]. Building on this study, a literature review is conducted to examine the potential impacts of AVs on the traditional automobile insurance market, the operational changes required for insurance businesses, and the new risks introduced by the widespread adoption of AVs, all analyzed from the perspectives of seven major automakers.
2.3.1. Potential Impacts of Autonomous Vehicles on the Traditional Automobile Insurance Market
The transition to AVs is expected to shift accident liability from individual drivers to automakers and AV software providers [47]. Mercedes-Benz’s acceptance of liability for its Level 3 and Level 4 autonomous systems exemplifies this shift, challenging traditional insurance models that primarily hold drivers accountable [48]. This change necessitates a reevaluation of personal auto insurance policies and promotes the growth of product liability insurance.
Autonomous vehicles are designed to minimize human error, which accounts for a significant proportion of traffic accidents [49]. Tesla’s data-driven safety improvements illustrate how AVs can enhance road safety and potentially lower insurance costs due to reduced accident frequencies [45]. As a result, traditional auto insurance premiums are expected to decline, impacting insurers’ revenue streams.
Automakers are leveraging in-house insurance services to capture a larger market share, bundling insurance with vehicle sales, particularly for electric and autonomous vehicles [50]. Volkswagen and Ford have integrated insurance products specifically designed for shared and fleet-based AVs, positioning themselves favorably in the evolving market [24].
The traditional actuarial models that rely on driver demographics and behavior are becoming less relevant in the context of AVs. Instead, underwriting will increasingly depend on the data related to vehicle performance and software reliability [51]. This shift forces insurers to adapt their risk assessment methodologies in order to remain competitive.
2.3.2. Changes in the Operations of Traditional Automobile Insurance Businesses Shifting to Fleet and Commercial Insurance
The rise of shared mobility and fleet ownership models, such as ride-hailing and delivery services, is increasing the demand for commercial insurance over individual policies [25]. Ford and GM have aligned their strategies with shared mobility services, focusing on fleet insurance to meet this emerging need [52].
Insurers must now rely on real-time data from AVs to assess risks accurately, necessitating partnerships with automakers who control vehicle telematics [53]. Tesla’s dynamic insurance model, which bases premiums on real-time driving data, highlights this paradigm shift [29].
The complexity of liability chains in AV accidents—encompassing hardware, software, and user factors—requires insurers to adopt new frameworks for claims management [54]. BMW and Toyota advocate for simplifying claims processes by ensuring access to robust and transparent vehicle performance data [33].
With a projected decrease in accidents and claims frequency, insurers may experience declining revenues from traditional auto insurance [55]. This financial pressure compels insurers to diversify into areas like cybersecurity insurance for networked systems in AVs.
2.3.3. New Cybersecurity Risks Introduced by the Widespread Adoption of Autonomous Vehicles
Autonomous systems, encompassing technologies like self-driving vehicles, maritime autonomous ships, and AI-enhanced robotics, face a complex array of risks that demand careful consideration. These risks can be categorized into technological, operational, regulatory, and ethical dimensions, each presenting distinct challenges that must be addressed to enable large-scale adoption and public trust. The following are some explanations for these risks.
The first one is technological risks: Autonomous systems are particularly susceptible to technological vulnerabilities such as hardware malfunctions, software bugs, and difficulties in detecting edge cases [56]. For instance, AVs face the risk of large-scale software failures or systemic issues across fleets, which could lead to widespread recalls and significant financial losses. These failures erode consumer trust and highlight the need for rigorous testing protocols, as emphasized by Volkswagen and GM [57]. Cybersecurity risks also persist, as AVs, being highly connected devices, are vulnerable to hacking and data breaches. Such vulnerabilities could result in the unauthorized control or theft of sensitive user information [53]. Tesla has implemented over-the-air updates to address these threats promptly, while other automakers acknowledge the persistent nature of cybersecurity challenges [29].
The second one is operational risks: Environmental uncertainties and system failures in high-stakes applications, such as maritime vessels and AVs, remain significant concerns (Lee et al., 2025) [58]. In the automotive sector, operational risks extend to the implementation of shared autonomous vehicle networks, where systemic issues could disrupt entire fleets [56]. Automakers offering in-house insurance, such as Tesla, face additional operational and reputational risks. Tesla’s experience with its in-house insurance model underscores the difficulty of maintaining service quality while simultaneously managing these risks [29].
The third one is ethical and regulatory risks: Complex ethical dilemmas also arise, such as how autonomous systems should prioritize safety in unavoidable accident scenarios. For AVs, these decisions, such as balancing the safety of passengers versus pedestrians, remain a significant challenge [57]. Companies like Toyota and BMW have invested in artificial intelligence ethics research to address these concerns, but acknowledge the challenges in resolving such issues fully [59]. Meanwhile, navigating the fragmented global regulatory landscape adds another layer of complexity, with automakers facing risks of non-compliance or deployment delays [38]. Mercedes-Benz’s success in securing Level 3 system approval in Germany demonstrates progress in this area, but other regions continue to present substantial hurdles [48].
The widespread adoption of autonomous systems introduces profound technological, operational, regulatory, and ethical risks. While major industry players such as Tesla, Toyota, and BMW are actively working to mitigate these risks, the path to large-scale implementation will require continued advancements in technology and robust regulatory frameworks in these transformative systems.
Autonomous systems, as described above, face significant risks across technological, operational, cybersecurity, regulatory, and ethical dimensions. These risks have a direct impact on accident rates and raise concerns about the large-scale deployment of these systems. Technological risks frequently result from hardware malfunctions and software vulnerabilities. For example, AVs in California reported 150 collisions over 5.7 million miles from July 2021 to May 2022, equating to 26.3 crashes per million miles traveled [60]. Furthermore, AVs struggle with edge cases, such as rare or complex scenarios, particularly in dynamic environments, leading to reduced reliability. Operational risks are linked to environmental uncertainties, including adverse weather and challenging terrains. Research from 2019 to 2022 identified significant limitations in the adaptability of autonomous systems to extreme conditions. These limitations underscore the need for improved sensor technologies and enhanced data processing capabilities to ensure better environmental responses and safety [61]. Cybersecurity vulnerabilities represent another critical area of concern for autonomous systems. Advanced Driver Assistance Systems (ADAS), widely integrated into autonomous technologies, are especially susceptible to cyberattacks. A study demonstrated that 83.4% of such attacks could successfully compromise safety-critical operations, highlighting the urgent need for robust cybersecurity protocols to prevent the malicious exploitation of system vulnerabilities [62]. Regulatory and ethical risks further complicate the adoption of autonomous systems by challenging liability determination and raising concerns about decision-making biases in AI systems. The fatal 2018 crash involving an Uber self-driving car exemplified these issues, showcasing difficulties in assigning accountability and addressing ethical challenges in autonomous decision-making. This incident highlighted the need for clear regulatory frameworks and ethical guidelines to facilitate the safe and responsible development of autonomous systems [63]. These risks collectively emphasize the need for a comprehensive and multidisciplinary approach to enhance the safety and reliability of autonomous systems. Technological advancements, strengthened cybersecurity measures, and regulatory clarity are essential to mitigating risks and fostering public trust in autonomous technologies.
3. Research Methodology
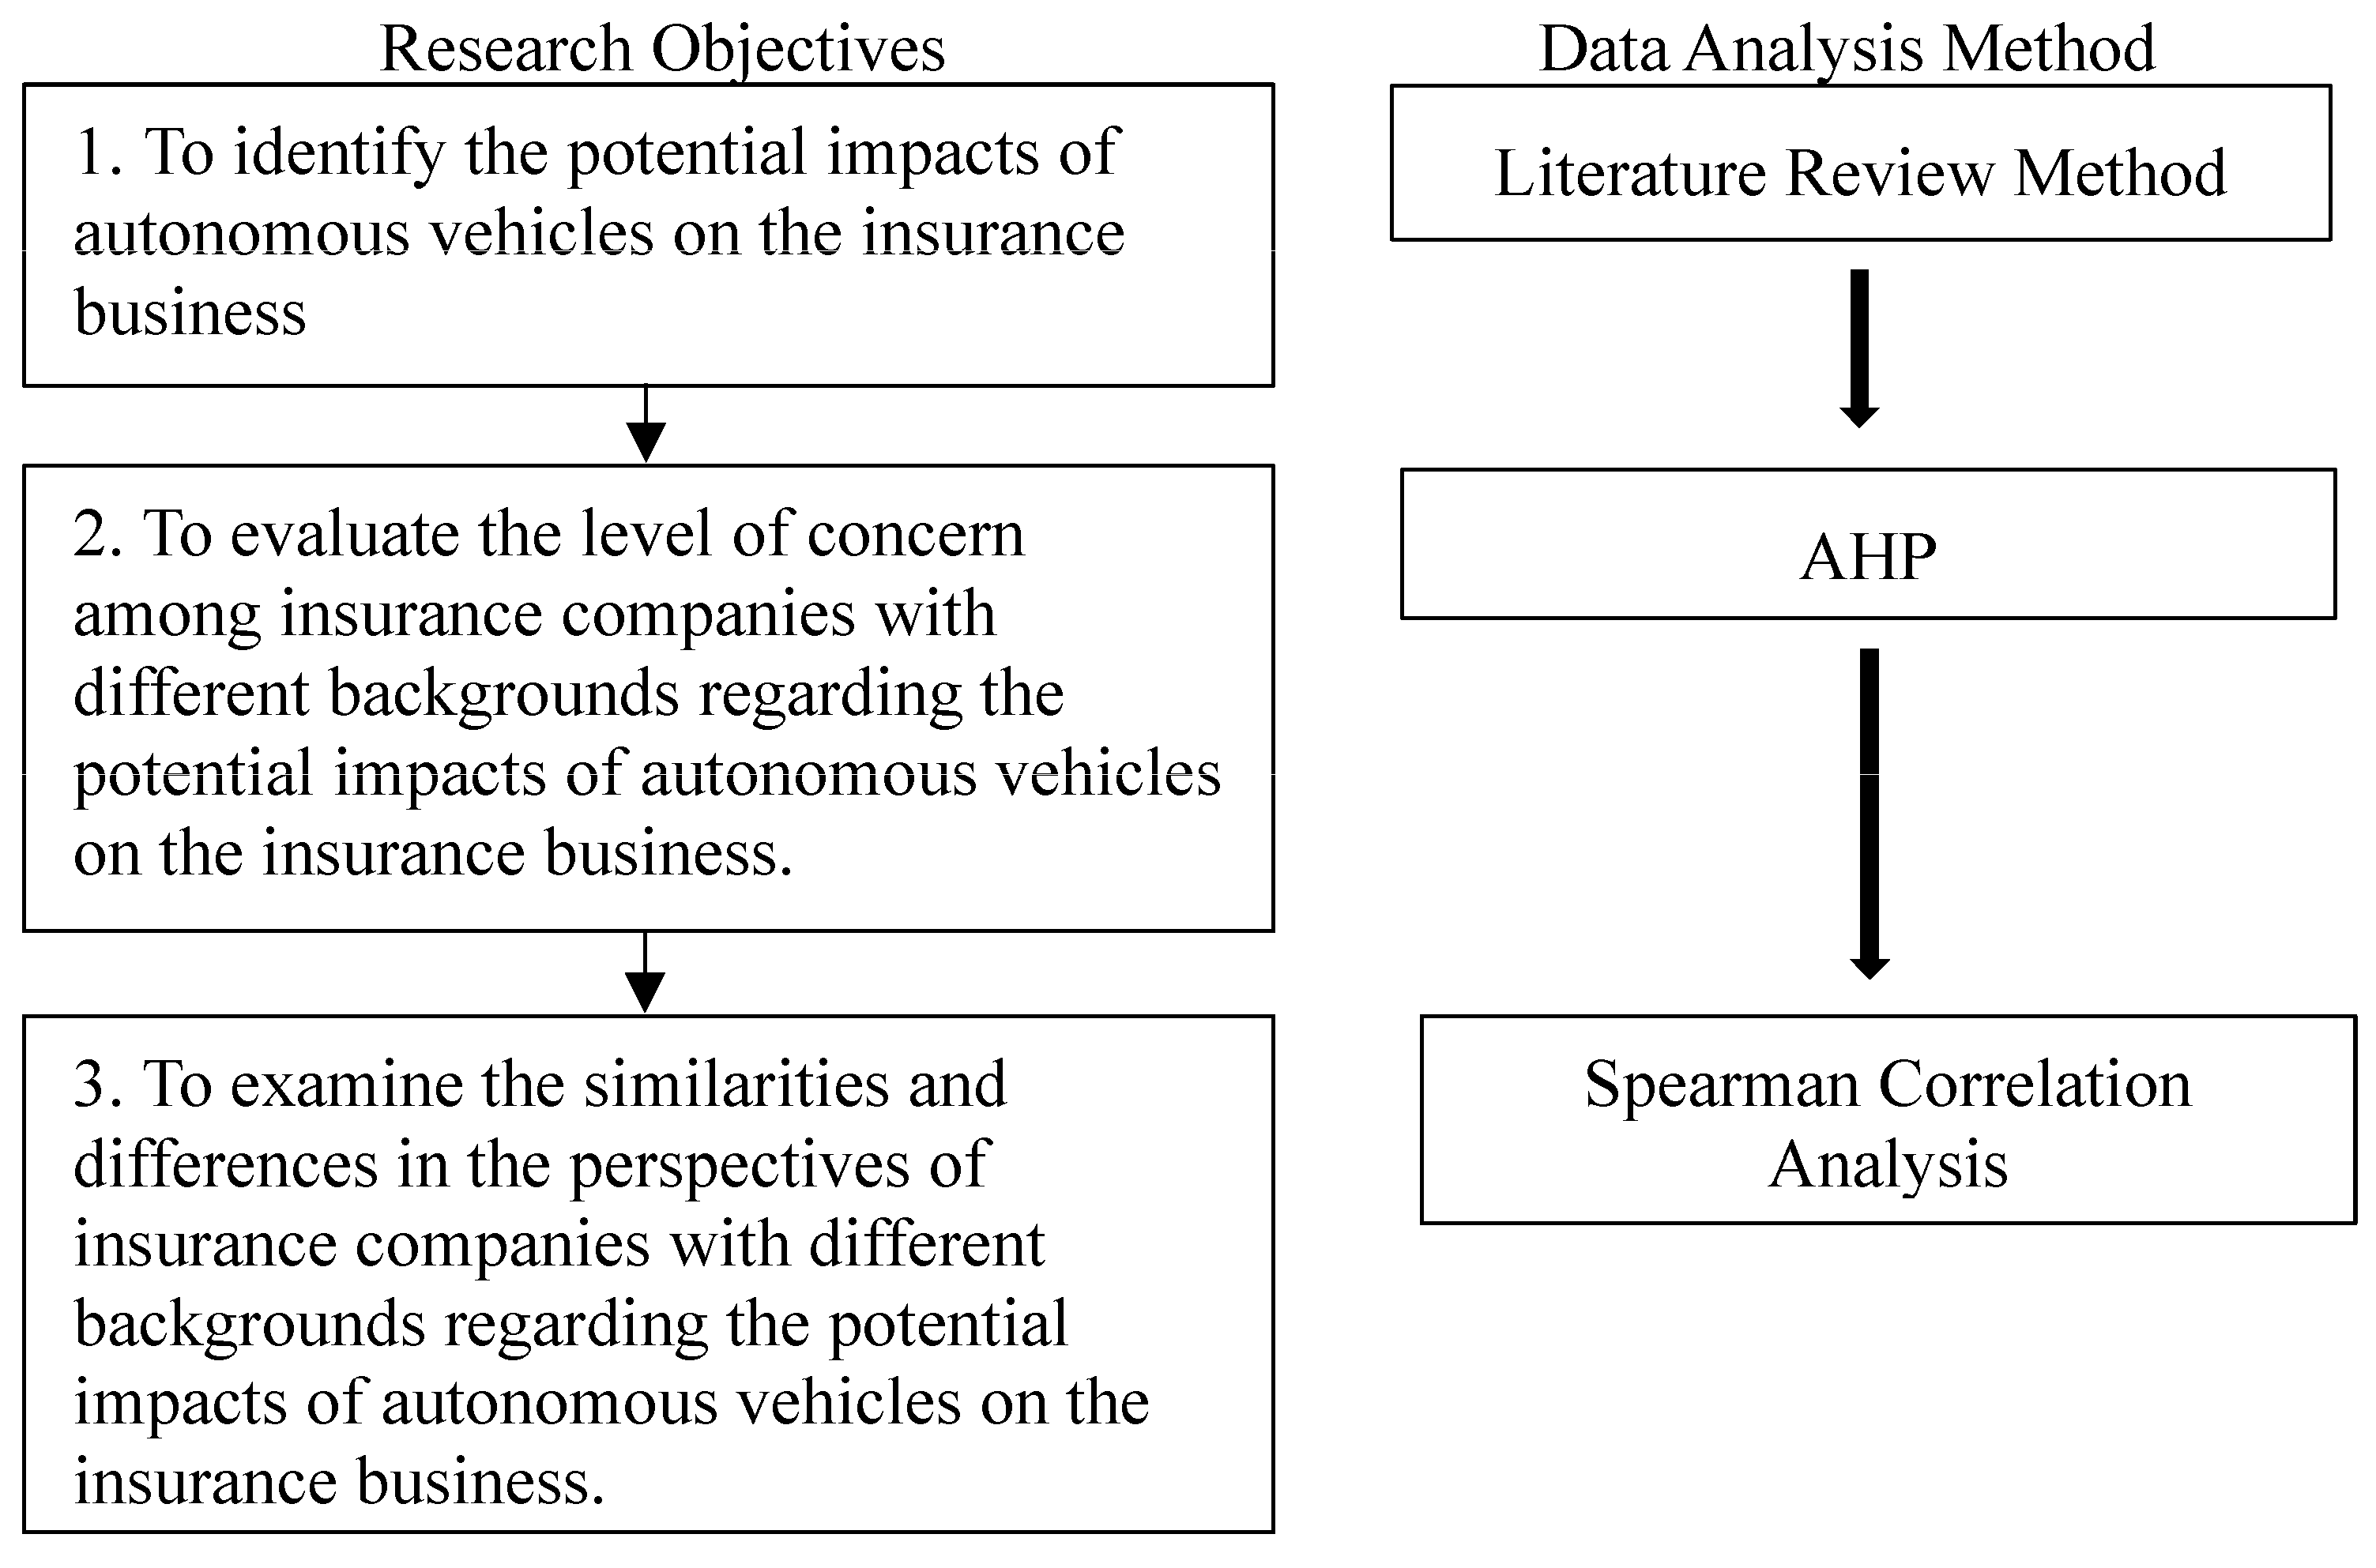
The research objectives and corresponding data analysis methods of this study are illustrated in Figure 1. Research Objective 1 is to identify the potential impacts of autonomous vehicles on the insurance industry. This objective will be analyzed using the literature review method. The literature review method is a research approach that involves examining and analyzing the existing academic literature to organize information and identify research directions. Research Objective 2 aims to assess the level of concern among insurance companies with different backgrounds regarding the potential impacts of autonomous vehicles on the insurance business. This objective will be evaluated using the Analytic Hierarchy Process (AHP). The AHP is a decision-making tool that breaks down complex problems into a hierarchical structure and uses weight calculations to evaluate the priorities of different options. Research Objective 3 seeks to examine the similarities and differences in perspectives among insurance companies with varying backgrounds regarding the potential impacts of autonomous vehicles on the insurance industry. This objective will utilize Spearman correlation analysis to explore these perspectives. Spearman correlation analysis is a statistical method used to measure the degree of rank correlation between two variables.

Figure 1.
The research objectives and data analysis methods.
Based on the literature review, this study identifies the potential impacts of autonomous vehicles on the insurance business and then develops the following AHP questions (please view Table 3).
Table 3.
Examples of questions from the AHP questionnaire.
The AHP is a decision-making method that decomposes a complex multicriteria decision problem into a hierarchy [64]. The AHP is also a measurement theory that prioritizes the hierarchy and consistency of judgmental data provided by a group of decision makers. The AHP incorporates the evaluations of all decision makers into a final decision, without having to elicit their utility functions on subjective and objective criteria, by pairwise comparisons of the alternatives [65]. The AHP steps are as follows:
- Step 1. Problem Definition and Objective Identification
Begin by defining the problem clearly and identifying the objective of the decision. This involves understanding the scope of the decision, the alternatives under consideration, and the criteria that influence the decision-making process (Saaty, 1990) [64].
- Step 2. Hierarchical Structuring of the Problem
Organize the decision problem into a hierarchy comprising:
- Goal: The ultimate objective or decision to be achieved;
- Criteria: Factors influencing the decision (e.g., cost, quality, and sustainability);
- Subcriteria: Optional subdivisions of criteria for detailed analysis;
- Alternatives: The options or solutions to be evaluated.
This hierarchical arrangement helps in simplifying complex decisions by breaking them into manageable parts [66].
- Step 3. Constructing Pairwise Comparison Matrices
For each level in the hierarchy, construct an n-by-n pairwise comparison matrix, where n is the number of elements (criteria, subcriteria, or alternatives). Each element in the matrix represents the relative importance of one factor compared to another, using Saaty’s 1–9 scale:
1: Equal importance;
3: Moderate importance;
5: Strong importance;
7: Very strong importance;
9: Extreme importance.
Reciprocals (): If aij is the importance of i over j, then aji = 1/aij ensures consistency.
- Step 4. Normalize the Matrix and Calculate Priority Weights
Normalize the matrix by dividing each element by the sum of its column. Then, compute the priority vector by averaging the rows of the normalized matrix. The priority vector represents the relative importance (or weight) of each criterion [67].
- Step 5. Consistency Verification
To ensure that the judgments are consistent, compute the Consistency Index (CI) and Consistency Ratio (CR):
- CI = λmax − n/n − 1, where λmax is the maximum eigenvalue of the matrix.
- CR = CI/RI, where RI is the Random Index based on the matrix size.
A CR < 0.1 indicates acceptable consistency; otherwise, comparisons should be reviewed and adjusted [64].
4. Research Results
Based on the previous studies on the “2.2 Impact on the Traditional Insurance Business” and the “2.3 Impacts of Autonomous Vehicles on the Automobile Insurance Business from the Perspective of Major Automakers”, this study presents the following potential impacts of autonomous vehicles on the insurance business:
- Changes in the Insurance Market: Key impacts such as shrinking premiums, high repair and claim costs, and the decline in private car ownership rates increased the demand for product liability insurance, integration of insurance costs into car prices, disruption of traditional insurance business models, and insurance companies focusing on different regions;
- Updates in Insurance Business Operations: Challenges include liability and risk assessment difficulties, challenges in clarifying responsibility, insurance companies bearing initial compensation responsibilities, increased difficulty in predicting loss opportunities, actuaries being required to consider new factors, Product Liability Insurance Claims Involving Multiple Parties, a higher proportion of product liability insurance premiums and losses, and major adjustments in underwriting, claims, or insurance product development;
- Emergence of New Risks: Risks and challenges from technology and systems include failures in network or autonomous driving systems, vehicle theft due to hacking, satellite system interruptions or malfunctions, accidents caused by outdated system updates, legal systems struggling to adapt to autonomous vehicle accident liability, and accelerated wear and tear on autonomous vehicles due to car-sharing models.
The AHP questionnaire was organized and developed based on the prior conclusion. This allows for an understanding of the perspectives of auto insurance professionals from insurance companies with different backgrounds regarding three key topics: (1) Changes in the Insurance Market, (2) Updates in Insurance Business Operations, and (3) Emergence of New Risks.
Subsequently, Spearman correlation analysis was conducted to examine which changes or impacts brought about by the emergence of autonomous vehicles on the auto insurance market, business operations, or risk were deemed more important by most auto insurance professionals, and which were relatively less significant. Furthermore, the analysis explored similarities and differences in perspectives among traditional auto insurance professionals from insurance companies with different backgrounds.
Both autonomous vehicles and auto insurance involve specialized knowledge, making it less suitable to collect data on related perceptions and attitudes through general market surveys. Therefore, this study adopted a purposive sampling method to distribute the questionnaires. To ensure representativeness among the respondents, the selected participants were drawn from three property insurance companies with a significant market share in Taiwan’s auto insurance market and a property insurance company with a background in automotive manufacturing investment.
According to the data from the 2023 Taiwan Financial Supervisory Commission’s Insurance Industry Public Information Observatory, the property and casualty insurance industry in Taiwan is shaped by three leading players, each with distinctive strategies and strengths that have contributed to their prominence in the market. Collectively, these top three insurers play a pivotal role in Taiwan’s property and casualty insurance landscape, offering a wide range of products and services to meet the diverse needs of policyholders. In Taiwan, there are two insurance companies with strong connections to the automotive manufacturing industry. One is a prominent property insurance provider that has direct ties to an automotive manufacturer. Originally established in 1961, this company underwent significant transformation in 2018 when it was acquired by the country’s largest automobile company and rebranded. This acquisition strategically integrated automotive manufacturing and insurance services, creating a seamless structure that supports both industries. The other company is a joint venture formed between a Japanese insurance group and a Taiwanese automotive manufacturer. Established in 1999 as part of a horizontal integration strategy, this company initially concentrated on motor and property insurance products. In 2002, a strategic alliance was formed with the Japanese partner, culminating in a merger in 2005 and a rebranding. This collaboration leverages the Taiwanese manufacturer’s expertise in automotive production and the Japanese group’s extensive insurance knowledge to deliver a broad range of insurance products and services.
Since AHP questionnaires are primarily distributed to experts, the number of distributed questionnaires is typically small [68,69]. The distribution quantity and target respondents of the questionnaires in this study are summarized in Table 4.
Table 4.
The distribution quantity and target audience of the questionnaire.
This study, based on a review of the literature, identifies 20 potential impacts that the widespread adoption of autonomous vehicles may have on the insurance business. These impacts are categorized under three main criteria to align with the requirements of the AHP [63]. The three main criteria are named Changes in The Insurance Market, Updates in Insurance Business Operation, and Emergence of New Risks. Each main criterion includes 6–7 subcriteria (refer to Figure 2). The AHP questionnaire was designed according to the hierarchical structure shown in Figure 2.

Figure 2.
The third large property insurance company’s level of concern regarding the potential impacts of autonomous vehicles on the insurance business.
The collected questionnaire data were analyzed using Expert Choice 2000. As shown in the data presented in Figure 2, respondents from the third property insurance company with a significant market share in Taiwan’s auto insurance market believe that autonomous vehicles will have the greatest impact on Updates in Insurance Business Operation (L = 0.394), followed by Emergence of New Risks (L = 0.362), with Changes in The Insurance Market having a relatively smaller impact (L = 0.244).
Furthermore, within the most impactful criterion, Insurance Business Updates, the subcriterion Product Liability Insurance Claims Involving Multiple Parties is considered the most significant (L = 0.227). Conversely, within the Insurance Market Changes criterion, the subcriterion Disruption of Insurance Business Models has the least impact (L = 0.062).
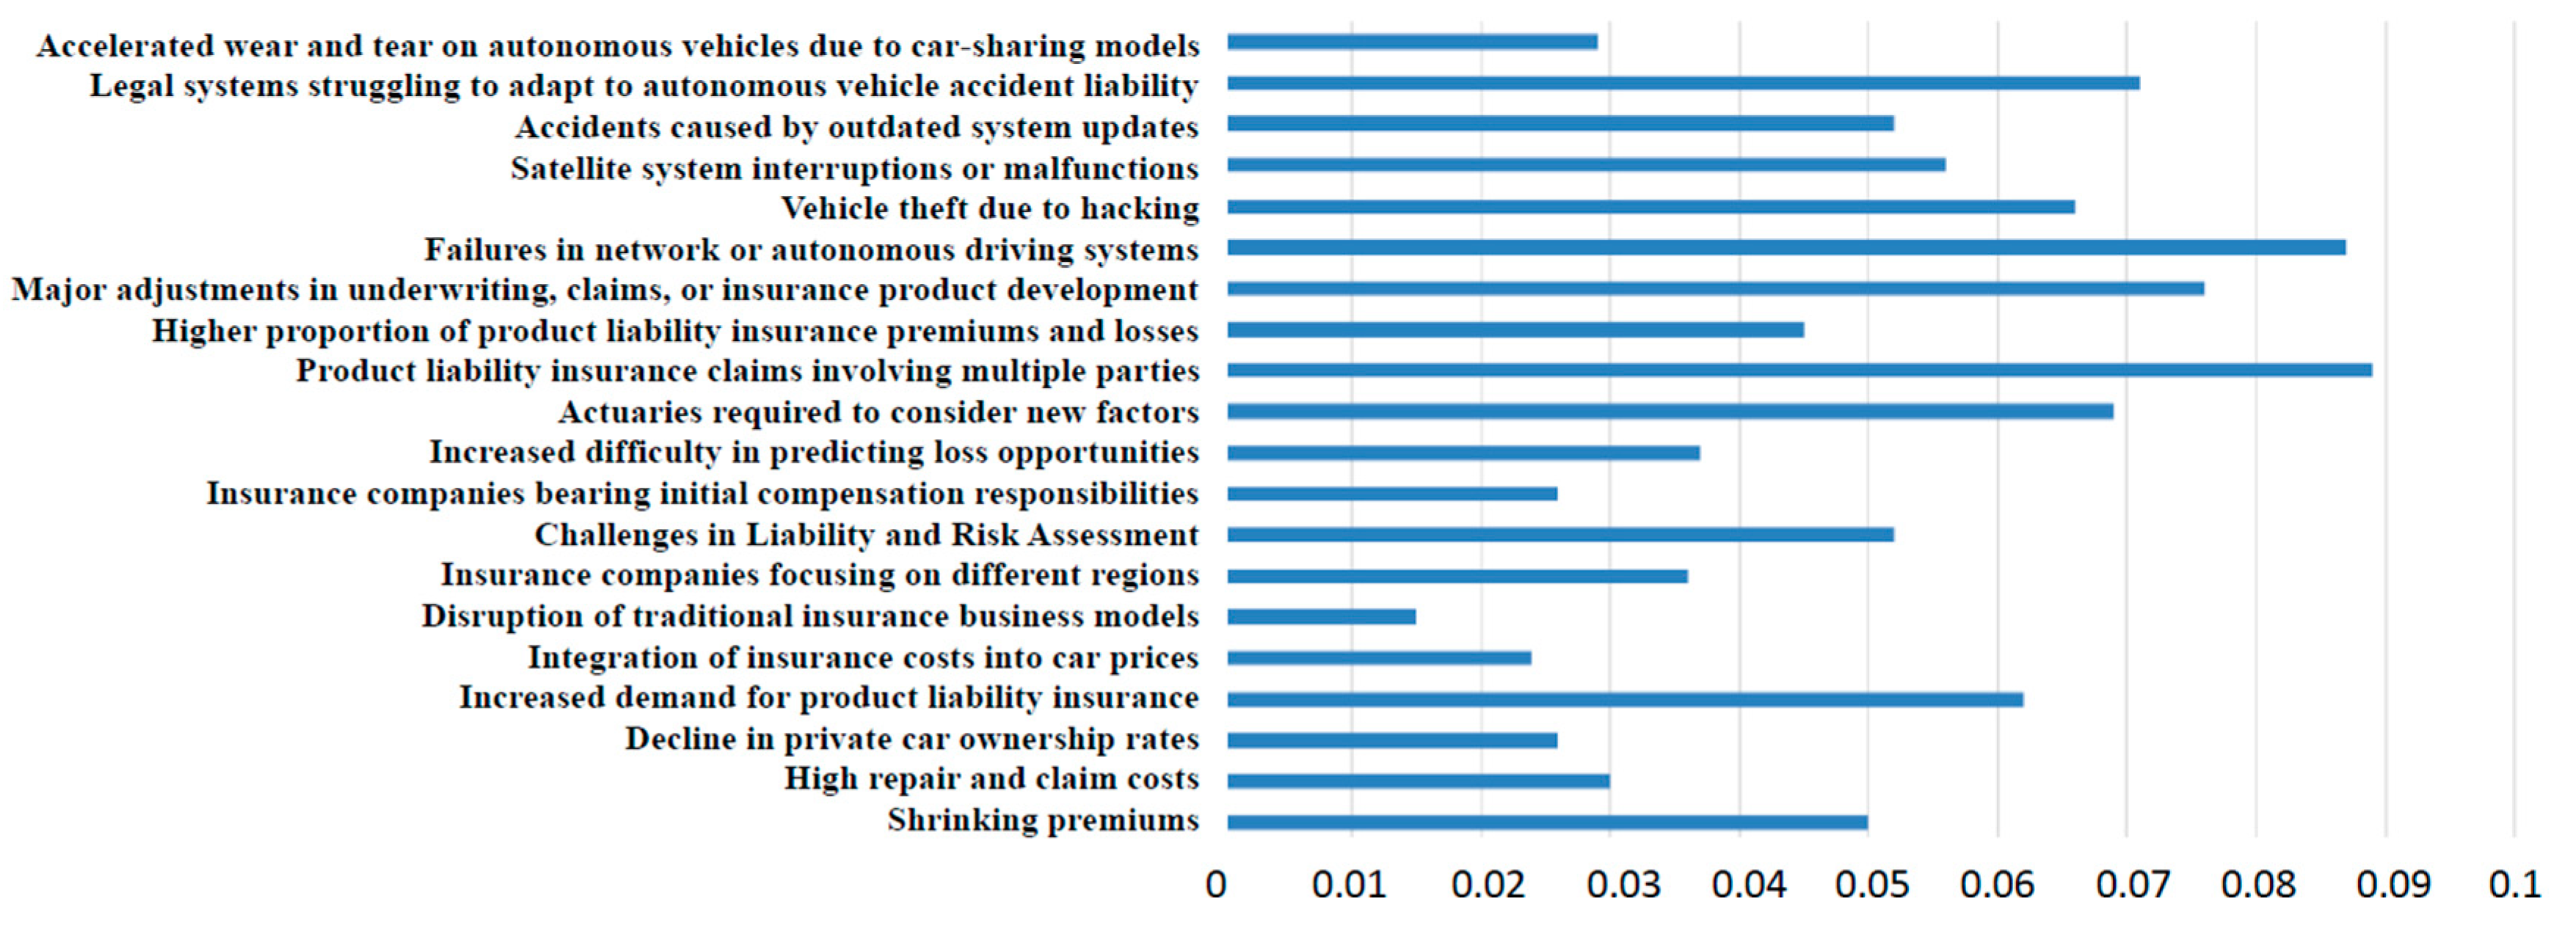
In Figure 3, the perceptions of respondents from the third property insurance company with a significant market share in Taiwan’s auto insurance market regarding the impact of 20 potential effects of autonomous vehicles on the insurance industry are clearly illustrated. The top three most impactful factors identified are “Product Liability Insurance Claims Involving Multiple Parties”, “Network System or Autonomous Driving System Malfunctions”, and “Major Adjustments in Underwriting, Claims, or Product Development”.
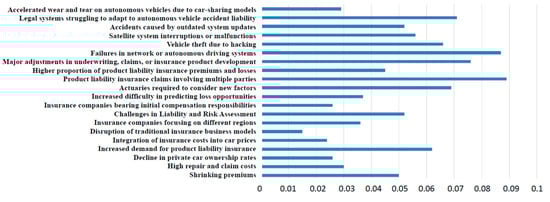
Figure 3.
The third large insurance company’s overall concern weights regarding the impact of autonomous vehicles on the insurance business.
Conversely, the respondents perceive the least impactful factors to be “Disruption of Insurance Business Models”, “Incorporation of Insurance Costs into Vehicle Prices”, “Decline in Private Vehicle Ownership Rates”, and “Insurance Companies Assuming Initial Compensation Responsibility”.
From the data presented in Figure 4, respondents from the first property insurance company with a significant market share in Taiwan’s auto insurance market believe that the impact of autonomous vehicles on the insurance industry is greatest in the “Emergence of New Risks” category (L = 0.394), followed by “Updates in Insurance Business Operation” (L = 0.362), with “Changes in The Insurance Market” having a relatively smaller impact (L = 0.244). Within the most impactful category, “Emergence of New Risks”, the subcriterion “Legal Frameworks May Struggle to Adapt to Accident Liability for Autonomous Vehicles” is considered the most significant (L = 0.280). On the other hand, within the “Changes in The Insurance Market” category, the subcriterion “Decline in Private Vehicle Ownership Rates” has the least impact (L = 0.081).
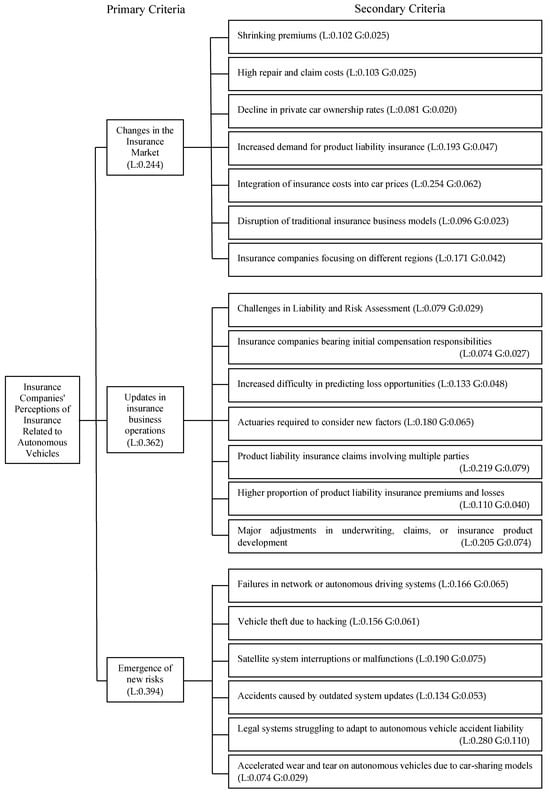
Figure 4.
The first large property insurance company’s level of concern regarding the potential impacts of autonomous vehicles on the insurance business.
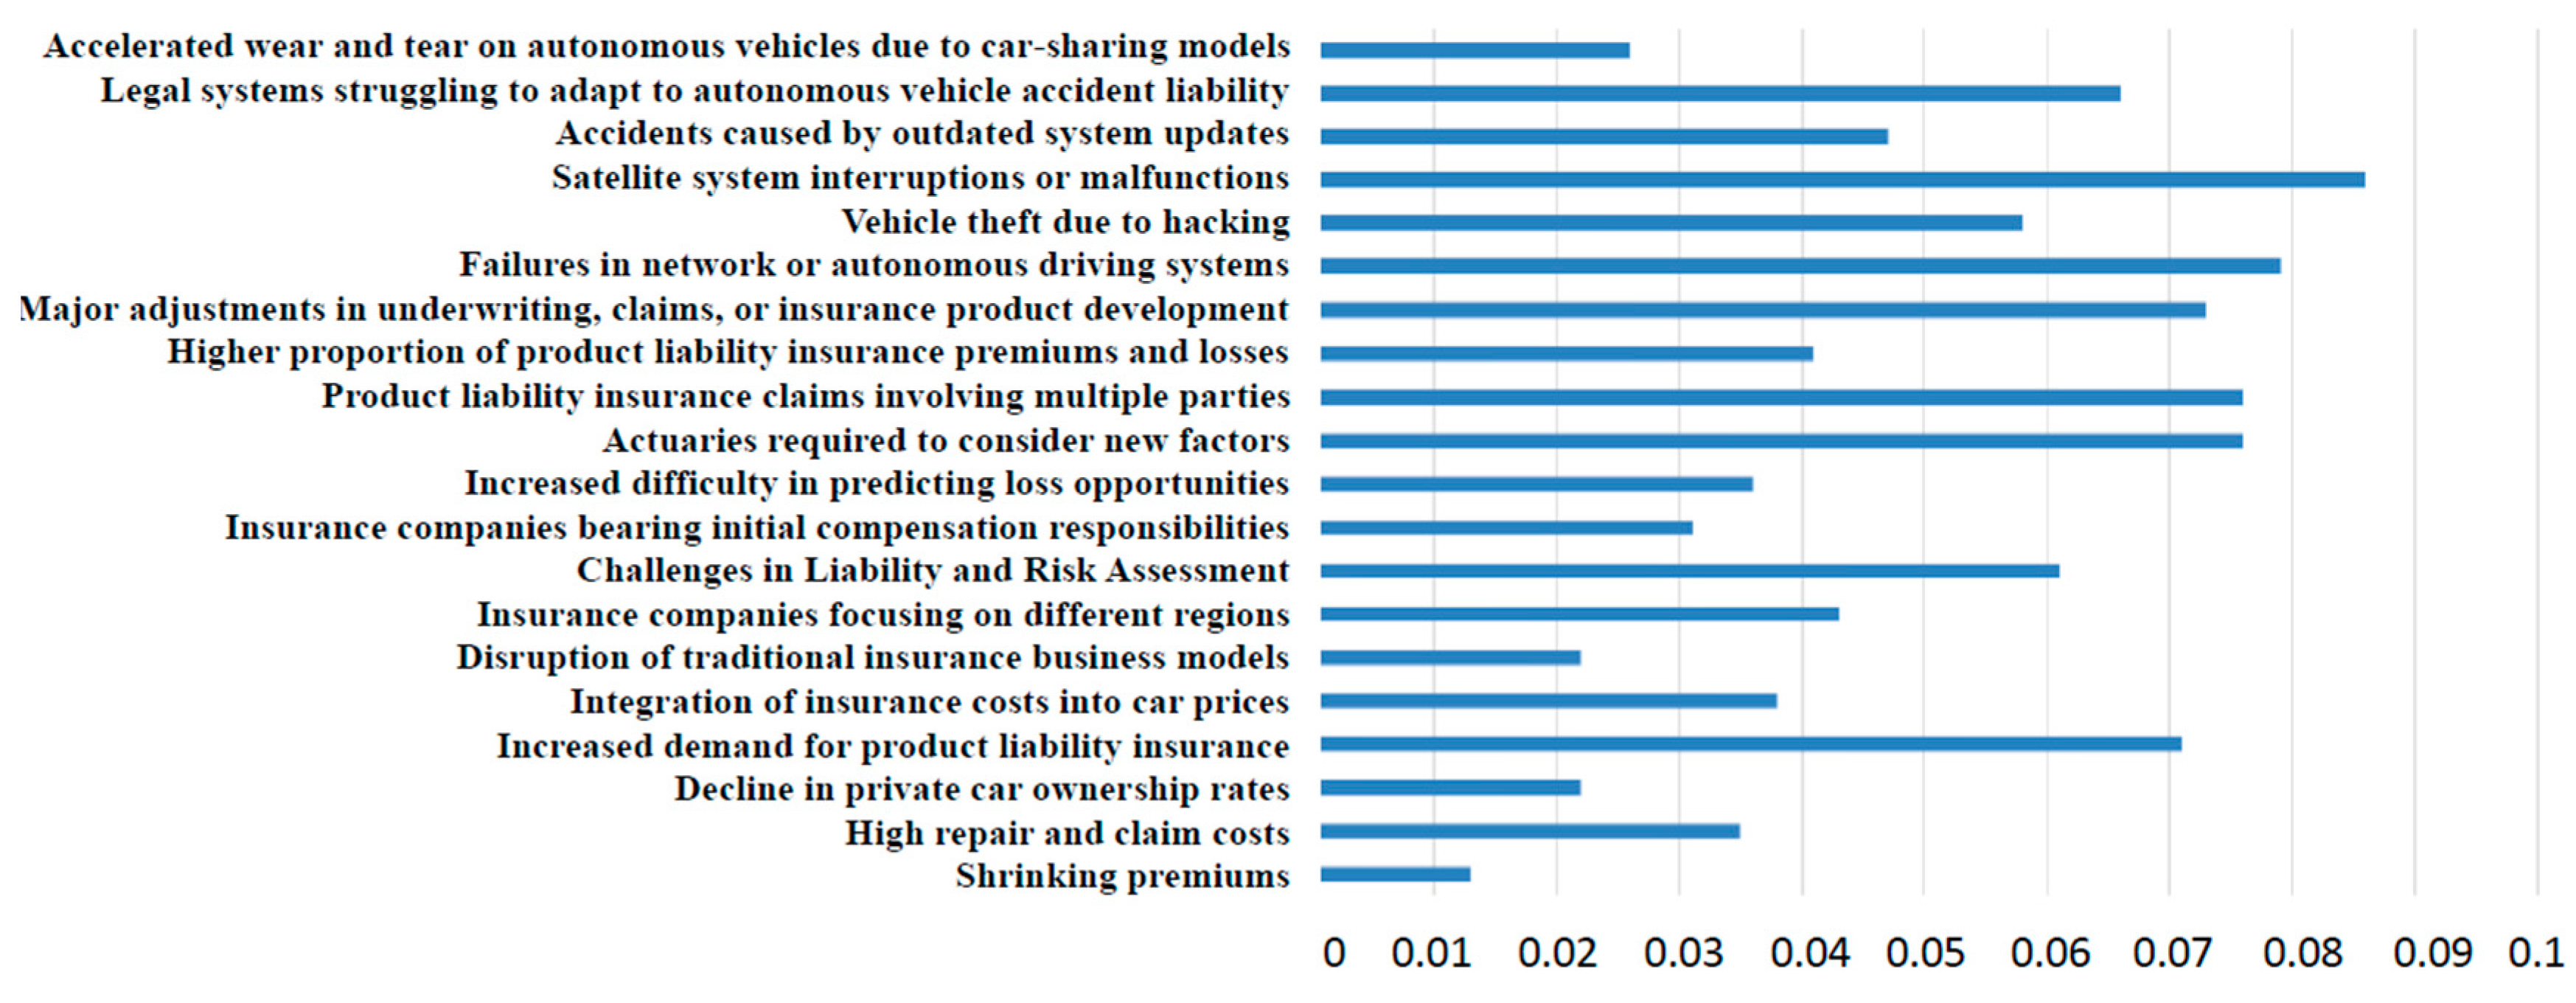
Figure 5 further clarifies the respondents’ perceptions of the 20 potential impacts of autonomous vehicles on the insurance industry. The top three most impactful factors identified are “Legal Frameworks May Struggle to Adapt to Accident Liability for Autonomous Vehicles”, “Product Liability Insurance Claims Involving Multiple Parties”, and “Satellite System Interruptions or Failures”. Conversely, the least impactful factors, as perceived by the respondents, are “Decline in Private Vehicle Ownership Rates”, “Disruption of Insurance Business Models”, “Reduction in Premium Revenue”, and “High Costs of Repairs and Claims”.
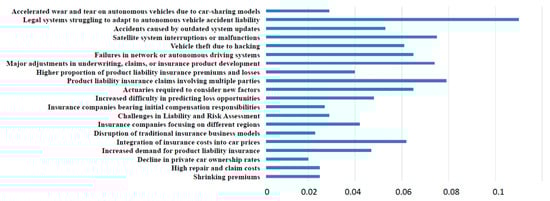
Figure 5.
The first large insurance company’s overall concern weights regarding the impact of autonomous vehicles on the insurance business.
From the data presented in Figure 6, respondents from a property insurance company with a background in automotive manufacturing investment believe that the impact of autonomous vehicles on the insurance industry is greatest in the “Updates in Insurance Business Operation “ category (L = 0.394), followed by “ Emergence of New Risks “ (L = 0.362), with “Changes in The Insurance Market” having a relatively smaller impact (L = 0.244). Within the most impactful category, “Updates in Insurance Business Operation”, the subcriteria “Product Liability Insurance Involving Multiple Parties” (L = 0.194) and “Actuaries Must Consider New Factors” (L = 0.194) are considered the most significant. Conversely, within the “Changes in The Insurance Market” category, the subcriterion “Reduction in Premium Revenue” (L = 0.054) has the least impact.

Figure 6.
The level of concern regarding the potential impacts of autonomous vehicles on the insurance business of property insurance companies with a background in automotive manufacturing investment.
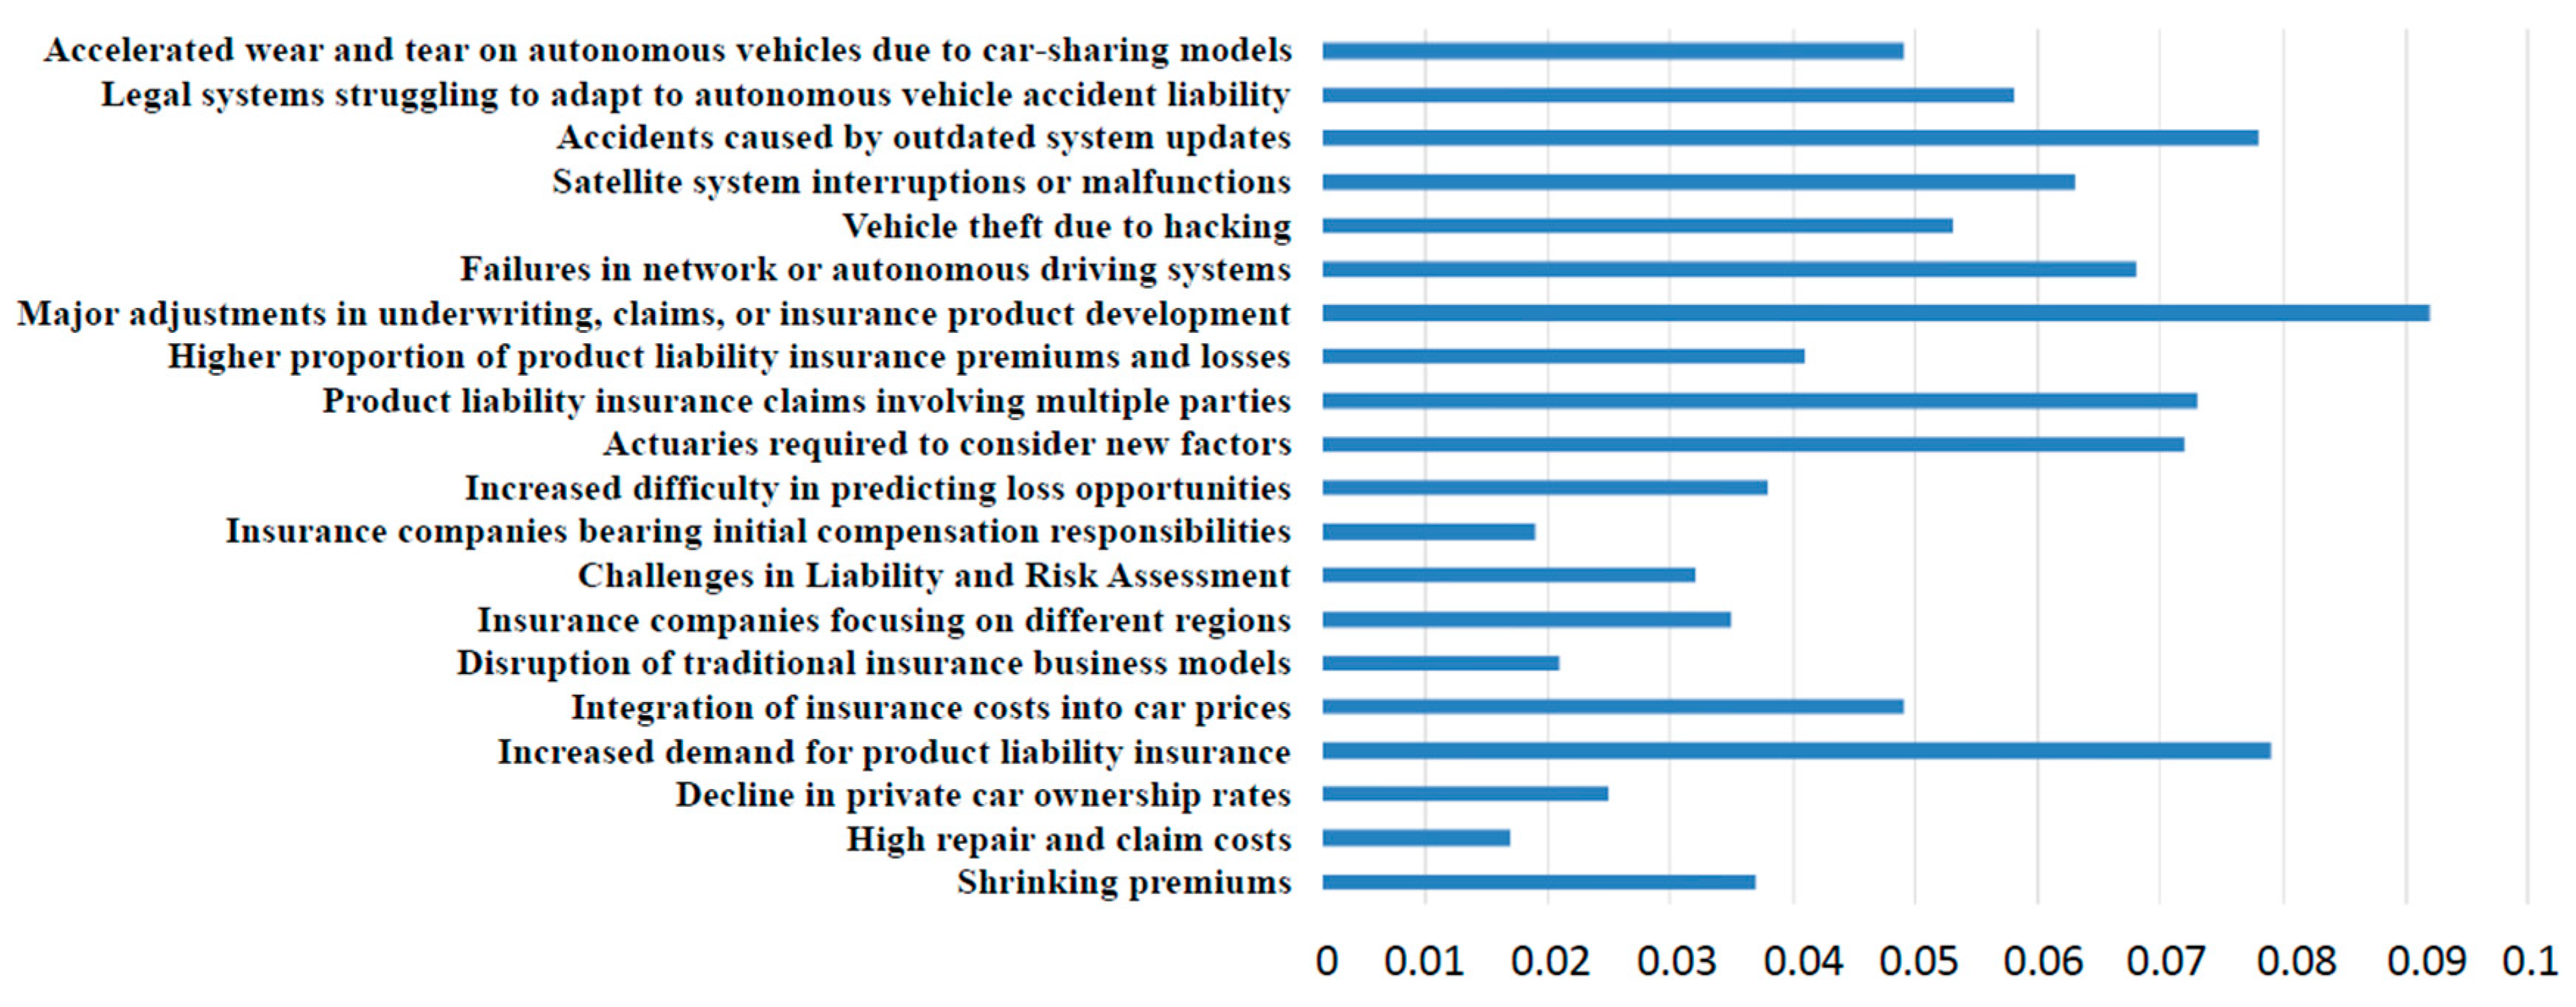
Figure 7 further highlights the respondents’ perceptions of the 20 potential impacts of autonomous vehicles on the insurance industry. The top four most impactful factors identified are “Satellite System Interruptions or Failures”, “Network or Autonomous Driving System Malfunctions”, “Product Liability Insurance Involving Multiple Parties”, and “Actuaries Must Consider New Factors”. Conversely, the least impactful factors, as perceived by the respondents, are “Reduction in Premium Revenue”, “Decline in Private Vehicle Ownership Rates”, and “Disruption of Insurance Business Models”.
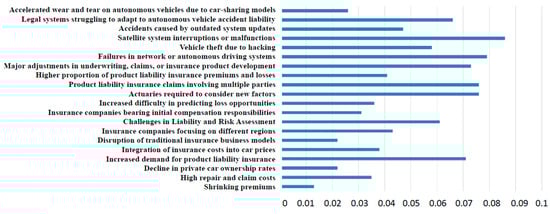
Figure 7.
Property insurance companies with a background in automotive manufacturing investments’ overall concern weights regarding the impact of autonomous vehicles on the insurance business.
From the data presented in Figure 8, respondents from the second property insurance company with a significant market share in Taiwan’s auto insurance market believe that the impact of autonomous vehicles on the insurance industry is most significant in the categories of “Updates in Insurance Business Operation” (L = 0.368) and “Emergence of New Risks” (L = 0.368), with “Changes in The Insurance Market” having a relatively smaller impact (L = 0.244). Within the highly impactful categories of “Updates in Insurance Business Operation” and “Emergence of New Risks”, the subcriteria “Major Adjustments in Underwriting, Claims, or Insurance Product Development” (L = 0.251) and “Accidents Caused by Outdated Systems” (L = 0.211) are identified as the most significant. Conversely, within the “Changes in The Insurance Market” category, the subcriterion “High Costs of Repairs and Claims” (L = 0.066) has the least impact.
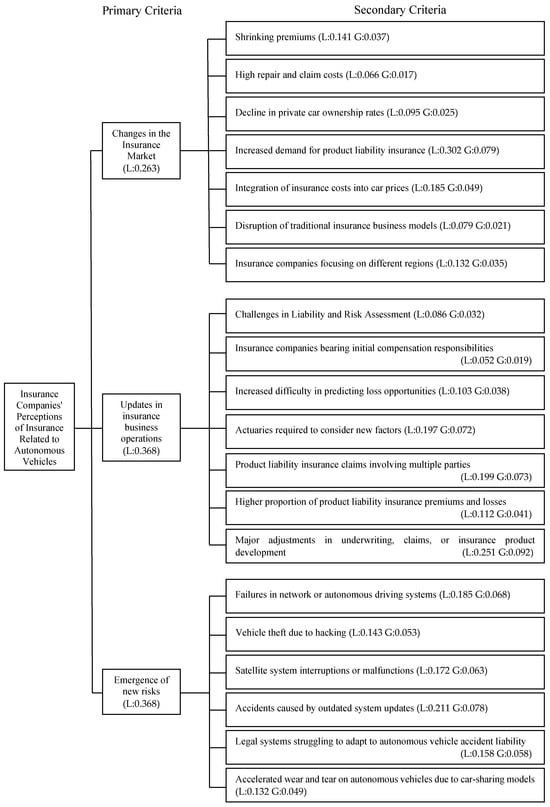
Figure 8.
The second large property insurance company’s level of concern regarding the potential impacts of autonomous vehicles on the insurance business.
Figure 9 further clarifies the respondents’ perceptions of the 20 potential impacts of autonomous vehicles on the insurance industry. The top four most impactful factors identified are “Major Adjustments in Underwriting, Claims, or Insurance Product Development”, “Increased Demand for Product Liability Insurance”, and “Accidents Caused by Outdated Systems”. Conversely, the least impactful factors, as perceived by the respondents, are “High Costs of Repairs and Claims”, “Insurance Companies Assuming Initial Compensation Responsibility”, and “Disruption of Insurance Business Models”.
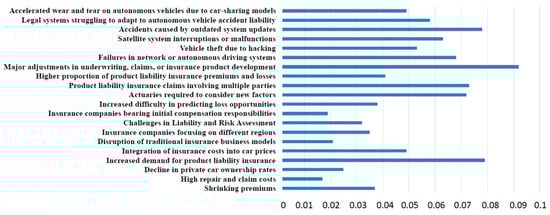
Figure 9.
The second large insurance company’s overall concern weights regarding the impact of autonomous vehicles on the insurance business.
The respondents in this study are primarily from Taiwan’s three largest non-life insurance companies, which hold a dominant market share in traditional auto insurance. Therefore, their perceptions and attitudes toward insurance related to autonomous vehicles are likely representative of mainstream perspectives. Another company is a non-life insurance company with financial backing from an automobile manufacturer in Taiwan. The collective views of these four entities can serve as a reference for all Taiwanese insurance companies in formulating strategies related to autonomous vehicle insurance in response to this emerging trend.
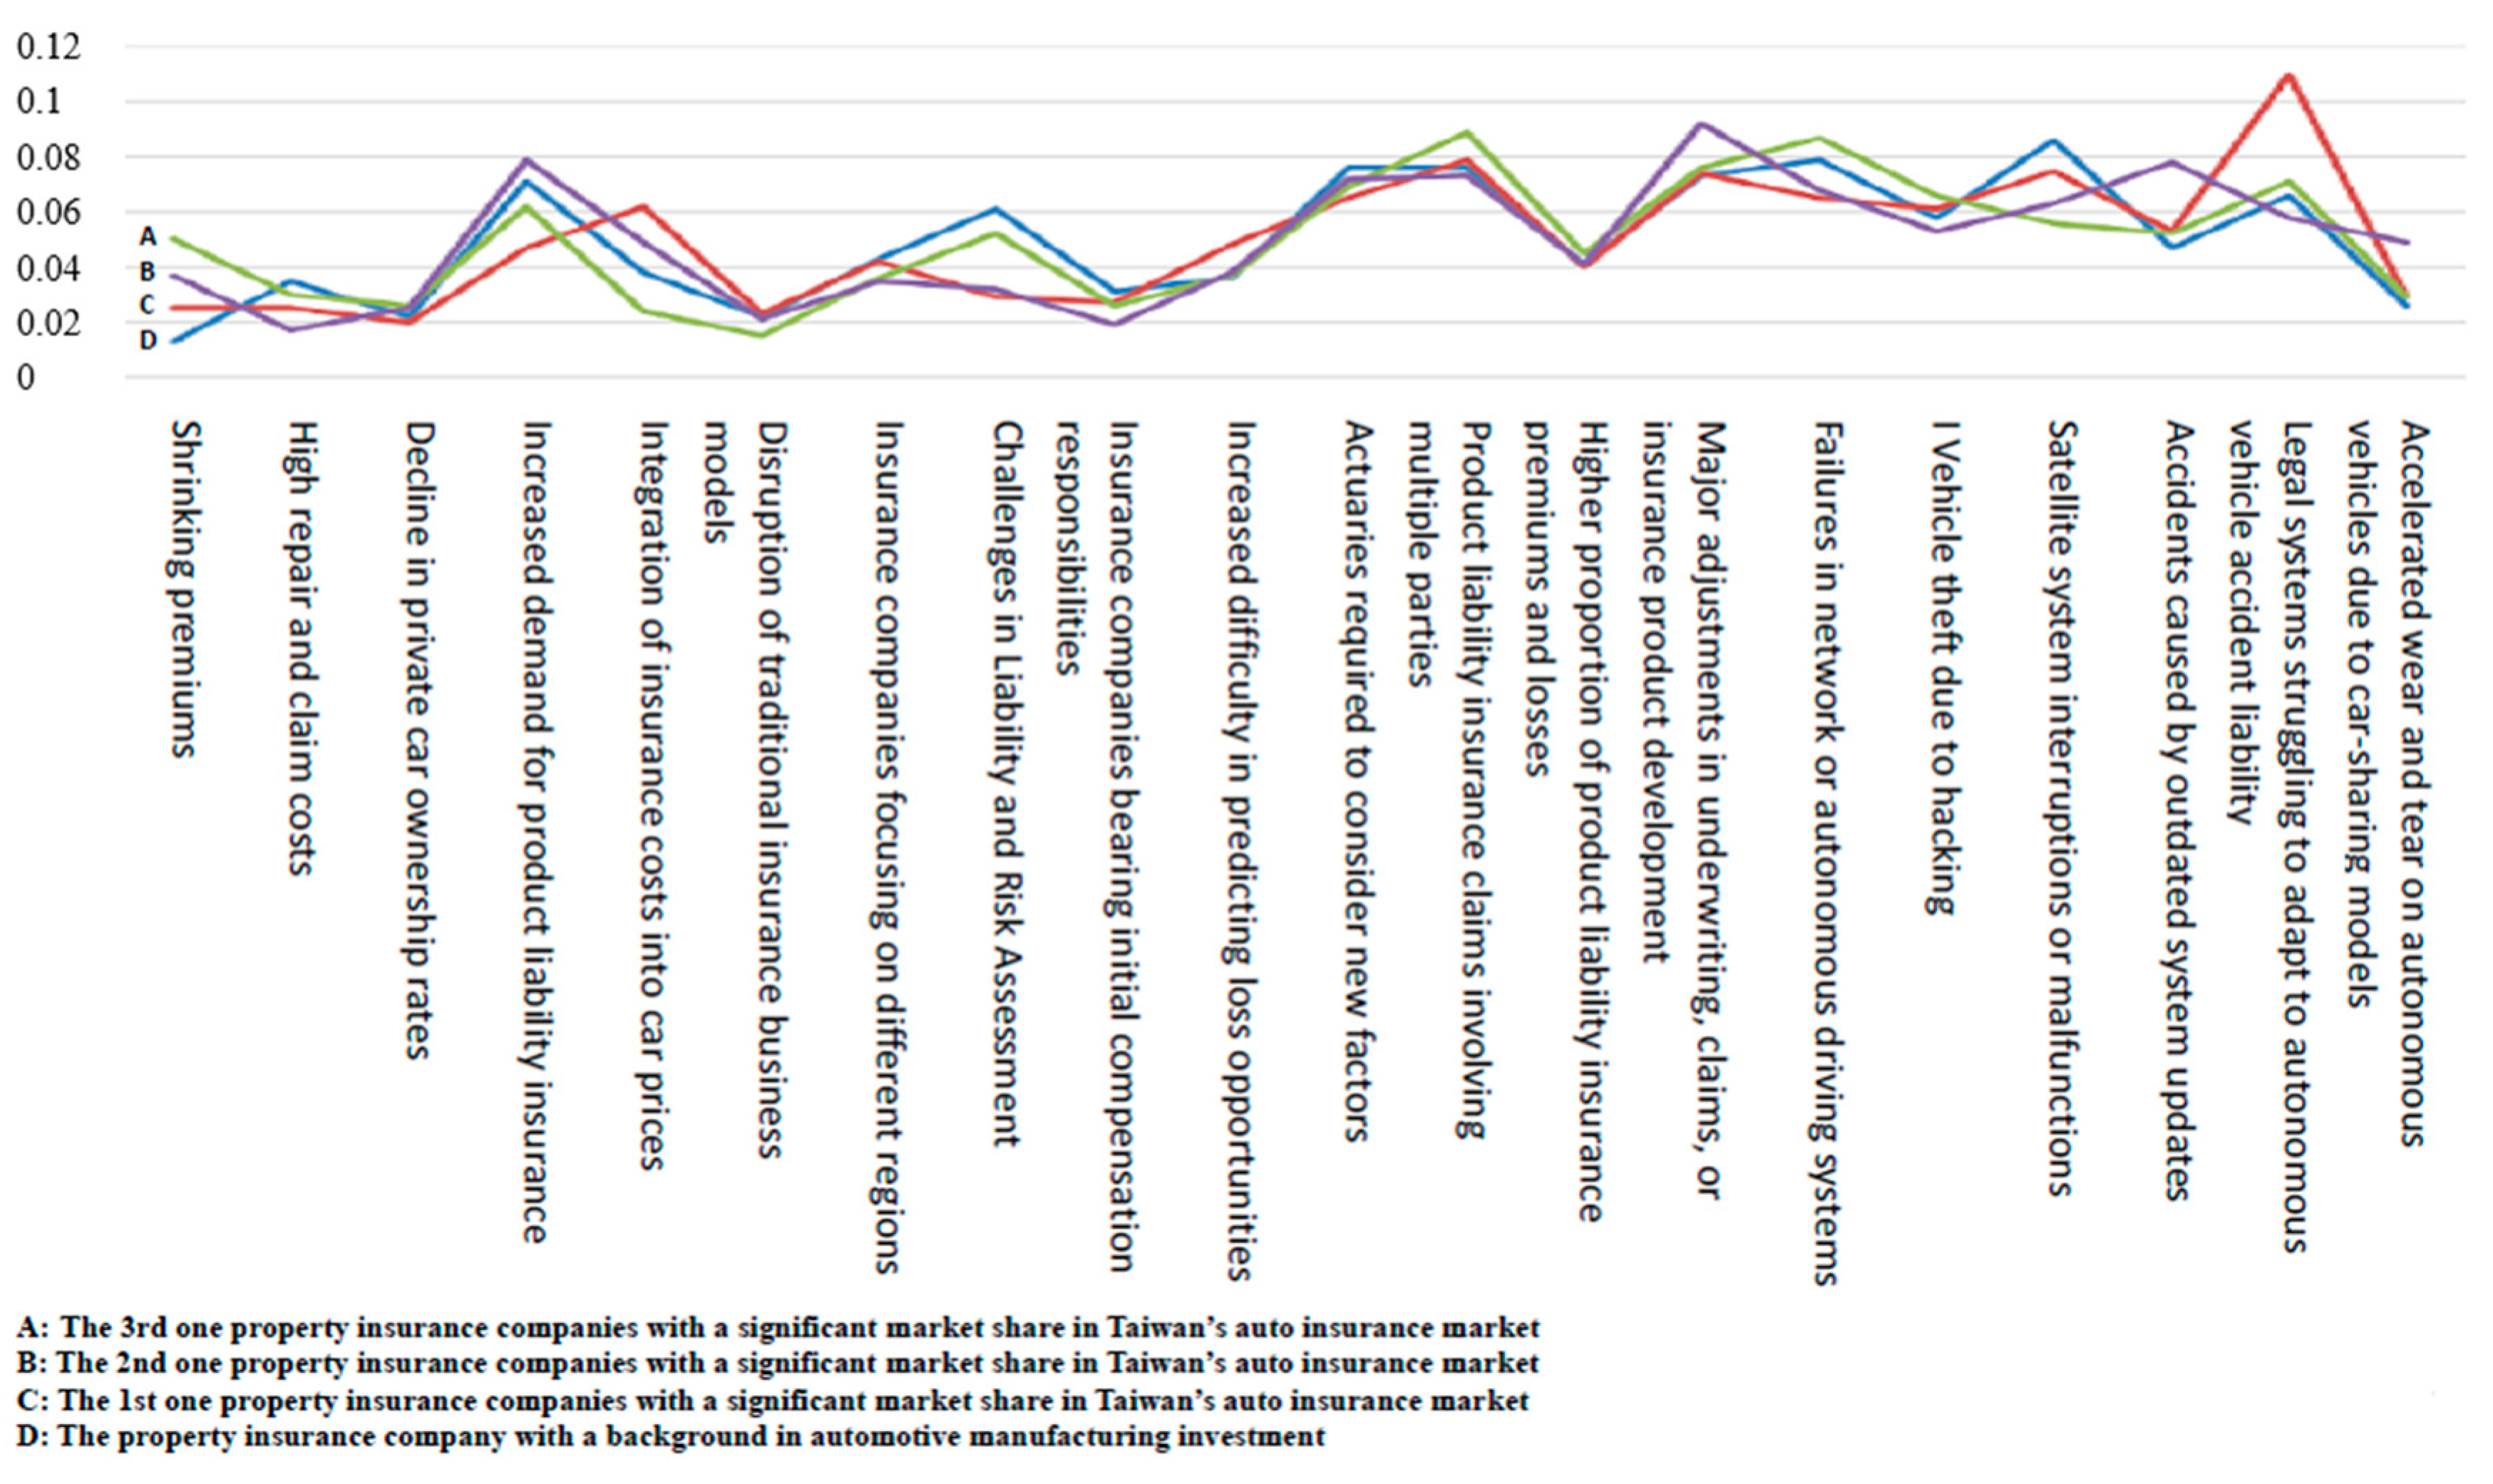
Table 5 lists the individual overall weights and rankings of each insurance company’s perceptions of autonomous vehicle-related insurance. Figure 10 compares the overall weights of perceptions among the companies. A detailed examination of Table 2 and Figure 10 reveals both similarities and differences in the companies’ attitudes toward autonomous vehicle-related insurance. Furthermore, Spearman correlation analysis confirms that the companies’ perceptions are generally consistent, with correlation coefficients exceeding 0.745 and p-values all being equal to 0.000 (<0.05) (see Table 6).
Table 5.
The overall weights and rankings of insurance companies’ awareness regarding autonomous vehicle insurance.
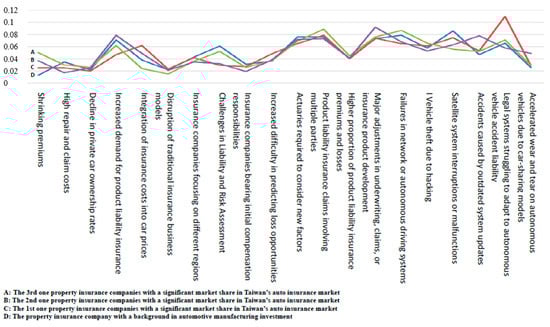
Figure 10.
Comparative chart of overall weights of autonomous vehicle insurance perceptions among insurance companies with different backgrounds.
Table 6.
Spearman correlation analysis of autonomous vehicle-related insurance perceptions among insurance companies.
This study also uses the next four tables to compare the weights and rankings of the four insurance companies across three major impact factors; lists the secondary impact factors with the highest weights within each major category for each insurance company; shows the correlation coefficients from Spearman rank correlation analysis among the insurance companies; and lists the top five factors of highest concern for each insurance company, providing a quick overview of each company’s most important aspects.
Table 7 shows the weights and rankings of the four insurance companies across three major impact categories: Changes in the Insurance Market, Updates in Insurance Business Operations, and Emergence of New Risks. Higher weights indicate a greater level of concern for that category for the insurance company. The ranking is based on the weight, with the highest weight being ranked as 1. As Table 1 shows, most companies consider “Updates in Insurance Business Operations” or “Emergence of New Risks” to be more impactful.
Table 7.
Comparison of weights and rankings of major impact factors across insurance companies.
Due to the large number of secondary impact factors, Table 2 only lists the secondary impact factors with the highest weights, and their respective weights and rankings within each major category for each company.
Table 8 lists the secondary impact factors with the highest weights within each major category for each insurance company. It highlights the differences in focus of each company on specific factors.
Table 8.
Comparison of weights and rankings of secondary impact factors across insurance companies.
Table 9 displays the correlation coefficients derived from the Spearman rank correlation analysis among the insurance companies. All correlation coefficients are greater than 0.745, with p-values of 0.000 (<0.05), indicating a high level of consistency in viewpoints among the companies.
Table 9.
Detailed results of Spearman rank correlation analysis.
Table 10 lists the top five factors of highest concern for each insurance company, providing a quick overview of the most important aspects for each company. It can be seen that most companies have high levels of concern regarding multi-party liability claims and the risks associated with new technologies.
Table 10.
Top five factors of highest concern for each insurance company.
5. Conclusions, Implications, and Recommendations
5.1. Conclusions
Based on the comprehensive results of this study, the following conclusions were drawn:
- High Consistency in Perspectives: The study found that insurance companies, regardless of their market share, financial ties to automotive manufacturers, or adoption of innovative technologies, share a strong consensus on the transformative impacts of AVs on the insurance business. This is validated by Spearman rank correlation coefficients exceeding 0.745 (p < 0.05)1. This indicates a similar awareness of the challenges and opportunities presented by autonomous vehicles, despite differences in the companies’ backgrounds;
- Key Areas of Impact: The research indicates that the primary effects of AVs are reflected in “Updates in Insurance Business Operations” and the “Emergence of New Risks”, which are considered more significant than “Changes in the Insurance Market”. Key impacts include adjustments in underwriting practices, claims handling processes, and product development, as well as the emergence of risks such as system failures and satellite malfunctions. These findings align with discussions in the research content regarding how autonomous vehicles will alter insurance companies’ operating models;
- Complexity of Multi-Party Liability Claims: All companies consider the complexity of multi-party involvement in product liability claims a critical concern, particularly when vehicle manufacturers, network system providers, and satellite operators are involved. The study emphasizes that determining liability in AV accidents will require significant resources and may complicate claim resolution processes. This aligns with the study’s point that liability in AV accidents will not be limited to drivers, but will extend to more stakeholders;
Divergences in Specific Focus: While overall perspectives are consistent, companies differ in their emphasis on specific impacts:
- Company C prioritizes legal frameworks for AV accident liability, Company A focuses on underwriting adjustments and risks from outdated systems, Company B and the automotive-affiliated insurer emphasize challenges like multi-party liability claims and system malfunctions. These differences show that each company adjusts its strategies based on its unique situation in response to the risks of autonomous vehicles;
- Common High-Risk Factors: Despite differences in focus, shared concerns include multi-party product liability claims, autonomous driving system malfunctions, and gaps in the legal frameworks for AV accident liability. These shared concerns highlight the common challenges that autonomous vehicle technology presents, and the risks insurance companies must jointly face;
- Minor and Least Acknowledged Impacts: The study anticipates minor impacts from AVs on market dynamics and traditional insurance business models. A decline in private car ownership is considered unlikely, especially in low-density areas where demand for private vehicles is expected to remain steady. This suggests that despite the transformations brought about by autonomous vehicles, traditional auto insurance business still has value, though it requires adjustments.
The findings of this research and the conclusions are mutually reinforcing, indicating that autonomous vehicles will have a profound impact on the insurance industry. Insurance companies need to develop innovative products, optimize their processes, collaborate with industry stakeholders, and adjust traditional models to remain competitive in the autonomous vehicle era.
5.2. Implications
Based on the previous conclusions, this study develops the following implications:
- Customized Insurance Products: Due to the unique risks posed by AVs, particularly concerning multi-party liability and technology-related failures, there is a need for specialized insurance policies. This implies that traditional auto insurance products are not fully applicable to AVs, and insurance companies need to develop new insurance products to address these emerging risks;
- Optimized Claims Processes: To simplify the claims process for AV accidents involving multiple parties and to expedite compensation for victims, it is recommended to adopt a no-fault insurance model. This model allows for immediate compensation to victims, with insurers later seeking subrogation from the responsible parties;
- Collaboration with Automakers and Tech Firms: Insurance companies should establish strategic partnerships or equity investments with automakers and technology companies to remain competitive and effectively address emerging risks. This collaboration can help insurance companies better understand the development of autonomous driving technology and develop products that are better suited to market demands;
- Data-Driven Risk Assessments: Given the lack of historical data on AVs, insurance companies need to build loss experience databases to improve risk assessment and product design. By collecting and analyzing AV data, insurers can more accurately assess risks and formulate more reasonable premiums;
- Enhanced Risk Management and Compliance: Due to cybersecurity risks and evolving legal frameworks, insurance companies need to strengthen risk management and closely monitor regulatory changes to ensure compliance. This includes implementing stronger cybersecurity measures and ensuring insurance policies comply with the latest legal requirements;
- Adaptation of Traditional Models: While traditional insurance models will not become completely obsolete, they must be adjusted to accommodate new market demands and risks posed by AVs. This means that insurance companies need to develop new products and services based on the traditional auto insurance business to address the new challenges of the autonomous vehicle era.
In summary, the emergence of autonomous vehicles has a profound impact on the insurance industry. Insurance companies need to proactively address these changes, including developing new insurance products, optimizing claims processes, strengthening cooperation, building databases, enhancing risk management, and adjusting traditional models to remain competitive in this new era.
5.3. Recommendations
Based on the prior conclusions and implications, this study provides the following recommendations:
- Establish Loss Experience Databases: Given that autonomous vehicle technology is still evolving, insurance companies should incrementally build loss experience databases in tandem with technological advancements. This will help in more accurately assessing risks and developing appropriate insurance policies and pricing strategies. Insurance companies can collect actual claims data to understand the risks of AVs in different situations and adjust their insurance products accordingly;
- Adopt a No-Fault Insurance Model: In AV accidents, liability may involve multiple parties, leading to complex and time-consuming claims processes. To simplify claims processes and expedite compensation to victims, it is recommended that insurance companies consider adopting a no-fault insurance mode. This model would compensate victims first, and then insurers can seek subrogation from the responsible parties;
- Engage in Strategic Partnerships with Automakers and Tech Companies: To remain competitive in the fiercely competitive market and seize emerging business opportunities, insurance companies should actively seek strategic collaborations or equity investments with automakers and technology companies. Such partnerships can help insurers better understand the development of autonomous driving technology and develop products and services that better meet market demands;
- Develop Customized Insurance Products: The unique risks of AVs, such as system failures, cybersecurity vulnerabilities, and multi-party liability, require specially designed insurance products. Traditional auto insurance policies may not be fully applicable to AVs, so insurance companies need to develop new insurance products to address these new risks. These customized products should consider the unique characteristics of AVs and provide appropriate coverage;
- Strengthen Risk Management and Cybersecurity: Since AV systems heavily rely on network connections, cybersecurity risks cannot be ignored. Insurance companies should strengthen their assessment of cybersecurity risks and develop corresponding risk management strategies. This includes protecting AV systems from hacker attacks and ensuring data security;
- Monitor Regulatory Developments: The development of AVs also brings about legal challenges, such as liability and accident handling. Insurance companies should closely monitor regulatory developments and ensure that their insurance products and claims processes comply with the latest legal requirements. Maintaining communication with regulatory agencies will help insurers better address legal challenges;
- Adjust Traditional Business Models: Although the emergence of AVs has impacted the traditional auto insurance business, traditional business models will not become completely obsolete. Insurance companies should proactively adjust their traditional business models to adapt to the new needs and challenges of the AV era. This includes updating their underwriting, claims, and product development processes;
- Focus on Product Liability Insurance: With the growing popularity of AV technology, the demand for product liability insurance is expected to increase. Insurance companies should pay special attention to the development of product liability insurance and develop corresponding products and services. This will help insurers to seize new market opportunities and expand their business scope;
- Train Professional Talent: To cope with the challenges brought about by autonomous vehicles, insurance companies need to train personnel with relevant expertise. This includes expertise in areas such as autonomous driving technology, cybersecurity, and legal regulations. Only with professional talent can insurance companies effectively cope with the risks and challenges of the autonomous vehicle era.
These recommendations aim to help insurance companies remain competitive in the era of autonomous vehicles and effectively address emerging risks and challenges. By adopting these recommendations, insurance companies can better serve their customers and play a crucial role in the development of autonomous vehicles.
Author Contributions
In this research, X.L. led the project by initiating the research idea, formulating the theoretical framework, and designing the methodology. X.L. was primarily responsible for data collection, analysis, interpretation, and drafting the manuscript. C.-Y.L. provided essential support by assisting in the methodology design, data collection, and statistical analysis. C.-Y.L. also contributed to interpreting results, conducted a comprehensive literature review, and suggested real-world applications. Additionally, C.-Y.L. offered valuable feedback during manuscript drafting and revisions. C.K.F. supervised the overall research, offering conceptual direction and refining the research scope. C.K.F. ensured interdisciplinary integration, reviewed the manuscript for quality, and managed communication with the journal throughout the submission and revision process. All authors have read and agreed to the published version of the manuscript.
Funding
This research received no external funding.
Institutional Review Board Statement
Ethical review and approval were waived for this study due to the announcement of the National Science and Technology Council of the Republic of China on 12 January 2015, “The scope of human research cases that are exempted from review by the ethics review committee”.
Informed Consent Statement
Informed consent was obtained from all subjects involved in the study.
Data Availability Statement
The original contributions presented in the study are included in the article, further inquiries can be directed to the corresponding author.
Conflicts of Interest
The authors declare no conflict of interest.
References
- Ericsson. The Role of 5G in Transforming Autonomous Vehicles. Available online: https://www.ericsson.com (accessed on 1 October 2024).
- Deng, Z.; Shi, Y.; Shen, W. V2X-Lead: LiDAR-based End-to-End Autonomous Driving with Vehicle-to-Everything Communication Integration. arXiv 2023, arXiv:2309.15252. [Google Scholar] [CrossRef]
- Goodfellow, I.; Bengio, Y.; Courville, A. Deep Learning; MIT Press: Cambridge, MA, USA, 2016; pp. 1–775. [Google Scholar]
- Hasanujjaman, M.; Chowdhury, M.Z.; Jang, Y.M. Sensor Fusion in Autonomous Vehicle with Traffic Surveillance Camera System: Detection, Localization, and AI Networking. Sensors 2023, 23, 3335. [Google Scholar] [CrossRef] [PubMed]
- Zhuge, C.; Wang, C. Integrated Modelling of Autonomous Electric Vehicle Diffusion: From Review to Conceptual Design. Transp. Res. Part D Transp. Environ. 2021, 91, 102679. [Google Scholar] [CrossRef]
- Vellone, J.A.D.; Eeuwes, R. The Ultimate Mobility Synergy: Autonomous Vehicles and Electric Vehicles. BLG. Available online: https://www.blg.com (accessed on 1 October 2024).
- Waymo. How Waymo is Shaping the Future of Autonomous Driving. Available online: https://www.waymo.com (accessed on 1 October 2024).
- Tesla. Full Self-Driving Technology Overview. Available online: https://www.tesla.com (accessed on 1 October 2024).
- Litman, T. Autonomous Vehicle Implementation Predictions: Implications for Transport Planning; Victoria Transport Policy Institute: Victoria, BC, Canada, 2021; pp. 1–42. [Google Scholar]
- Fortune Business Insights, Autonomous Vehicle Market Size, Share and COVID-19 Impact Analysis, By Level (L1, L2, and L3 and L4 and L5), By Vehicle Type (Passenger Cars and Commercial Vehicles), and Regional Forecast, 2023–2030. Available online: https://www.fortunebusinessinsights.com/autonomous-vehicle-market-109045 (accessed on 24 January 2025).
- Data Bridge Market Research, Global Autonomous Vehicle Market—Industry Trends and Forecast to 2028. Available online: https://www.databridgemarketresearch.com/reports/global-autonomous-vehicle-market (accessed on 24 January 2025).
- Li, C.; Zhang, W. Emerging Trends in Autonomous Driving Technologies: Current Developments and Challenges. J. Intell. Transp. Syst. 2020, 25, 276–289. [Google Scholar]
- Gartner. The Role of Technology in Autonomous Vehicles. Available online: https://www.gartner.com (accessed on 1 October 2024).
- Tesla. Insurance Built for Tesla Owners. Available online: https://www.tesla.com (accessed on 1 October 2024).
- S; P Global. Automaker Insurance Begins Modestly, Promises More via Built-In Tech; S&P Global Market Intelligence: New York, NY, USA, 2021; pp. 1–10. [Google Scholar]
- PYMNTS. Automakers Adding Insurance and Other Services that Use Driving Data. PYMNTS. 2021. Available online: https://www.pymnts.com/commerce-connected/2021/automakers-adding-insurance-and-other-services-that-use-driving-data/ (accessed on 1 October 2024).
- KPMG. Autonomous Vehicles and Insurance: Disruption Ahead; KPMG Reports: Seoul, Republic of Korea, 2023; pp. 1–25. [Google Scholar]
- Lai, J.Y. Financial Technology and Insurance: Integrating Advanced Technologies for the Future. J. Financ. Innov. Stud. 2022, 16, 33–50. [Google Scholar]
- NHTSA; SAE. Autonomous Driving Standards: A Comprehensive Framework. Available online: https://www.nhtsa.gov (accessed on 1 October 2024).
- Perfetto, D.; Smollik, L. Categorization and Levels of Autonomous Driving Technology. Int. J. Mobility Sci. 2023, 5, 101–115. [Google Scholar]
- KPMG. Autonomous Vehicles and the Future of Insurance. Available online: https://www.kpmg.com (accessed on 1 October 2024).
- PwC. Global Trends in Autonomous Vehicles: Repair Costs and Risk Management. Available online: https://www.pwc.com (accessed on 1 October 2024).
- Strategy & What Consumers Really Want. Digital Auto Report 2023. PwC. Available online: https://www.pwccn.com/en/automotive/digital-automotive-report-2023-en-1.pdf?utm_source=chatgpt.com (accessed on 1 October 2024).
- Fallon, P. Commercial Insurance Opportunities in a Shared Mobility World. J. Insur. Trends 2023, 12, 45–58. [Google Scholar]
- Chordas, L. The Rise of Shared Mobility: Impacts on the Insurance Market. Available online: https://www.chordas.com (accessed on 1 October 2024).
- Fan, C.K.; Xu, X. Influences of Autonomous Cars on the Insurance Market from the Perspectives of Insurance Companies and Auto Insurance Agencies. J. Applied Finance Banking 2019, 9, 11–35. [Google Scholar]
- Koji, N. Japan leads the world in development of laws related to autonomous driving, Meiji University. 2024. Available online: https://english-meiji.net/articles/4571/?utm_source=chatgpt.com (accessed on 1 October 2024).
- Smith, R. Liability in the Autonomous Driving Ecosystem. Automot. Law Rev. 2023, 25, 89–103. [Google Scholar]
- Tesla. Tesla Insurance Program. Available online: https://www.tesla.com (accessed on 1 October 2024).
- Rogers, T. Adapting Insurance Operations for Autonomous Vehicles. Insur. Insights Q. 2023, 11, 45–58. [Google Scholar]
- Smith, R. Automakers and Insurance: The Future of Liability in the Autonomous Era. Automot. Ind. Rev. 2023, 22, 67–81. [Google Scholar]
- Rogers, T. Risk Profiles and Claims Trends in Autonomous Vehicle Insurance. Insur. Insights Q. 2023, 11, 45–60. [Google Scholar]
- Noguchi, K. Liability Shifts in Autonomous Vehicle Accidents. Leg. Insights Q. 2023, 18, 89–103. [Google Scholar]
- PwC. The Impact of Autonomous Vehicles on Insurance Underwriting. Available online: https://www.pwc.com (accessed on 1 October 2024).
- Noguchi, K. No-Fault Insurance Models for Autonomous Vehicles: Lessons from Japan. Glob. Risk Manag. Q. 2023, 19, 34–48. [Google Scholar]
- Natl. Law Rev. Cybersecurity and Liability in Autonomous Vehicles. Available online: https://www.natlawreview.com (accessed on 1 October 2024).
- PwC. Liability in the Autonomous Era: Shared Risks in Vehicle Manufacturing. Available online: https://www.pwc.com (accessed on 1 October 2024).
- Rogers, T. AV Adoption: Risks and Regulatory Challenges; RAND Corporation: Santa Monica, CA, USA, 2023. [Google Scholar]
- Trice, D.; Baguios, M. Reshaping Insurance Policies for Autonomous Vehicles. Int. J. Insur. Trends 2023, 18, 15–29. [Google Scholar]
- Smith, R. Inherent Risks in Autonomous Vehicle Systems. Global Technol. Rev. 2023, 19, 56–70. [Google Scholar]
- Natl. Law Rev. Autonomous Vehicle Liability Frameworks in a Shared Ecosystem. Available online: https://www.natlawreview.com (accessed on 1 October 2024).
- PwC. The Risks of Autonomous Vehicles: Connectivity and System Vulnerabilities. Available online: https://www.pwc.com (accessed on 1 October 2024).
- Birnbaum, R. Shared Mobility Systems and Vehicle Risk: Implications for Insurance. J. Mobil. Risk Anal. 2023, 14, 89–105. [Google Scholar]
- KPMG. Autonomous Vehicles: New Risks and Legislative Challenges. Available online: https://www.kpmg.com (accessed on 1 October 2024).
- Tesla. Tesla Insurance and Autonomous Vehicle Innovations. Tesla Annu. Rep. 2023, 1–8. Available online: https://ir.tesla.com/_flysystem/s3/sec/000162828024002390/tsla-20231231-gen.pdf (accessed on 1 October 2024).
- BMW Group. Premium Insurance Services and Autonomous Technology Integration. BMW Annu. Rev. 2023, 30–50. Available online: https://www.bmwgroup.com/en/report/2023/index.html (accessed on 1 October 2024).
- Smith, J. Inherent Risks in AV Technology. Natl. Law Rev. 2023, 25, 89–103. [Google Scholar]
- Prez, M.D. Mercedes Will Accept Responsibility for Autonomous Technology Crashes. FleetNews. 2022. Available online: https://www.fleetnews.co.uk/news/manufacturer-news/2022/03/28/mercedes-will-accept-responsibility-for-autonomous-technology-crashes?utm_source=chatgpt.com (accessed on 1 October 2024).
- KPMG. Product Liability and Risk Allocation in Autonomous Vehicles. Available online: https://www.kpmg.com (accessed on 1 October 2024).
- Matley, J.; Mullaney, R. Ridesharing and the Decline of Personal Vehicle Ownership. Glob. Mobil. J. 2023, 15, 123–135. [Google Scholar]
- Gutman, S. Data Collection for Insurance in the Autonomous Era. Insur. Technol. Rev. 2023, 10, 67–79. [Google Scholar]
- Business Wire. Carmakers’ Shared & Smart Mobility Strategies Report 2022: Focus on China, Germany, California & India—ResearchAndMarkets.com. 2022. Available online: https://www.businesswire.com/news/home/20221013005669/en/Carmakers-Shared-Smart-Mobility-Strategies-Report-2022-Focus-on-China-Germany-California-India---ResearchAndMarkets.com?utm_source=chatgpt.com. (accessed on 1 October 2024).
- Petit, J.; Shladover, S.E. Potential Cyberattacks on Automated Vehicles. IEEE Trans. Intell. Transp. Syst. 2015, 16, 546–556. [Google Scholar] [CrossRef]
- Gutman, J. Challenges in Claims Management for Avs; RAND Corporation: Santa Monica, CA, USA, 2023. [Google Scholar]
- PwC. Autonomous Vehicles: Underwriting and Market Evolution. Available online: https://www.pwc.com (accessed on 1 October 2024).
- Wu, H.; Cheng, H.; Zheng, S.; Zhang, C. FRUIT: Fast Road User Interactions Modeling with Latent Intention and Multimodal Trajectory for Autonomous Driving. IEEE Xplore 2024, 7, 2–16. [Google Scholar] [CrossRef]
- Volkswagen Group. Sustainability and Autonomous Mobility. Volkswagen Sustain. Rep. 2023, 15, 20–35. Available online: https://www.volkswagen-group.com/en/publications/more/group-sustainability-report-2023-2674 (accessed on 1 October 2024).
- Lee, S.; No, Y.; Cho, J. Highlighted cyber threats and risk scenarios for maritime autonomous surface ships. IEEE 2025, 13, 10311–10325. [Google Scholar] [CrossRef]
- Toyota Newsroom. Toyota Research Institute Showcases Latest AI-Assisted Driving Technology. Toyota Research Institute (TRI). 2023. Available online: https://pressroom.toyota.com/toyota-research-institute-showcases-latest-ai-assisted-driving-technology/?utm_source=chatgpt.com (accessed on 1 October 2024).
- California Department of Motor Vehicles. Reported autonomous vehicle collision statistics in California. DMV Collision Reports. 2022, 5. Available online: https://www.dmv.ca.gov (accessed on 1 October 2024).
- Yang, W.; Zhao, M. Discussed environmental adaptability challenges in autonomous driving systems. IEEE Trans. Intell. Veh. 2022, 7, 245–260. [Google Scholar]
- Rajkumar, R.; Hu, W. Examined cybersecurity vulnerabilities in autonomous vehicle systems, with a focus on ADAS. arXiv 2022, arXiv:2204.06768. [Google Scholar]
- Bhargava, V.R.; Berkey, B. Autonomous Vehicles and the Ethics of Driving. SSRN. 2023. Available online: https://doi.org/10.2139/ssrn.4378819 (accessed on 1 October 2024).
- Saaty, T.L. The Analytic Hierarchy Process; McGraw Hill: New York, NY, USA, 1980. [Google Scholar]
- Saaty, T.L. How to Mark a Decision: The Analytic Hierarchy Process. Eur. J. Oper. Res. 1990, 48, 9–26. [Google Scholar] [CrossRef]
- Forman, E.; Selly, M.A. Decision by Objectives: How to Convince Others That You Are Right; World Scientific Publishing: Singapore, 2001. [Google Scholar]
- Saaty, T.L. Decision making with the Analytic Hierarchy Process. Int. J. Serv. Sci. 2008, 1, 83–98. [Google Scholar] [CrossRef]
- Schmidt, K.; Aumann, I.; Hollander, I.; Damm, K.; Schulenburg, J.M.G. Applying the Analytic Hierarchy Process in Healthcare Research: A Systematic Literature Review and Evaluation of Reporting. BMC Med. Inform. Decis. Mak. 2015, 15, 112. [Google Scholar] [CrossRef] [PubMed]
- Salomon, V.A.P. Absolute Measurement and Ideal Synthesis on AHP. Int. J. Anal. Hierarchy Process 2016, 8. [Google Scholar] [CrossRef]


Disclaimer/Publisher’s Note: The statements, opinions and data contained in all publications are solely those of the individual author(s) and contributor(s) and not of MDPI and/or the editor(s). MDPI and/or the editor(s) disclaim responsibility for any injury to people or property resulting from any ideas, methods, instructions or products referred to in the content. |
© 2025 by the authors. Published by MDPI on behalf of the World Electric Vehicle Association. Licensee MDPI, Basel, Switzerland. This article is an open access article distributed under the terms and conditions of the Creative Commons Attribution (CC BY) license (https://creativecommons.org/licenses/by/4.0/).