Article

The Efficacy of the New Energy Vehicle Mandate Policy on Passenger Vehicle Market in China

School of Automotive Studies, Tongji University, Shanghai 201804, China
*
Author to whom correspondence should be addressed.
World Electr. Veh. J. 2025, 16(3), 151; https://doi.org/10.3390/wevj16030151
Submission received: 5 January 2025 / Revised: 13 February 2025 / Accepted: 19 February 2025 / Published: 5 March 2025

Abstract

:
This paper aims to assess the impact of the New Energy Vehicle (NEV) mandate policy on the passenger vehicle market in China, with a focus on its effectiveness in promoting NEV adoption. In response to global climate goals and energy security concerns, China has implemented various NEV policies, including the phase-out of direct subsidies and the introduction of the NEV mandate policy (dual-credits policy). This policy, which combines NEV credits and Corporate Average Fuel Consumption (CAFC) credits, aims not only to promote NEV adoption but also to support industrial policy objectives by helping the auto industry leapfrog traditional internal combustion engines and become globally competitive. In this study, a System Dynamics (SD) model was developed using Vensim software (10.2.2) to simulate interactions between automakers, government policies, and consumer behaviors. The results show that the NEV mandate policy significantly boosts NEV sales, with projections indicating that NEV sales will reach 15 million units by 2030, accounting for 55% of the passenger vehicle market. Additionally, the study finds that tightening NEV credits standards and increasing the NEV credit proportion requirements can further enhance market growth, with stricter measures post-2023 being crucial to achieving a 50% market share. In contrast, under a scenario where the dual-credits policy ends in 2024, the NEV market share would still grow but would fall short of the 50% target by 2030. The findings suggest that stronger policy measures will be essential to maintain long-term market momentum.

1. Introduction

Over the past few decades, the automotive industry has experienced significant transformation due to global pressures to reduce greenhouse gas emissions and transition to energy-efficient vehicle solutions. As nations commit to environmental targets and aim to lower fossil fuel dependency, new energy vehicles (NEVs)—including battery electric vehicles (BEVs), plug-in hybrid electric vehicles (PHEVs), and fuel cell vehicles (FCVs)—have emerged as essential components of sustainable transportation strategies. Among the leading markets, China stands out as both the world’s largest automotive market and a pioneer in NEV adoption, implementing policies designed to boost NEV production and drive consumer demand. With the gradual reduction in direct subsidies, which had previously been central to its NEV initiatives, China introduced the NEV mandate policy, also known as the “dual-credits policy”, to sustain NEV market growth [1,2,3].
The dual-credits policy is structured around two complementary credit systems: NEV credits and Corporate Average Fuel Consumption (CAFC) credits. NEV credits are awarded based on an automaker’s production and sales of NEVs, with a specific credit value assigned to each NEV based on factors such as energy efficiency, driving range, and battery performance. Automakers are required to meet a designated NEV credits ratio, calculated as a percentage of their total vehicle production or imports, with the goal of encouraging higher NEV production volumes. CAFC credits, on the other hand, pertain to the average fuel consumption of a manufacturer’s fleet of conventional internal combustion engine vehicles. Automakers are required to meet annual CAFC standards, which are progressively tightened over time. If a manufacturer’s fleet average fuel consumption exceeds the set limit, it incurs a CAFC credit deficit. To comply with the dual-credits policy, manufacturers must achieve both NEV and CAFC credit targets or balance any deficits through various measures, such as transferring credits between NEV and CAFC categories or purchasing excess credits from other compliant manufacturers. This market-based mechanism incentivizes automakers to improve fuel efficiency in their conventional fleets while simultaneously increasing NEV production, thus supporting China’s long-term environmental and energy security goals. In recent decades, the automotive industry has transformed significantly, driven by global mandates to reduce greenhouse gas emissions and transition to energy-efficient transportation solutions. As nations set ambitious environmental targets and seek to decrease fossil fuel dependency, new energy vehicles (NEVs)—such as battery electric vehicles (BEVs), plug-in hybrid electric vehicles (PHEVs), and fuel cell vehicles (FCVs)—have emerged as essential elements of sustainable mobility strategies. Among the leading markets, China stands out as both the world’s largest automotive market and a pioneer in NEV adoption, implementing targeted policies to stimulate NEV production and drive consumer demand. With the gradual reduction in direct subsidies, which had previously been central to its NEV initiatives, China has introduced the NEV mandate policy, or “dual-credits policy”, as a critical measure to sustain NEV market growth
Although substantial research examines individual NEV policies, such as subsidies and emissions standards, much of this work has focused on isolated policy impacts rather than on comprehensive frameworks like the dual-credits policy, which aims to integrate environmental and energy objectives within a single regulatory approach [4,5,6]. Recent studies emphasize that policy effectiveness in the NEV sector is deeply influenced by interactions among government regulations, consumer preferences, and market conditions, which are often not fully captured by traditional static models [7,8,9]. Additionally, while comparisons have been drawn between China’s dual-credits policy and California’s Zero Emission Vehicle (ZEV) mandate, they often lack a system-wide, dynamic analysis that considers the feedback loops and cumulative impacts over time. The dual-credits policy uniquely combines NEV credits and Corporate Average Fuel Consumption (CAFC) credits, creating a complex, interdependent structure that influences automaker behavior, investment in technology, and market trends [10,11,12]. Understanding these interactions and quantifying their long-term impacts on NEV market penetration remains a significant gap in current research.
To address this gap, our study develops a System Dynamics (SD) model tailored to China’s passenger vehicle market, enabling a dynamic analysis of how the dual-credits policy influences NEV adoption through the interplay of regulatory requirements, automaker responses, and consumer behaviors. This approach builds on recent calls for dynamic modeling frameworks that incorporate feedback mechanisms and evolving policy structures [7,10,13]. By simulating multiple scenarios until 2030, the model evaluates the impact of varying NEV credit requirements and CAFC standards, providing a more nuanced understanding of the policy’s effectiveness in driving NEV adoption and supporting China’s broader sustainability goals.
The findings of this study suggest that China’s NEV mandate policy plays a substantial role in driving NEV market growth, particularly in the absence of direct subsidies. Simulation results indicate that progressively tightening NEV credit requirements and CAFC standards could help achieve a 50% NEV market share by 2030, thereby supporting China’s long-term environmental commitments. These insights highlight the potential importance of sustained policy adjustments post-2023 to ensure continued momentum in NEV adoption and contribute to broader global climate targets.
This paper advances knowledge in three key ways. First, by developing a System Dynamics (SD) model tailored to China’s passenger vehicle market, it allows for a dynamic analysis of how the dual-credits policy influences NEV adoption through the interplay of regulatory requirements, automaker responses, and consumer behaviors. Second, the study incorporates multiple policy scenarios and evaluates the impact of varying NEV credit requirements and CAFC standards, providing a more nuanced understanding of the policy’s effectiveness in driving NEV adoption. Finally, it offers practical insights for policymakers and automakers, proposing data-driven recommendations for refining the NEV credits ratios and CAFC standards to better align with evolving market demands and sustainability goals.
The remainder of this paper is organized as follows: Section 2 reviews the relevant literature. Section 3 provides an overview of the NEV mandate policy and theoretical foundations of NEV market dynamics. Section 4 describes the methodology, detailing the SD model design and core parameters. Section 5 presents simulation results. Section 6 discusses the results, including scenario analyses that illustrate policy impacts under different conditions. Section 7 presents the conclusions, theoretical, practical, and policy implications. Finally, Section 8 addresses the research limitations and provides recommendations for future research directions.

2. Literature Review

Several key studies form the foundation of the current NEV policy analysis. Harrison et al. [14] developed the Powertrain Technology Transition Market Agent Model (PTTMAM) to explore how stakeholders—such as manufacturers, authorities, infrastructure providers, and consumers—influence vehicle technology transitions in the EU market. While this model underscores the importance of multi-agent interactions in automotive policy impacts, it does not capture the unique regulatory environment of China’s dual-credits policy. Nonetheless, PTTMAM’s structure offers valuable insights into complex market dynamics, serving as a foundation for system-wide analysis in this study.
Ou et al. [15] conducted a comparative analysis of China’s dual-credits policy and California’s Zero Emission Vehicle (ZEV) mandate, illustrating how NEV credits can help offset automakers’ costs associated with high-efficiency vehicles. Although this study provides a preliminary quantification of financial benefits, it is limited to automaker economics and does not account for consumer adoption trends or broader market impacts over time. Li et al. [16] further analyzed the competitive effects of the dual-credits policy, applying a game theory model to show how automakers adapt to credit requirements, thus incentivizing more fuel-efficient vehicle production. However, this research focuses on the intra-industry competition without exploring consumer responses or potential demand shifts influenced by policy changes. Wang et al. [17] assessed optimal NEV and CAFC credit multipliers, proposing that adjusting multipliers can maximize the dual-credit policy’s efficiency. Their research identifies key policy parameters but is limited by a static analysis that does not capture the policy’s impact across different scenarios or time horizons. Cui [18] addressed a critical gap by questioning the dual-credits policy’s feasibility in achieving sustainable NEV market growth, highlighting concerns that rapid NEV production might outpace consumer demand. While this study identifies potential market risks, it lacks a system-based approach to test policy adjustments or evaluate how NEV adoption might respond dynamically to changing policy variables.
In addition to policy-specific studies, several works have examined broader factors influencing NEV adoption. The authors of [4] compared consumer preferences in the U.S. and China, demonstrating how financial incentives play a vital role in NEV adoption. Zhu et al. [19] employed a system dynamics model to study the impact of subsidies on electric vehicle (EV) charging infrastructure in China, highlighting the role of infrastructure in fostering NEV adoption. This study underscores the importance of a systemic perspective but is limited to charging infrastructure and does not explore other policy influences, such as credit trading or consumer purchase behavior. While these studies provide critical insights into different facets of NEV adoption, they are often confined to isolated policy aspects or specific stakeholder impacts. Most notably, few studies integrate the complex, feedback-driven relationships among automakers, government regulators, and consumers within China’s NEV market. This research gap indicates the need for a system-wide, quantitative approach that captures the dynamic impacts of policy interactions over time, including how policy changes might affect NEV adoption and CAFC compliance in the long term.
To address these limitations, this study employs a System Dynamics (SD) modeling approach, adapted from [10] and tailored to China’s NEV and CAFC credit requirements. By including automaker production decisions, government policy adjustments, and consumer purchasing preferences, the SD model simulates the interactions of key stakeholders as an integrated system. This approach allows us to assess how changes in NEV credits and CAFC standards could influence NEV market share, total vehicle emissions, and long-term sustainability goals under various policy scenarios. Our SD model is specifically designed to capture the feedback mechanisms that drive consumer preferences and automaker responses, offering a more comprehensive understanding of the dual-credit policy’s impact than previous static or isolated models. By simulating policy adjustments over multiple scenarios, this study addresses the uncertainties highlighted by [14] and others, providing insights that can inform policymakers on how to balance NEV production targets with sustainable market demand.
In summary, this study contributes to the literature by advancing a whole-system perspective on NEV mandate policy impacts, filling a critical gap in understanding the policy’s dynamic influence on market adoption and sustainability outcomes. Through this integrated approach, the study offers new insights into how NEV and CAFC credits can be optimized to promote a balanced, long-term growth trajectory for China’s NEV market.

3. Method

3.1. Relationships Between Policy Rules and Vehicle Markets

3.1.1. Relationships Between CAFC Credits Policy and Vehicle Markets

The NEV mandate policy includes two components, the CAFC credits policy and the NEV credits policy. Section 3.1.1 and Section 3.1.2 will introduce the detailed rules in terms of CAFC credits and NEV credits and qualitatively analyze the relationships between policy rules and vehicle markets.
The calculation of CAFC credits of passenger vehicle enterprises includes three parameters: the target value, the reaching value, and the actual value of the average fuel consumption of the enterprise. As shown in Figure 1, the CAFC credits of the passenger car enterprise are calculated through multiplying the difference between the reaching value and the actual value of the average fuel consumption by the passenger car production or the import volume. If the actual value is lower than the reaching value, positive credits will be generated, otherwise, negative credits will be generated. The NEV mandate policy requires the CAFC credits to be positive, and the CAFC positive credits can be carried forward at a certain rate each year. If the CAFC credits are negative, the CAFC positive credits previously carried forward or NEV positive credits can be used to compensate. The compensation ratio between the NEV credits and CAFC credits is one to one.

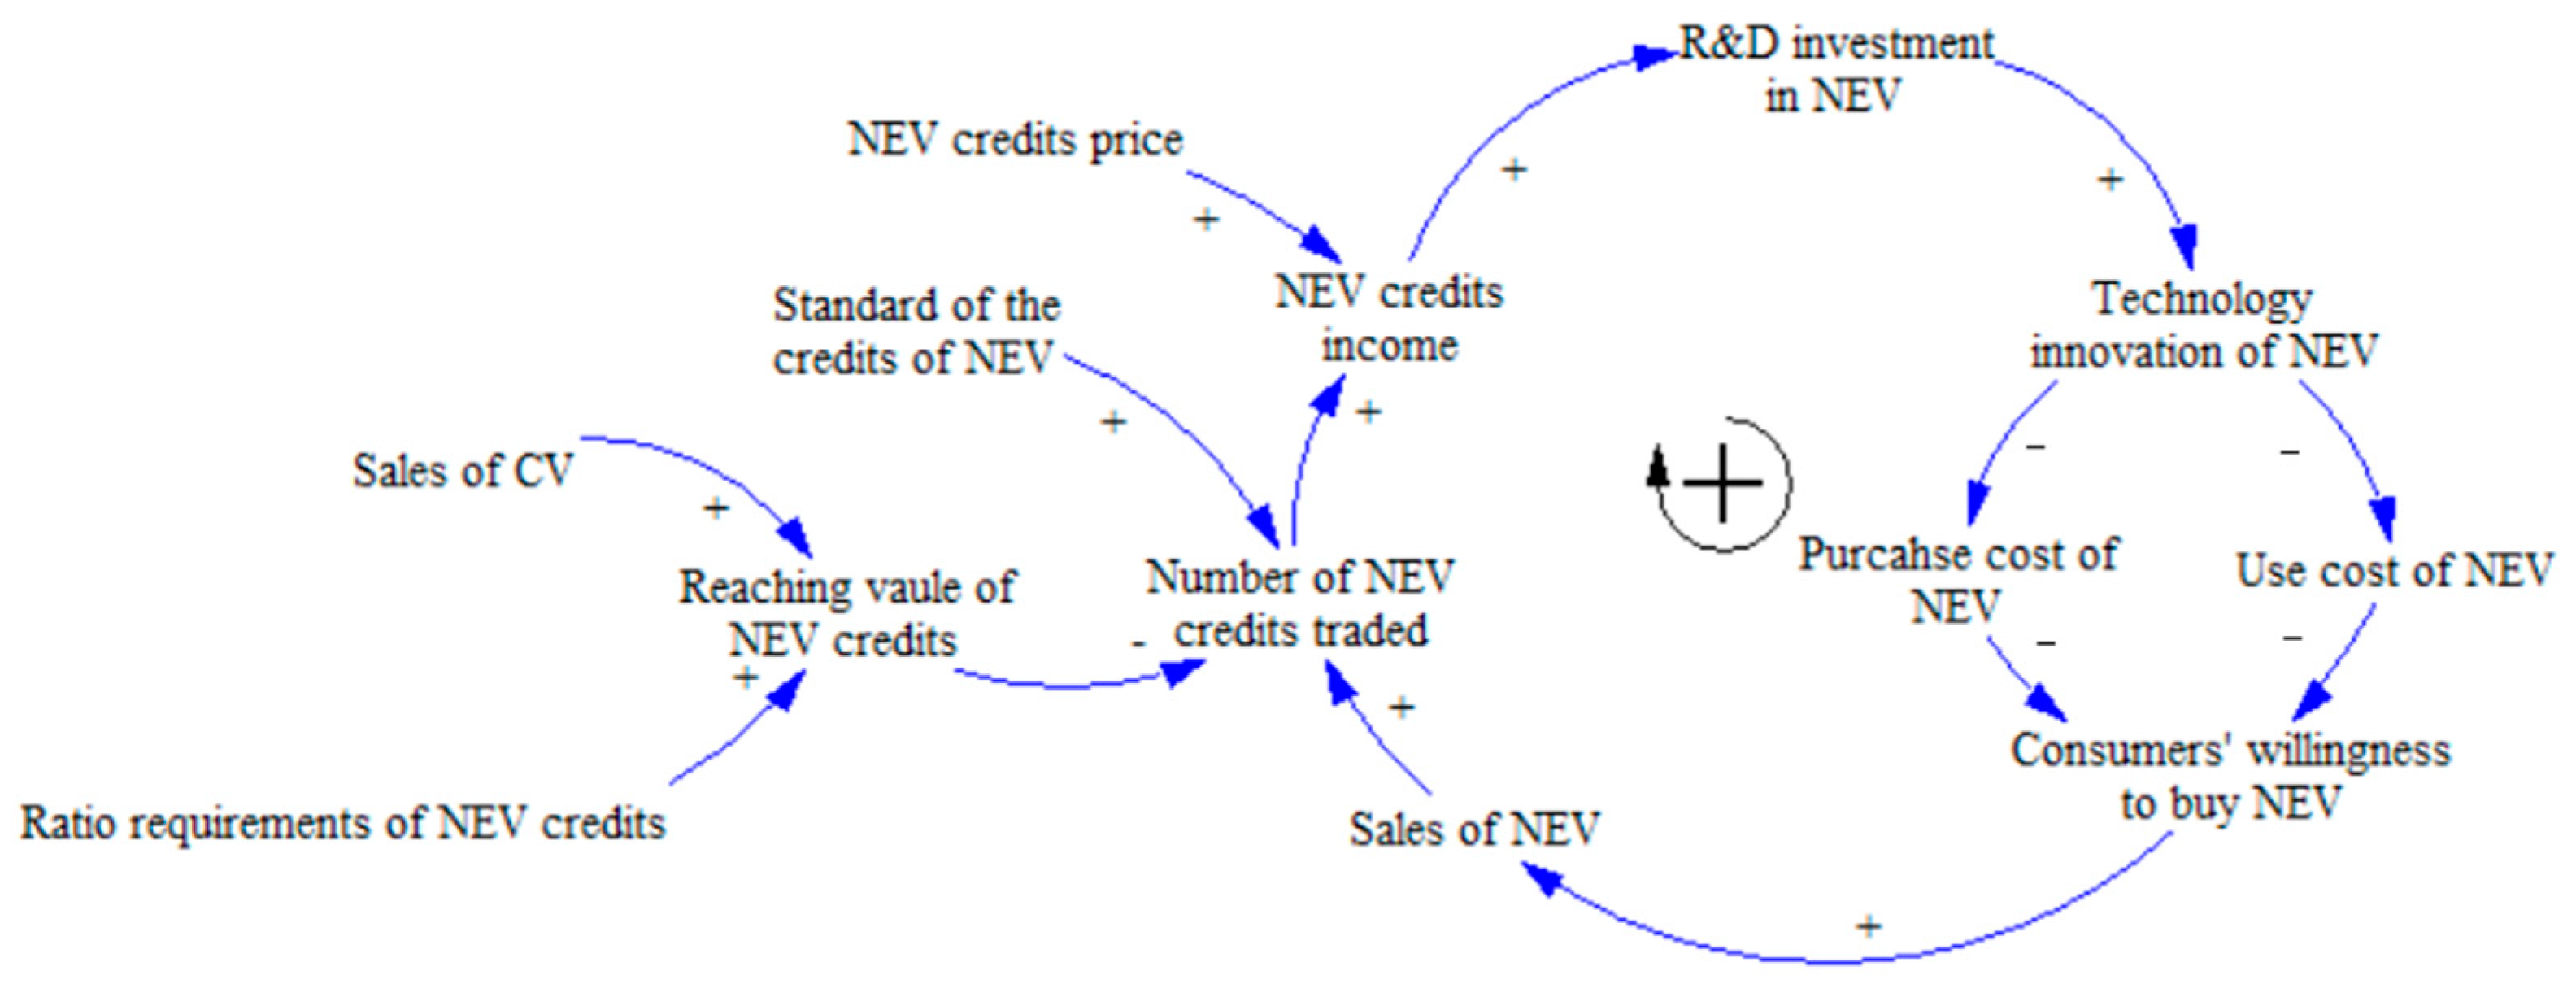
3.1.2. Relationships Between NEV Credits Policy and Vehicle Markets

The calculation of new energy vehicle (NEV) credits includes two parameters: the actual value and the reaching value of NEV credits. Appendix A shows the standard details of the NEV credits. Compared with the credits standard from 2019 to 2020, the credits standard of BEVs and PHEV from 2021 to 2023 are reduced by 50% and 20%, respectively. The credits standard of NEV becomes increasingly strict.
The NEV credits of a passenger vehicle enterprise is the difference between the reaching value and the actual value of NEV credits. If the actual value is higher than the reaching value, positive NEV credits will be generated and vice versa. The NEV mandate policy requires the NEV credits of enterprises to be positive. Automakers produce NEVs to generate NEV credits, and after completing the NEV credits target, the surplus credits can be used to offset negative CAFC credits or transactions [20,21,22,23]. The number of NEV credits traded is affected by the reaching value and actual value of the NEV credits. The reaching value of NEV credits is determined by the enterprise’s CVs production and annual NEV credits proportion requirement. The actual value of NEV credits is related to the vehicle type, driving range, and amount of NEVs produced by the enterprise. The NEV credits’ trading income can be calculated through multiplying the number of NEV credits traded by the price of these credits.
The NEV credits trading income can subsidize the R&D investment of NEVs, which promotes the innovations of NEVs’ key technologies. With these technologies developing, the purchase and use cost of NEVs are reduced. Cost drops lead to the purchase price of NEVs falling. Therefore, consumers’ willingness to buy new energy vehicles will be increased. Finally, the sales of NEVs are improved and a positive feedback loop is formed, as shown in the reinforcing the closed loop in Figure 2.
In summary, the function of NEV mandate policy has two major effects. One is to drive the innovation and development of NEVs’ key technologies and CVs’ energy-saving technologies, the other is to promote the market expansion of NEVs and fuel-saving CVs.

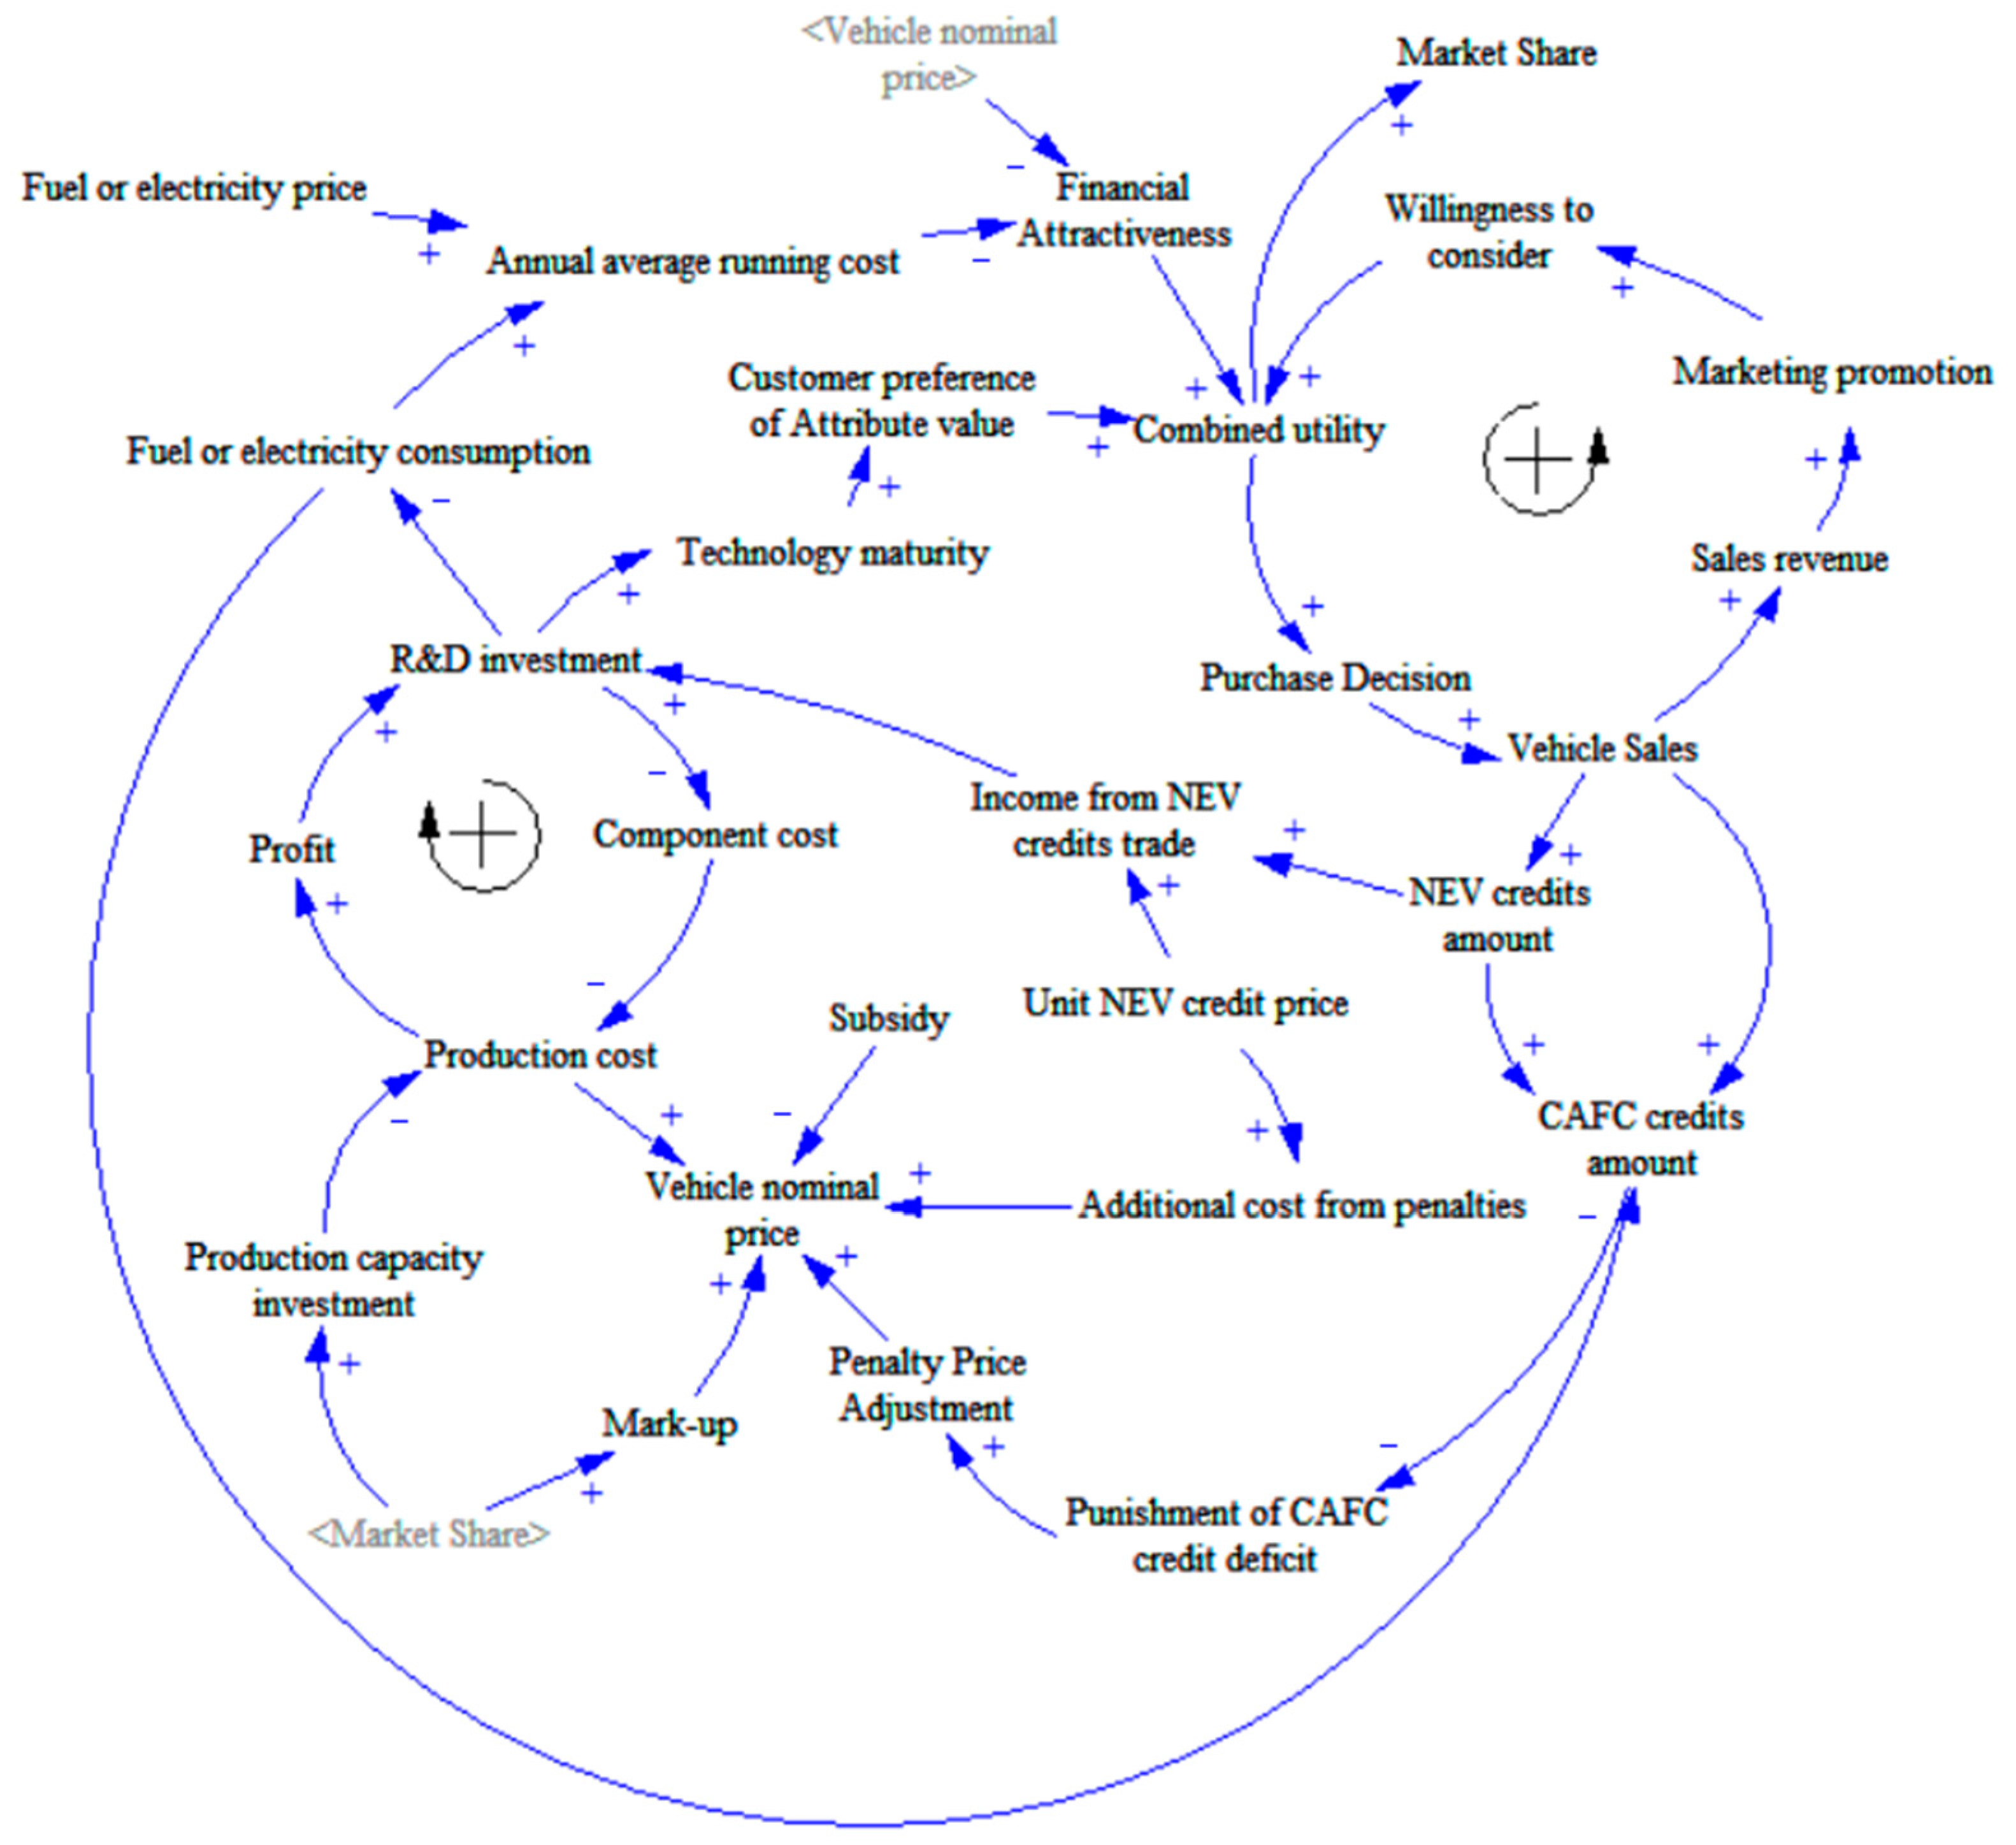
3.2. System Dynamics Model Overview

This paper builds on the work by Harrison et al. [14] and establishes the SD model for the Chinese automobile industry, running the simulation experiment by the software Vensim (10.2.2). Harrison et al. [14] designed PTTMAM (Powertrain Technology Transition Market Agent Model) to capture the key feedbacks and interactions between manufacturers, authorities, infrastructure providers, and users across the 28 EU member states and 16 powertrain options available in the light-duty vehicle market. However, in our research, we concentrate on the behaviors and relationships among manufacturers, governments, and consumers. We focus on the sales of Chinese passenger vehicles with three powertrain options (BEV, PHEV, CV). The research on the users’ agent group, manufactures’ agent group, and authorities’ agent group of PTTMAM is referred to and adjusted to in our model. In addition, the influence of NEV and CAFC credits are introduced in our model. In summary, this paper took key components of the PTTMAM to establish a new SD model based on the Chinese vehicle market, considering the NEV and CAFC policy rules.
The SD model built in this paper contains the government, automakers, and consumers as the three main agents. Automobile manufacturers are considered as a whole sector rather than individual OEMs, and the same applies to governments and customers. Among these three main agents, the consumers’ purchase decision-making behaviors and the companies’ R&D behaviors are the two main reinforcing causality cycles affected by NEV mandate policy.
Figure 3 is the overview figure of the SD model and not a causal loop diagram. In addition, subscripts are a particular feature of the Vensim simulation tool enabling repetition of structure. There are four crucial subscript ranges used in our SD model, and they are shown in Table 1. The passenger vehicle detail categories are defined and presented in Appendix B.

3.3. Consumer Purchase Decision

The causal cycle of consumers’ purchase decision-making behavior is that consumers’ decision to purchase a certain type of car depends on the comprehensive utility of this car. The greater the comprehensive utility the car has, the more consumers will buy it [24,25,26,27]. The larger sales volume creates more sales revenue, so the enterprise will invest more funds in the market promotion of their best-selling vehicles. As a result, the best-selling vehicles have a great reputation, which encourages more consumers to purchase them. In the end, a reinforcing feedback cycle was formed, as shown in Figure 3.
Market shares of those vehicles types (including CV-S, CV-M, CV-L, BEV-200, BEV-300, BEV-400, PHEV-M, and PHEV-L) are calculated by using a choice model, which has been widely employed for the determination of vehicle purchase, to assess the relative utility of different vehicle types [28,29,30]. As seen in Equation (1), a Multinomial Logit (MNL) model is employed to describe the discrete choice of customers [31,32,33]. It is assumed that group selection is kept with individual selection. That is, the greater the combined utility of a type of vehicle, the higher the possibility of the user purchasing it. As a result, the vehicle whose combined utility is higher will be sold more.
M a r k e t   S h a r e p , s = e C o m b i n e d   U t i l i t y p , s   p e C o m b i n e d   U t i l i t y p , s   .
The combined utility in Equation (2) contains a few aspects, including the willingness to consider (WTC), financial attractiveness, values of attributes (Environment, Performance, Reliability, Safety, Convenience, Popularity, Choice) of vehicle types and the preferences of users towards the importance of these attributes. The combined utility of vehicles evolves over time due to the evolution of these parameters.
C o m b i n e d   u t i l i t y p , s = A ( A t t r i b u t e   v a l u e p , A × A t t r i b u t e   i m p o r t a n c e A )   × W i l l i n g n e s s   t o   c o n s i d e r p × F i n a n c i a l   a t t r a c t i v e n e s s p , s .
Willingness to consider: This concept, originally proposed by Struben and Sterman [34], has been incorporated into our SD model to represent the process through which a specific vehicle platform enters a consumer’s consideration set. In the context of purchasing behavior, willingness to consider reflects an emotional and socially cognitive process. Consumers must acquire sufficient information through market exposure and word-of-mouth to develop a favorable emotional inclination. In our SD model, this metric ( W i l l i n g n e s s   t o   c o n s i d e r p ) is positively influenced by social exposure and gradually diminishes over time due to consumers’ natural tendency to forget.
Financial attractiveness: As a critical determinant of combined utility, financial attractiveness is inversely related to the total cost of ownership (TCO) of a specific powertrain relative to the average TCO of all powertrains. Perceived TCO comprises two primary elements: the nominal vehicle price and the cumulative running costs during vehicle usage. The nominal price depends on factors such as production costs, NEV subsidies, vehicle license plate fees, purchase tax rates, manufacturers’ efforts to mitigate policy penalty risks, additional costs arising from penalties, and profit margin adjustments required for capacity utilization. Annual running costs encompass expenses such as fuel, maintenance, parking fees, road tolls, vehicle and vessel use taxes, insurance premiums, as well as congestion and driving restriction costs.
Penalty price adjustment, additional costs from policy penalty, and price mark-ups are not directly linked to the decision-making sphere of the individual. These variables are further affected by governments’ policies and vehicle manufacturers. However, as shown in Equation (5), these variables are in connection with vehicles’ nominal prices, which have an influence on financial attractiveness in the consumers’ decision-making. Hence, penalty price adjustment, additional costs from policy penalty, and price mark-ups are related to the consumers’ decision-making indirectly and are only mentioned here. The three variables are explained in detail in Section 3.4, “Enterprises’ research and development behaviors”.
F i a n c i a l   a t t r a c t i v e n e s s P , S = ( T C O P , S A v e r a g e   T C O P , S ) 1
T C O P , S = V e h i c l e n o m i n a l   p r i c e P , S + A n n u a l   a v e r a g e   r u n n i n g   c o s t P , S ×                   A v e r a g e   y e a r s   k e p t
V e h i c l e n o m i n a l   p r i c e P , S = U n i t   p r o d u c t i o n   c o s t P , S × ( 1 + P r i c e   M a r k u p P , S ) × ( 1 + P e n a l t y   p r i c e   a d j u s t m e n t P ) × ( 1 + p u r c h a s e   t a x P ) + C o s t   o f   V e h i c l e   l i c e n s e   p l a t e P + A d d i t i o n a l   c o s t s   f r o m   p o l i c y   p e n a l t y P S u b s i d y P
T C O P , S = V e h i c l e n o m i n a l   p r i c e P , S + A n n u a l   a v e r a g e   r u n n i n g   c o s t P , S ×                   A v e r a g e   y e a r s   k e p t
Attributes characterizing vehicles: Seven key attributes—Environment, Performance, Reliability, Safety, Convenience, Popularity, and Choice—are used to define vehicle characteristics. These attributes encapsulate the factors shaping consumer preferences, ultimately influencing market share. Each attribute is assigned a score ranging from 0 to 1, varying by powertrain type and vehicle size, with the relative scores across attributes playing a critical role in shaping market dynamics.
Technical attributes, including Environment, Performance, Reliability, and Safety, are primarily influenced by the advancement of technology, which depends on R&D investments by automotive manufacturers. As technological innovation progresses, these scores improve, reflecting enhancements in vehicle capabilities. The Environment attribute assesses a vehicle’s environmental impact, particularly in terms of CO2 emissions. Lower emissions result in a higher Environment score, making it a key indicator for environmentally conscious consumers. Reliability and Safety represent consumer confidence in a vehicle’s operational stability and its ability to ensure occupant protection in various scenarios. Performance is a composite measure of interior space, comfort, trunk capacity, handling, top speed, and acceleration. These features are influenced by powertrain configuration, with higher-performing vehicles achieving scores closer to 1, reflecting their superior driving experience across multiple performance dimensions.
The Convenience attribute is determined by the adequacy of infrastructure support, such as the availability and accessibility of charging or fueling stations. Two terms are used to evaluate infrastructure conditions: Actual Effective Infrastructure and Reference Effective Infrastructure. Actual Effective Infrastructure refers to the existing, functional infrastructure supporting a specific powertrain (e.g., the number of operational charging stations for electric vehicles). In contrast, Reference Effective Infrastructure serves as a benchmark, representing the ideal level of infrastructure required to facilitate consumer adoption. Convenience scores are higher for powertrains with greater Actual Effective Infrastructure relative to the Reference Effective Infrastructure, as improved accessibility enhances usability for consumers.
Popularity reflects the representation of each powertrain type within the overall vehicle fleet. It is calculated as the share of the total fleet occupied by a given powertrain type. Higher prevalence translates into increased popularity, as widespread visibility of a particular powertrain positively influences consumer perceptions and adoption rates.
Choice represents the diversity of vehicle options available for each powertrain type, measured by the number of vehicle models in production. A wider selection of options results in a higher Choice score, reflecting greater flexibility and appeal for consumers in selecting a vehicle that meets their preferences.
Together, these attributes provide a comprehensive framework for evaluating vehicle characteristics. They are integrated into the model to analyze how the interplay between evolving vehicle technologies and shifting consumer preferences influences market trends over time.
T e c h n i c a l a t t r i b u t e   v a l u e P , A = I n i t i a l   t e c h n i c a l   a t t r i b u t e   v a l u e P , A + ( 1 I n i t i a l   t e c h n i c a l   a t t r i b u t e   v a l u e P , A ) × I n p r o v e m e n t   b y   T e c h n o l o g y   m a t u r i t y P , A
C o n v e n i e n c e   v a l u e P = T e c h n i c a l   C o n v e n i e n c e   v a l u e P × ( A c t u a l   e f f e c t i v e   i n f r a s t r u c t u r e P R e f e r e n c e   e f f e c t i v e   i n f r a s t r u c t u r e ) S e n s i t i v i t y   o f   c o n v e n i e n c e   t o   e f f e c t i v e   i n f r a s t r u c t u r e
P o p u l a r i t y P = ( S t o c k   s h a r e P B a s e   p r e v a l e n c e   f o r   p o p u l a r i t y ) S e n s i t i v i t y   o f   p o p u l a r i t y   t o   p r e v a l e n c e
C h o i c e   v a l u e P , S = ( M a r k e t   s h a r e P , S M a r k e t   s h a r e   f o r   b a s e   c h o i c e   a v a i l a b i l i t y ) S e n s i t i v i t y   o f   a v a i l a b i l i t y   t o   s a l e s

3.4. Enterprises’ Research and Development Behaviors

The NEV mandate policy promotes enterprises investing their money in R&D of innovative technologies. The produce costs of NEVs’ core components will decline continuously with breakthroughs in NEVs’ key technologies. As a result, the benefit from costs declines and NEV credits selling enable automakers to obtain more profits, so more funds will be invested in R&D from NEVs. Finally, enterprises’ investment and R&D behaviors reinforcing loop take shape, as shown in Figure 3.
Vehicle production. The production capacity of automobile manufacturers is represented as a stock, governed by both expansion and contraction rates. If production capacity utilization remains consistently below the reference level over an extended period, adjustments become necessary to address potential overcapacity. Expansion of production capacity is driven by investments in new facilities, particularly for NEVs, as manufacturers aim to comply with regulatory requirements and avoid penalties. Increasing NEV production capacity also contributes to cost reductions, facilitated by economies of scale and the “learning by doing” effect, where accumulated production experience enhances manufacturing efficiency.
Price mark-up. The price mark-up, defined as the percentage added to the base production cost to determine the final vehicle price, is dynamically adjusted based on production capacity utilization and inflation. When capacity utilization falls below the reference level, manufacturers lower the price mark-up to boost sales and improve utilization. Conversely, if capacity utilization exceeds the reference level, the mark-up is raised to moderate demand and prevent overextension of production capacity. These adjustments occur with a response delay, ensuring alignment with market demand and production conditions [35,36,37]. Inflation also plays a role in mark-up adjustments by influencing both production costs and consumers’ purchasing power. The model incorporates inflation-induced cost variations and adjusts mark-up rates to maintain profitability while mitigating potential negative impacts on consumer demand.
By strategically balancing production capacity and pricing mechanisms, manufacturers can optimize vehicle output and respond effectively to shifting market dynamics. This approach enables them to manage overcapacity risks, adapt to regulatory pressures, and ensure long-term profitability in a dynamic automotive market.
P r o d u c t i o n c a p a c i t y P , S = I n i t i a l   p r o d u c t i o n   c a p a c i t y P , A + 0 t ( P r o d u c t i o n   c a p a c i t y   i n c r e a s e   r a t e P , S   P r o d u c t i o n   c a p a c i t y   d e c r e a s e   r a t e P , S )
P r o d u c t i o n   c a p a c i t y   d e c r e a s e   r a t e P , S = P r o d u c t i o n   c a p a c i t y P , S × R e f e r e n c e   a d j u s t m e n t   f o r   u t i l i s a t i o n × ( B a s e   u t i l i z a t i o n C u r r e n t   u l i t i z a t i o n R e f e r e n c e   u t i l i z a t i o n   d i s c r e p a n c y ) S e n s i t i v i t y   o f   c a p a c i t y   a d j u s t m e n t   t o   u t i l i z a t i o n
P r o d u c t i o n   c a p a c i t y   i n c r e a s e   r a t e P , S     = I n v e s t m e n t   i n   n e w   c a p a c i t y P , S U n i t   c a p a c i t y   i n v e s t m e n t   c o s t P , S     × ( U n i t   p o l i c y   p e n a l t y P U n i t   c a p a c i t y   i n v e s t m e n t   c o s t P , S ) S e n s i t i v i t y   o f   c a p a c i t y   a d j u s t m e n t   t o   p o l i c y   p e n a l t y
U n i t   p r o d u c t i o n   c o s t P , S = B a s e   f i x e d   c o s t P , S × E c o n o m y   o f   s c a l e P + G l i d e r   c o s t P , S + ( C t L e a r n i n g   e f f e c t C t × I n i t i a l   c o m p o n e n t   c o s t C t ) × E c o n o m y   o f   s c a l e C t
E c o n o m y   o f   s c a l e P = E c o n o m y   o f   s c a l e   a t   c u r r e n t   c a p a c i t y P R e f e r e n c e   p r o d u c t i o n   c a p a c i t y × M a x i m u m   e f f e c t
L e a r n i n g   e f f e c t C t = ( C u m u l a t i v e   m a n u f a c t u r e C t M i n i m u m   p r o d u c t i o n ) L O G 2 ( 1 F r a c t i o n a l   r e d u c t i o n C t )  
P r i c e   M a r k u p P , S = ( P r o d u c t i o n   c a p a c i t y   u t i l i z a t i o n P , S B a s e   u t i l i z a t i o n   f o r   a d j u s t m e n t ) S e n s i t i v i t y   o f   p r i c e   a d j u s t m e n t   t o   u t i l i z a t i o n × N o r m a l   p r i c e   m a r k u p × I n f l a t i o n
Price adjustment due to policy penalty. The price of a single NEV credit is determined by the incremental unit production cost relative to conventional vehicles (CVs) and the per-vehicle NEV credit value, which can be further amplified by a government-imposed penalty multiplier. In practice, the costs incurred from purchasing NEV credits are typically passed on to the price of NEVs. The substantial financial implications of policy penalties incentivize automakers to strategically adjust vehicle pricing, aiming to stimulate NEV sales and reduce the risk of incurring penalties.
N E V   c r e d i t   P r i c e E V , S = U n i t   p r o d u c t i o n   c o s t N E V , S U n i t   p r o d u c t i o n   c o s t C V , S   P e r v e h i c l e   N E V   c r e d i t N E V , S
U n i t   p o l i c y   p e n a l t y C V = M o d i f i e r   f o r   p e n a l t y × U n i t   N E V   c r e d i t   P r i c e
A d d i t i o n a l   c o s t s   f r o m   p o l i c y   p e n a l t y C V = U n i t   N E V   c r e d i t   P r i c e C r e d i t   d e f i c i t   S a l e s C V
P e n a l t y   p r i c e   a d j u s t m e n t C V = B a s e   P e n a l t y   p r i c e   a d j u s t m e n t × ( U n i t   P o l i c y   P e n a l t y C V × C r e d i t   d e f i c i t S U n i t   p r o d u c t i o n   c o s t C V , S × S a l e s C V , S ) S e n s i t i v i t y   o f   p r i c e   a d j u s t m e n t   t o   p e n a l t y
R&D investment. The relationship between cumulative R&D investment to technology maturity is governed by a standard assumed S-shaped lookup table. In the Chinese automobile industry, 1.81% of the annual total revenue is spent on R&D investment [38]. The distribution of annual R&D investment is dependent on market prospects and adjusted due to policy penalty. Furthermore, enterprises will invest their surplus credit trading income into the R&D investment [39,40].
R & D   I n v e s t m e n t = A n n u a l   R & D   I n v e s t m e n t × P o w e r t a i n   s h a r e   o f   R & D P + C r e d i t   s u r p l u s × U n i t   N E V   c r e d i t   p r i c e
P o w e r t a i n   s h a r e   o f   R & D P = P o w e r t a i n   a t t r a c t i v e n e s s   o f   R & D P   P P o w e r t a i n   a t t r a c t i v e n e s s   o f   R & D P
P o w e r t a i n   a t t r a c t i v e n e s s   o f   R & D P = F u t u r e   s a l e s P × ( 1 T e c h n o l o g y   m a t u r i t y P ) × ( 1                 R & D   A d j u s t m e n t   t o   p e n a l t y P )
R & D   A d j u s t m e n t   t o   p e n a l t y P = ( U n i t   N E V   c r e d i t   P r i c e × C r e d i t   d e f i c i t A n n u a l   R & D   I n v e s t m e n t ) S e n s i t i v i t y   o f   R & D   a d j u s t m e n t   t o   p e n a l t y

4. Parameters and Data

The adopted SD model encompasses hundreds of parameters, including equations and data inputs, resulting in thousands of interconnected elements. Wherever possible, publicly available data related to the Chinese automotive industry are utilized, sourced from official statistics, the scientific literature, and announcements from OEMs. For data gaps, reasonable assumptions are applied. A detailed list of these parameters is provided in Appendix C and Appendix D [41,42,43].
Appendix C outlines input parameters related to the total cost of ownership (TCO) for various vehicle categories, while Appendix D contains input parameters for the seven attributes that characterize vehicles, as discussed in Section 3.2. The parameters in Appendix D are derived from the original model presented in Harrison’s research, whereas the parameters in Appendix C are newly developed to reflect the specific conditions of the Chinese market and have been integrated into our SD model. The sensitivity analysis for key parameters is provided in Appendix E.

5. Results

The results of this study focus on the impact of varying NEV credit requirements and CAFC standards on the NEV market in China, with projections extending to 2030. We present the findings in three main areas: the projected sales trends of NEVs and conventional vehicles (CVs), the impact of different policy scenarios on market share, and the role of tighter NEV credits standards and increased credits ratios in driving market growth. The results are structured to illustrate the effects of these policy adjustments under different conditions, offering insights into the long-term impact of the NEV mandate policy on the Chinese automotive market.

5.1. Effectiveness of NEV Mandate Policy Under Basic Scenario

To evaluate the impact of the current NEV mandate policy on China’s automotive market, this study established a baseline scenario where the NEV credits ratio requirements and credit standards are defined according to existing policy. The NEV credits ratio refers to the proportion of new energy vehicles that each automaker must produce annually, expressed as a percentage of their total production. The credits standard, on the other hand, specifies the number of credits assigned to each NEV based on its characteristics, such as energy efficiency and range, with higher-performing vehicles earning more credits. Although the NEV mandate policy was formally introduced on 1 April 2018, the specific requirements for credits ratios and standards took effect in 2019, making 2018 a transition year during which policy impacts were not yet observable. Under the policy, the NEV credits ratio requirements are set to increase incrementally, starting from 10% in 2019 and reaching 18% by 2023, with the detailed credits standards for different vehicle types provided in Appendix A. For this baseline scenario, we assume that the NEV mandate policy framework will remain constant from 2024 onward, as presented in Table 2.
In addition, our baseline scenario explicitly incorporates other relevant pro-NEV policies, including the national and provincial subsidies for charging infrastructure and the national fuel economy standards. The national and provincial subsidies for charging infrastructure are modeled based on the assumption that the government will gradually reduce these subsidies from 2019 to 2030. As is shown in Table 3, national subsidies start at CNY 160 per kW for 2019–2020 and decrease to CNY 70 per kW by 2026–2030. Provincial subsidies begin at CNY 150 per kW in 2019–2020 and reduce to CNY 90 per kW by 2026–2030. These subsidies play a crucial role in promoting the development of charging infrastructure and enhancing the overall efficiency of NEVs, which directly influences market dynamics and accelerates the adoption of NEVs. Therefore, the impact of the NEV mandate policy on our model is analyzed while accounting for these complementary policies.

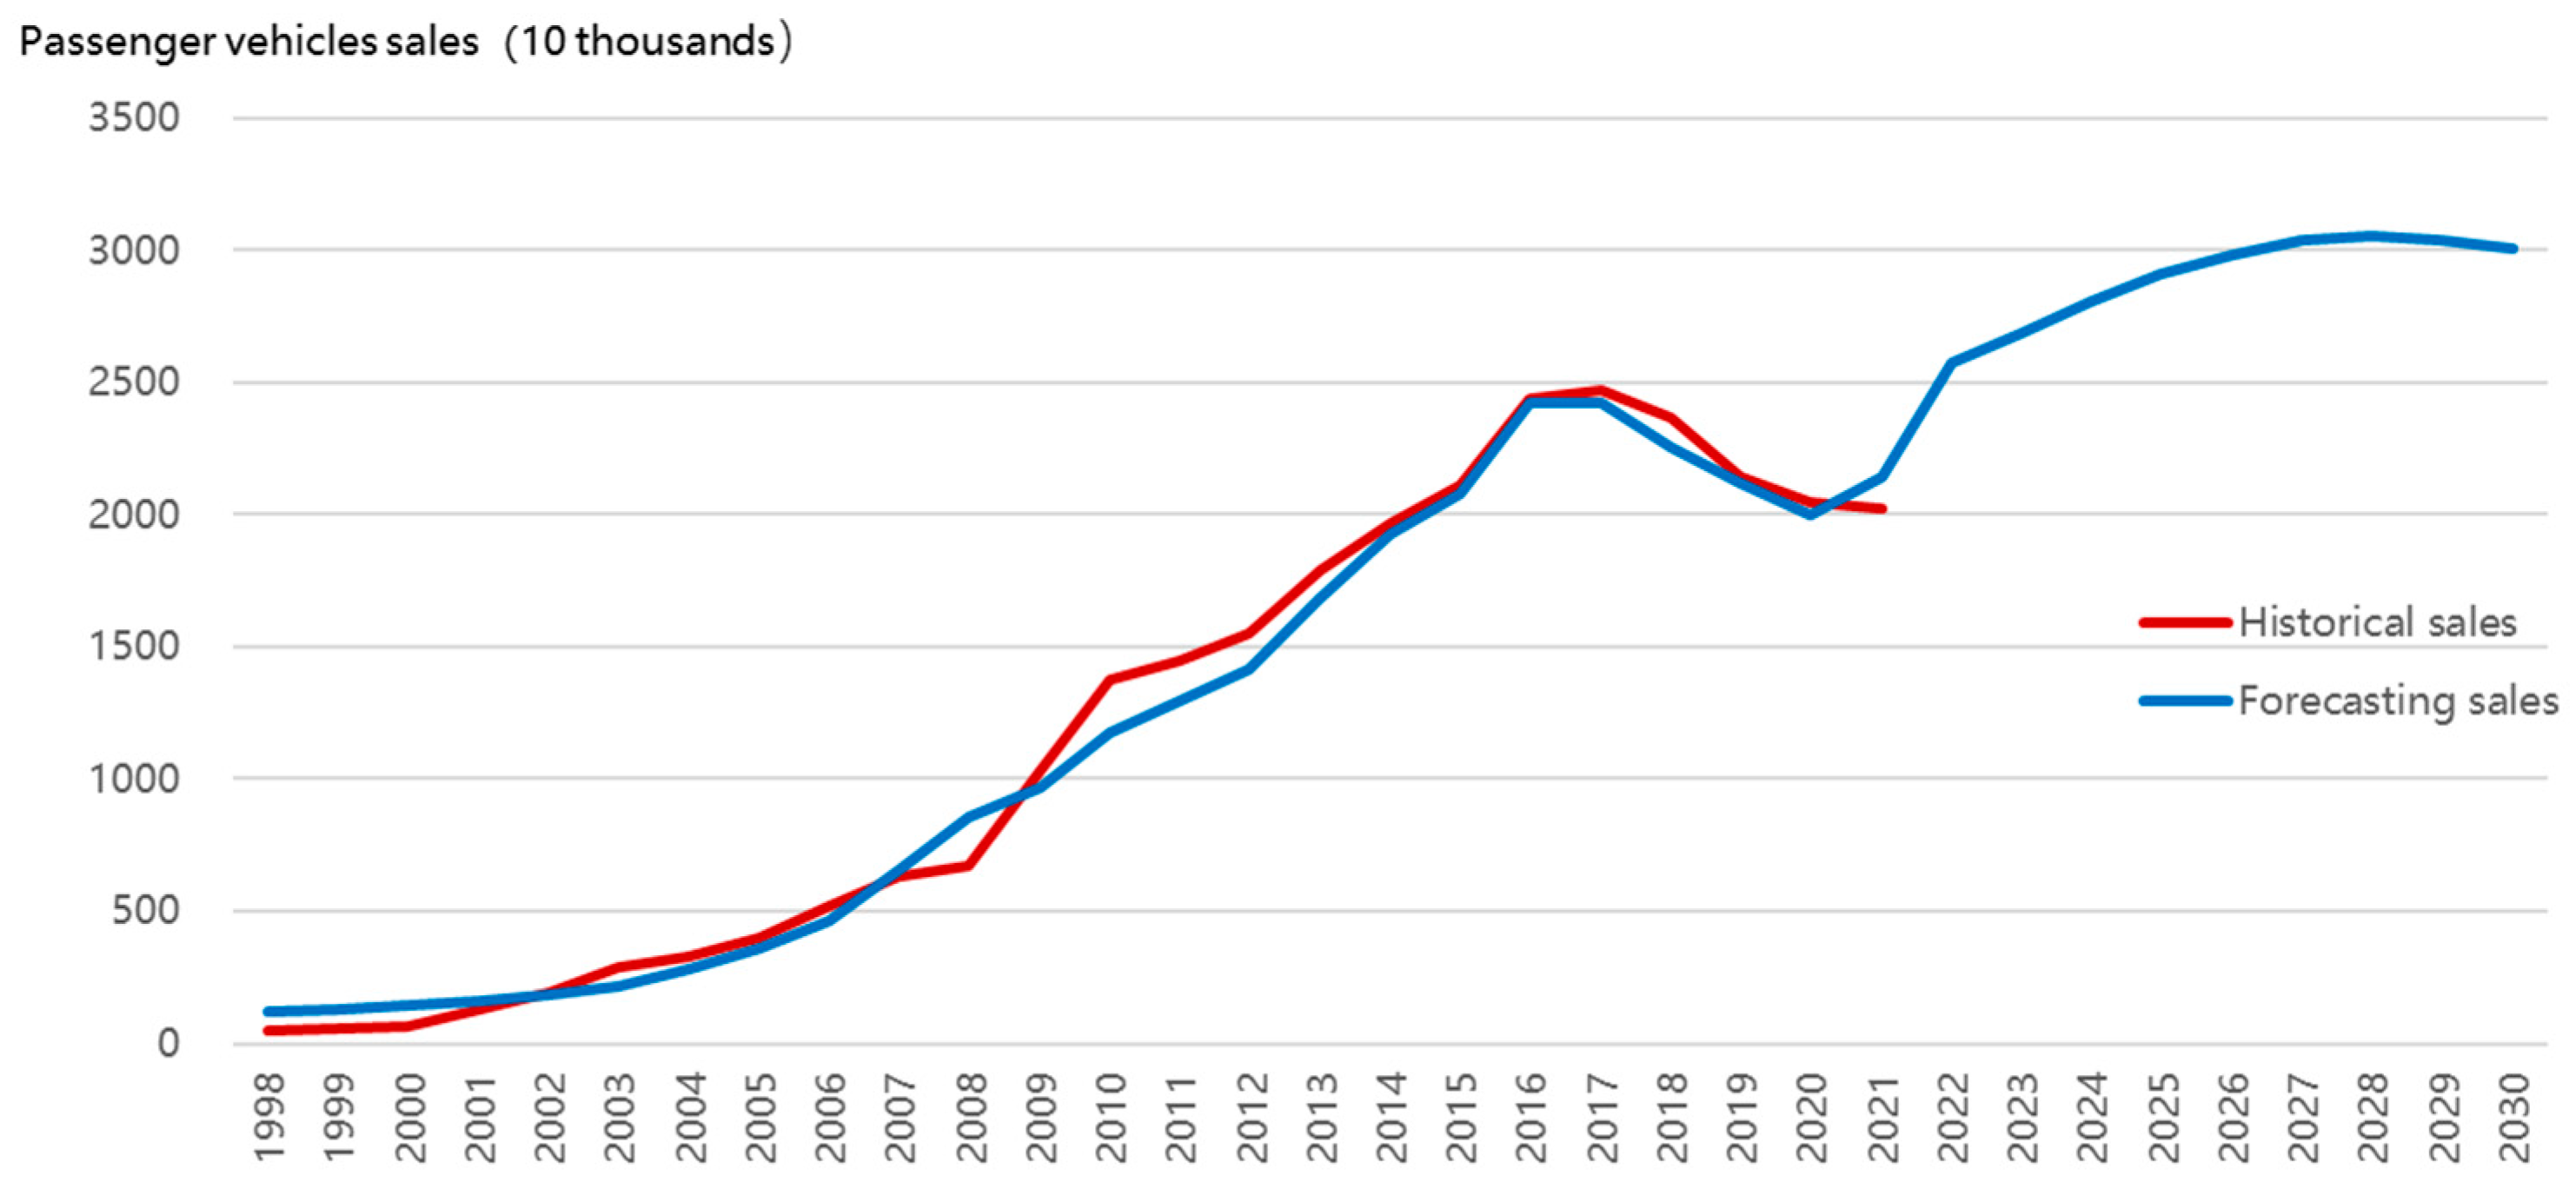
5.1.1. Overall Sales Trend of Passenger Vehicles

To project total sales of passenger vehicles in China, this study applied the Gompertz curve model, represented by Equation (26).
P a s s e n g e r   v e h i c l e s   t o t a l   s a l e s = γ e α × exp ( β × rGDP )
In this equation, the independent variable is China’s per capita GDP, while the dependent variable is the total sales of passenger vehicles. The nonlinear fitting of the Gompertz curve was conducted using SPSS software (25.0) with quarterly data on sales and GDP from 1998 to 2008, resulting in parameters of α = −4.672, β = −2.35 × 10⁻⁴ and γ = 664.116, with an R-squared value of 0.953. Assuming annual per capita GDP growth of 6–7% after 2018, the total sales of Chinese passenger vehicles can be forecasted. This projection function was incorporated into the SD model. Combining total sales from Equation (26) with market share from Equation (1), sales for each vehicle type can be calculated using Equation (27):
V e h i c l e   S a l e s p , s = P a s s e n g e r   v e h i c l e s   t o t a l   s a l e s   M a r k e t   S h a r e p , s
Figure 4 displays the overall sales trend of passenger vehicles in China, indicating that sales will reach approximately 30.04 million units by 2030. This projection considers expected GDP growth, with the SD model capturing the cumulative effect of per capita GDP increase on passenger vehicle sales over time.

5.1.2. Sales Trend of NEVs and CVs

In the basic scenario, the complete elimination of subsidies in 2023 is expected to cause a rebound in NEV prices, leading to a temporary decline in NEV sales growth, as shown in Figure 5. However, the NEV mandate policy significantly supports the Chinese NEV market, stabilizing NEV market share by 2024. Long-term projections indicate an upward trend, with NEV sales forecasted to reach approximately 7.7 million units by 2025 and 15.0 million units by 2030. The accuracy of these projections can be compared with actual market data, as shown in Appendix F.
It should be noted that while the implementation of the NEV mandate policy roughly coincided with the phase-out of direct subsidies, the two policies coexisted for a period of time. For instance, the direct purchase subsidies were phased out in 2023, but the exemption of purchase tax was extended until the end of 2025. Since the impact of the tax exemption policy on NEV prices is relatively small, it has not been considered in this model. Nevertheless, the NEV mandate policy plays a significant role in supporting the NEV market. Figure 5 illustrates the NEV sales trajectory from 2019 to 2030. Although the removal of subsidies caused a temporary drop in the growth rate in 2023, the NEV mandate policy stabilized the market share by 2024 and contributed to a positive long-term growth trend.
As NEV sales volume and market share continue to rise due to the NEV mandate policy, the market share of conventional fuel vehicles (CVs) declines, as shown in Figure 6. This figure displays the downward trajectory of CV sales, indicating that by 2030, CV market share will decrease to approximately 50%. The continued decrease in CV sales reflects the shifting consumer preference towards NEVs under the influence of the mandate policy.

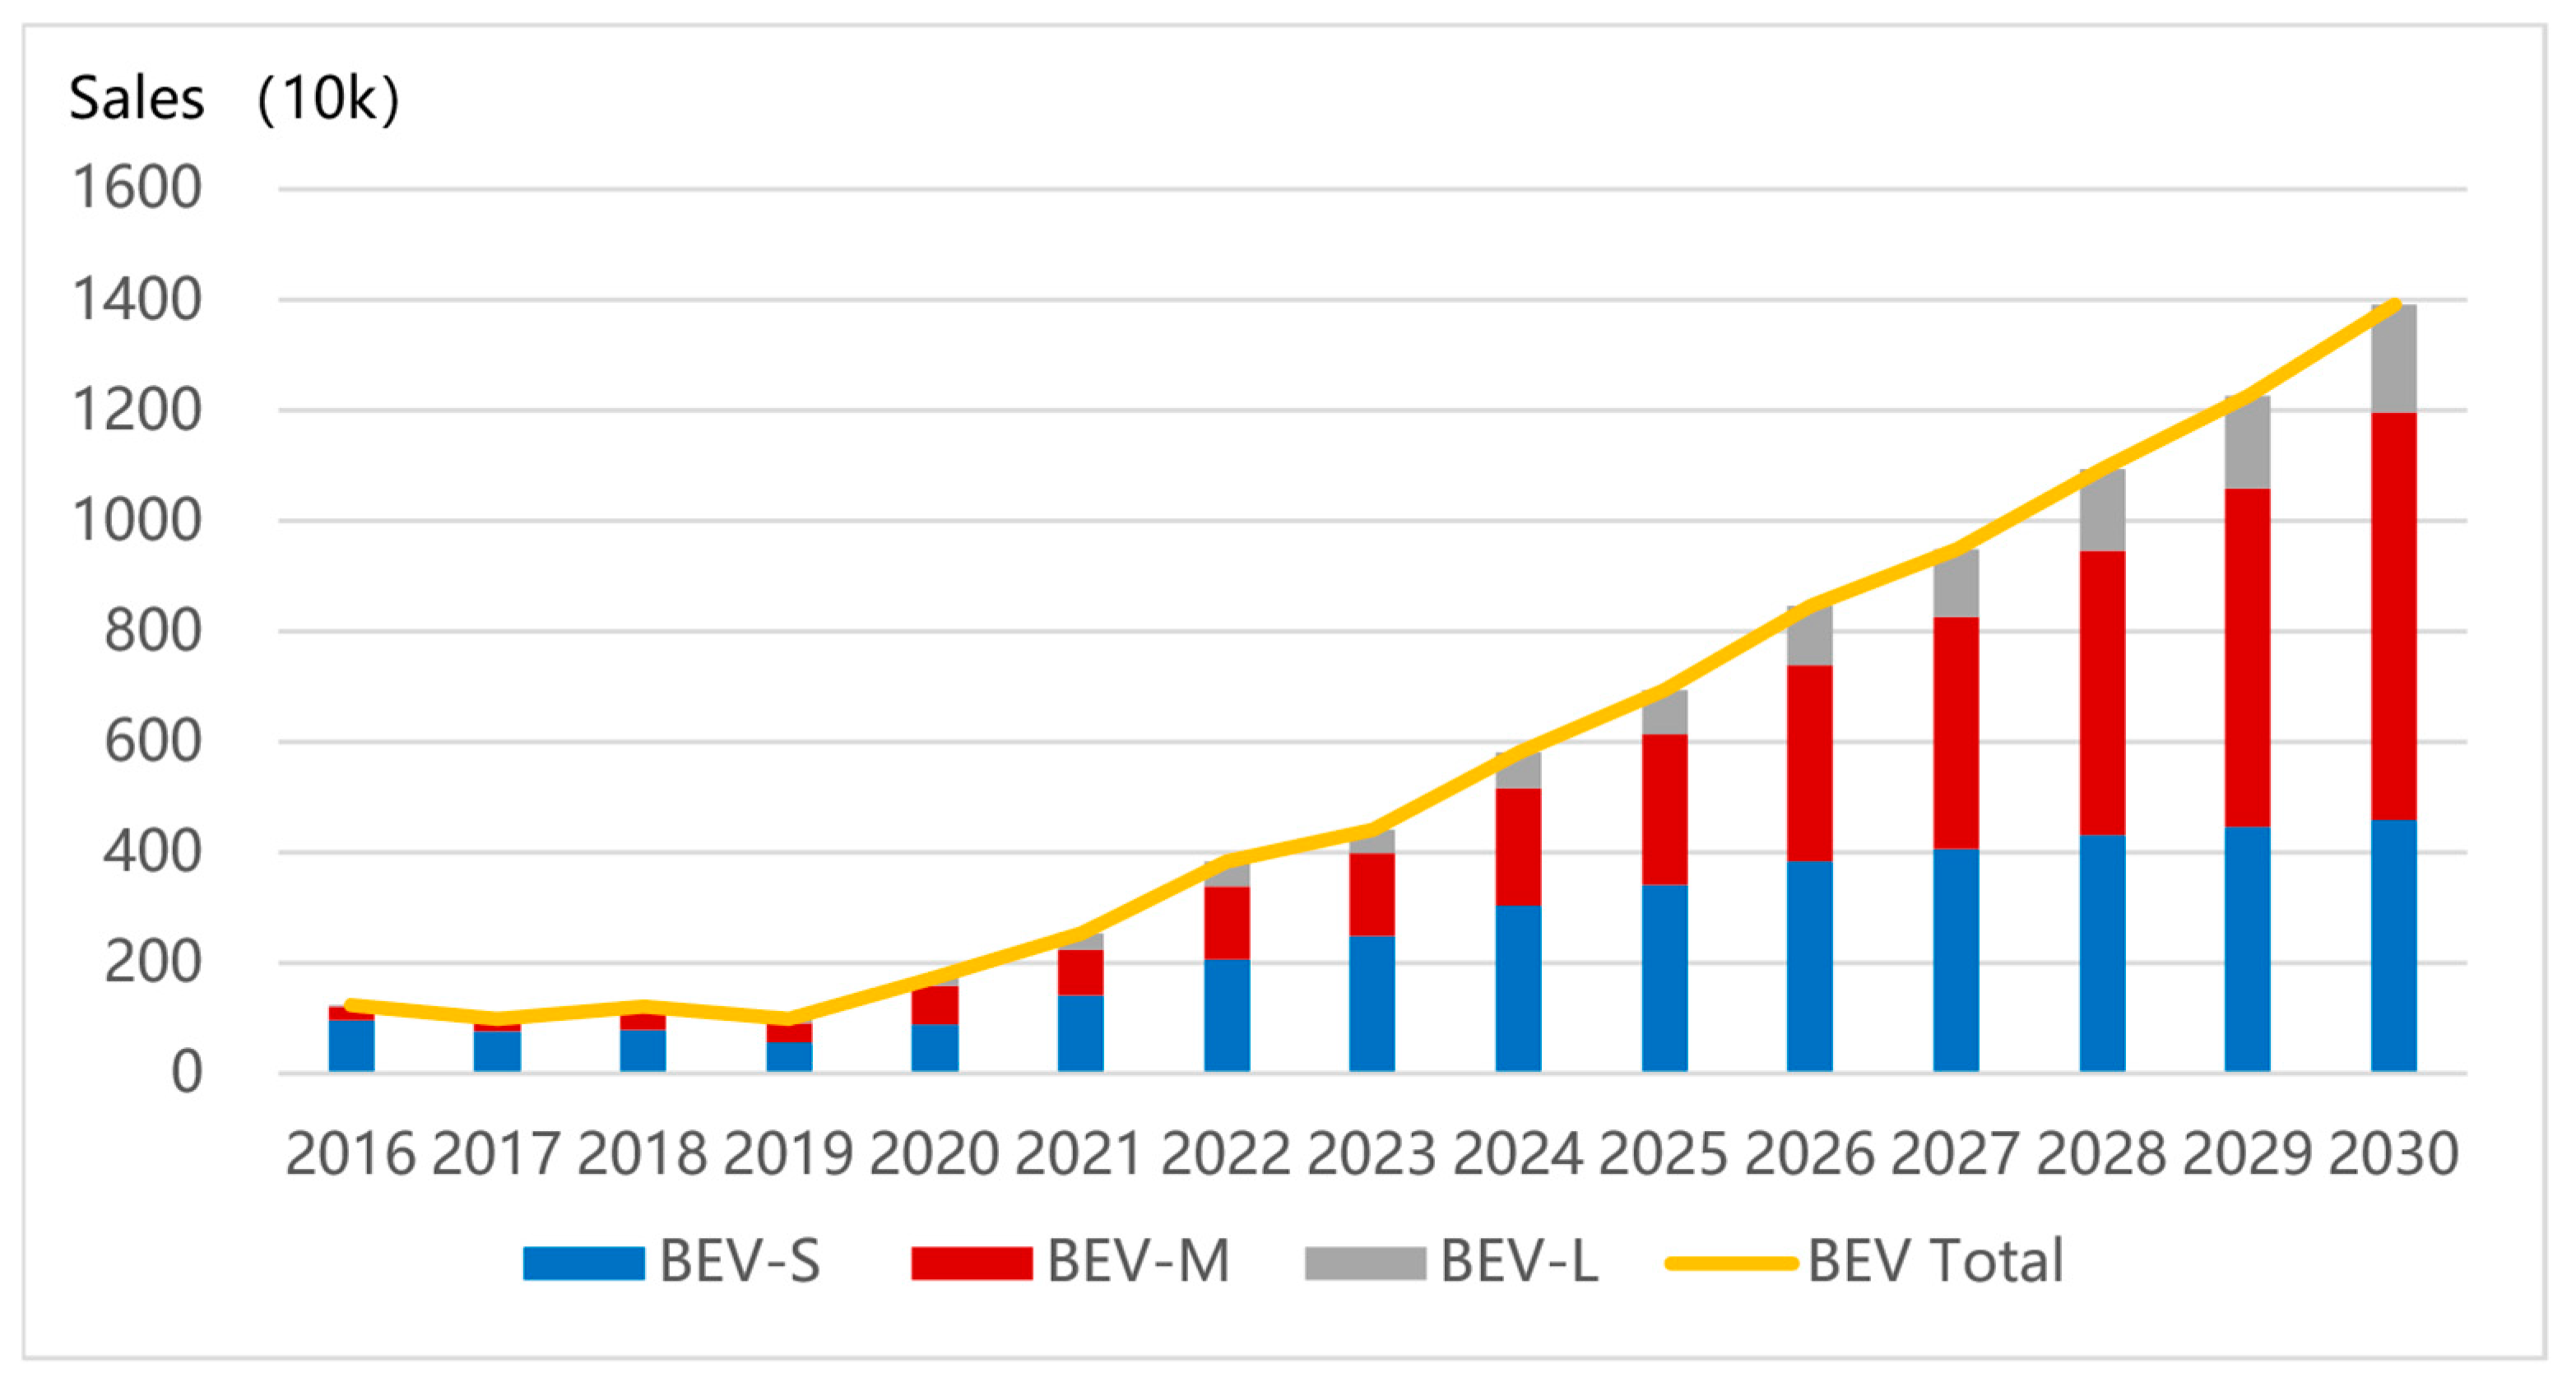
5.1.3. Market Segment Trend of BEVs

The market share of BEV-S has been declining annually, falling from 70% in 2016 to an expected 30% by 2030. In contrast, BEV-Ms are projected to gain over 35% market share by 2025 and approach 50% by 2030, positioning them as the dominant segment by 2026. Figure 7 details the changing market shares within the BEV segment, highlighting how BEV-Ms are set to become the dominant choice due to their range and performance improvements. This shift is attributed to the ability of BEV-Ls to satisfy NEV mandate policy requirements while addressing consumer range anxiety. Additionally, advancements in key NEV technologies are expected to reduce production costs, further boosting BEV sales.

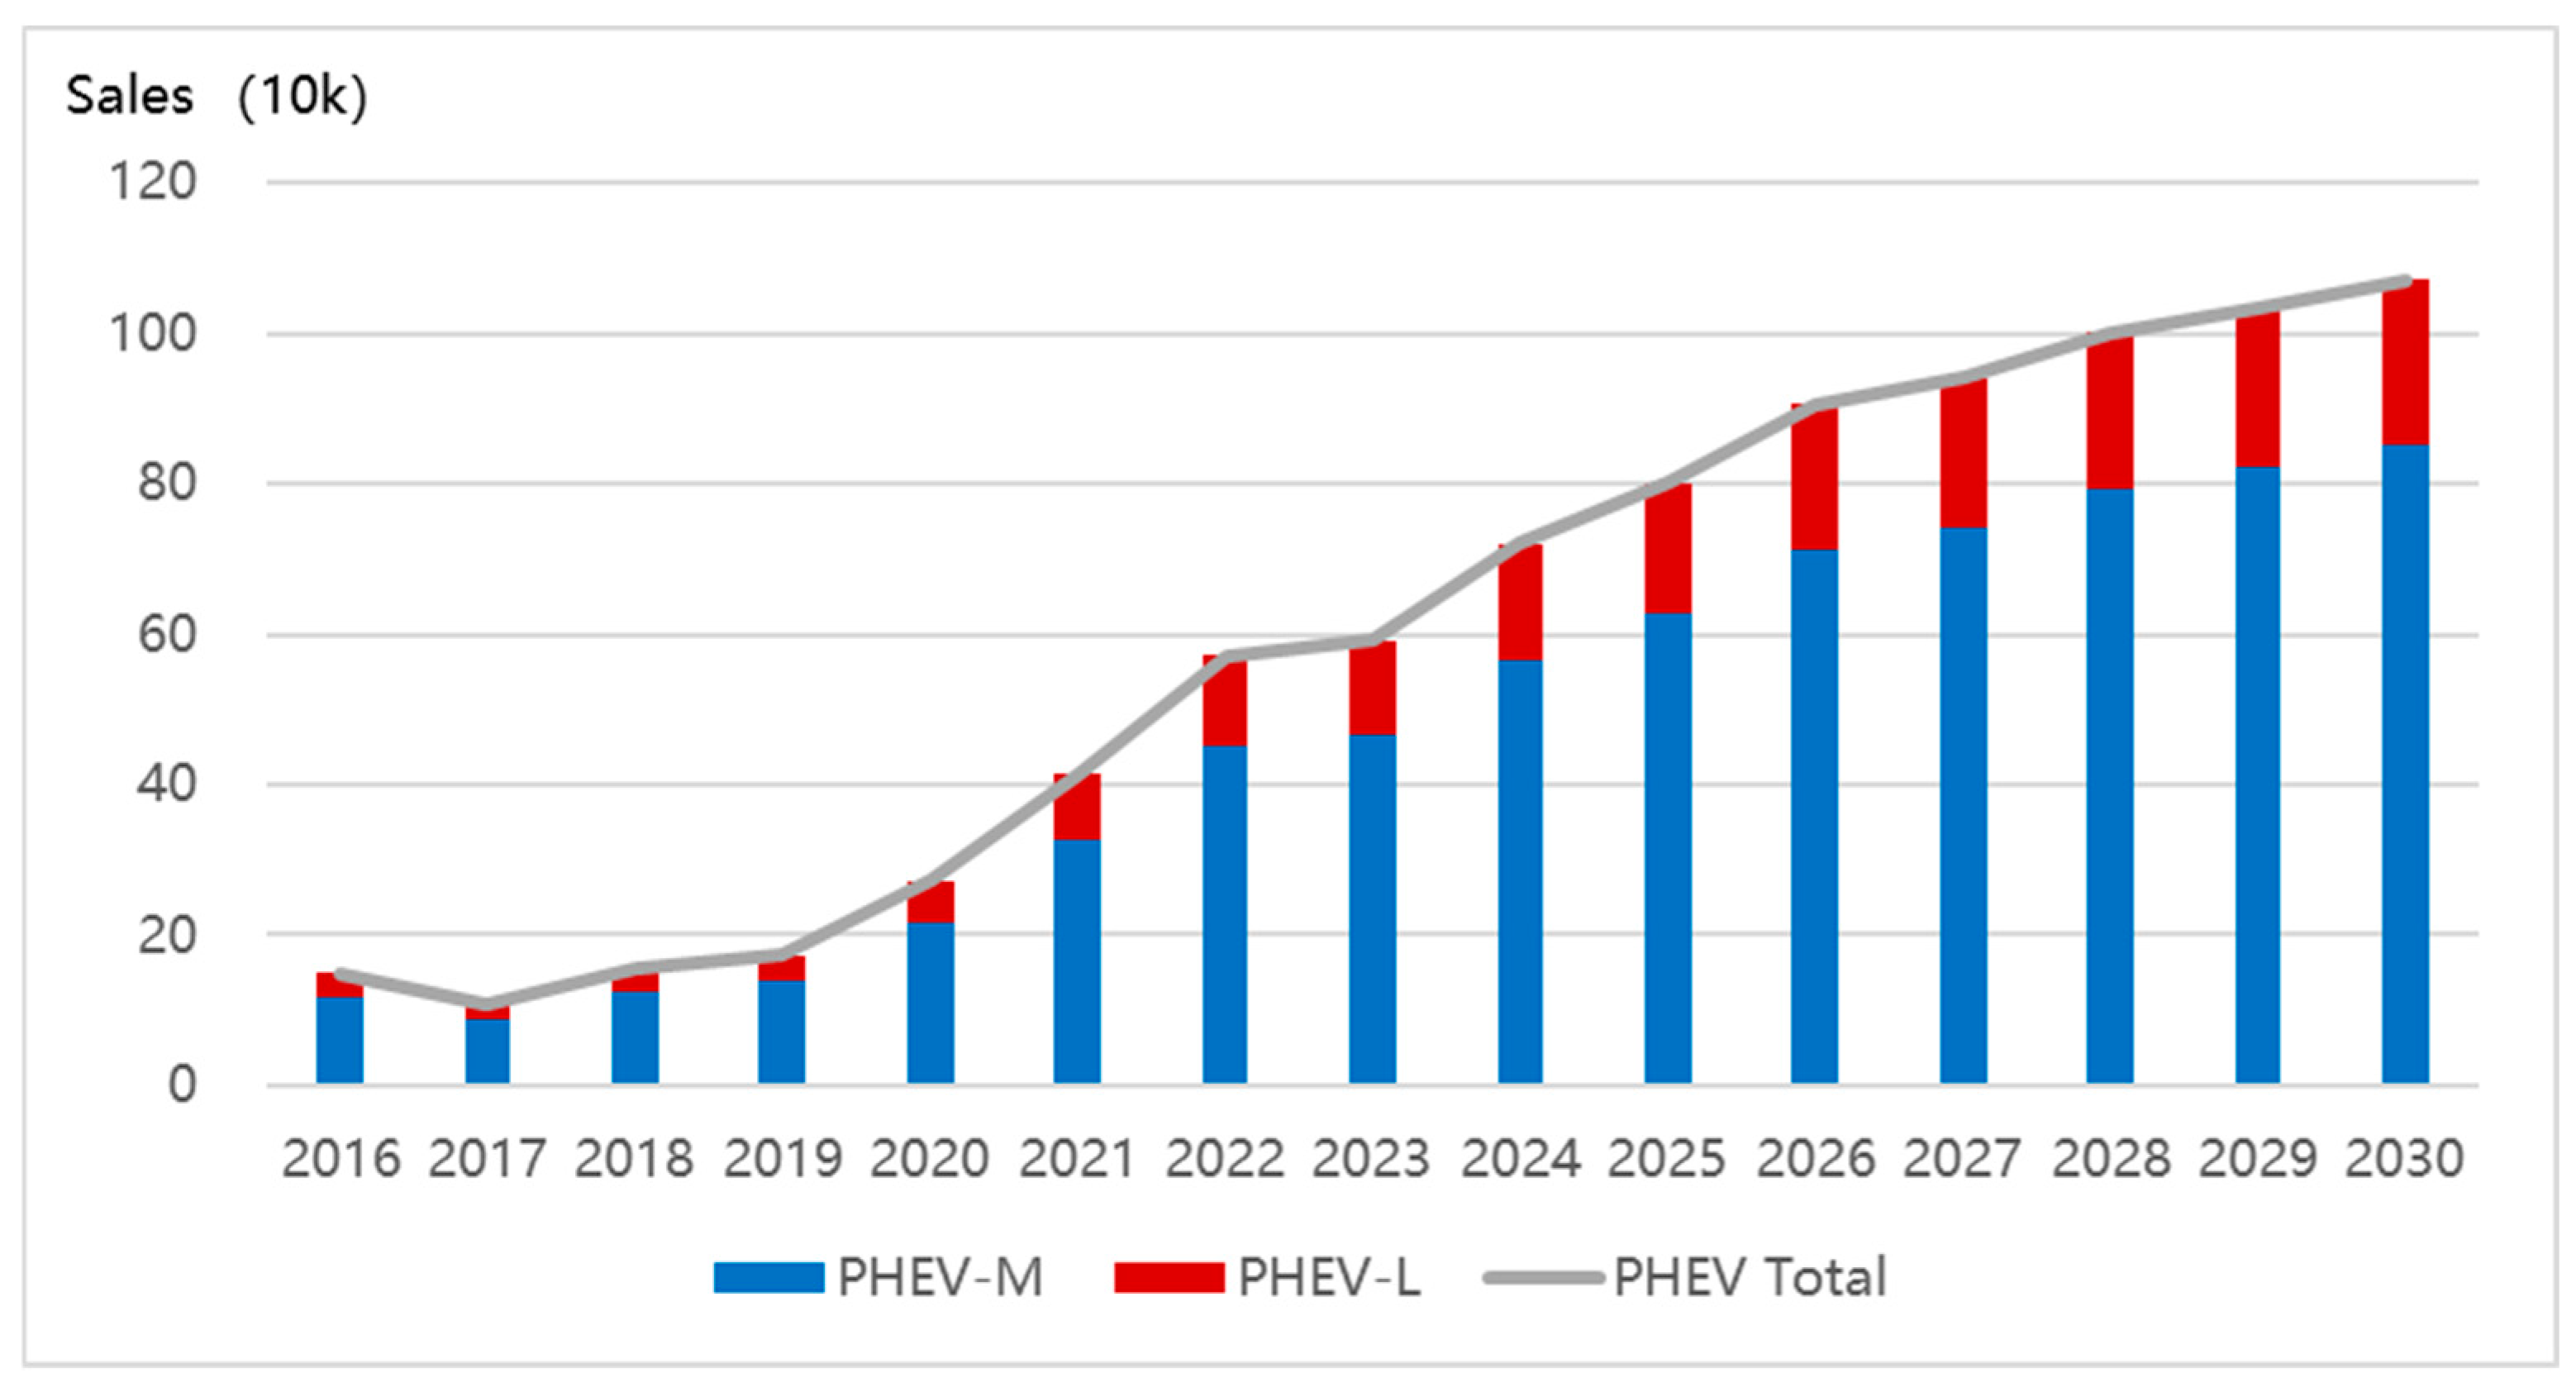
5.1.4. Market Segment Trend of PHEVs

Within the PHEV market, PHEV-L consistently hold a 20% market share, while mid-sized vehicles remain the dominant segment, as illustrated in Figure 8. The figure shows how, despite the mandate policy, the PHEV market composition remains relatively stable, with PHEV-M maintaining a strong presence. The NEV mandate policy appears to have a limited impact on the PHEV market segments, as both large and mid-sized PHEVs receive the same NEV credits.

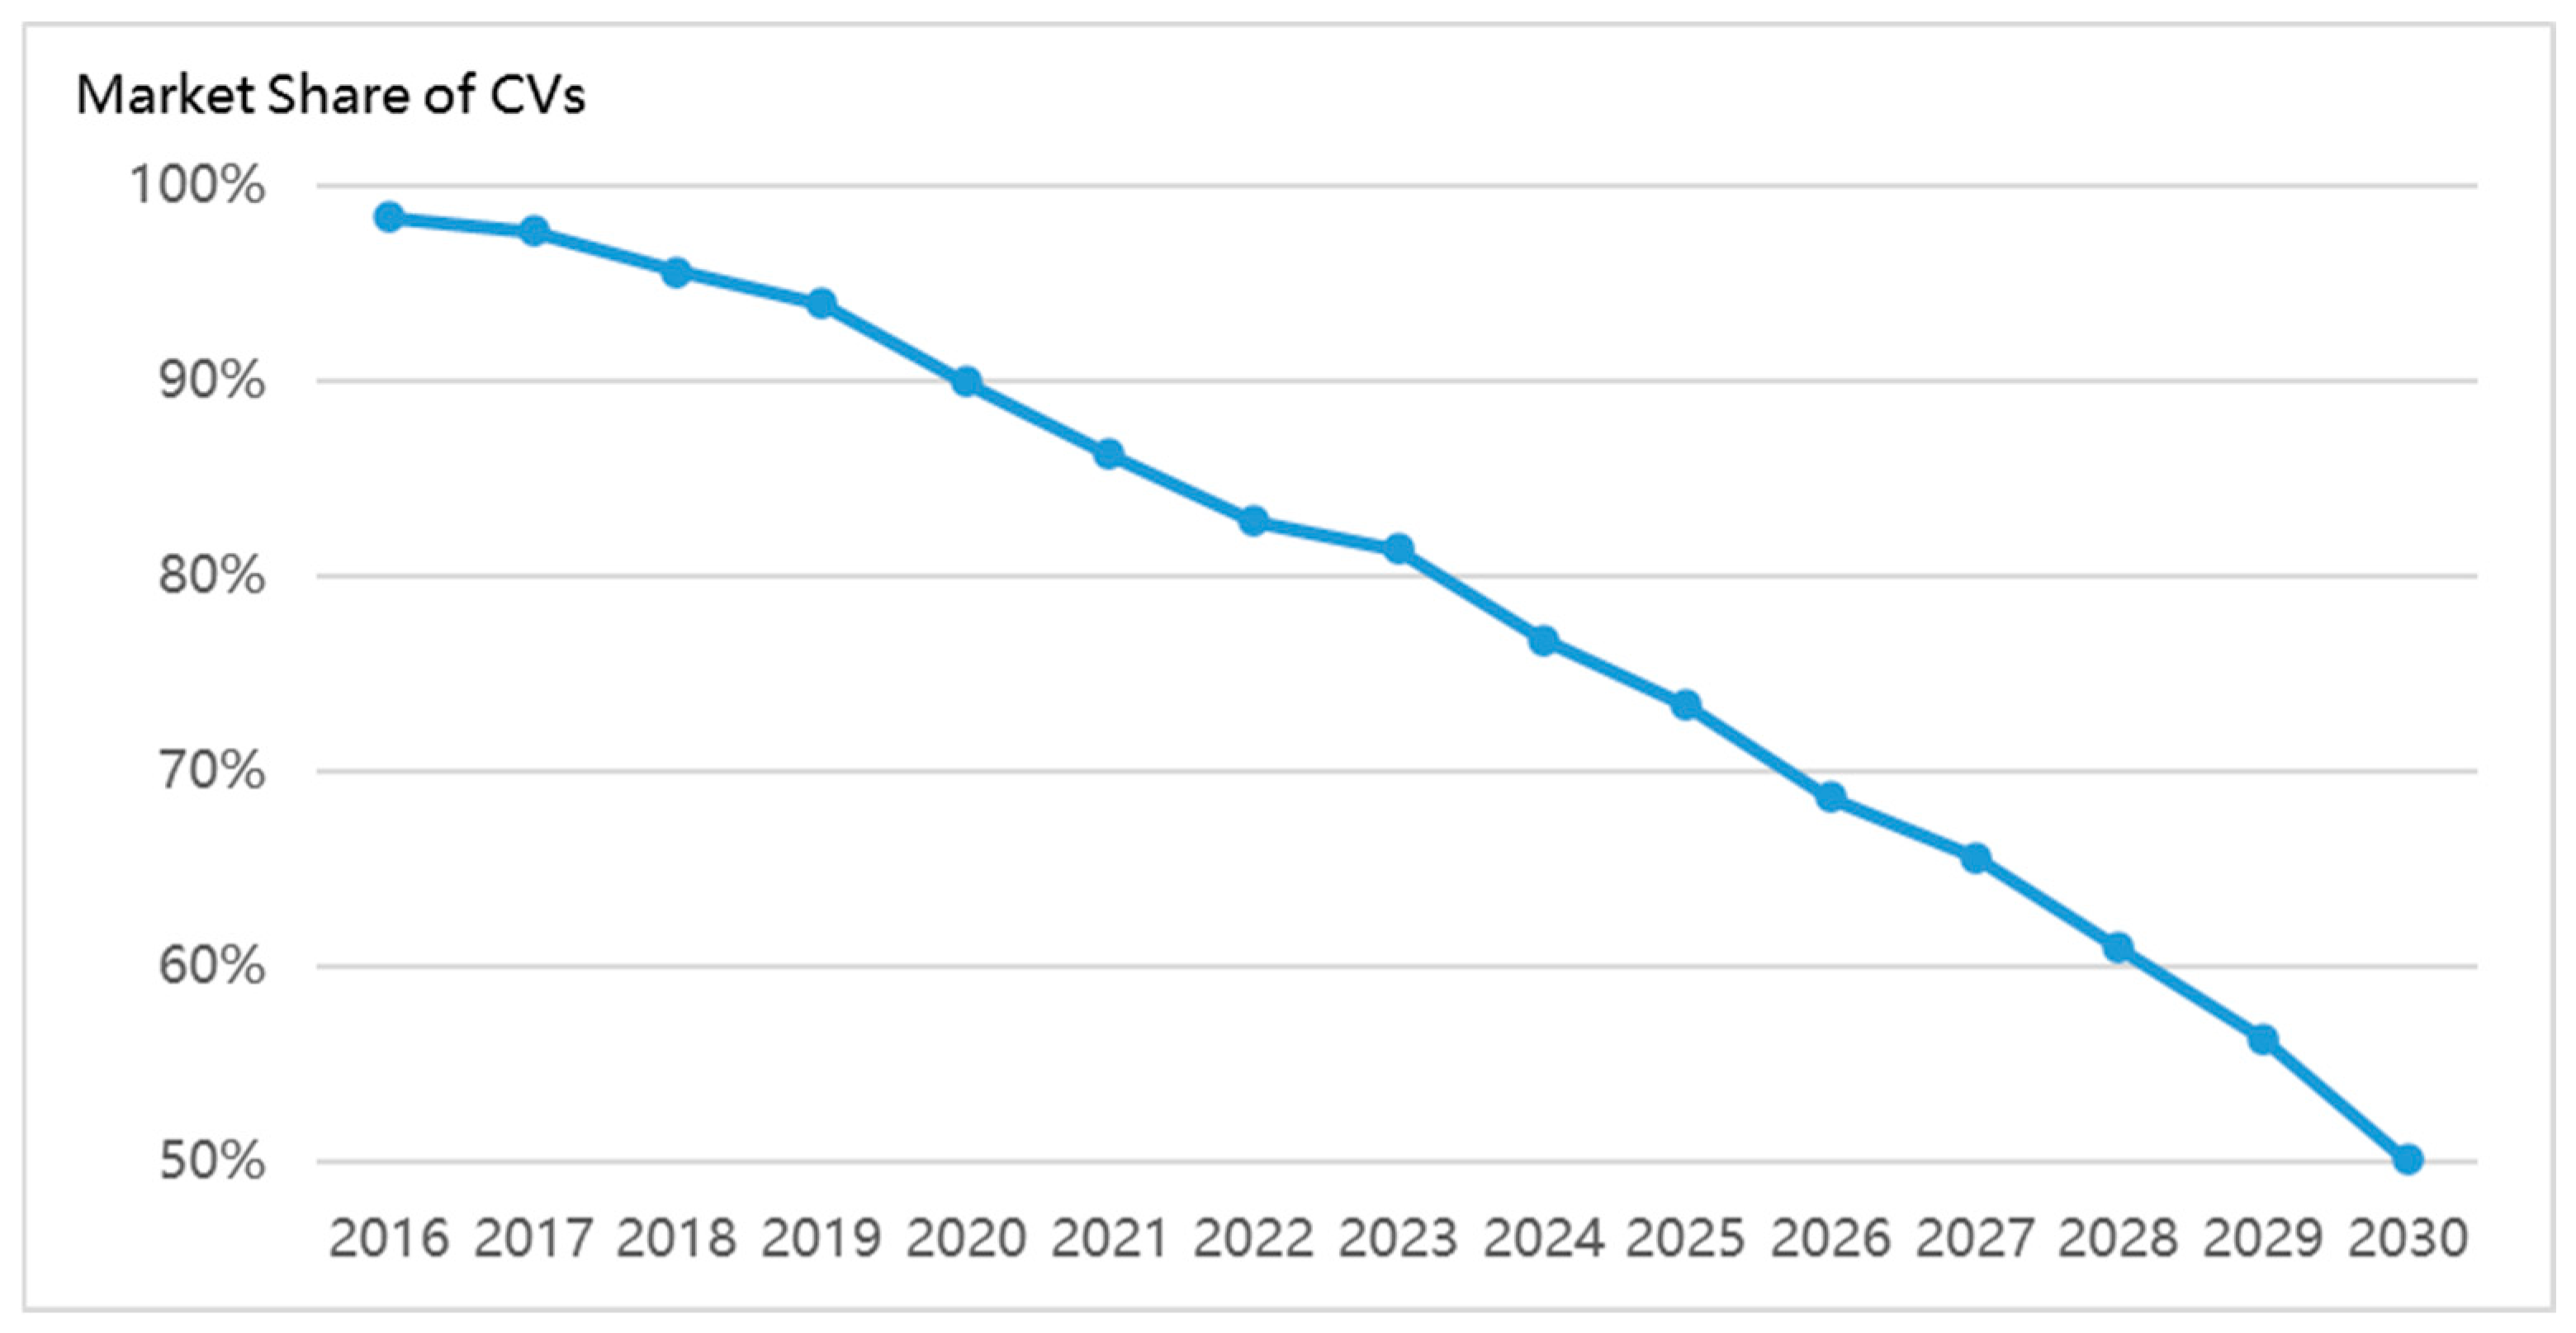
5.1.5. Market Segment Trend of CVs

According to historical data, from 2016 to 2018, CV-S saw a market share decline, while CV-Ms slightly decreased, and CV-L increased significantly. Following the implementation of the NEV mandate policy, CV market segments have changed considerably. In 2018, CV-S held a 19% share, CV-M 61%, and CV-L 20%. By 2030, the shares are expected to shift to 22% for CV-S, 58% for CV-M, and 20% for CV-L. Figure 9 shows that the market share of CV-S will initially increase, peaking at over 25% in 2025 before declining, while CV-M’s share will initially decrease, then peak above 57% in 2025, and CV-L’s share will decline consistently after 2019. This trend suggests that CV-S is better suited to meet CAFC credit requirements under the NEV mandate policy than medium and large CVs.

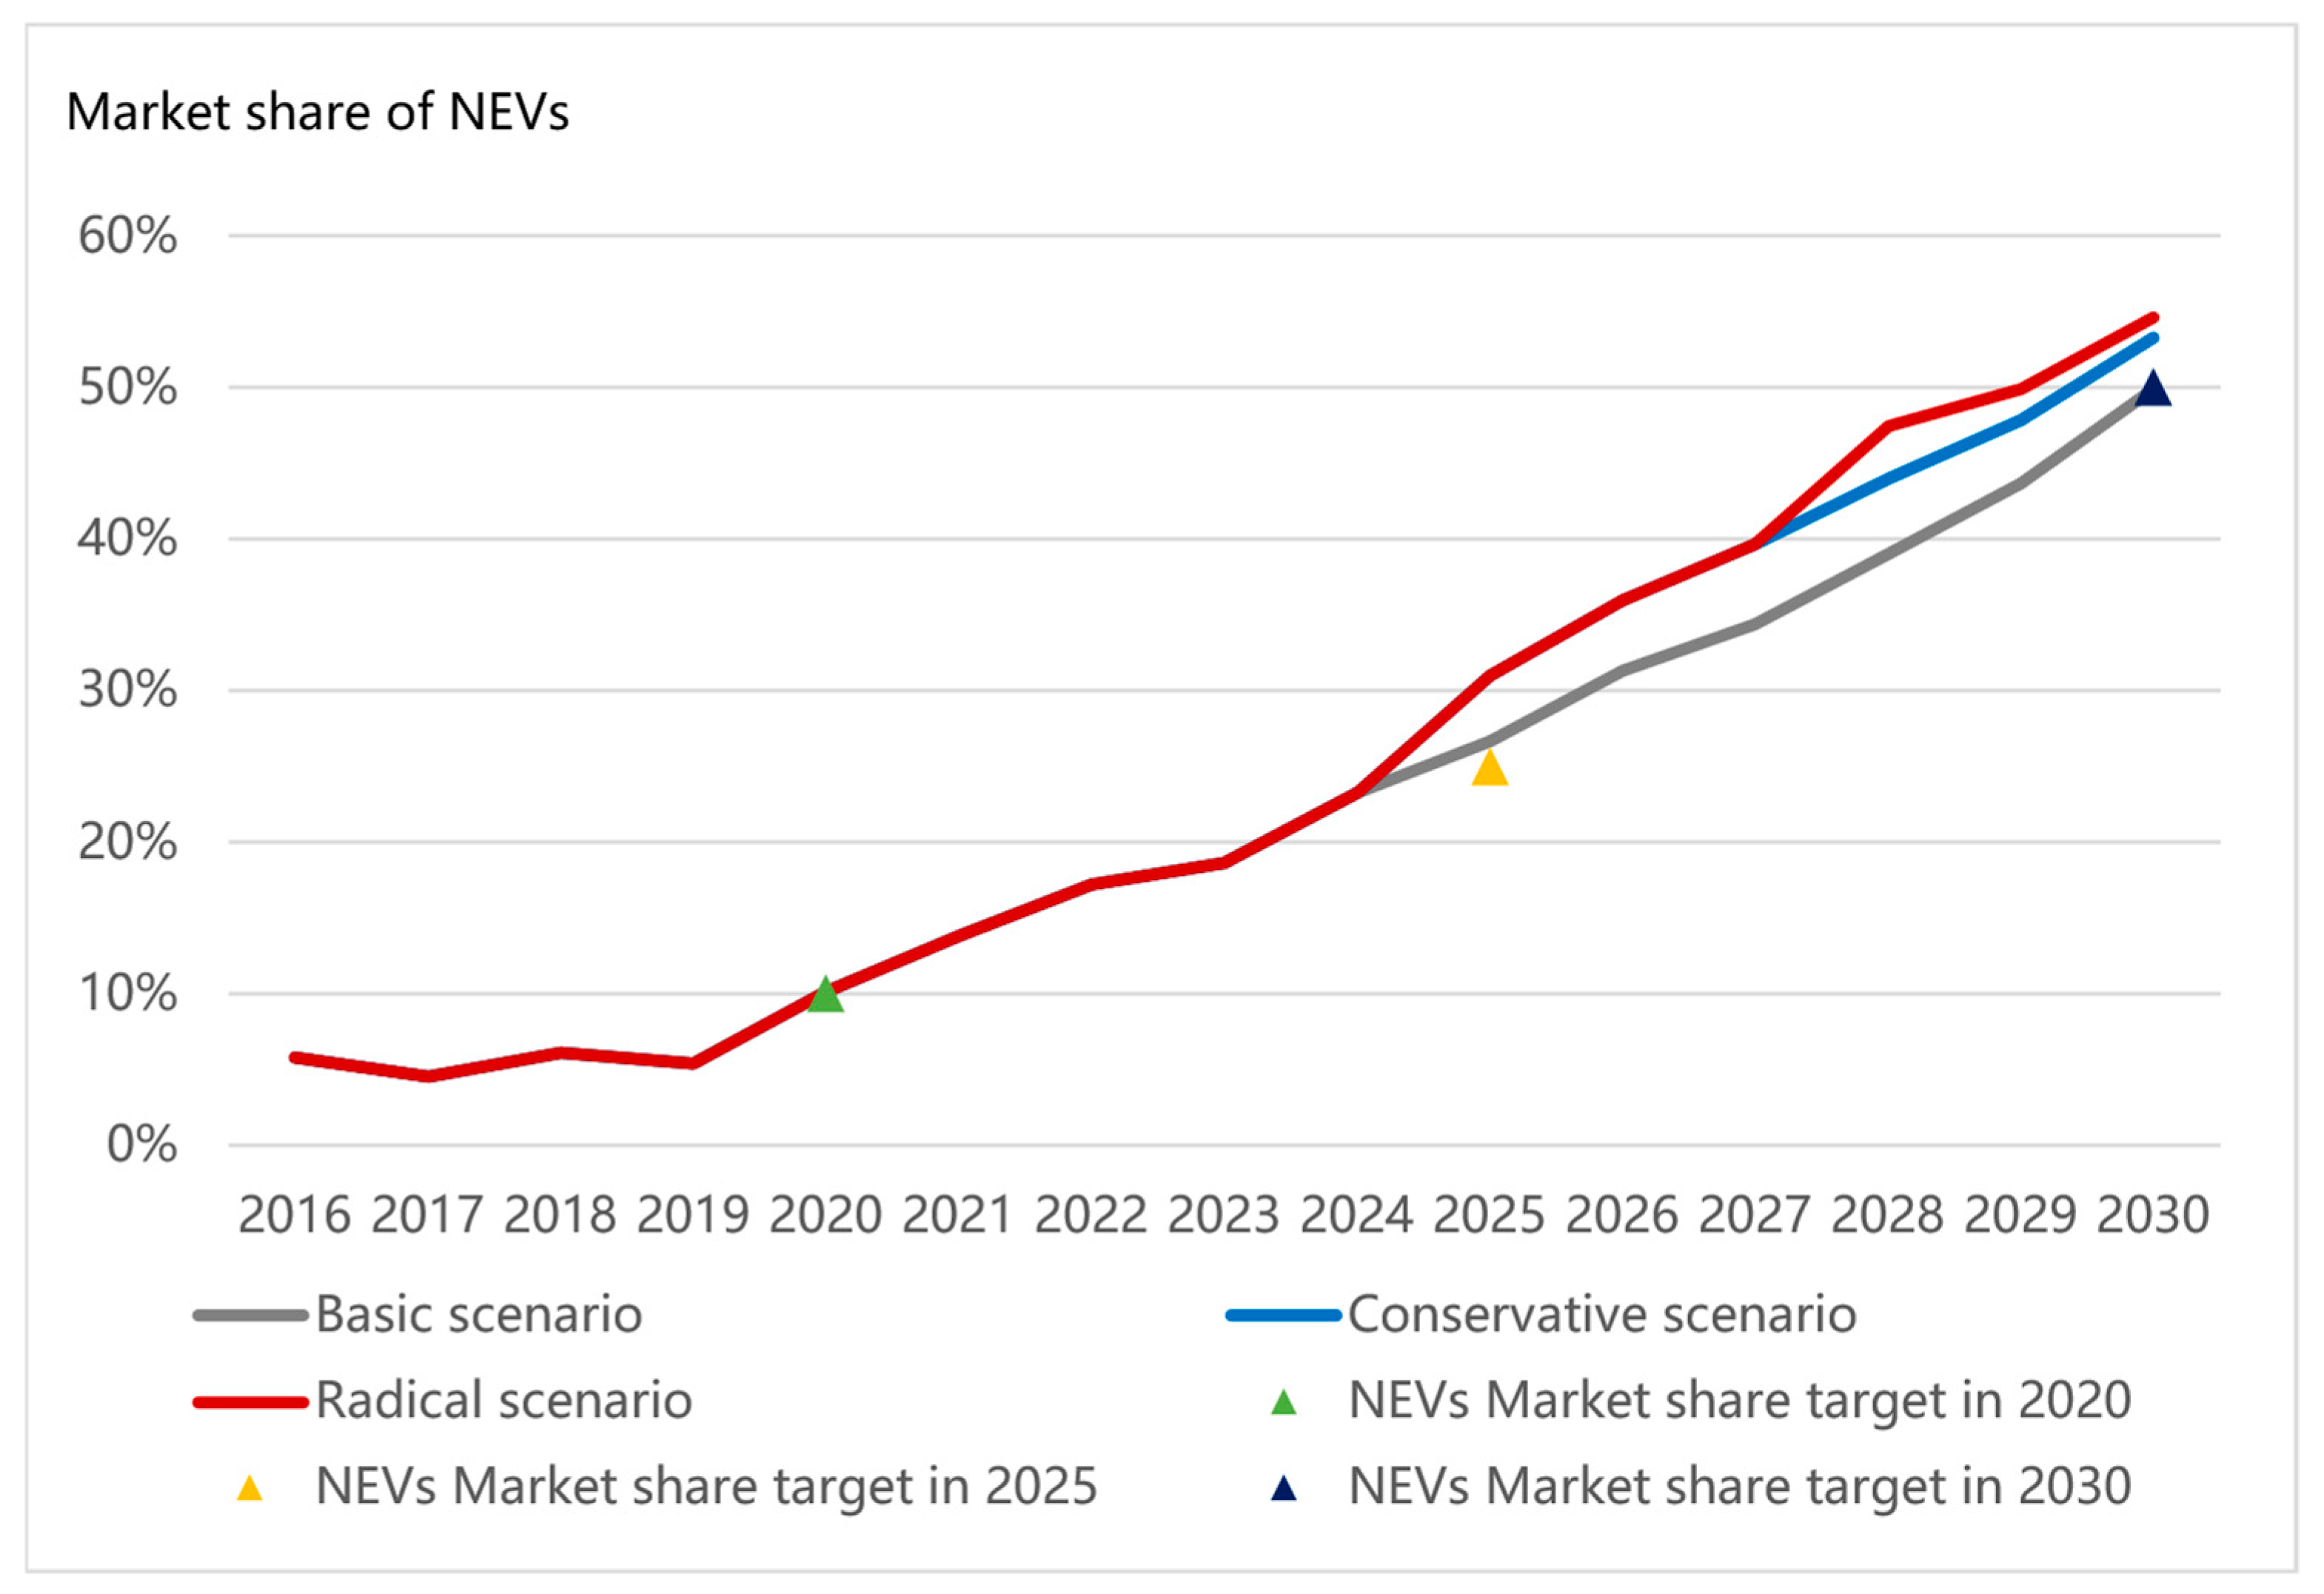
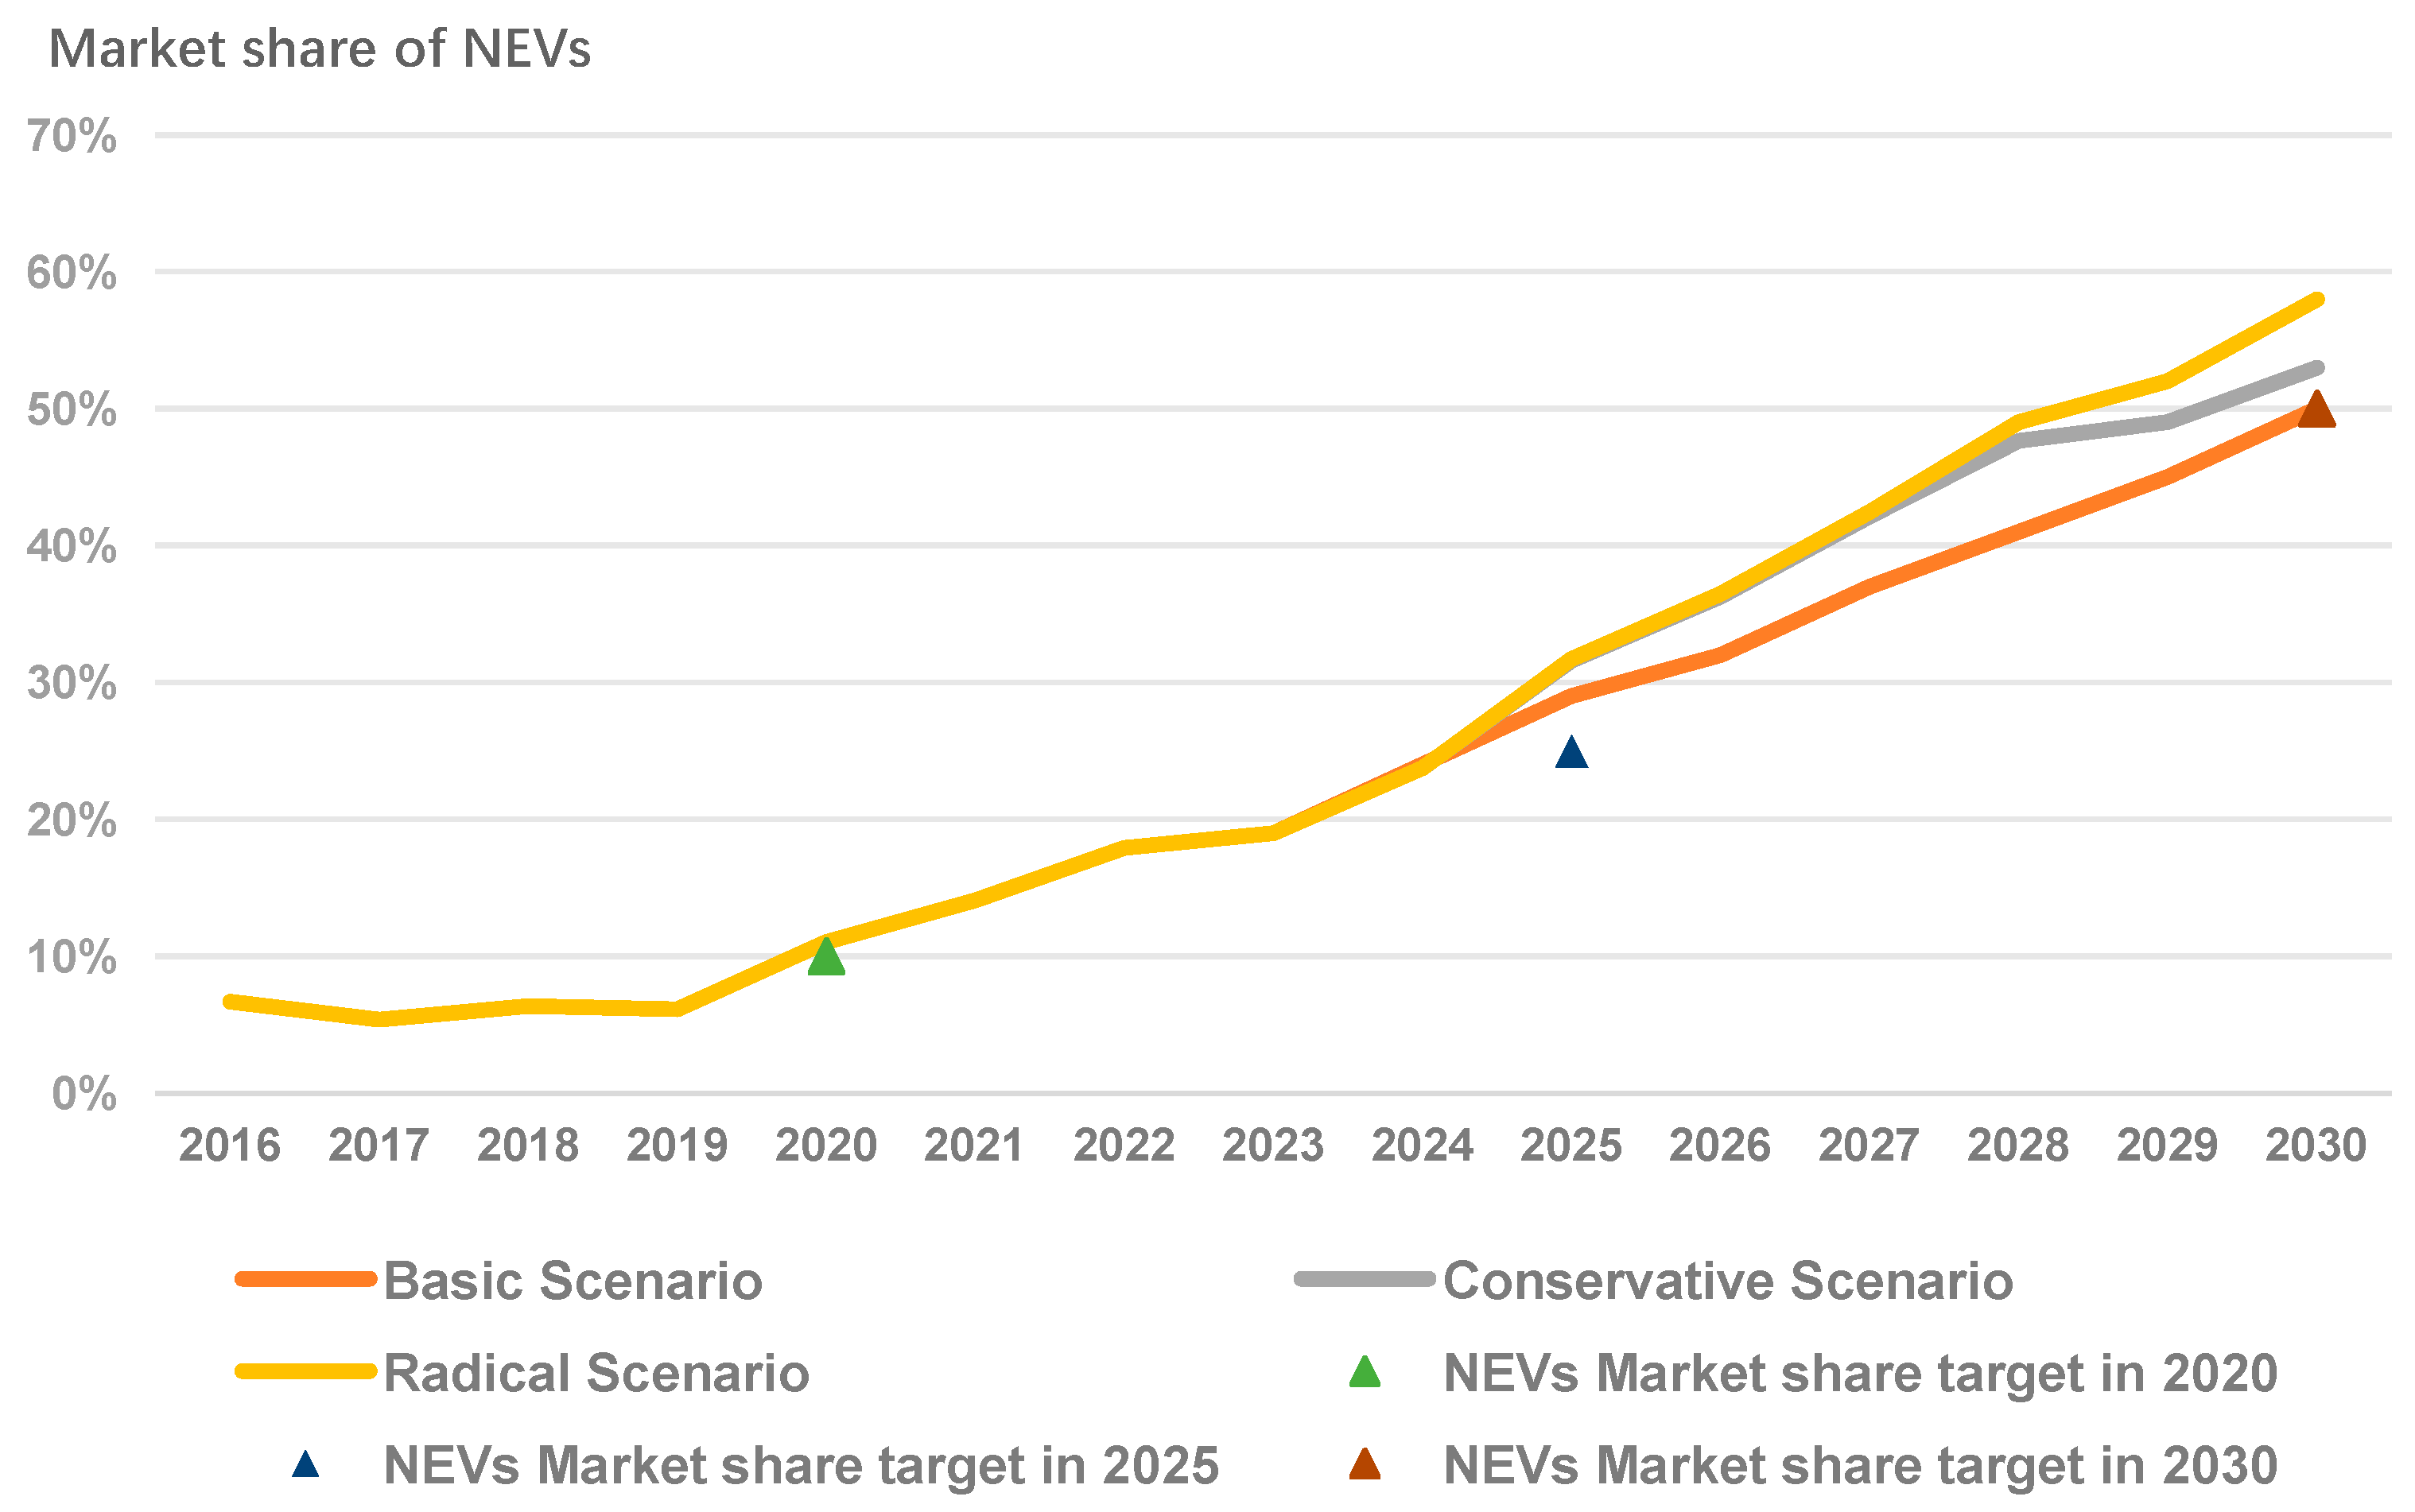
5.2. Scenarios Analysis of Changing NEV Mandate Policy’s Key Indicators

5.2.1. Selection of Key Indicators for NEV Mandate Policy

The NEV credits ratio requirements and standards are two critical time-varying indicators in the NEV mandate policy. The Chinese government has set NEV credits ratio requirements ranging from 10% in 2019 to 18% in 2023. Comparing the credits standards for 2019–2020 with those for 2021–2023, the credits value for the same NEV model is projected to decrease by 50%. These indicators are adjusted annually by the Chinese government to increase the policy’s stringency. However, the credits ratio requirements and standards beyond 2023 have not been published. Thus, this study conducted a scenario analysis to explore how changes in these two indicators could transform NEV market sh

5.2.2. Scenarios of Changing NEV Credits Ratio Requirements

Three categories of NEV credits ratio requirements were established: basic, conservative, and radical scenarios. In all scenarios, credits standards remain as defined in Section 5.1. However, NEV credits ratio requirements differ, as shown in Table 4: the basic scenario maintains an 18% ratio from 2024 onward; the conservative scenario increases the ratio by 2% annually, consistent with growth rates from 2019 to 2023; and the radical scenario raises the ratio by 3% annually, reflecting a more stringent regulatory approach.
As shown in Figure 10, all scenarios (basic, conservative, and radical) show overlapping results for the 2019–2023 period, as the NEV mandate policy parameters remain identical across scenarios during this time. After 2023, the scenarios diverge due to differing policy assumptions. The results indicate that higher NEV credits ratio requirements correspond to a larger NEV market share, consistent with the targets set in the Technology Roadmap for Energy Saving and New Energy Vehicles.

5.2.3. Scenarios of Changing NEV Credits Standard

Similarly, three scenarios for NEV credits standards were considered: basic, conservative, and radical. In each scenario, the credits ratio requirements are set at 18% for 2024 and beyond, while the credits standards vary, as outlined in Table 5. In the basic scenario, credits standards remain unchanged after 2023; the conservative scenario tightens standards once from 2024 to 2030; and the radical scenario tightens standards twice, once from 2024 to 2026 and again from 2027 to 2030.
The results, shown in Figure 11, indicate that NEV market share targets for 2025 and 2030 are achievable across all scenarios. Tightening NEV credits standards has a more pronounced effect on NEV market expansion than increasing credits ratio requirements alone.

5.2.4. Scenarios of Changing NEV Credits Ratio Requirements and Standard Synchronously

This study also examined combined scenarios in which both NEV credits ratio requirements and standards are adjusted simultaneously, as detailed in Table 6. In the basic scenario, credits ratio requirements and standards remain unchanged from 2024 to 2030. In the conservative scenario, credits ratio requirements increase by 2% annually, while credits standards are tightened once. In the radical scenario, credits ratio requirements increase by 3% annually, and credits standards are tightened twice.
Figure 12 shows that NEV market share targets for 2025 and 2030 are achievable under all scenarios, with conservative and radical scenarios reaching approximately 54% and 58% market share, respectively, by 2030. The combined effect of increasing both NEV credits ratio requirements and tightening standards is more impactful than adjusting either factor alone.

5.2.5. Scenarios for Adjusting NEV Credits Based on the Latest Draft Policy

Recently, China’s Ministry of Industry and Information Technology issued a draft revision of the Parallel Management Method, proposing stricter standards and credits ratios for 2024 and 2025. This study assumes that these new standards and ratio requirements will remain in place from 2026 onward. Table 7 summarizes the draft’s detailed credits ratio and standards.
Figure 13 compares the latest draft policy scenario with the basic, conservative, radical, and No Dual-Credits Policy scenarios. From 2024 onward, the draft policy’s stricter standards increase NEV market share by approximately 2% more than the previous scenarios, reaching 25%. The No Dual-Credits Policy Scenario shows the projected NEV market growth if the dual-credits policy ends in 2024, with NEV market share continuing to grow at a slower rate but falling short of the 50% market share target by 2030. After 2024, the latest draft’s impact aligns closely with the conservative scenario, with NEV market share trends expected to follow the radical scenario if standards continue to tighten.

6. Discussion

In this study, we examined the impact of the New Energy Vehicle (NEV) mandate policy on the passenger vehicle market in China. Our findings suggest that the NEV mandate policy significantly influences NEV sales, driving the market towards a higher penetration of electric vehicles. However, as noted in the literature, the NEV mandate policy does not act in isolation. Other pro-NEV policies, such as national fuel economy standards, subsidies for charging infrastructure, and exemptions from city driving restrictions, also play a crucial role in shaping the market dynamics.
One of the key contributions of our study is the isolation of the incremental impact of the NEV mandate policy, which allowed us to assess its specific role in accelerating NEV adoption. While our baseline model excludes other pro-NEV policies to maintain clarity, we acknowledge that incorporating these factors into future research could provide a more comprehensive understanding of the cumulative effects of the entire policy landscape on NEV market growth.
The results of this study also provide valuable insights for policymakers and industry stakeholders. The anticipated market share of NEVs by 2030—15 million units, or 55% of the passenger vehicle market—demonstrates the potential effectiveness of the NEV mandate policy. However, the robustness of this projection will depend on the continued alignment of various supporting policies, such as infrastructure development and regulatory measures. Additionally, our findings highlight that despite the policy mandate, challenges related to consumer adoption, charging infrastructure, and vehicle cost remain significant barriers.

7. Conclusions

This study contributes to the growing body of literature on the effectiveness of NEV mandate policies, specifically in the context of China’s passenger vehicle market. Our analysis confirms that the NEV mandate policy has a significant impact on NEV market penetration, projecting a market share of 55% by 2030. However, the incremental impact of the NEV mandate cannot be fully isolated without considering other pro-NEV policies. In a scenario where the dual-credits policy ends in 2024, the NEV market share would still show growth, but it would not reach the 50% target by 2030. As such, future studies should explore the combined effects of all relevant policies to offer a more holistic view of the NEV market development.

7.1. Theoretical Implications

From a theoretical perspective, this study enriches the literature on environmental policy and market transformation by demonstrating the critical role that policy mandates can play in accelerating technological adoption. While much of the existing research focuses on the cumulative impact of all policies, our work underscores the importance of isolating specific policy interventions to better understand their individual effects. This approach contributes to refining policy impact assessment models, which can be applied to other industries and countries undergoing similar transitions towards sustainable technologies.

7.2. Practical Implications

In practical terms, our findings have important implications for policymakers and industry stakeholders. For policymakers, the study highlights the need for a coordinated approach, where the NEV mandate policy is supported by complementary measures such as infrastructure development and consumer incentives. The results indicate that to reach the projected 55% market share by 2030, continuous investment in charging networks and further reductions in NEV costs will be essential. For manufacturers, understanding the specific impact of the NEV mandate can help in strategic planning, particularly in aligning production with future demand trends. Additionally, our research emphasizes the importance of maintaining public–private partnerships to support infrastructure development, which remains a critical enabler of NEV adoption.

8. Research Limitations and Recommendations for Future Research

This study uses a base model with vehicle attribute parameters from Harrison et al. (2016), which align with general Chinese consumer preferences but may not fully capture regional characteristics. For example, Chinese consumers tend to prioritize performance, reliability, and safety over environmental concerns. Although the model assigns significant weight to these factors, future research should refine these parameters through surveys of Chinese consumers to enhance the accuracy of the model.
The model assumes a steady increase in NEV credits ratio requirements from 2024 to 2030 based on past trends. However, other factors, such as potential changes in the NEV-CAFC credit conversion ratio, could significantly impact the market. These variations were not considered in this study, and future research could explore the effects of these adjustments on NEV adoption.
Additionally, several external factors, such as the COVID-19 pandemic, demographic changes, and the potential implementation of carbon quota policies within the automotive sector, were not included in the model. Future research should incorporate these factors to gain a more comprehensive understanding of their potential effects on the NEV market.
A key limitation of this study is that it does not examine alternative pro-NEV policies that could potentially achieve the 50% NEV deployment rate more quickly or at a lower cost than tighter dual-credits ratios. Future studies could explore the effects of policies at the city level, such as consumer incentives for NEVs, scrappage incentives that encourage consumers to replace old internal combustion engine (ICE) vehicles with battery electric vehicles (BEVs), or CO2 emissions fees, which are widespread in Europe. These alternative policies could be assessed either as supplements to the dual-credits policies or as viable alternatives, with the aim of identifying the most cost-effective and efficient strategies for achieving NEV market growth.

Author Contributions

N.W. conceived the study and provided guidance on the article’s framework. All authors participated in data collection. N.W. and X.Y. were responsible for modeling and analysis. X.L. was responsible for result interpretation. X.L. wrote the manuscript of the article. All authors have read and agreed to the published version of the manuscript.

Funding

This research was funded by [National Social Science Fund of China] grant number [no. 18BJY072].

Data Availability Statement

The original contributions presented in this study are included in the article. Further inquiries can be directed to the corresponding author.

Conflicts of Interest

The authors declare no conflicts of interest.

Appendix A. Detailed Specifications of NEV Mandate Policy

Table A1. Requirements coefficient of company average fuel consumption [43].
Year20162017201820192020 and Beyond
cofficient134%128%120%110%100%
Table A2. Wi (Multiple of vehicle i).
YearBEV/FCV/PHEV
(Electric Cruising Range ≥ 50 km)
CV
(Oil Consumption ≤ 2.8 L/100 km)
Other Vehicles
2016–2017Wi = 5Wi = 3.5Wi = 1
2018–2019Wi = 3Wi = 2.5Wi = 1
2020Wi = 2Wi = 1.5Wi = 1
Table A3. The standard details of NEV credits C i .
The standard of NEV credit from 2019 to 2020
Powertrain Standard type credits
BEV0.012 × R a + 0.8
PHEV2
FCV0.16 × P
The standard of NEV credit from 2021 to 2023 b
Powertrain Standard type credits
BEV0.006 × R a + 0.42
PHEV1.6
FCV0.08 × P
a: R is the continued driving range of electric vehicles, and the unit is km; P is the rated power of the fuel cell system and the unit is kW; b: The standards from 2021 to 2023 derive from the draft of the decision on revising the NEV mandate policy.

Appendix B. Categories of Passenger Vehicle in SD Model

CategoryDefinition
CV-LLarge-sized (namely B and C class) conventional fuel passenger vehicles
CV-MMedium-sized (namely A class) conventional fuel passenger vehicles
CV-SSmall-sized (namely A00 and A0 class) conventional fuel passenger vehicles
PHEV-LLarge -sized (namely B and C class) plug-in hybrid electric passenger vehicles
PHEV-MMedium-sized (namely A class) plug-in hybrid electric passenger vehicles
BEV-SBattery electric passenger vehicles with driving range: R ≤ 300 km
BEV-MBattery electric passenger vehicles with driving range: 300 km < R ≤ 450 km
BEV-LBattery electric passenger vehicles with driving range: R > 450 km

Appendix C. Input Parameters About TCO of 2010

PowertrainPropertyUnitSize
S aM aL a
CVInitial fuel consumptionL/100 km6810
Initial production capacityvehicle/year × 1045001500500
Unit capacity investment costCNY/vehicle × 10411.21.5
Base fixed costCNY/vehicle × 10411.21.5
Glider costCNY/vehicle × 104369
Initial cost of Internal combustion engine (CV)CNY/vehicle × 104234
Fractional reduction in Internal combustion engine (CV)0.010.010.01
Initial Maturity of Internal combustion engine (CV)0.700.700.70
Maintenance costCNY/year150030004500
Insurance premiumCNY/year300050006000
BEVInitial electricity consumptionkWh/100 km151821
Initial production capacityvehicle/year × 104000
Unit capacity investment costCNY/vehicle × 1041.21.51.8
Base fixed costCNY/vehicle × 1041.21.51.8
Glider costCNY/vehicle × 104369
Initial cost of BEV batteryCNY/vehicle × 104102030
Fractional reduction in BEV battery0.10.10.1
Initial Maturity of BEV battery0.300.300.30
Maintenance costCNY/year4509001350
Insurance premiumCNY/year450065009000
PHEVInitial electricity consumptionkWh/100 km1821
Initial fuel consumptionvehicle/year × 10424
Initial production capacityvehicle/year × 10400
Unit capacity investment costCNY/vehicle × 1041.82
Base fixed costCNY/vehicle × 10422
Glider costCNY/vehicle × 10469
Initial cost of Internal combustion engine (PHEV)CNY/vehicle × 10423
Initial cost of PHEV batteryCNY/vehicle × 1041218
Initial Maturity of PHEV battery0.30.3
Maintenance costCNY/year20003000
Insurance premiumCNY/year55007500
CV/
BEV/
PHEV
Cost of Vehicle license plateCNY70,000 (megalopolis) or 0 (other cities and rural areas)
Annual travel distancekm/year15,000
Purchase tax10%
Average years keptYear15
Oil priceCNY/L6.5
ElectricityCNY/kWh0.6 (day) or 0.3 (night)
Road tollsCNY/year1400
V&V taxCNY/year950
Cost of Driving restrictionCNY/year1000 (megalopolis) or 0 (other cities and rural areas)
Park chargesCNY/year4800 (megalopolis) or 2400 (other cities) or 0 (rural area)
Cost of congestionCNY/year1500 (megalopolis) or 750 (other cities) or 0 (rural area)
Note: The data are based on [26,33,38,39], a: For BEV, S, M and L are equal to BEV-200, BEV-300 and BEV-400 which means ranges are R ≤ 250 km, 250 km < R ≤ 350 km and 350 km < R, respectively.

Appendix D. Input Parameters About Attributes That Characterize Vehicles

AttributesImportance of Attributes to CustomersInitial Attribute Value
CVBEVPHEV
Environment0.670.730.960.7
Performance0.940.850.720.77
Reliability0.940.950.830.80
Safety0.910.950.600.85
Convenience0.8010.050.60
Popularity0.70
Choice0.68
Note: The data are based on [14]. The research results are global and universal. These importance values accord with Chinese consumers’ psychologies. For example, Chinese consumers pay more attention to performance, reliability and safety rather than environmental attributes of a vehicle.

Appendix E. Calibrations

ParameterValue
Sensitivity of convenience to effective infrastructure1.2
Base prevalence for popularity0.5
Sensitivity of popularity to prevalence1
Market share for base choice availability0.1
Sensitivity of availability to sales0.6
Base utilization0.7
Reference utilization discrepancy0.1
Sensitivity of adjustment to utilization0.5
Sensitivity of capacity adjustment to policy penalty1.5
Sensitivity of price adjustment to utilization0.8
Sensitivity of price adjustment to penalty0.7
Sensitivity of R&D adjustment to penalty1.5

Appendix F. The Differences Between Simulation Results and Actual Sales in 2018

Vehicle TypeNEVCVTotal
BEVPHEV
BEV-SBEV-MBEV-LPHEV-MPHEV-LCV-SCV-MCV-L
Simulation Sales15.8 38.8 16.5 19.1 4.7 410.9 1392.4 479.4 2377.7
Actual Sales17.2 41.7 17.7 20.5 5.1 426.7 1384.5 457.6 2371.0
Difference−7.9%−7.0%−6.5%−6.8%−7.0%−3.7%0.6%4.8%0.3%

References

  1. Guo, J.; Zhang, X.; Cao, Q.; Gu, F. Electric vehicles contribute to China’s energy security and carbon peaking and carbon neutrality. Bull. Chin. Acad. Sci. 2024, 39, 397–407. [Google Scholar]
  2. Jing, P.; Shao, D.; Liu, Y.; Chen, Y.; Zhang, S. Linking short- and long-term impacts of the government, consumers, and manufacturers on NEV sales and market share in China. J. Retail. Consum. Serv. 2025, 82, 104090. [Google Scholar] [CrossRef]
  3. Du, J.; Ouyang, D. Progress of Chinese electric vehicles industrialization in 2015: A review. Appl. Energy 2017, 188, 529–546. [Google Scholar] [CrossRef]
  4. Hao, H.; Ou, X.; Du, J.; Wang, H.; Ouyang, M. China’s electric vehicle subsidy scheme: Rationale and impacts. Energy Policy 2014, 73, 722–732. [Google Scholar] [CrossRef]
  5. Helveston, J.P.; Liu, Y.; Feit, E.M.; Fuchs, E.; Klampfl, E.; Michalek, J.J. Will subsidies drive electric vehicle adoption? Measuring consumer preferences in the US and China. Transp. Res. Part A Policy Pract. 2015, 73, 96–112. [Google Scholar] [CrossRef]
  6. Wang, S.; Shi, L. EV diffusion promotion analysis under different charging market structure. Technol. Forecast. Soc. Change 2024, 208, 123730. [Google Scholar] [CrossRef]
  7. Zhan, W.; Wang, Z.; Deng, J.; Liu, P.; Cui, D. Integrating system dynamics and agent-based modeling: A data-driven framework for predicting electric vehicle market penetration and GHG emissions reduction under various incentives scenarios. Appl. Energy 2024, 372, 123749. [Google Scholar] [CrossRef]
  8. Zhu, M.; Dong, P.; Ju, Y.; Li, J.; Ran, L. Effects of government subsidies on heavy-duty hydrogen fuel cell truck penetration: A scenario-based system dynamics model. Energy Policy 2023, 183, 113809. [Google Scholar] [CrossRef]
  9. Han, R.; Yu, B.Y.; Tang, B.J.; Liao, H.; Wei, Y.M. Carbon emissions quotas in the Chinese road transport sector: A carbon trading perspective. Energy Policy 2017, 106, 298–309. [Google Scholar] [CrossRef]
  10. Shen, Y.-S.; Huang, G.-T.; Chang-Chien, C.-L.; Huang, L.H.; Kuo, C.-H.; Hu, A.H. The impact of passenger electric vehicles on carbon reduction and environmental impact under the 2050 net zero policy in Taiwan. Energy Policy 2023, 183, 113838. [Google Scholar] [CrossRef]
  11. Wang, Y. Comparison of California ZEV Mandate with China’s Dual-credit Regulation and Its Simulation Results. 2017. Available online: https://www.d1ev.com/kol/49713 (accessed on 27 November 2019).
  12. Gómez, V.; Jonatan, J.; Jochem, P. Simulating vehicle fleet composition: A review of system dynamics models. Renew. Sustain. Energy Rev. 2019, 115, 109367. [Google Scholar] [CrossRef]
  13. Hu, X.; Chang, S.; Li, J.; Qin, Y. Energy for sustainable road transportation in China: Challenges, initiatives and policy implications. Energy 2010, 35, 4289–4301. [Google Scholar] [CrossRef]
  14. Harrison, G.; Thiel, C.; Jones, L. Powertrain Technology Transition Market Agent Model (ptt-mam): An Introduction; EUR 27740; Publications Office of the European Union: Luxembourg, 18 March 2016. [Google Scholar]
  15. Ou, S.; Lin, Z.; Qi, L.; Li, J.; He, X.; Przesmitzki, S. The New Double-Credit Regulation: Quantifying Its Impact on Plug-In Electric Vehicle Sales and Industry Profits. In Proceedings of the Transportation Research Board 97th Annual Meeting, Washington, DC, USA, 7–11 January 2018. No. 18-04505. [Google Scholar]
  16. Li, Y.; Zhang, Q.; Liu, B.; Mclellan, B.; Gao, Y.; Tang, Y. Substitution effect of new-energy vehicle credit program and corporate average fuel consumption regulation for green-car subsidy. Energy 2018, 152, 223–236. [Google Scholar] [CrossRef]
  17. Wang, S.; Zhao, F.; Liu, Z. Impacts of a super credit policy on electric vehicle penetration and compliance with China’s corporate average fuel consumption regulation. Energy 2018, 155, 746–762. [Google Scholar] [CrossRef]
  18. Cui, H. China’s New Energy Vehicle Mandate Policy (Final Rule). Policy Update. ICCT Report; International Council on Clean Transportation (ICCT): Washington, DC, USA, 2018. [Google Scholar]
  19. Zhu, L.; Zhang, Q.; Lu, H.; Li, H.; Li, Y.; McLellan, B.; Pan, X. Study on crowdfunding’s promoting effect on the expansion of electric vehicle charging piles based on game theory analysis. Appl. Energy 2017, 196, 238–248. [Google Scholar] [CrossRef]
  20. Lu, L.; Ge, P.; Liu, S. The NEV mandate policy compliance cost calculation model based on energy saving and new energy technology path and its application. Auto Ind. Res. 2019, 2019, 41–44. [Google Scholar]
  21. Shepherd, S.; Bonsall, P.; Harrison, G. Factors affecting future demand for electric vehicles: A model based study. Transp. Policy 2012, 20, 62–74. [Google Scholar] [CrossRef]
  22. Sterman, J. System Dynamics: Systems Thinking and Modeling for a Complex World; Massachusetts Institute of Technology: Cambridge, MA, USA, 2002. [Google Scholar]
  23. Struben, J.; Sterman, J.D. Transition challenges for alternative fuel vehicle and transportation systems. Environ. Plan. B Plan. Des. 2008, 35, 1070–1097. [Google Scholar] [CrossRef]
  24. Train, K.E. Discrete Choice Methods with Simulation; Cambridge University Press: Cambridge, UK, 2009. [Google Scholar]
  25. Van Moerkerk, M.; Crijns-Graus, W. A comparison of oil supply risks in EU, US, Japan, China and India under different climate scenarios. Energy Policy 2016, 88, 148–158. [Google Scholar] [CrossRef]
  26. Wang, N.; Fu, G.; Li, Y.; Gong, Z. Economy benefit and business operating service pricing model of electric taxi. J. Tongji Univ. (Nat. Sci.) 2014, 42, 0976–0982. [Google Scholar]
  27. Ben-Akiva, M.E.; Lerman, S.R.; Lerman, S.R. Discrete Choice Analysis: Theory and Application to Travel Demand; MIT Press: Cambridge, MA, USA, 1985; Volume 9. [Google Scholar]
  28. Tan, H. Research on Consumers’ Preference for Buying New Energy Vehicles and Its Influencing Factors; Jiangsu University of Science and Technology: Zhejiang, China, 2014. [Google Scholar]
  29. Nie, C.; Jia, S. The basic principle and evolution of the discrete selection model are reviewed. Quant. Tech. Econ. 2005, 2005, 151–159. [Google Scholar]
  30. Guo, J.; Li, Y. Customer selection preference analysis based on discrete selection model. Technoeconomics Manag. Res. 2012, 13, 13–16. [Google Scholar]
  31. Batley, R.P.; Toner, J.P.; Knight, M.J. A mixed logit model of UK household demand for alternative-fuel vehicles. Int. J. Transp. Econ./Riv. Internazionale Econ. Trasp. 2004, 23, 55–77. [Google Scholar]
  32. Wu, C.; Zeng, D.; Chen, Y. System dynamics modeling and simulation of technology innovation network in high-tech enterprises. Syst. Eng. Theory Pract. 2010, 70, 587–593. [Google Scholar]
  33. Wang, N.; Gong, Z.; Zhao, J. Consumer ownership cost model of plug-in hybrid vehicle. J. Tongji Univ. Nat. Sci. 2012, 40, 793–799. [Google Scholar]
  34. Forrester, J.W. Industrial Dynamics. A major breakthrough for decision makers. Harv. Bus. Rev. 1958, 36, 37–66. [Google Scholar]
  35. Jiao, J.; Zuo, F.; Li, L.; Yuan, H.; Li, J. Estimation of China’s alternative policies of automotive fuels—A perspective of oil dependence. J. Clean. Prod. 2017, 161, 698–707. [Google Scholar] [CrossRef]
  36. Ou, S.; Lin, Z.; Wu, Z.; Zheng, J.; Lyu, R.; Przesmitzki, S.; He, X. A Study of China’s Explosive Growth in the Plug-In Electric Vehicle Market; TN 37831-6283; US Department of Energy: Oak Ridge, TN, USA, 2017. [Google Scholar]
  37. Ou, S.; Zhou, Y.; Lian, J.; Jia, P.; Tian, B. Development of hybrid city bus’s driving cycle. In Proceedings of the 2011 International Conference on Electric Information and Control Engineering, Wuhan, China, 15–17 April 2011; IEEE: New York, NY, USA, 2011; pp. 2112–2116. [Google Scholar]
  38. SAE China. Annual Report on Vehicle Technology in China 2016; Beijing Institute of Technology Press: Beijing, China, 2016. [Google Scholar]
  39. Diao, Q.; Sun, W.; Yuan, X.; Li, L.; Zheng, Z. Life-cycle private-cost-based competitiveness analysis of electric vehicles in China considering the intangible cost of traffic policies. Appl. Energy 2016, 178, 567–578. [Google Scholar] [CrossRef]
  40. Hu, Q. China will phase out subsidies for new energy vehicles by 2020. Pet. Petrochem. Energy Sav. 2018, 8, 38. [Google Scholar]
  41. Fearnley, N.; Pfaffenbichler, P.; Figenbaum, E.; Jellinek, R. E-Vehicle Policies and Incentives-Assessment and Recommendations. Institute of Transport Economics Norwegian Centre for Transport Research. Oslo: Norwegian Center for Transport Research. 2015. Available online: https://www.toi.no/getfile.php?mmfileid=41187 (accessed on 21 February 2023).
  42. Ajanovic, A.; Haas, R. Dissemination of electric vehicles in urban areas: Major factors for success. Energy 2016, 115, 1451–1458. [Google Scholar] [CrossRef]
  43. GB 27999-2014; Requirements Coefficient of Company Average Fuel Consumption. China Standards Press: Beijing, China, 2014.
Figure 1. Interaction Between CAFCs Policy and the Passenger Vehicle Market.
Wevj 16 00151 g001
Figure 2. Impact of NEV Credits Policy on the NEV and CV Markets.
Wevj 16 00151 g002
Figure 3. System Dynamics Model Framework for Assessing Dual-Credits Policy Impacts.
Wevj 16 00151 g003
Figure 4. Overall sales trend of passenger vehicles.
Wevj 16 00151 g004
Figure 5. Sales Trend of NEV in the Passenger Vehicle Market.
Wevj 16 00151 g005
Figure 6. Sales Trend of CV in the Passenger Vehicle Market.
Wevj 16 00151 g006
Figure 7. Market segment trend of BEV.
Wevj 16 00151 g007
Figure 8. Market segment trend of PHEV.
Wevj 16 00151 g008
Figure 9. Market segment trend of CV.
Wevj 16 00151 g009
Figure 10. NEV market share under different requirements of NEV credits ratio.
Wevj 16 00151 g010
Figure 11. NEV market share under different decline of NEV credits standard.
Wevj 16 00151 g011
Figure 12. NEV market share under mix scenarios.
Wevj 16 00151 g012
Figure 13. NEV market share under all scenarios.
Wevj 16 00151 g013
Table 1. Subscripts.
NameDescriptionElements
Powertrain (P)Each potential powertrain optionCV, BEV, PHEV
Vehicle Size (S)Size categories of vehiclesLarge, Middle, Small
Attributes (A)Attributes of vehiclesEnvironment, Performance, Reliability, Safety, Convenience, Popularity, Choice
Component (Ct)Major components of vehicle typesElectric drive system, Battery, CV engine, Body materials
Table 2. The detailed ratio requirements and standard of NEV credits in basic scenario.
Scenario TypeVehicle Type2019–20202021–20232024–20262027–2030
NEV credits ratio requirements Basic——10%, 12%14%, 16%, 18%18%, 18%, 18%18%, 18%, 18%, 18%
NEV credits standardBEV0.012 × R + 0.80.006 × R + 0.40.006 × R + 0.40.006 × R + 0.4
PHEV21.61.61.6
Note: R refers to the driving range of battery electric vehicles.
Table 3. National and provincial subsidy levels for charging infrastructure (Per kW).
Subsidies for Charging Infrastructure2019–20202021–20232024–20252026–2030
National Subsidies (CNY/KW)16013010070
Provincial Subsidies (CNY/KW)15013011090
Table 4. The detailed requirements of changing NEV credits ratio requirements.
YearScenario TypeVehicle
Type
2019–20202021–20232024–20262027–2030
NEV credits ratio requirements Basic ——10%, 12%14%, 16%, 18%18%, 18%, 18%18%, 18%, 18%, 18%
Conservative 10%, 12%14%, 16%, 18%20%, 22%, 24%26%, 28%, 30%, 32%
Radical 10%, 12%14%, 16%, 18%21%, 24%, 27%30%, 33%, 36%, 39%
NEV credits standardBasic
Conservative
Radical
BEV0.012 × R + 0.80.006 × R + 0.40.006 × R + 0.40.006 × R + 0.4
PHEV21.61.61.6
Note: R refers to the driving range of battery electric vehicles.
Table 5. The detailed standard of changing NEV credits standard.
YearScenario TypeVehicle Type2019–20202021–20232024–20262027–2030
NEV credits ratio requirements Basic
Conservative
Radical
——10%, 12%14%, 16%, 18%18%, 18%, 18%18%, 18%, 18%, 18%
NEV credits standardBasic BEV0.012 × R + 0.80.006 × R + 0.40.006 × R + 0.40.006 × R + 0.4
PHEV21.61.61.6
Conservative BEV0.012 × R + 0.80.006 × R + 0.40.003 × R + 0.20.003 × R + 0.2
PHEV21.61.281.28
Radical BEV0.012 × R + 0.80.006 × R + 0.40.003 × R + 0.20.0015 × R + 0.2
PHEV21.61.281.02
Note: R refers to the driving range of battery electric vehicles.
Table 6. The detailed requirements and standard of combinative scenarios.
YearScenario TypeVehicle Type2019–20202021–20232024–20262027–2030
NEV credits ratio requirements Basic——10%, 12%14%, 16%, 18%18%, 18%, 18%18%, 18%, 18%, 18%
Conservative10%, 12%14%, 16%, 18%20%, 22%, 24%26%, 28%, 30%, 32%
Radical10%, 12%14%, 16%, 18%21%, 24%, 27%30%, 33%, 36%, 39%
NEV credits standardBasic BEV0.012 × R + 0.80.006 × R + 0.40.006 × R + 0.40.006 × R + 0.4
PHEV21.61.61.6
Conservative BEV0.012 × R + 0.80.006 × R + 0.40.003 × R + 0.20.003 × R + 0.2
PHEV21.61.281.28
Radical BEV0.012 × R + 0.80.006 × R + 0.40.003 × R + 0.20.0015 × R + 0.2
PHEV21.61.281.02
Table 7. The detailed ratio requirements and standard of NEV credits due to the latest draft.
Scenario TypeVehicle Type2019–20202021–20232024–20252026–2030
NEV credits ratio requirements Latest draft——10%, 12%14%, 16%, 18%28%, 38%38%
NEV credits standardBEV0.012 × R + 0.80.006 × R + 0.40.0034 × R + 0.20.0034 × R + 0.2
PHEV21.611
Note: R refers to the driving range of battery electric vehicles.
Disclaimer/Publisher’s Note: The statements, opinions and data contained in all publications are solely those of the individual author(s) and contributor(s) and not of MDPI and/or the editor(s). MDPI and/or the editor(s) disclaim responsibility for any injury to people or property resulting from any ideas, methods, instructions or products referred to in the content.

