


The Practical Learning on Electric Bus Conversion to Support Carbon Neutrality Policy in Thailand’s Transport Sector

 ,
, 
Abstract
1. Introduction
2. Research Methodology and Planning
2.1. Research Methodology
- Planning is the process of identifying the problem or issue to be solved, setting research objectives, and designing the operational guidelines and data collection methods.
- An action is to put the plan into practice in real situations, recording the process and the results.
- Observation and data collection includes observing the results of operations and collecting various data.
- Reflection comprises analyzing the results obtained, comparing them with the set goals, and using the findings to improve the operational guidelines and implement new processes in the next round for continuous development.
2.2. Research Planning
2.2.1. Problems or Issues That Need to Be Resolved
- There is a lack of teachers or educational personnel with theoretical and practical knowledge in electric vehicles.
- In the manufacturing industry, there is a shortage of personnel with theoretical and practical knowledge in electric vehicles.
- There is a shortage of personnel for electric vehicle maintenance to support the use of electric vehicles in line with government policy.
2.2.2. Research Objectives
- Develop the theoretical knowledge and practical practice of educational personnel through action research;
- Design and analyze the size of the motor and battery to find the most suitable size;
- Convert old internal combustion buses into electric buses and pass the required tests;
- Create knowledge and experience in modifying old internal combustion buses into electric buses, which can be used to develop human resources in electric vehicles and promote government policies.
2.2.3. Design Research Guidelines
- Electric bus conversion prototype design;
- Construction design and prototype production;
- Prototype testing;
- Discussion and conclusion of the research results;
- Preparing documents for publication as academic articles to serve as knowledge and guidelines for further research.
3. Research Actions
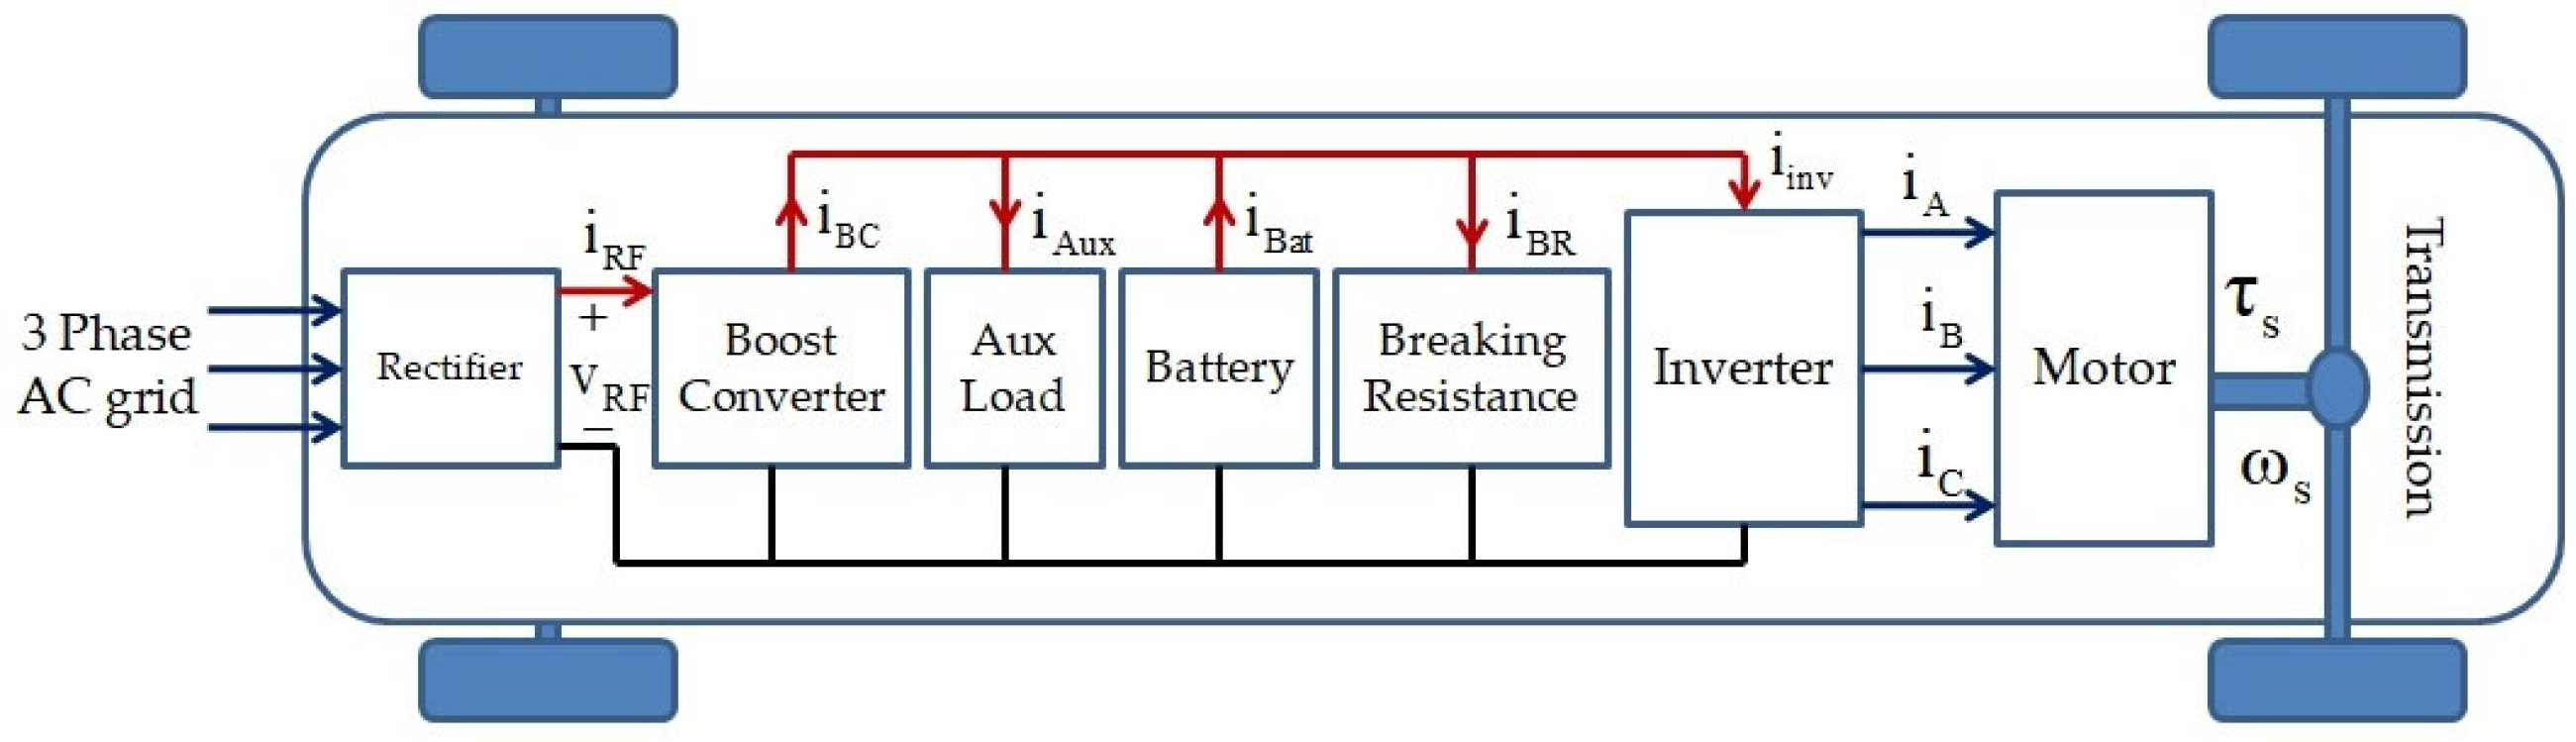
3.1. Electric Bus Conversion Prototype Design
3.1.1. Subsection Dynamic Force Model
- Aerodynamic drag ();
- Rolling resistance ();
- Gravitational force on inclines ();
- Inertial force ().
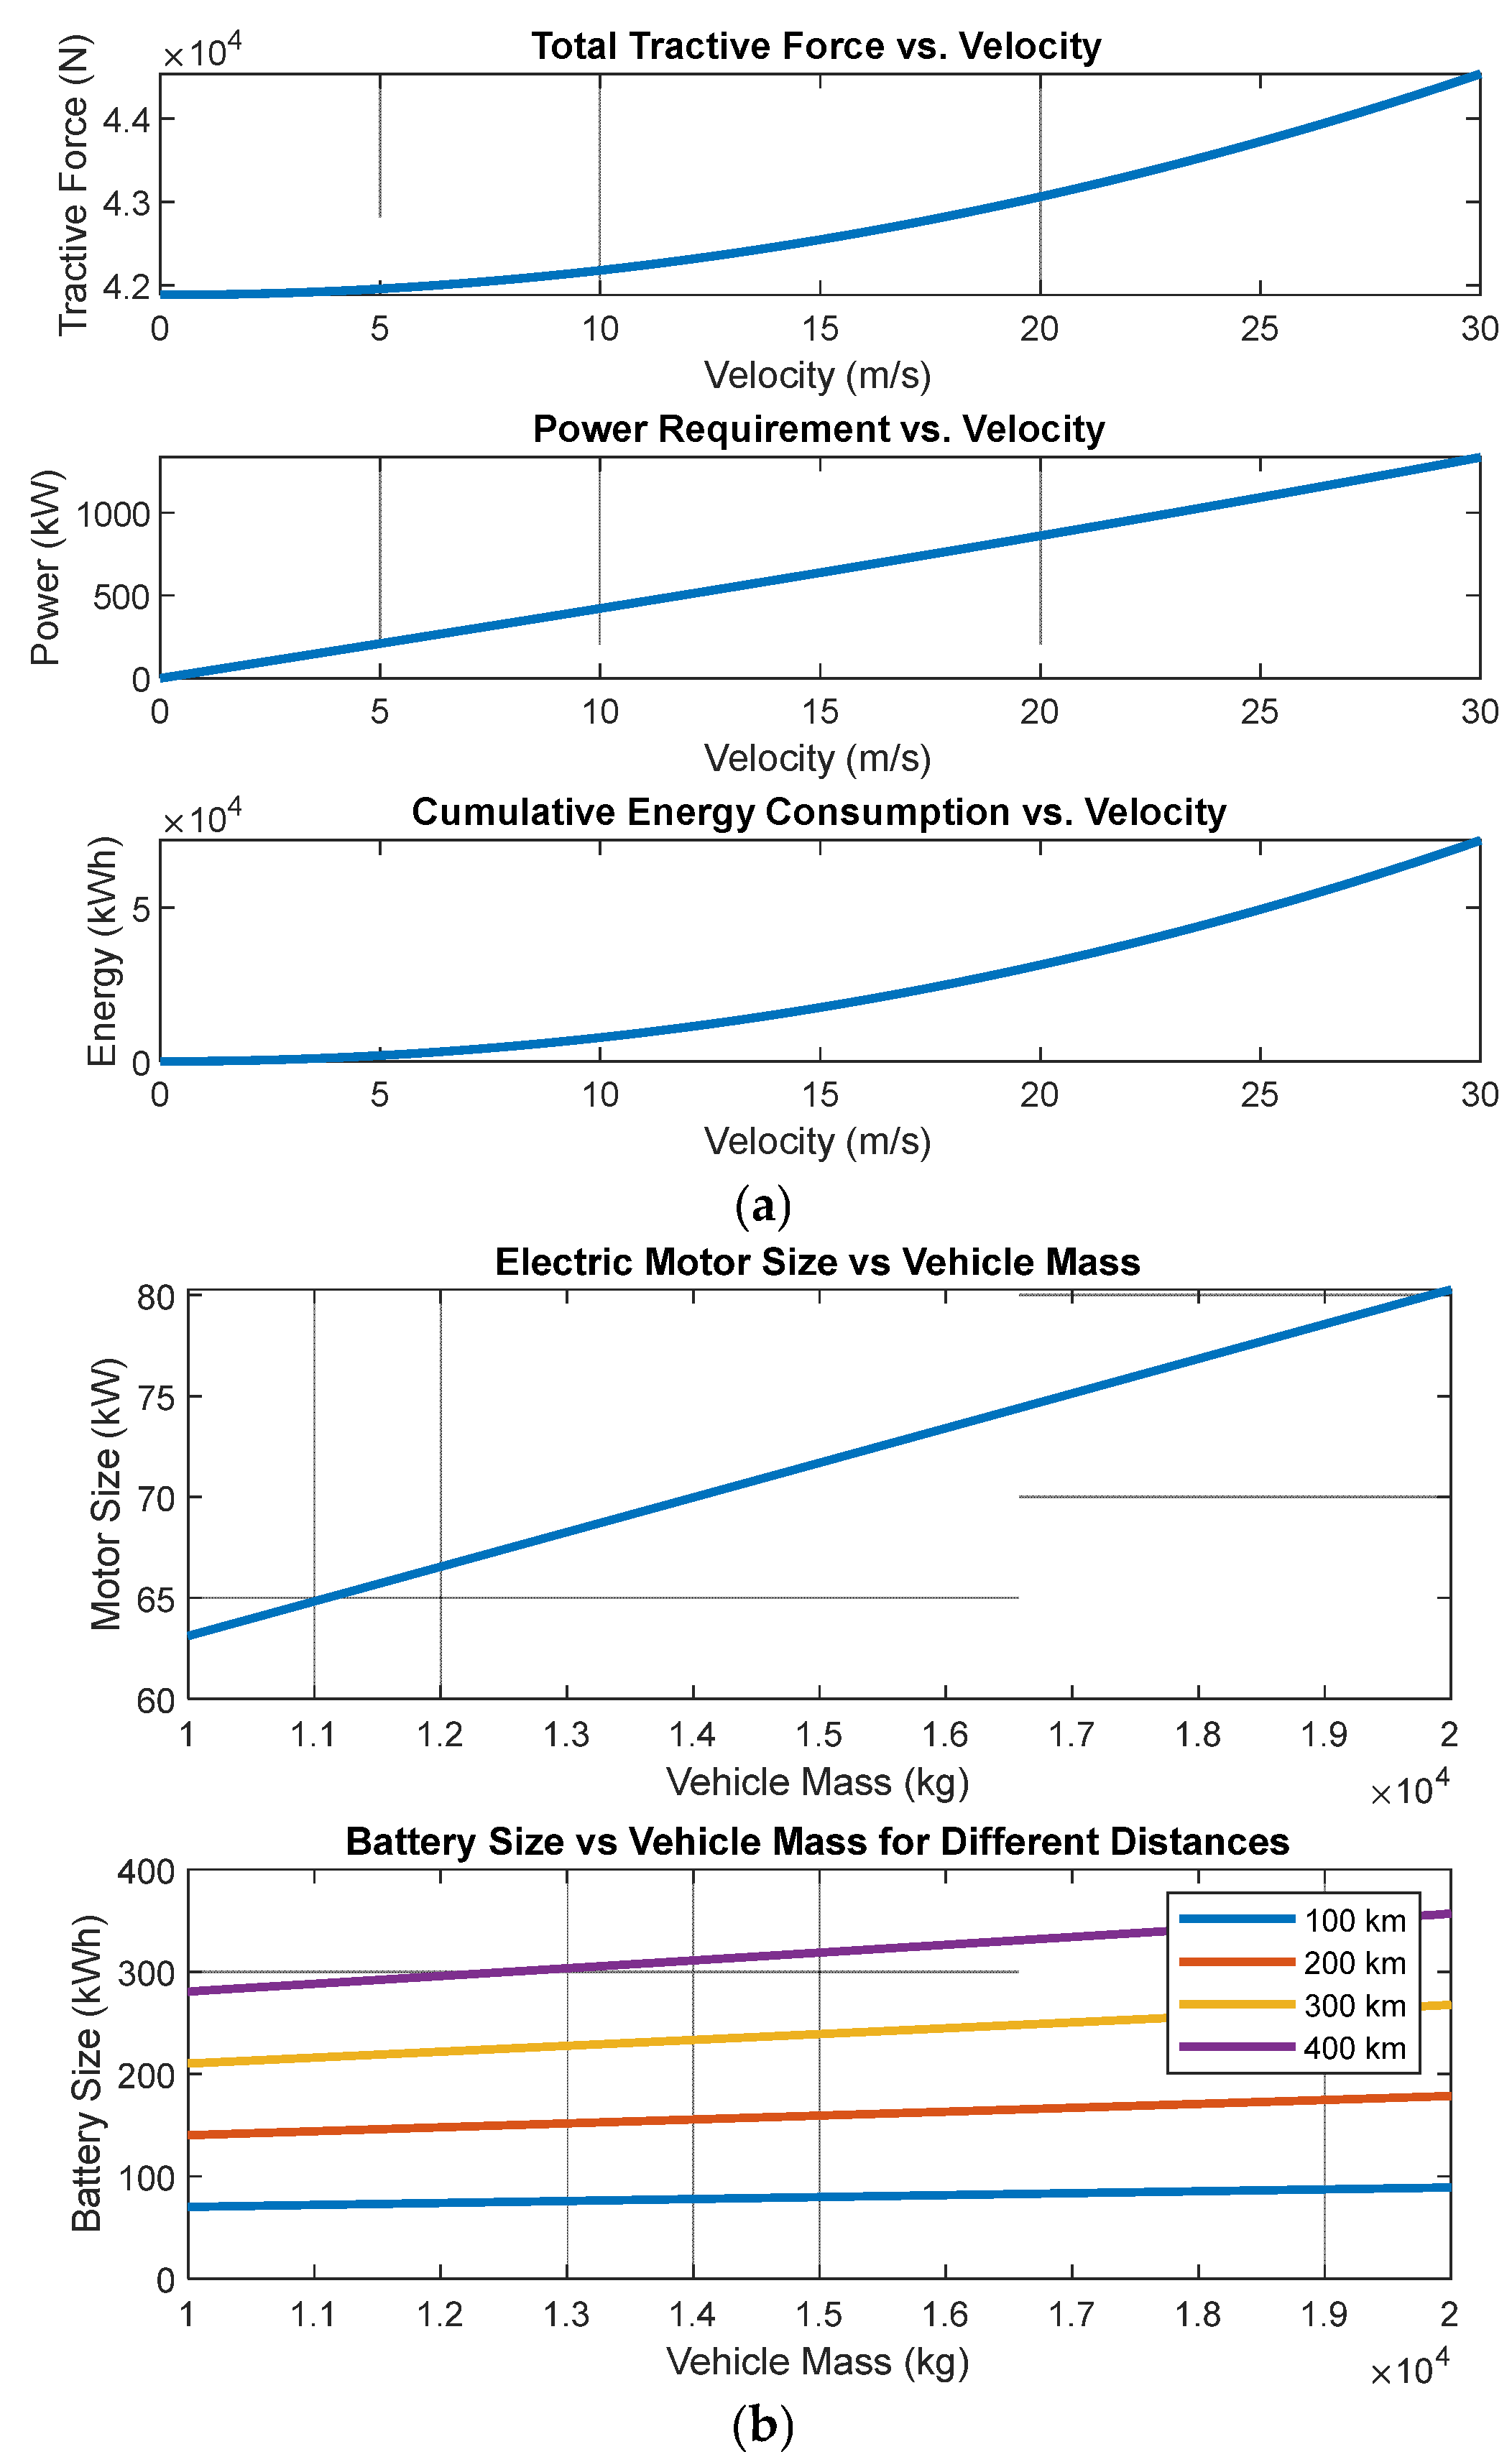
- 1.
- Define constants and parameters:
- Air density, drag coefficient, frontal area, vehicle mass, rolling resistance coefficient, and road incline angle are defined.
- The maximum velocity and velocity profile over the specified distance are also defined.
- 2.
- Calculate forces: The aerodynamic drag force (), rolling resistance force (), gravitational force on inclines (), and inertial force () are computed.
- 3.
- Total tractive force: The total tractive force is calculated by summing up the individual forces.
- 4.
- Power requirement: The power required by the electric motor to provide the tractive force is computed.
- 5.
- Energy consumption: The energy consumption over the specified distance is calculated using numerical integration.
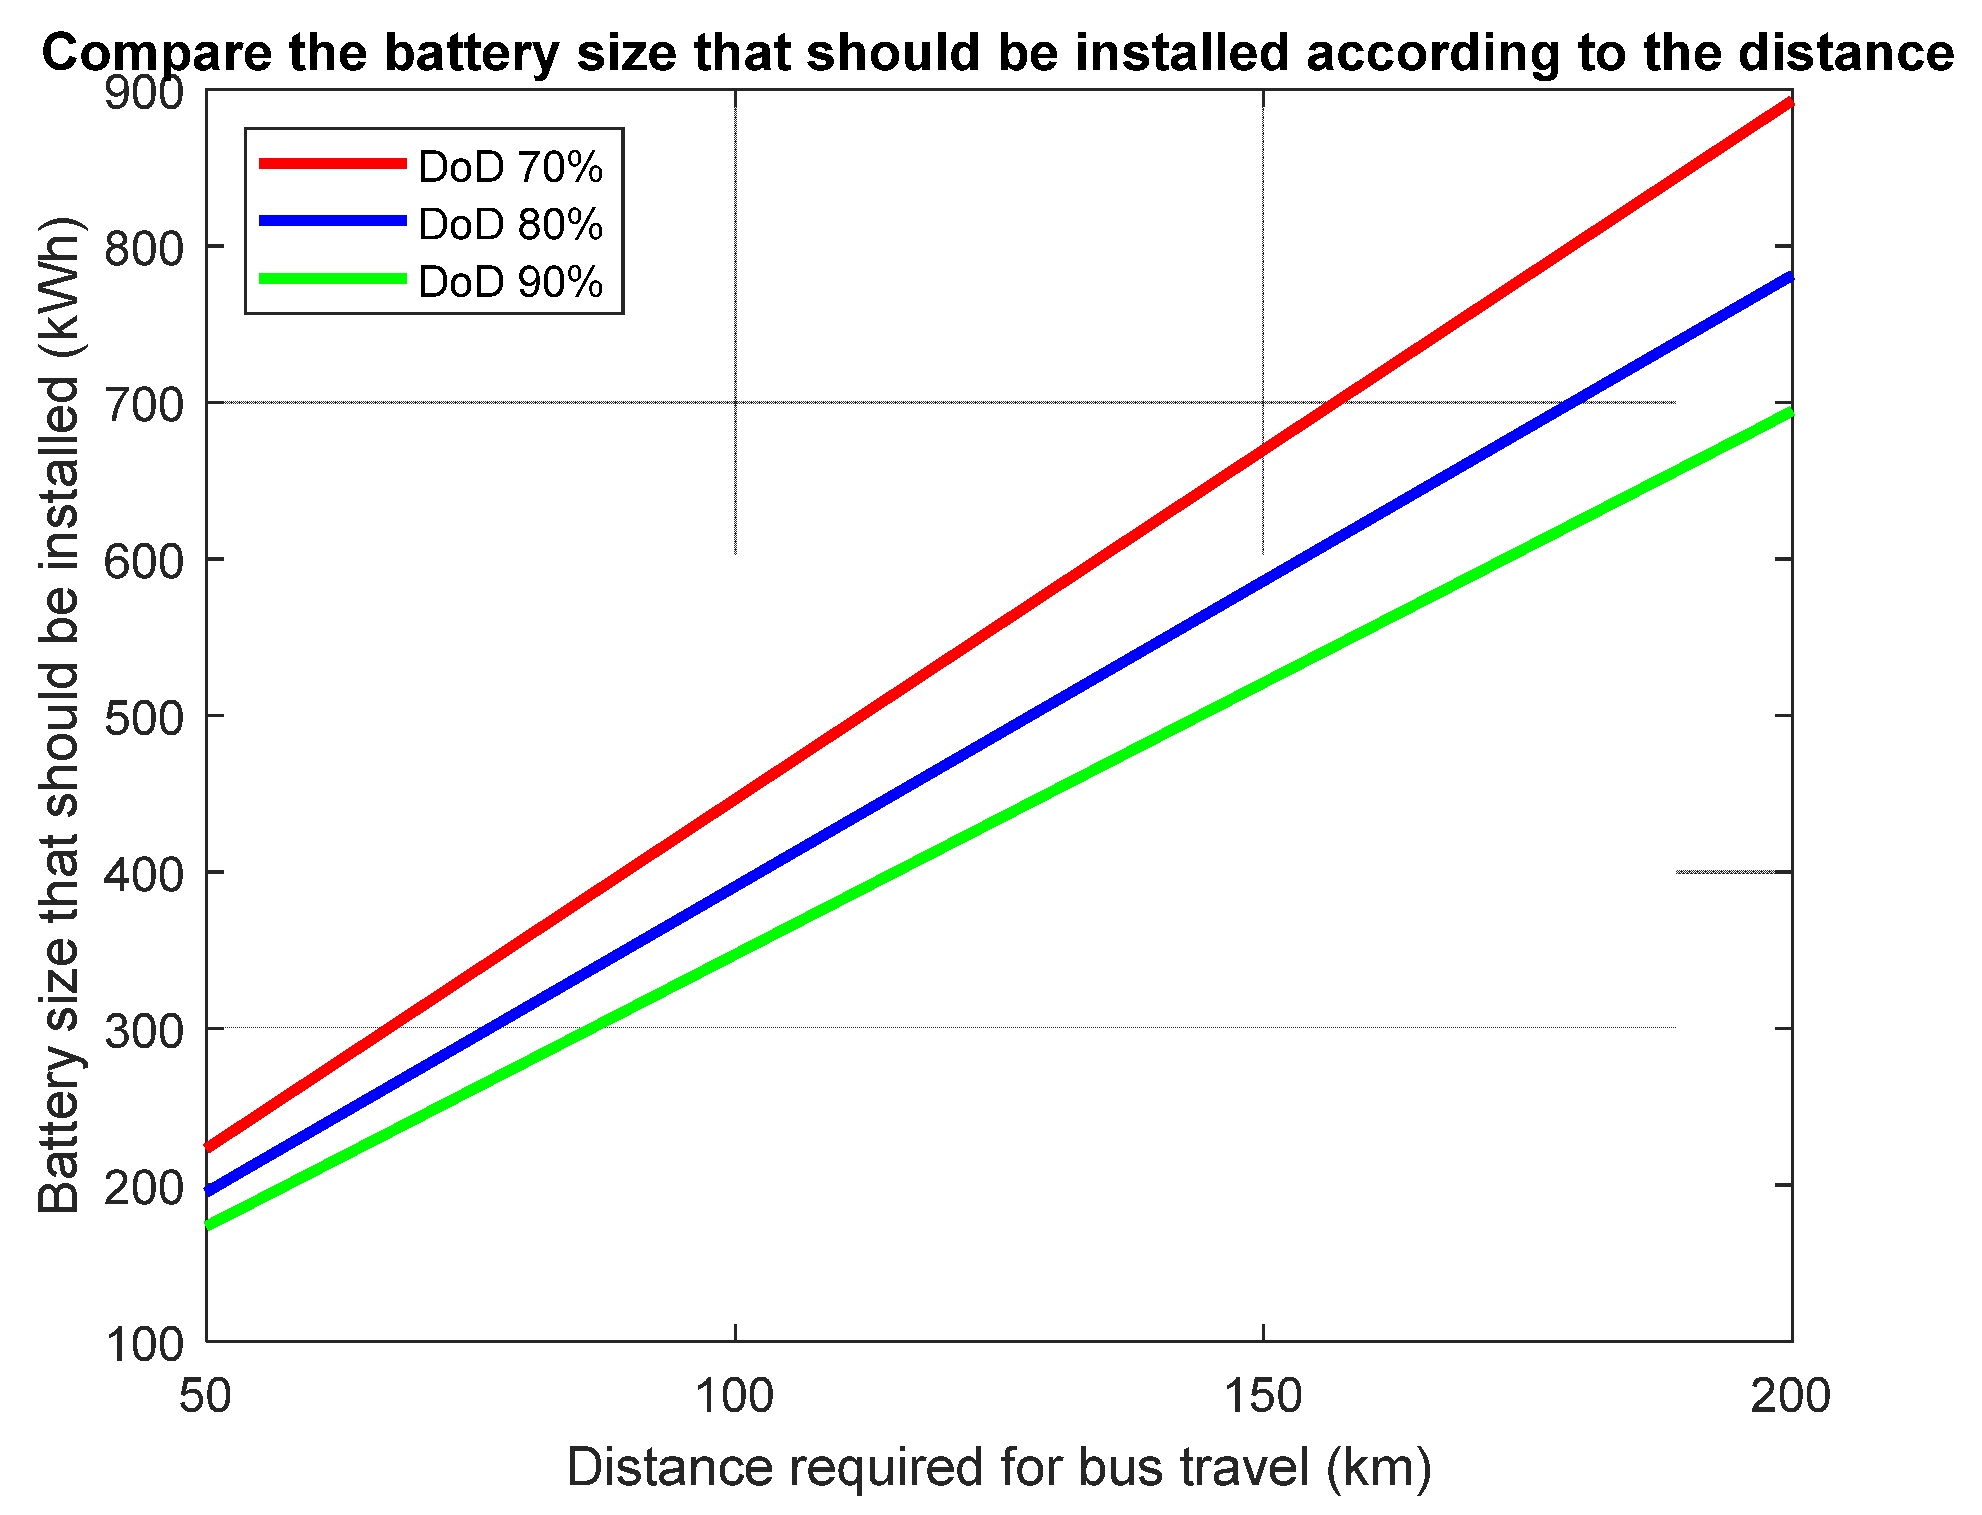
3.1.2. Electric Motor and Battery Sizing Design
- Air density (): 1.225 kg/m3
- Drag coefficient (): 0.6
- Frontal area (): 8 m2
- Vehicle mass (): 15,000 kg
- Rolling resistance coefficient (): 0.007
3.2. Construction Design and Prototype Production
3.3. Prototype Testing
3.3.1. Center of Gravity Test
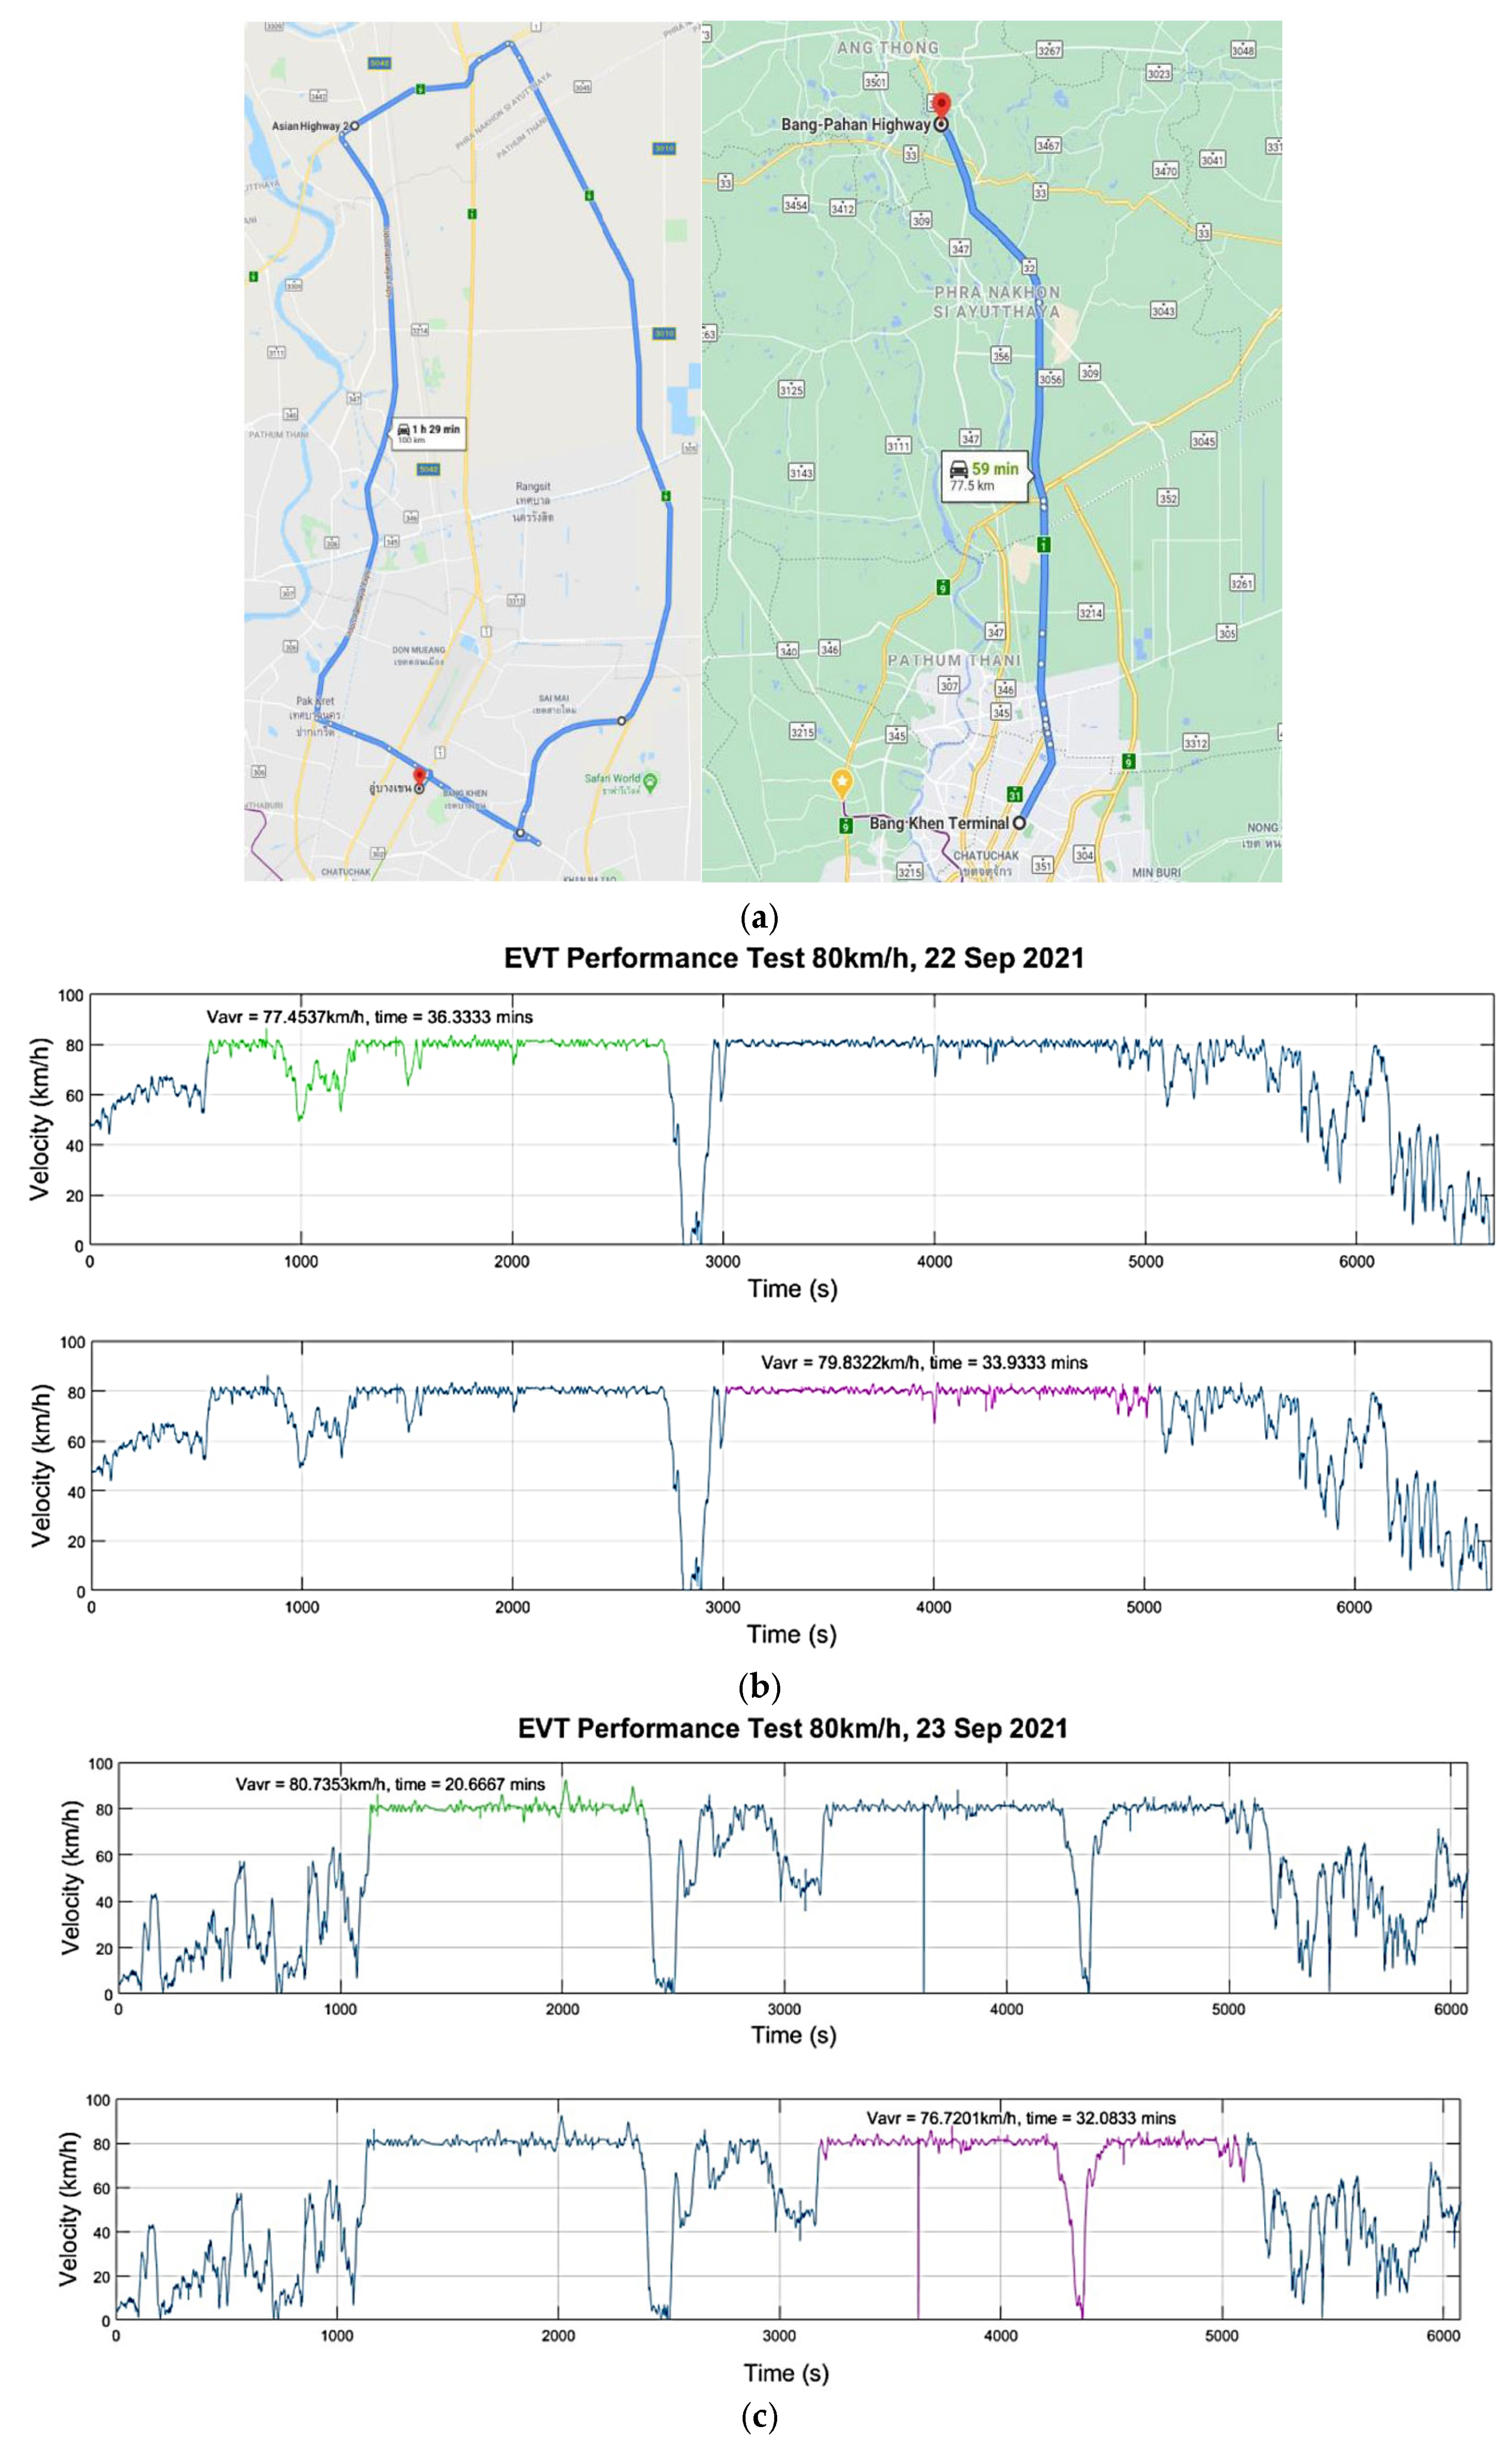
3.3.2. Driving Performance and Energy Consumption Test
3.3.3. Charging/Discharge and Energy Consumption Test
3.3.4. Slope-Driving Test
3.3.5. Emergency Break Test
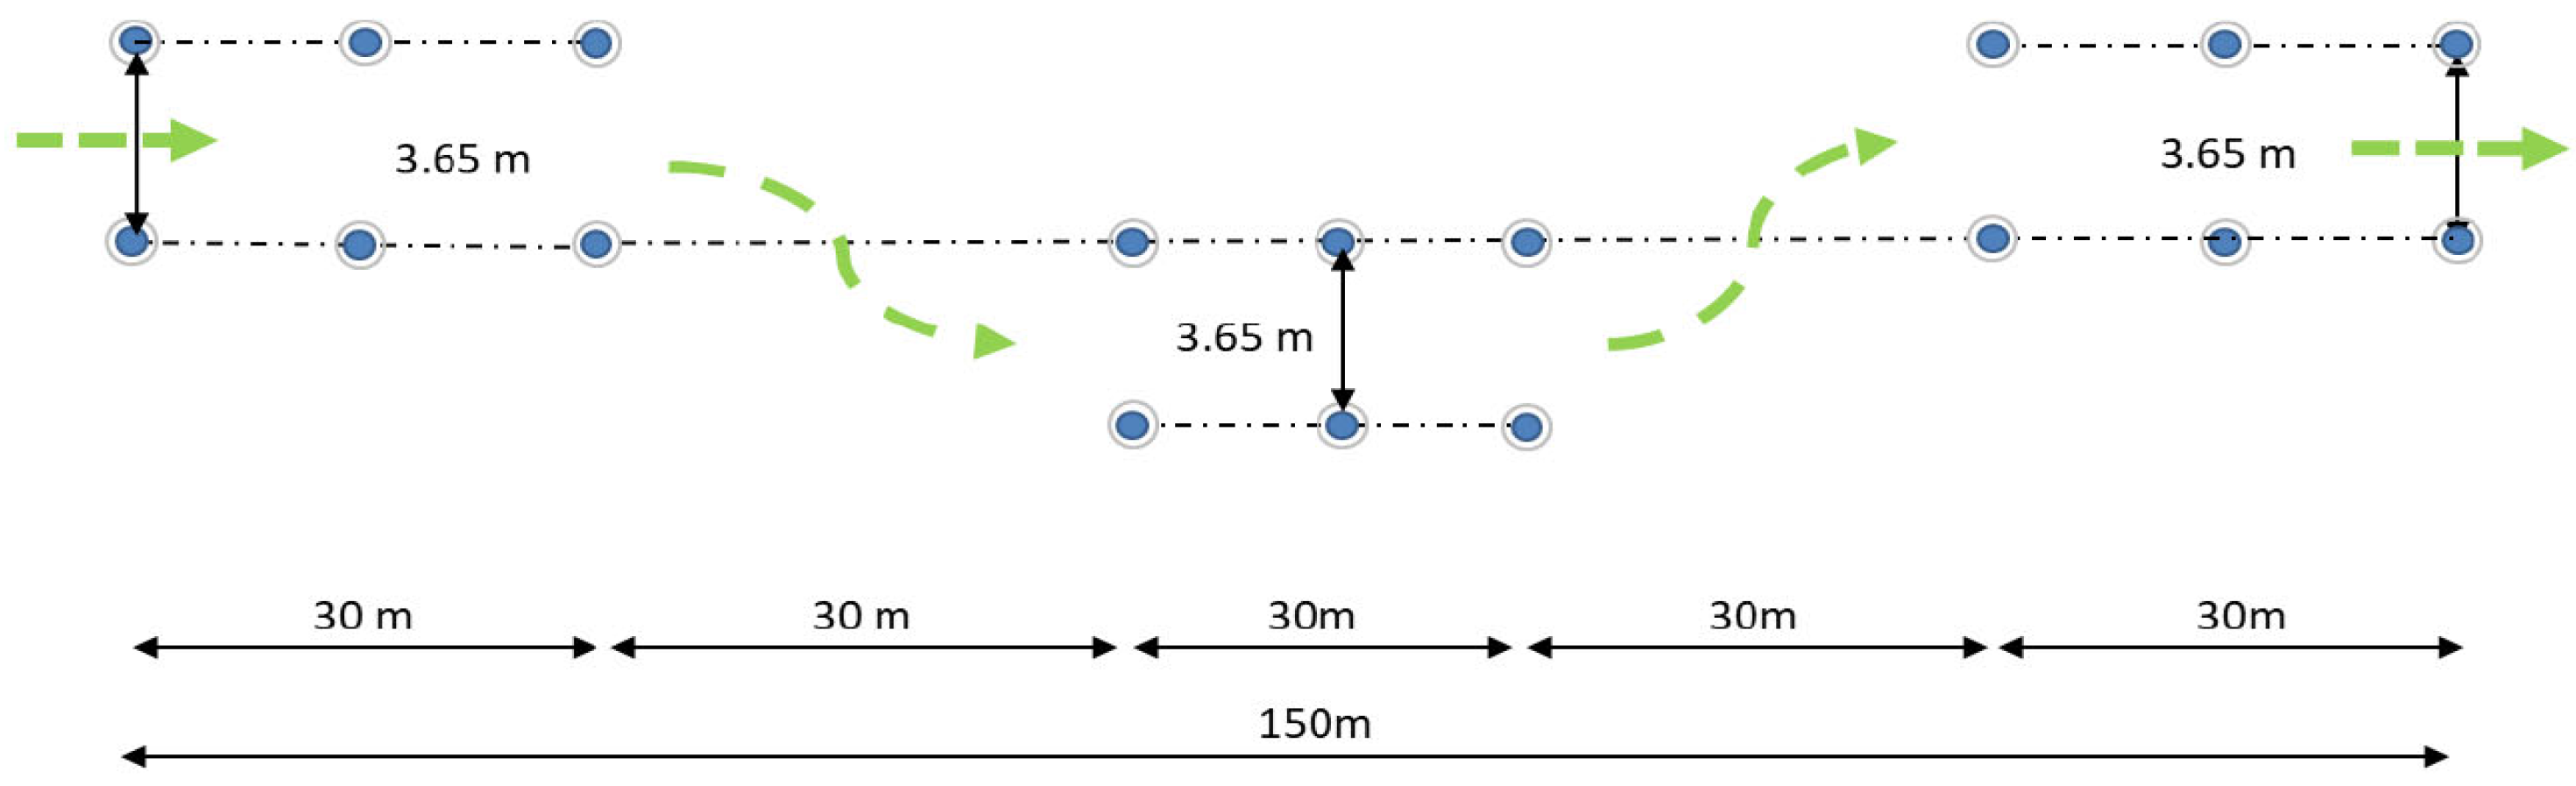
3.3.6. Sudden Lane-Change Performance Testing
3.3.7. Flood Driving and Electrical Safety Testing
4. Results and Discussion
5. Conclusions
Author Contributions
Funding
Data Availability Statement
Conflicts of Interest
References
- Office of Natural Resources and Environmental Policy and Planning, Ministry of Natural Resources and Environment. Thailand Longterm Low Greenhouse Gas Emission Development Strategy (Revised Version), November 2022. Available online: https://unfccc.int/sites/default/files/resource/Thailand%20LT-LEDS%20%28Revised%20Version%29_08Nov2022.pdf (accessed on 10 January 2025).
- International Energy Agency. Global EV Outlook 2024 Moving Towards Increased Affordability. IEA Publications. 2024. Available online: https://www.iea.org/reports/global-ev-outlook-2024 (accessed on 10 January 2025).
- OPEC. 2023 World Oil Outlook 2045. Organization of the Petroleum Exporting Countries. Helferstorferstrasse 17 A-1010 Vienna, Austria. Available online: https://vert.eco/wp-content/uploads/2023/10/ES_WOO_2023.pdf (accessed on 10 January 2025).
- Energy Policy and Planning Office. Carbon Dioxide Emissions (CO2) from Energy Use 2023; Information and Communication Technology Center, Energy Policy and Planning Office, Ministry of Energy: Bangkok, Thailand, 2024.
- Nordin, S.K.S.; Hamzah, K.; Khashi’ie, N.S.; Zainal, N.A.; Halim, B.A. Testing Environmental Kuznets Curve (EKC) Hypothesis in ASEAN Countries: Evidence based on STIRPAT Framework with Cross-Sectional Dependency. J. Adv. Res. Appl. Sci. Eng. Technol. 2025, 46, 227–238. [Google Scholar] [CrossRef]
- Zhang, X.; Yin, S.; Lu, X.; Liu, Y.; Wang, T.; Zhang, B.; Li, Z.; Wang, W.; Kong, M.; Chen, K. Establish of air pollutants and greenhouse gases emission inventory and co-benefits of their reduction of transportation sector in Central China. J. Environ. Sci. 2025, 150, 604–621. [Google Scholar] [CrossRef] [PubMed]
- Huang, A.; Chu, M.; Cheng, W.; Wang, G.; Guan, P.; Zhang, L.; Jia, J. Dynamic evaluation of China’s atmospheric environmental pressure from 2008 to 2017: Trends and drivers. J. Environ. Sci. 2025, 150, 177–187. [Google Scholar] [CrossRef] [PubMed]
- Lin, L.Y.; Jing, K.T.; Qing, C.T.; Yee, H.C. Sustainable Development in Renewable Energy: Solar Energy Application in Malaysia. J. Adv. Res. Appl. Sci. Eng. Technol. 2025, 43, 1–16. [Google Scholar]
- Zhang, Y.; Lin, R.; Mei, Z.; Zhang, J.; Gao, D.W. Interior-point policy optimization based multi-agent deep reinforcement learning method for secure home energy management under various uncertainties. Appl. Energy 2024, 376, 124155. [Google Scholar] [CrossRef]
- Janhuaton, T.; Ratanavaraha, V.; Jomnonkwao, S. Forecasting Thailand’s Transportation CO2 Emissions: A Comparison among Artificial Intelligent Models. Forecasting 2024, 6, 462–484. [Google Scholar] [CrossRef]
- Yu, S.; Gong, Z.; Gao, M.; Li, J.; Xie, W.; Wei, Y.; Li, D.; Yang, L.; Chen, D.; Li, Y.; et al. In-situ construction of nano-multifunctional interlayer to obtain intimate Li/garnet interface for dendrite-free all solid-state battery. J. Mater. Sci. Technol. 2025, 206, 248–256. [Google Scholar] [CrossRef]
- Jiang, P.; Zhou, H.; Song, S.; Suzuki, K.; Watanabe, K.; Yamaguchi, Y.; Matsui, N.; Hori, S.; Kanno, R.; Hirayama, M. A composite cathode with a three-dimensional ion/electron-conducting structure for all-solid-state lithium–sulfur batteries. Commun. Mater. 2024, 5, 105. [Google Scholar] [CrossRef]
- Liu, G.; Zhang, J.; Yang, J.; Chen, J.; Xiao, X.; Yao, X. Highly conductive and stable iodine doped argyrodite electrolyte for all-solid-state lithium batteries. J. Energy Chem. 2025, 100, 50–58. [Google Scholar] [CrossRef]
- Fan, B.; Zhang, B.; Shi, Y.; Chang, Y. A high-fidelity lithium-ion battery emulator for electric vehicle application. Sci. Rep. 2024, 14, 19742. [Google Scholar] [CrossRef]
- Bae, S.; Lee, J.; Kim, D.S. The effect of Cr3+-Functionalized additive in zinc-bromine flow battery. J. Power Sources 2019, 413, 167–173. [Google Scholar] [CrossRef]
- Shi, Z.; Sun, X.; Cai, Y.; Yang, Z. Robust Design Optimization of a Five-Phase PM Hub Motor for Fault-Tolerant Operation Based on Taguchi Method. IEEE Trans. Energy Convers. 2020, 35, 2036–2044. [Google Scholar] [CrossRef]
- Zhou, Y.; Lin, X.; Cheng, M. A Fault-Tolerant Direct Torque Control for Six-Phase Permanent Magnet Synchronous Motor with Arbitrary Two Opened Phases Based on Modified Variables. IEEE Trans. Energy Convers. 2016, 31, 549–556. [Google Scholar] [CrossRef]
- Kasri, A.; Ouari, K.; Belkhier, Y.; Bajaj, M.; Zaitsev, I. Optimizing electric vehicle powertrains peak performance with robust predictive direct torque control of induction motors: A practical approach and experimental validation. Sci. Rep. 2024, 14, 14977. [Google Scholar] [CrossRef]
- Zhang, B.; Kezunovic, M. Impact on Power System Flexibility by Electric Vehicle Participation in Ramp Market. IEEE Trans. Smart Grid 2016, 7, 1285–1294. [Google Scholar] [CrossRef]
- Qiu, Y.; Deng, N.; Wang, B.; Shen, X.; Wang, Z.; Hultman, N.; Shi, H.; Liu, J.; Wang, Y.D. Power supply disruptions deter electric vehicle adoption in cities in China. Nat. Commun. 2024, 15, 6041. [Google Scholar] [CrossRef]
- Taksana, R.; Janjamraj, N.; Romphochai, S.; Bhumkittipich, K.; Mithulananthan, N. Design of Power Transformer Fault Detection of SCADA Alarm Using Fault Tree Analysis, Smooth Holtz-Winters, and L-BFGS for Smart Utility Control Centers. IEEE Access 2024, 12, 116302–116324. [Google Scholar] [CrossRef]
- Deeum, S.; Charoenchan, T.; Janjamraj, N.; Romphochai, S.; Baum, S.; Ohgaki, H.; Mithulananthan, N.; Bhumkittipich, K. Optimal Placement of Electric Vehicle Charging Stations in an Active Distribution Grid with Photovoltaic and Battery Energy Storage System Integration. Energies 2023, 16, 7628. [Google Scholar] [CrossRef]
- Liu, Z.; Huadan, C.; Wang, B.; Li, P. Coupling optimization of protruding fin and PCM in hybrid cooling system and cycle strategy matching for lithium-ion battery thermal management. Int. J. Therm. Sci. 2025, 207, 109372. [Google Scholar] [CrossRef]
- Zhang, W.; Xu, J. Advanced lightweight materials for Automobiles: A review. Mater. Des. 2022, 221, 110994. [Google Scholar] [CrossRef]
- Ramakrishnan, V.; Savio, A.D.; Balaji, C.; Narayanamoorthi, R.; Kotb, H.; Elrashidi, A.; Nureldeen, W. A Comprehensive Review on Efficiency Enhancement of Wireless Charging System for Electric Vehicles Applications. IEEE Access 2024, 12, 46967–46994. [Google Scholar] [CrossRef]
- Peng, Z.; Wang ZWang, S.; Chen, A.; Zhuge, C. Fuel and infrastructure options for electrifying public transit: A data-driven micro-simulation approach. Appl. Energy 2024, 3691, 123577. [Google Scholar] [CrossRef]
- Wołek, M.; Szmelter-Jarosz, A.; Koniak, M.; Golejewska, A. Transformation of Trolleybus Transport in Poland. Does In-Motion Charging (Technology) Matter? Sustainability 2020, 12, 9744. [Google Scholar] [CrossRef]
- Połom, M. Technology development and spatial diffusion of auxiliary power sources in trolleybuses in european countries. Energies 2021, 14, 3040. [Google Scholar] [CrossRef]
- Połom, M. Transformations of Trolleybus Transport in Belarus, Russia and Ukraine in 1990–2020. In Innovations and Traditions for Sustainable Development; Leal Filho, W., Krasnov, E.V., Gaeva, D.V., Eds.; World Sustainability Series; Springer: Cham, Switzerland, 2021. [Google Scholar] [CrossRef]
- Rodrigues, G.S.; Reis, J.G.M.D.; Orynycz, O.; Tucki, K.; Matijošius, J.; Machado, S.T. Environmental Impact Reduction of a Trolleybus System in the City of São Paulo, Brazil. Energies 2024, 17, 1377. [Google Scholar] [CrossRef]
- Yang, H.; Chai, L.; Huang, W.; Yang, Z.; Zhao, F.; Ye, J. Collaborative Optimization of Dual-source Trolleybuses and Electric Buses Considering Road Traffic Information. Dianli Xitong Zidonghua/Autom. Electr. Power Syst. 2024, 48, 77–87. [Google Scholar]
- Iamtrakul, P. The Study on Developing a Trolley Bus System as an Alternative Mode of Public Transportation in Pattaya, Chonburi, Province. Local Adm. J. 2018, 11, 4. [Google Scholar]
- Zhao, X.; Li, X.; Jiao, D.; Mao, Y.; Sun, J.; Liu, G. Policy incentives and electric vehicle adoption in China: From a perspective of policy mixes. Transp. Res. Part A Policy Pract. 2024, 190, 104235. [Google Scholar] [CrossRef]
- Dua, R.; Almutairi, S.; Bansal, P. Emerging energy economics and policy research priorities for enabling the electric vehicle sector. Energy Rep. 2024, 12, 1836–1847. [Google Scholar] [CrossRef]
- Niu, C.; Chen, Q.; Tu, R.; Huang, D.; Ye, Y. Co-optimizing electric bus dispatching and charging considering limited resources and battery degradation. Multimodal Transp. 2024, 3, 100165. [Google Scholar] [CrossRef]
- Janjamraj, N.; Changsarn, N.; Hiranvarodom, S. Design of Traction Motor and Battery for The Modification of Old BMTA Public Bus to E-Bus. In Proceedings of the 2021 9th International Electrical Engineering Congress (iEECON), Pattaya, Thailand, 10–12 March 2021; pp. 101–104. [Google Scholar] [CrossRef]
- ISO 19380:2019; Heavy Commercial Vehicles and Buses—Centre of Gravity Measurements—Axle Lift, Tilt-Table and Stable Pendulum Test Methods, Edition 1. International Organization for Standardization: Geneva, Switzerland, 2019.
- Regulation No 13 of the Economic Commission for Europe of the United Nations (UN/ECE)—Uniform Provisions Concerning the Approval of Vehicles of Categories M, N and O with Regard to Braking [2016/194]. Available online: https://op.europa.eu/en/publication-detail/-/publication/0a43f880-d612-11e5-a4b5-01aa75ed71a1/language-en (accessed on 10 January 2025).
- ISO 3888-2:2011; Passenger Cars—Test Track for a Severe Lane-Change Manoeuvre, Part 2: Obstacle Avoidance, Edition 2. International Organization for Standardization: Geneva, Switzerland, 2011.


| Bus Types | Bus Age (Years) | ||||||
|---|---|---|---|---|---|---|---|
| 0–5 | 6–10 | 11–15 | 16–20 | >20 | Not Specified | Total | |
| Public Buses | 7264 | 7448 | 9667 | 6902 | 23,414 | 17 | 54,712 |
| Travel Buses | 10,573 | 15,424 | 8291 | 6564 | 17,032 | 15 | 57,899 |
| Private Buses | 2436 | 2397 | 1955 | 2236 | 4965 | 2 | 13,991 |
| Total | 20,273 | 25,269 | 19,913 | 15,702 | 45,411 | 34 | 126,602 |
| Items | Empty Bus | Full Load Bus |
|---|---|---|
| Weight on front axle | 4955 kg | 6073 kg |
| Rear axle weight | 7228 kg | 8860 kg |
| Total weight | 12,183 kg | 14,933 kg |
| Wheelbase length | 6 m | |
| Between wheel width | Front 2.1 m, Rear 1.97 m | |
| Tire statistical collapse radius | 450 mm | |
| Weight distribution (F:R) | 40.7:59.3 | |
| Horizontal center of gravity | X = 3560 mm, Y = 6 mm | |
| Weight on rear axle (full load) | 8860 kg < 11 tons | |
| Duration | 7:30:42 h | Avg. Charging | 8:40 h |
|---|---|---|---|
| Distance | 117.38 km | 29.3 A | |
| SoC@start | 100% | Max charging current | I1 = 30.18 A |
| SoC@end | 42.79% | I2 = 28.86 A | |
| Δ SoC | 57.21% | I3 = 29.23 A | |
| Vmax | 64.61 km/h | Avg. charging power | 20.15 kW |
| Vavg | 16.53 km/h | Max charging Power | 20.42 kW |
| Range@80%SoC | 164 km | Consumption | 105.64 kWh/100 km |
| Duration | 2:05 h | Avg. Charging | 8:51 h |
|---|---|---|---|
| Distance | 108 km | 29.55 A | |
| SoC@start | 94% | Max charging current | I1 = 30.44 A |
| SoC@end | 48% | I2 = 29.28 A | |
| Δ SoC | 46% | I3 = 29.50 A | |
| Vmax | 86.95 km/h | Avg. charging power | 20.34 kW |
| Vavg | 60.91 km/h | Max charging Power | 20.47 kW |
| Range@80%SoC | 187.18 km | Consumption | 96.87 kWh/100 km |
| Speed | Distance (m) | MFDD (g) | Center Line Deviation | Max. Brake Force (N) |
|---|---|---|---|---|
| 30 km/h | 8.69 | 0.61 | −0.11 | 506.236 |
| 50 km/h | 26.15 | 0.64 | −0.54 | 740.570 |
| 70 km/h | 39.69 | 0.65 | −0.11 | 955.186 |
| Nominal Speed (km/h) | Speed at Start (km/h) | Speed at End (km/h) | Max. Lateral Acceleration (g) | Results |
|---|---|---|---|---|
| 50 | 53.05 | 49.71 | 0.20 | Pass |
| 60 | 61.36 | 55.69 | 0.24 | Pass |
| 70 | 71.90 | 67.83 | 0.34 | Pass |
| 75 | 76.07 | 65.98 | 0.39 | Pass |
| Results | |
| Driving through | Pass |
| Stoping and going | Pass |
| Hi-voltage insulation test by applying 1500 Vac between live parts and EV ground part | Pass |
Disclaimer/Publisher’s Note: The statements, opinions and data contained in all publications are solely those of the individual author(s) and contributor(s) and not of MDPI and/or the editor(s). MDPI and/or the editor(s) disclaim responsibility for any injury to people or property resulting from any ideas, methods, instructions or products referred to in the content. |
© 2025 by the authors. Published by MDPI on behalf of the World Electric Vehicle Association. Licensee MDPI, Basel, Switzerland. This article is an open access article distributed under the terms and conditions of the Creative Commons Attribution (CC BY) license (https://creativecommons.org/licenses/by/4.0/).
Share and Cite
Janjamraj, N.; Changsarn, C.; Hiranvarodom, S.; Bhumkittipich, K. The Practical Learning on Electric Bus Conversion to Support Carbon Neutrality Policy in Thailand’s Transport Sector. World Electr. Veh. J. 2025, 16, 181. https://doi.org/10.3390/wevj16030181
Janjamraj N, Changsarn C, Hiranvarodom S, Bhumkittipich K. The Practical Learning on Electric Bus Conversion to Support Carbon Neutrality Policy in Thailand’s Transport Sector. World Electric Vehicle Journal. 2025; 16(3):181. https://doi.org/10.3390/wevj16030181
Chicago/Turabian StyleJanjamraj, Natin, Chaiyoot Changsarn, Somchai Hiranvarodom, and Krischonme Bhumkittipich. 2025. "The Practical Learning on Electric Bus Conversion to Support Carbon Neutrality Policy in Thailand’s Transport Sector" World Electric Vehicle Journal 16, no. 3: 181. https://doi.org/10.3390/wevj16030181
APA StyleJanjamraj, N., Changsarn, C., Hiranvarodom, S., & Bhumkittipich, K. (2025). The Practical Learning on Electric Bus Conversion to Support Carbon Neutrality Policy in Thailand’s Transport Sector. World Electric Vehicle Journal, 16(3), 181. https://doi.org/10.3390/wevj16030181