Abstract
With the rapid growth of renewable energy integration, battery energy storage technologies are playing an increasingly pivotal role in modern power systems. Among these, electric vehicle distributed energy storage systems (EV-DESSs) using vehicle-to-grid technology and commercial battery energy storage systems (BESSs) exhibit substantial potential for user-side energy storage applications. A comparative analysis of the cost competitiveness between these two types of energy storage systems is crucial for understanding their roles in the evolving power system. However, existing studies lack a unified framework for techno-economic comparisons between EV-DESSs and commercial BESSs. To address this research gap, we conduct a comprehensive, technology-rich techno-economic assessment of EV-DESSs and commercial BESSs, comparing their economic feasibility across various grid services. Based on the technical modeling, this research simulates the operational processes and the additional battery degradation of EV-DESSs and commercial BESSs for providing frequency regulation as well as peak shaving and valley filling services. Building on this foundation, the study evaluates the cost competitiveness and profitability of both technologies. The results indicate that the levelized cost of storage (LCOS) of EV-DESSs and commercial BESSs ranges from 0.057 to 0.326 USD/kWh and from 0.123 to 0.350 USD/kWh, respectively, suggesting significant overlap and thus intense competition. The benefit–cost ratio of EV-DESSs and commercial BESSs ranges from 26.3% to 270.1% and from 19.3% to 138.0%, respectively. Battery cost and cycle life are identified as the key factors enabling EV-DESSs to outperform commercial BESSs. This drives a strong preference for lithium iron phosphate (LFP) batteries in V2G applications, allowing for LCOS reductions of up to 4.2%–76.3% compared to commercial BESSs across different grid services. In contrast, ternary lithium-ion batteries exhibit weaker cost competitiveness in EV-DESSs compared to commercial BESSs. While solid-state and sodium–ion batteries are promising alternatives, they are less competitive in V2G applications due to higher costs or a shorter cycle life. These findings highlight the superiority of LFP batteries in current V2G applications and the need to align cost, cycle life, and safety performance in the development of next-generation battery chemistries.
1. Introduction
The global transition toward sustainable energy and transportation systems has been marked by significant growth in the adoption of EVs. As of 2023, global passenger EV sales reached 14.7 million, reflecting a 35% increase from the previous year [1]. In China alone, EV sales rose steadily to 9.5 million in 2023 [2]. Rapid EV deployment poses both challenges and opportunities for managing energy supply and maintaining grid stability. Integrating large-scale, uncoordinated EV charging into the existing distribution network will significantly increase the overall grid load and amplify the gap between peak and valley loads [3]. Furthermore, as renewable energy generation expands, its inherent intermittence and unpredictability will exacerbate grid instability [4]. Vehicle-to-grid (V2G) technology provides an effective solution to ensure stable grid operation. V2G enables bidirectional energy flow between the grid and parked EVs, effectively converting EVs into distributed energy storage systems [5]. EV distributed energy storage systems (EV-DESSs) can mitigate hourly supply–demand imbalances through the peak shaving and valley filling (PSVF) service, while also enhancing grid stability by providing ancillary services. The global EV stock in 2023 was estimated to contain over 1000 GWh of batteries [6], indicating substantial potential for energy storage. Under such circumstances, V2G has been the focus of extensive research and pilot projects. According to data from the V2G HUB, over 150 V2G demonstration projects have been deployed across 27 countries globally, primarily focusing on the technical feasibility validation and business model exploration [7]. The V2G development in China began later, with its first demonstration project being implemented in 2020. However, in 2024, China introduced its first national policy framework explicitly supporting V2G technology, outlining strategic priorities for its large-scale deployment over the next 5–10 years [8].
Existing studies have comprehensively discussed the grid services that energy storage systems can provide. Manojkumar et al. examined the feasibility and control methods of using energy storage systems for peak shaving services, demonstrating the critical role of energy storage in stabilizing grid operation and enhancing the integration of renewable energy [9,10]. In addition, energy storage systems can also contribute to various grid services, such as frequency regulation (FR), voltage control, demand response, and spinning reserve [11,12]. Among all energy storage technologies, commercial battery energy storage systems (BESSs), one of the typical application forms of battery energy storage (BES) technology, have the most similar applications to EV-DESSs, as both are primarily employed for peak shaving and valley filling in the electricity consumption of industrial parks and buildings. For storage systems that meet the entry requirements for grid ancillary service markets, they can also participate in market transactions through virtual power plants (VPPs), providing ancillary services like FR [13]. Commercial BESSs refer to stationary energy storage systems that use batteries to provide energy storage services to users such as factories and buildings. Table 1 summarizes the similarities, as well as the respective advantages and disadvantages, of EV-DESSs and commercial BESSs. In recent years, the global commercial BESS market has expanded rapidly, with 7.8 GWh of new installations added in 2023, representing a nearly 240% year-on-year growth [14]. Therefore, understanding the techno-economic performance of these two emerging energy storage technologies is crucial for identifying their development pathways.

Table 1.
Comparison of EV-DESSs and commercial BESSs.
Table 1.
Comparison of EV-DESSs and commercial BESSs.
| EV-DESSs | BESSs | |
|---|---|---|
| Definition | EVs interact with the grid for energy and information exchange through a bidirectional charger, serving as distributed energy storage systems. | A system that utilizes a combination of batteries and electrical equipment to store electrical energy, supplying power for residential, commercial, industrial, and utility applications. |
| Application | Peak shaving and valley filling, frequency regulation, etc. | Peak shaving and valley filling, frequency regulation, demand-side response, etc. |
| Advantage |
|
|
| Disadvantage |
|
|
| Reference | [15,16] | [17,18] |
Numerous studies have analyzed the techno-economic performances of V2G. Kempton et al. evaluated the costs and benefits of V2G-based EV-DESSs for the first time, demonstrating their potential to provide inexpensive energy storage services for the grid [19]. White et al. investigated the potential profits of using plug-in hybrid electric vehicles (PHEVs) for grid energy storage, concluding that FR services offer greater profitability than peak shaving [20]. Han et al. analyzed the viability of V2G in FR services, proving its capability to generate substantial profits for EV owners [21]. Ahmadian et al. assessed the cost and benefit performance of EV-DESSs in an active distribution network integrated with distributed wind generation, proving that V2G remains economically viable in a renewable energy grid even after considering battery degradation [22]. Gough et al. evaluated EVs’ profitability in supplying energy to buildings and participating in ancillary service markets via V2G in the UK, concluding that V2G could yield significant revenue, with a maximum net present value (NPV) of approximately GBP 8400 [23]. Li et al. explored the economic viability of providing peak shaving services through V2G in Shanghai [24]. The results revealed that profitability for EV owners is feasible only when peak electricity prices are at least triple the off-peak rates. Huda et al. assessed the economic potential of EV-DESSs in the Indonesian ancillary market, concluding that V2G could bring benefits to both EV owners and power companies [25]. Huber et al. examined the impacts of V2G on the total cost of ownership (TCO) for EVs, finding that the lowest TCO could be achieved through semi-public charging with ancillary service provision [26]. Zhao et al. investigated the potential NPV and GHG emission reduction of electric trucks providing regulation services through V2G, finding that they can generate substantial additional revenue while also reducing greenhouse gas (GHG) emissions [27]. These studies demonstrate the economic feasibility of V2G, corroborating its potential as a viable solution within future energy systems.
As for the techno-economic analysis of BESSs, Schmidt et al. projected the future levelized cost of storage (LCOS) of nine energy storage technologies, including BESSs [28]. The results indicated that lithium-ion BESSs and hydrogen will become the most cost-effective solutions beyond 2030. Beuse et al. further assessed the cost benchmarks of lithium-ion BESSs and their competitiveness against other technologies for providing different grid services [29]. They also put forward policy recommendations to promote the diversified development of energy storage technologies and mitigate the risks of technological lock-in. Goulart et al. examined the mechanisms and benefits of BESSs for providing energy storage services in Brazil’s medium-voltage grid. They calculated the costs and benefits of BESSs providing both load leveling and peak shaving services concurrently, revealing that benefits from load leveling services accounted for over 97% [30]. Li et al. focused on various scheduling strategies for BESSs in providing PSVF services. Through comparative analysis, they found that a coupling strategy based on load curves achieved the best economic performance [31]. Xu et al. conducted a techno-economic assessment on BESSs and other stationary energy storage technologies, calculating the corresponding LCOS in peak shaving applications. The results indicated that the LCOS of BESSs based on LFP batteries was 0.94 CNY/kWh [32]. Schmidt et al. analyzed the additional emissions and cost for stationary BESSs. The results showed that lithium-ion technologies outperform others in terms of both emissions and cost dimensions [33]. These findings highlight the pivotal role of BESSs in future energy systems. Table 2 reviews the existing studies from the perspective of scopes and analytical frameworks. It should be noted that different articles use varying terminology for the same energy storage service; the names of the applications provided in the table correspond to the terms used in each respective study. As evidenced by the literature review, current research predominantly focuses on standalone economic viability assessments of either V2G or BES technologies, with limited comparative assessments of their economic performance in the context of the same applications. This limitation impedes a holistic understanding of the two technologies’ future potential in user-side energy storage applications.
Table 2.
Literature review.
Despite the important findings from existing studies, several research gaps remain:
- There is a lack of comparative studies on the techno-economic viability of V2G-based EV-DESSs and commercial BESSs using a standardized evaluation framework. Existing techno-economic assessments of V2G are typically based on independent assumptions, making comparisons with other energy storage technologies challenging. Across different studies, technical parameters, cost assumptions, and operational conditions for energy storage technologies vary significantly. These are critical oversights, especially given that different technologies coexist and compete within an integrated energy system.
- Existing studies exhibit limitations with respect to detailed modeling of the operational processes of EV-DESSs and commercial BESSs. Current approaches predominantly rely on macro-level technical parameters, such as service frequency and intensity, to approximate the system operational processes. While these methods allow for differentiating technologies and applications through parameter adjustments, they lack granularity in capturing the charging and discharging dynamics, a deficiency that may lead to deviations in techno-economic assessments.
- There is a lack of research considering the impact of future technological advancements, particularly in battery technologies, on the techno-economic viability of V2G and commercial BESSs. With the large-scale commercialization of EVs in recent years, the cost of lithium-ion batteries (LIB) has dropped by over 90%, alongside significant improvements in technical performance [34]. At the same time, various battery technologies, such as lithium iron phosphate (LFP) batteries, nickel–cobalt–aluminum or nickel–cobalt–manganese (NCX) batteries, and sodium-ion batteries (SSBs), have emerged in the market. Since battery technology is central to V2G, advancements in EV batteries will directly affect the cost structure of EV-DESSs and their competitiveness relative to other energy storage technologies, ultimately shaping the future commercial viability of V2G.
To fill these research gaps, this study undertakes the following work:
- 4.
- To enable a comparative analysis between V2G-based BESSs and commercial BESSs, this study establishes a techno-economic assessment framework for both V2G technology and commercial BESSs, based on a unified set of technical and economic assumptions.
- 5.
- To improve the complexity of technical modeling, this study develops a technology-rich model that systematically analyzes the operational processes, battery degradation, and related costs over the entire lifecycle of energy storage devices.
- 6.
- Building on the techno-economic evaluation results, this study explores the potential impacts of advancements in battery technologies on the competitive landscape between EV-DESSs and commercial BESSs. Through a comprehensive comparison, the study aims to provide insights into the technology roadmap for EV batteries from a techno-economic perspective, thereby contributing to the broader discussion on the future of sustainable energy storage and mobility solutions.
The findings help stakeholders better understand the cost and profitability performances of the technologies, while also providing a theoretical foundation for policymakers for developing V2G-related policies and technology roadmaps. The article is structured as follows: Section 2 introduces the techno-economic model, parameters, and scenario settings; Section 3 presents the results; Section 4 provides further discussion and policy implications; and Section 5 gives a conclusion.
2. Methods
To evaluate the techno-economic feasibility of both EV-DESSs and BESSs, we first define the working processes for each system. In the following sections, the term BESSs specifically refers to commercial BESSs. The grid services considered in this study include FR and PSVF, as these are the primary applications in current V2G demonstration projects [35]. We simulate the working profiles and battery degradation for the energy storage systems, followed by an estimation of the life cycle costs, including both equipment and operational expenses. Existing research typically employs an hour-level resolution, which fails to capture the detailed dynamics of continuous battery charging, discharging, and cumulative degradation. In this study, we enhance the model with minute-level granularity, accounting for both geographical and temporal variances to depict the working profile of battery energy storage technologies with more details and further evaluate their techno-economic feasibility. The model is implemented in MATLAB (R2023b (23.2.0.2365128), MathWorks, Inc., Natick, MA, USA). Beijing and Guangdong are selected for case studies due to both their rapid development of EV and V2G technologies and their significant geographic disparities. The case studies aim to provide a comprehensive understanding of the development of V2G technology in China and its geographic heterogeneity. The detailed model framework is illustrated in Figure 1. The following sections describe each component of the research framework in detail.
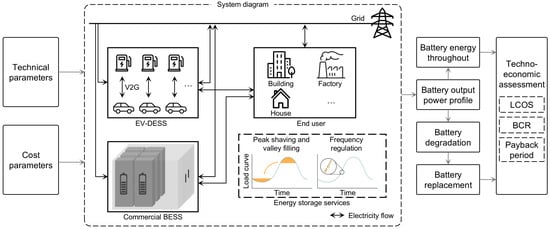
Figure 1.
Research framework of the techno-economic assessment of V2G technology and commercial BESSs.
2.1. Analysis of the Operating Modes of EV-DESSs and BESSs
FR services are essential for maintaining grid stability and ensuring high-quality power delivery [36]. The real-time balance between electricity supply and demand is pivotal for grid operation. Traditionally, FR services have been provided by fossil fuel power plants, such as coal-fired and natural gas turbines. However, BESSs have increasingly been deployed for FR purposes in recent years. Compared to fossil fuel-based systems, BESSs offer faster response times and a more environmentally friendly alternative [37]. Building on this development, V2G technology can also contribute to FR, with bidirectional chargers enabling EVs to both draw power from and feed power back into the grid, further enhancing grid stability and flexibility.
The amount of power exchanged between energy storage devices and the grid for FR is simulated using the droop model, as shown in Figure 2a [38]. According to the droop model, when the grid’s frequency fluctuations remain within the dead band, no energy storage resources are scheduled. However, once fluctuations exceed this threshold, energy storage devices are activated based on the magnitude of the deviation. Grid frequency fluctuations are random in nature and follow a normal distribution [39]. To characterize such randomness, a series of random arrays based on a normal distribution are used to simulate the daily frequency variations throughout the lifecycle of the energy storage devices [40]. Figure 2b shows an example of grid frequency fluctuations in a random day. The grid’s frequency fluctuations are calculated using Equation (1).
where Δf denotes the grid frequency fluctuation (Hz), f denotes the actual frequency of the grid (Hz), and fr denotes the rated frequency of the grid (Hz).
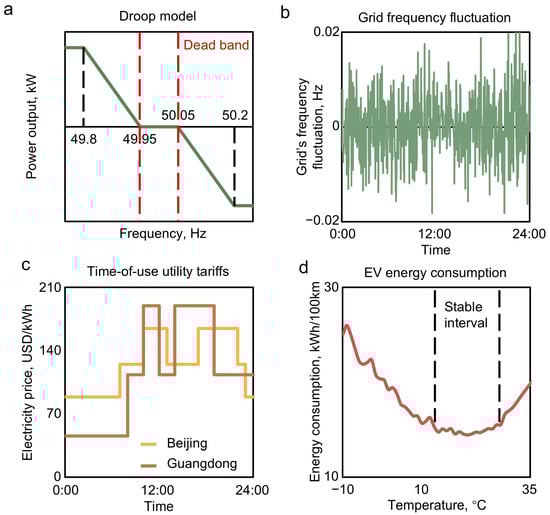
Figure 2.
Model details. (a) Droop model used for FR service scheduling. (b) Grid frequency fluctuations on a random day. (c) Time-of-use (TOU) tariff policies, with examples from Beijing and Guangdong. (d) EV energy consumption rate as a function of ambient temperature [41].
For BES technology, when the grid frequency exceeds the baseline value, the battery can be charged to absorb the excess power supply, thereby reducing grid frequency; conversely, when the grid frequency falls below the baseline, the battery discharges to supplement the insufficient power supply, raising the grid frequency. In practical applications, the actual power output of EV-DESSs and commercial BESSs for FR services is determined by two factors. Firstly, grid scheduling requirements determine the required power output based on frequency deviations and the system’s rated power capability. The second factor is the battery’s available capacity, which is constrained by its SOC. Once the battery reaches its upper SOC limit, it can no longer charge further and, therefore, ceases to provide downward FR services. Similarly, at the lower SOC limit, the system cannot continue providing upward FR services. The battery output power profiles for providing FR services are quantified using Equations (2)–(4).
where Δf denotes the grid frequency fluctuation (Hz), f denotes the actual frequency of the grid (Hz), fr denotes the rated frequency of the grid (Hz), PG,FR denotes the power capacity of energy storage devices for FR scheduled by the grid (kW), PC denotes the charger’s power capacity (kW), fd denotes the grid’s frequency dead band (Hz), ft denotes the tolerable grid’s frequency fluctuation (Hz), Pout,FR denotes the system output power when providing energy storage services, which is determined by both the grid’s scheduling and the state of charge (SOC) status of the devices, and u’(x) is a step function. SOC denotes the actual battery SOC of the devices (%), while SOCmin denotes the lowest SOC threshold for battery discharging (%). For BESSs, this value is the theoretical minimum SOC of the battery, whereas for V2G, the energy needed for the return trip must be considered in addition to the theoretical threshold. SOCmax denotes the theoretical maximum SOC of the battery (%).
Due to the roundtrip efficiency of the equipment, the battery’s internal power consumption incurs efficiency losses compared to the system’s output power. Equation (5) calculates the battery internal consumption power for FR services.
where PB,FR denotes the battery internal consumption power (kW), ηc denotes the battery’s charging efficiency (%), and ηd denotes the battery’s discharging efficiency (%).
PSVF is another critical grid service that balances electricity supply and demand over longer time scales, helping to alleviate grid congestion and reduce the need for costly grid transmission and distribution capacity expansion [42]. PSVF involves purchasing electricity during off-peak hours at lower prices and selling it back to the grid during peak demand hours at higher prices [43]. In existing studies on the modeling of energy storage systems for providing PSVF services, two main approaches have been proposed [31]. The first approach is scheduling based on load curve data, an approach which involves performing statistical analysis on large amounts of historical grid load data to determine the upper and lower limits for PSVF services. When the grid load exceeds boundaries, the energy storage system is scheduled to charge or discharge based on the deviation. While this method enables precise scheduling of energy storage systems, it requires high-quality data. The regional grid load data in China are typically sourced from national grid operators, making it difficult to obtain accurate and geographically heterogeneous datasets from public sources. The second method is scheduling based on TOU tariff policies. The energy storage system charges during off-peak hours and discharges during peak hours at a constant power, thereby achieving PSVF application [43]. The TOU tariff policies are developed by local grid operators, considering factors such as historical grid load characteristics and related policies. Modelling based on TOU tariff policies reflects local grid load characteristics, and the data availability is relatively high, making it a feasible alternative.
In this study, the TOU-tariff-based model is selected, using the monthly TOU tariff policies for Beijing and Guangdong in 2023 to simulate the operational processes for providing PSVF services. The model operates on the following logic: when EVs are connected to the grid, EV batteries discharge during the peak-price periods; when EVs are returning home, EV batteries get charged during the valley-price periods. Equation (6) shows the calculation of the battery operational processes for PSVF.
where PB,PSVF denotes the battery internal consumption power for PSVF services (kW) and tpeak and tvalley denote the peak and valley load period (minute), respectively, as shown in Figure 2c. Detailed data are shown in Table S1 and Figure S1.
Although both EV-DESSs and commercial BESSs can provide FR and PSVF services, their operational processes differ due to the mobility attributes of EVs. For EVs, daily commuting represents the primary use case, which not only constrains the periods during which EVs can connect to the grid for V2G participation, but also impacts the available battery capacity for providing energy storage services. Such a dual role of EVs is particularly relevant for daily commuters, who can leverage their EVs for both commuting and providing grid services. In contrast, commercial BESSs can operate continuously throughout the day, with their operation processes determined solely by the battery capacity and grid’s demand for storage services. In this study, EVs are assumed to be used for commuting between home and work on weekdays and for leisure activities on weekends. On weekdays, the EV leaves home at 8:00, drives to work, and connects to a bidirectional charger upon arrival to participate in V2G throughout the workday. At 17:00, the EV departs work, arrives at home, and gets charged to full SOC overnight. On weekends, due to the unpredictability of travel schedules, it is difficult to allocate long periods for parking, which is why the EV’s participation in V2G on weekends is excluded. Equations (7) and (8) calculate the battery operational processes for commuting.
where tD denotes the one-way commuting duration (minutes), x denotes the daily commuting distance (km), v denotes the average speed (km/h), PB,D denotes the battery power output required for commuting (kW), and eD,t denotes the EV energy consumption rate at time t (kWh/100 km), which is determined by the ambient temperature [41,44]. To address the differences in commuting distances among different EVs, the probability distribution of commuting distances is incorporated into this analysis. According to related research, the distribution of daily commuting distances of passenger EVs follows a gamma distribution, as described by Equations (9)–(11) [45]. The distribution patterns for weekdays and weekends are assumed to be identical based on statistical data [46].
where k denotes the shape parameter of the gamma distribution, θ denotes the scale parameter of the gamma distribution, xavg denotes the average daily travel distance (km), and xmd denotes the daily travel distance with the highest probability (km).
Based on the above modeling, the battery power output at each time point and the daily distribution of the battery’s SOC are calculated using Equation (12).
where SOCt denotes the battery’s actual SOC in t (%) and c denotes the battery’s capacity (kWh).
2.2. Battery Degradation Model
A fundamental requirement for analyzing the techno-economic feasibility of battery energy storage devices is understanding the battery degradation mechanism. Once the battery degrades to a certain extent, its performance will no longer support further use in the system. If the EV or BESS has not yet reached its full operational lifespan, battery replacement will be necessary to maintain service. In this study, based on the charging and discharging process of EV-DESSs and commercial BESSs, we further develop a data-driven empirical battery degradation model to analyze the battery service life. The state of health (SOH), defined as the ratio of the battery’s remaining capacity to its nominal capacity, is used as the key metric to assess battery life [47].
The aging of batteries is governed by two primary mechanisms: cycle aging and calendar aging [48]. Cycle aging refers to the capacity fade induced by charging and discharging. In the battery degradation model, the daily cyclic aging is assumed to scale proportionally with the electricity throughput, while the lifetime total energy throughput is constrained by the rated cycle life under standardized test conditions [19]. Calendar aging, on the other hand, represents the irreversible capacity fade occurring over time, mainly due to the formation of solid-electrolyte interphase (SEI) on the anode [49]. The battery degradation induced by calendar aging is widely modeled as being proportional to the square root of time. Additionally, the calendar aging rate is influenced by the ambient temperature and battery’s SOC. The calculation for the battery degradation model is shown in Equations (13)–(15). Given the current scarcity of empirical models for SIB degradation, we assume that SIBs follow the same degradation mechanism as LIBs. This is due to the same chemical reaction principles of these two types of battery chemistry, with sodium ions substituting lithium ions as the active positive ions.
where Qcyc,t denotes the capacity loss caused by cycle aging at time t (%), Ea,t denotes the battery energy throughput at time t (kWh), Lcyc denotes the rated battery cycle life (cycles), DODr denotes the rated depth of discharge (DOD) (%), SOHEOL denotes the SOH threshold for the battery’s end of life (EOL) (%), Qcal,t denotes the capacity loss caused by calendar aging at time t (%), and a(SOCt, Tt) denotes the calendar aging coefficient, which is mainly determined by the battery’s SOC and the ambient temperature T at time t. In this study, the value of a(SOCt, Tt) is determined using a lookup table based on the ambient temperature and the battery SOC at each time point. The detailed data used in the battery degradation model are introduced in Table S2 and Figures S2–S3 in the Supplementary Materials.
Once the cumulative capacity loss reaches the rated threshold, the battery becomes unsuitable for continuous use. By incorporating the battery degradation rates (both cycle aging and calendar aging) into the expected operational lifespans of EVs and BESSs, the total number of battery replacements required throughout the devices’ lifecycle can be determined using Equations (16) and (17).
where NBR denotes the number of battery replacements across the device’s lifespan, LE denotes the device’s lifespan (year), LB denotes the battery’s lifespan (year), and DEOL and LEV,EOL denote the EV’s mileage (km) and age threshold (year), respectively. Once an EV reaches either of these thresholds, it will be mandatorily decommissioned.
2.3. Techno-Economic Assessment Model
Based on the above technical modeling, the techno-economic feasibility of EV-DESSs and commercial BESSs can be further analyzed. In this study, LCOS is selected as the cost evaluation metric. LCOS quantifies the average lifecycle cost of energy storage systems by normalizing the total investment and operational expenditures over the system’s lifetime per kWh of storage service delivered [28]. LCOS enables standardized comparisons across diverse energy storage technologies with heterogeneous technical specifications, an approach which has been widely adopted to assess the cost competitiveness across different energy storage technologies [28,50]. Equation (18) shows the calculation for LCOS.
where Ccap denotes the capital cost (USD/kWh), COM denotes the operation and maintenance (O&M) costs (USD/kWh), Cbat denotes the battery replacement cost (USD/kWh), Ccha denotes the charging cost (USD/kWh), Csaf denotes the safety cost (USD/kWh), eled denotes the annual amount of electricity provided for grid services (kWh), and r denotes the discount rate.
Regarding capital cost, V2G involves the premium for bidirectional EV chargers compared to unidirectional chargers, specifically concerning the bidirectional charging and discharging modules. For commercial BESSs, the costs are delineated into the energy and power components, in addition to the battery system itself. The O&M cost encompasses the expenses associated with the equipment’s operation and maintenance, both of which are assumed to be proportional to the capital cost [28]. The calculations for the capital cost and O&M cost are shown in Equations (19)–(21).
where ppile,b denotes the bidirectional charger premium (USD/kW), Ppile denotes the charger’s power capacity (kW), Lpile denotes the charger’s lifespan (years), pp,BESS denotes the price of BESSs’ power-related components (USD/kW), pe,BESS denotes the price of the BESSs’ energy-related components (USD/kWh), PBESS denotes the BESSs’ power capacity (kW), CBESS denotes the BESSs’ battery capacity (kWh), pB denotes the price of the battery (USD/kWh), and ηOM denotes the ratio of the yearly O&M cost to the capital cost (%).
The participation of EVs in V2G services accelerates the degradation of EV batteries, causing EVs to potentially necessitate additional battery replacements over the vehicle’s lifetime [51]. When the battery’s SOH reaches its EOL threshold, or when the devices exceed the operational lifespan, batteries will either be directly recycled or repurposed for their remaining capacity through second-life applications. The battery replacement cost for EV-DESSs reflects the difference in battery expenses for the same vehicle under conditions of participating versus not participating in V2G. Since the SOH of retired batteries affects their recycling value and, subsequently, the battery replacement cost, the residual value of retired batteries is taken into consideration. For commercial BESSs, the battery replacement cost encompasses all expenses associated with battery replacements throughout their lifetime, excluding the initial battery procurement costs considered in the capital cost during system deployment. The calculations for the battery replacement cost are shown in Equations (22)–(24).
where rB denotes the battery residual value (USD/kWh) and δt serves as a selection indicator, set to 1 if a battery replacement occurs in the specified year and 0 otherwise.
Before providing grid services, the batteries need to be charged. It is important to highlight that, for EV-DESSs, the charging cost involves the difference in charging expenses for an EV between the circumstances of participating or not participating in V2G [52]. The calculation for the charging cost is shown in Equation (25).
where elec denotes the yearly cumulative amount of the electricity charged for providing grid services (kWh) and pele,valley denotes the valley electricity price (USD/kWh).
Unlike traditional energy storage technologies, batteries pose risks of combustion and explosion, both of which can potentially lead to fire hazards. Therefore, it is essential to consider the potential cost associated with the risk of battery-induced hazards. Such costs quantitatively reflect the differences in safety performance among various battery technologies. Nam et al. firstly incorporated the cost of safety hazards into the lifecycle cost analysis of a system, defining it as the product of direct accident losses and the probability of the occurrence of accidents [53]. Existing research on the techno-economic feasibility of energy storage systems generally neglects safety costs. Therefore, we extend the safety cost calculation method to the framework of this study. The accident rate of battery energy storage devices is directly related to the cell’s self-induced failure rate and the number of cells. Potential safety cost includes direct equipment damage caused by fire, firefighting expenses, and costs of casualties. The calculations are shown in Equations (26)–(31).
where Csaf,d denotes the direct economic loss from possible battery hazards (USD), Csaf,f denotes the cost of firefighting for possible battery hazards (USD), Csaf,c denotes the statistical economic value of casualties from possible battery hazards (USD), pEV denotes the price of EVs (USD), excluding the costs of batteries, ppile,u denotes the price of a unidirectional EV charger (USD/kW), and P(t) represents a uniform distribution, as we assume that the probability of an accident remains constant throughout the device’s lifespan. Cl denotes the labor costs for firefighting (USD), including salaries, the number of firefighters, and their working hours, and Cw denotes the water costs for firefighting (USD), which are associated with the scale of the energy storage devices. The term vc denotes the statistical economic value of accident casualties (USD per person), Nc denotes the number of casualties in accidents, and PS denotes the possibility of the system self-inducing an accident (%) [38]. Lastly, pS denotes the cell’s probability of self-induced accidents (%) and nc denotes the number of cells.
Apart from costs, profitability is also a crucial factor in techno-economic assessments. In this study, we first analyze the revenues over the system’s lifecycle, and then, by combining costs and revenues, we calculate the discounted cash flow over the system’s lifecycle. To achieve a comparable assessment of the profitability of different technologies, we further calculate the values of the benefit–cost ratio (BCR) and payback period based on the discounted cash flow. The calculations are shown in Equations (32)–(35).
where RFR denotes the total revenue earned from providing FR services (USD) and pperformance denotes the subsidy of FR services (USD/kW). According to China’s prevailing ancillary service policies, revenue for energy storage systems providing FR services is determined by the power provided in each service event. RPSVF denotes the total revenue earned from providing PSVF services (USD) and pele,peak denotes the peak electricity price (USD/kWh).
2.4. Data and Key Assumptions for Technical Modeling and Economic Assessment
To evaluate future pathways for EV batteries from the perspective of V2G’s economic competitiveness, four types of battery technologies are considered, including LFP batteries, NCX batteries, solid-state lithium batteries (SSBs), and SIBs. The first two are widely used in EVs nowadays, while the latter two are emerging as promising alternatives for the future. SSBs, known for their superior energy density and safety, are regarded as revolutionary for next-generation lithium batteries, although they remain in the research and development phase. Currently, numerous SSB solutions exist, such as all-solid-state LIBs, all-solid-state lithium–metal batteries, and all-solid-state lithium–sulfur batteries [54]. Each type possesses distinct performance characteristics, with cycle life ranging from a few hundred to several thousand cycles [55]. SIBs are expected to be a promising alternative to LIBs due to their potential to lessen dependency on lithium resources. Both SSBs and SIBs are classified as rocking-chair batteries, and SIBs have the advantage of being compatible with existing LIB production lines, facilitating integration into current manufacturing infrastructures. In theory, SIBs offer higher safety, lower costs, and better performance in extreme environments compared to LIBs. However, they have a shorter cycle life and remain in the early stage of commercialization with relatively high costs. Furthermore, due to differences in performance requirements, batteries for stationary energy storage systems differ from those for EVs. This study considers only LFP batteries and SIBs for BESS use, as they largely align with the current state of BESS deployment.
Three types of grid services are considered in this study, with the first two being FR and PSVF services, as mentioned previously. The third service is multi-service (MS), in which, through optimized scheduling strategies, the available power capacity is shared between FR and PSVF simultaneously. As technology advances and economies of scale emerge from mass commercialization, the costs of batteries and associated energy storage systems are expected to decline. Thus, we establish three scenarios to assess the competitive landscape between EV-DESSs and BESSs under various developmental conditions: (1) the baseline scenario, (2) the V2G cost reduction scenario, and (3) the V2G and BESS cost reduction scenario. Tables S3–S5 delineate the technical, cost, and safety parameters of EV-DESSs and BESSs across the four battery technologies.
3. Results
3.1. Cost and Profitability Comparison Between EV-DESSs and BESSs
To clarify the economic feasibility and the underlying influencing factors for EV-DESSs and BESSs in providing grid services under different scenarios, we analyze the breakdown of their LCOS, with the results shown in Table 3, Table 4 and Table 5. Figure 3 shows the LCOS breakdown and profitability of EV-DESSs and BESSs providing different services in Beijing. Overall, the LCOS for providing PSVF and MS services is lower than that for FR services, with EV-DESSs exhibiting a lower LCOS than BESSs. Taking the baseline scenario as an example, the LCOS of EV-DESSs ranges from 0.282 to 0.326 USD/kWh for FR, from 0.145 to 0.232 USD/kWh for PSVF, and from 0.143 to 0.220 USD/kWh for MS. In comparison, the LCOS of BESSs ranges from 0.291 to 0.345 USD/kWh for FR, from 0.216 to 0.282 USD/kWh for PSVF, and from 0.199 to 0.262 USD/kWh for MS.
Table 3.
LCOS results of EV-DESSs and BESSs providing energy storage services in Beijing and Guangdong.
Table 4.
BCR results of EV-DESSs and BESSs providing energy storage services in Beijing and Guangdong.
Table 5.
Payback periods of EV-DESSs and BESSs providing energy storage services in Beijing and Guangdong.
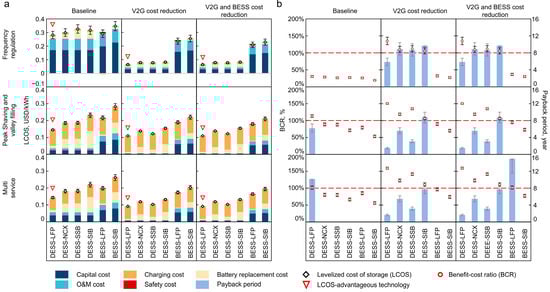
Figure 3.
LCOS and profitability analysis of EV-DESSs and BESSs providing FR, PSVF, and MS services in Beijing. (a) LCOS breakdown of EV-DESSs and BESSs. Each subfigure compares EV-DESSs across four battery technologies and BESSs with LFP batteries and SIBs, with different colors representing the various cost components. The uncertainty interval represents the result uncertainty due to the fluctuation of related cost settings by 10%. The cycle life settings for each battery type are as follows. DESS-LFP: 3500; DESS-NCX: 2000; DESS-SSB: 4000; DESS-SIB: 1500; BESS-LFP: 6000; BESS-SIB: 1500. (b) BCR and payback period of EV-DESSs and BESSs. Each subfigure compares the profitability of EV-DESSs and BESSs, with the black and gray bars representing the uncertainty intervals for BCR and payback period, respectively. The red dashed line represents the break-even point.
Capital and O&M costs, both of which are directly related to initial system investments, dominate the LCOS for FR services due to the relatively low energy throughput required. In the baseline scenario, the EV-DESSs’ capital cost for FR services is 0.170 USD/kWh, while the BESSs’ capital cost ranges from 0.198 to 0.226 USD/kWh, representing 52.1–60.2% and 64.9–68.1% of their respective LCOS. O&M costs account for 25.8–29.8% and 28.7–30.1%, respectively. Similarly, capital and O&M costs remain substantial for BESSs when providing PSVF and MS services due to the high costs associated with the battery pack. When supplying PSVF and MS services, the capital and O&M costs of BESSs range between 0.069 and 0.086 USD/kWh and 0.031 and 0.038 USD/kWh. In comparison, the capital and O&M costs of EV-DESSs are only 0.024–0.037 USD/kWh and 0.012–0.018 USD/kWh, respectively, 46.4–72.1% and 25.0%–68.4% lower than those of BESSs.
Battery replacement cost is one of the key determinants in the competitive outcomes between different technologies. Its impact is more pronounced when providing PSVF and MS services due to the higher electricity throughput, which leads to more frequent battery replacements. Among the four battery types, LFP batteries, recognized for their low cost, long cycle life, and high safety, exhibit the lowest battery replacement costs. In the baseline scenario, battery replacement costs of EV-DESSs and BESSs using LFP batteries range from 0.014 to 0.016 USD/kWh and from −0.013 to 0.009 USD/kWh, respectively. The negative values account for the inclusion of the battery residual value. SIBs, characterized by a shorter cycle life and higher costs, incur higher battery replacement costs for EV-DESSs and BESSs, valued at 0.051–0.102 USD/kWh and 0.015–0.062 USD/kWh, respectively. In this study, NCX batteries and SSBs are solely considered for V2G applications. NCX batteries have a relatively shorter cycle life and slightly higher costs compared to LFP batteries. SSBs, theoretically capable of achieving an extended cycle life, are still in the R&D phase, with reported costs being considerably high. Consequently, EV-DESSs with these technologies incur battery replacement costs of 0.030–0.055 USD/kWh for NCX batteries and 0.053–0.060 USD/kWh for SSBs, making them 0.9–2.9 and 2.3–3.3 times, respectively, more expensive than LFP batteries.
Charging cost is mainly determined by the type of service provided and is largely independent of the specific battery technologies. FR services necessitate minimal electricity throughput, resulting in relatively low charging costs. In contrast, PSVF services require a substantial amount of electricity throughput, hence leading to higher charging costs. In the baseline scenario, the charging costs for FR services across different technologies range from 0.006 to 0.012 USD/kWh. For PSVF and MS services, the charging costs are 6.8–14.7 and 5.2–13.3 times higher, respectively, than those for FR, amounting to 0.094 USD/kWh and 0.074–0.086 USD/kWh, respectively.
Safety cost is heavily influenced by the specific battery technologies used, as the self-induced failure rate of cells varies across different types. Additionally, the scale of the systems and potential accident-related losses differ significantly between EV-DESSs and BESSs. Overall, BESSs are subject to much higher safety costs than EV-DESSs. However, given the very low probability of accidents, safety cost contributes minimally to the overall LCOS. In the baseline scenario, only BESSs with LFP batteries providing FR services incur a safety cost of 0.012 USD/kWh, whereas other cases show significantly lower safety costs.
From a profitability perspective, EV-DESSs outperform BESSs due to their lower costs. When providing FR services, none of the energy storage systems are profitable, with the BCR for EV-DESSs and BESSs ranging from 26.3% to 30.4% and 19.3% to 25.9%, respectively. For PSVF and MS services, EV-DESSs are expected to achieve a BCR of 70.8–113.1% and 66.2–101.4%, respectively. Among these, EV-DESSs using LFP batteries show the highest profitability, with anticipated payback periods of 6.2 years and 10.1 years. In contrast, BESSs do not exhibit profitability, primarily due to their higher upfront capital investment.
As battery and system component costs decline with technological advancements, the LCOS of both EV-DESSs and commercial BESSs demonstrates a parallel downtrend trajectory. When providing FR services, infrastructure-related expenses constitute a higher proportion of the total costs, thereby amplifying the observed cost reduction magnitude. In the V2G cost reduction scenario, the LCOS of EV-DESSs providing FR services drops to 0.064–0.082 USD/kWh, corresponding to a 73.9–77.4% reduction against that in the baseline scenario. In comparison, the LCOS of commercial BESSs drops to 0.236–0.255 USD/kWh, corresponding to a 19.1–26.6% reduction. EV-DESSs exhibit a more pronounced competitive advantage over commercial BESSs, with EV-DESSs employing all battery technologies showcasing a cost competitiveness. The reduction in cost also leads to improved profitability; the BCR of EV-DESSs across three service types increases to 105.1–134.3%, 106.0–150.2%, and 110.7–159.4%, respectively, with corresponding payback periods of 5.9–9.7 years, 1.5–8.7 years, and 1.7–7.8 years. In the scenario where both V2G and BESSs benefit from cost reductions, the LCOS of BESSs providing FR services further decreases to 0.209–0.229 USD/kWh, with a reduction of 28.2–34.1% against the baseline scenario. However, commercial BESSs narrow the cost disparity with EV-DESSs without altering the overall competitive landscape, still remaining 2.6–3.6 times higher than EV-DESSs.
When providing PSVF or MS services, infrastructure-related costs contribute less, resulting in more modest LCOS reductions. For PSVF services, the LCOS of EV-DESSs and commercial BESSs in the V2G cost reduction scenario drops to 0.109–0.155 USD/kWh and 0.190–0.220 USD/kWh, respectively, with a corresponding decrease of 24.7–34.8% and 12.3–22.0%. For MS services, the LCOS of the two systems drops to 0.091–0.131 USD/kWh and 0.174–0.203 USD/kWh, respectively, with a corresponding decrease of 24.7–34.8% and 12.5–22.4%. As for the V2G and BESS cost reduction scenario, the LCOS of commercial BESSs for providing PSVF and MS services further drops to 0.180–0.210 USD/kWh and 0.164–0.194 USD/kWh, respectively, with a corresponding decrease of 17.0–25.5% and 17.2–25.9%. Although the cost reduction improves the profitability of commercial BESSs, the latter remain profitable only when using LFP batteries and providing MS services, with a BCR of 101.7% and a payback period of 14.9 years.
Overall, the anticipated decline in costs does not alter the competitive landscape among the technologies. Across all scenarios, EV-DESSs with LFP batteries remain the most cost-effective option.
Figure 4 shows the LCOS breakdown of EV-DESSs and commercial BESSs in Guangdong province, revealing significant differences compared to the results for Beijing. There are two primary reasons for the regional discrepancies. First, differences in TOU tariff policies impact the economic performances of EV-DESSs and commercial BESSs. Guangdong’s lower off-peak rates and larger peak–valley price differentials reduce charging costs while enhancing the profitability of energy storage systems. Taking the baseline scenario as an example, the charging costs for EV-DESSs providing PSVF and MS services in Guangdong range from 0.042 to 0.048 USD/kWh, representing a 42.4–48.9% reduction compared to Beijing. Similarly, commercial BESSs in Guangdong incur charging costs of 0.043–0.048 USD/kWh for these services, 48.9–49.6% lower than in Beijing. Additionally, temperature differences affect system economics. Guangdong’s more favorable temperature conditions reduce EV energy consumption, enabling EV-DESSs to deliver higher cumulative energy services over their lifecycle, thereby amortizing equipment-related costs more effectively. In the baseline scenario, EV-DESSs in Guangdong exhibit 8.3–32.4% lower capital and O&M costs for PSVF and MS services, respectively, with respective costs of 0.022–0.025 USD/kWh and 0.011–0.012 USD/kWh. However, the higher temperatures in Guangdong accelerate battery degradation caused by calendar aging, slightly increasing replacement costs across all technologies. Overall, benefiting from more favorable ambient temperatures and more aggressive TOU tariff policies, EV-DESSs and BESSs in Guangdong achieve LCOS values that are −0.8% to 39.1% lower than those in Beijing. In terms of profitability, EV-DESSs and BESSs in Guangdong also outperform those in Beijing, with higher BCRs and the ability to achieve profitability in more cases.
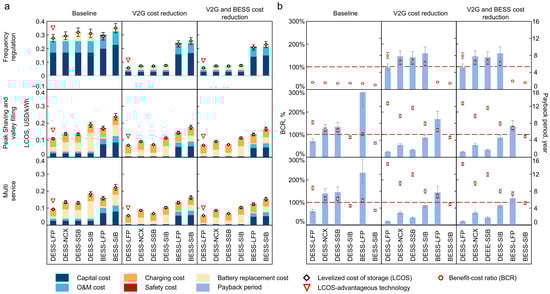
Figure 4.
LCOS and profitability analysis of EV-DESSs and commercial BESSs providing FR, PSVF, and MS services in Guangdong. (a) LCOS breakdown of EV-DESSs and commercial BESSs. (b) BCR and payback period of EV-DESSs and commercial BESSs.
3.2. EV Battery Roadmaps for Better Cost Competitiveness of EV-DESSs
We further explore the impacts of EV battery performance on the LCOS of EV-DESSs, offering insights into the future EV battery technology roadmap. Here, we characterize different EV battery technologies along two key technical dimensions: battery cycle life and the cell’s self-induced failure rate. A longer cycle life can mitigate battery degradation from providing grid services, thereby delaying the battery’s retirements and reducing battery replacement costs. A lower self-induced failure rate implies a lower probability of accidents caused by battery safety issues, thereby lowering safety costs. The battery technology clusters are mapped within these technical dimensions according to their respective life and safety performance. This map helps identify which battery technology can enable EV-DESSs to achieve the highest level of techno-economic competitiveness.
Figure 5a shows the LCOS variations of EV-DESSs in Beijing. Among the battery technology clusters, EV-DESSs using LFP batteries exhibit the lowest LCOS. In the baseline scenario, the LCOS of EV-DESSs with LFP batteries ranges from 0.139 USD/kWh to 0.294 USD/kWh when providing different grid services. NCX batteries lead to slightly higher costs, ranging from 0.147 USD/kWh to 0.337 USD/kWh. Similarly, EV-DESSs with SIBs exhibit relatively high costs, with LCOS values between 0.195 USD/kWh and 0.342 USD/kWh. The LCOS of EV-DESSs with SSBs spans a much wider range, from 0.154 USD/kWh to 6.074 USD/kWh, primarily due to the broad spectrum of their cycle life.
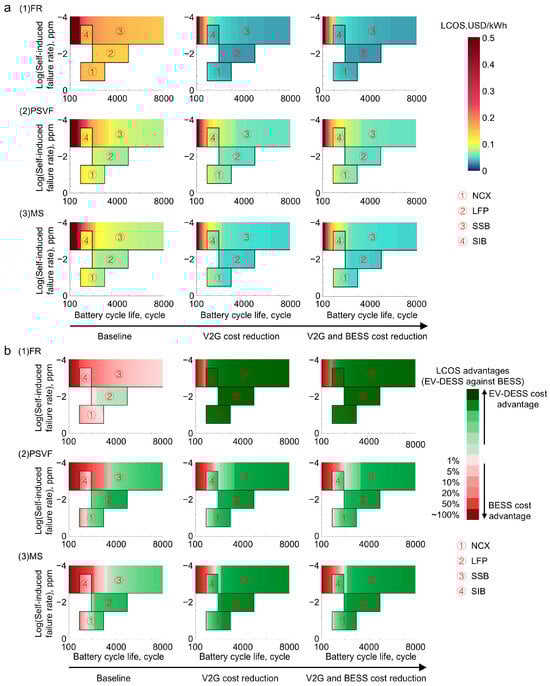
Figure 5.
Comparative LCOS analysis of EV-DESSs and BESSs in Beijing. (a) Variations in the LCOS of EV-DESSs for different grid services and scenarios. Each subfigure indicates the LCOS of EV-DESSs using four types of battery chemistry. (b) LCOS-advantageous technologies for different grid services and scenarios. The colors represent the relative cost competitiveness based on LCOS between EV-DESSs and BESSs, with the colors indicating the LCOS-advantageous technology and the shades indicating the degree of advantages. Considering the current application of batteries for BESS and their differences from those for EVs, we exclusively consider LFP batteries for BESSs with a cycle life of 6000 cycles.
Regarding the two selected technical dimensions, advancements in battery cycle life bring greater benefits than improvements in battery safety. Taking NCX batteries in the baseline scenario as an example, increasing the cycle life from 1000 to 3000 cycles results in a 12.1–41.1% reduction in the LCOS. In contrast, enhancing safety by an order of magnitude yields only a 0.8–2.9% decrease in LCOS. For other battery technologies, the cost-saving impact of improved safety is even smaller due to the relatively low proportion of safety costs in the total LCOS. However, it should be noted that these findings are based solely on cost considerations and do not capture the broader benefits of improved battery safety.
Building on the LCOS results, Figure 5b further depicts the competitive landscape between EV-DESSs and BESSs across different battery technologies. BESSs are specifically modeled with LFP batteries, which are in line with prevailing commercial applications. The results indicate that LFP batteries, as the most favorable option for V2G, provide significant competitiveness against BESSs. When providing grid services, EV-DESSs using LFP batteries achieve a cost advantage of 4.2–33.8% over BESSs. In comparison, NCX batteries exhibit a limited cost advantage of 22.3–23.8% when providing PSVF and MS services, while showing no advantage when providing FR services. SIBs demonstrate little to no cost advantage, performing less favorably than BESSs. Moreover, despite SSBs with a cycle life exceeding 3500 cycles holding potential for PSVF and MS services, they lack LCOS competitiveness in most other scenarios.
While the results above capture the current competitiveness between EV-DESSs and BESSs, future cost declines in batteries and system components will affect their competitive dynamics. To explore the flexibility of technological competition, we further analyze the results in cost reduction scenarios. It is indicated that cost reductions will substantially lower the technical requirements for EV batteries, enabling EV-DESSs to exhibit cost advantages across a broader range of cycle life and safety performances. This is primarily attributed to the anticipated substantial decline in battery costs with advancing technology and economies of scale, a phenomenon that will reduce the proportion of battery replacement costs within the overall LCOS. As a result, the importance of battery technology in the competition between EV-DESSs and BESSs is diminished, and the advantages of EV-DESSs’ lower infrastructure-related costs become more pronounced. In other words, since EV-DESSs incur no battery costs at the construction stage, their capital costs are substantially lower than those of BESSs. In such scenarios, EV-DESSs using LFP batteries, NCX batteries, or SIBs all exhibit LCOS advantages compared to BESSs, with potential reductions of 30.0–74.0%, 33.8–70.6%, and 22.0–67.9%, respectively, depending on the grid service provided. Furthermore, our results suggest that, with cost reductions stemming from the commercialization of SSBs, EV-DESSs utilizing SSBs with a cycle life of more than 2000 cycles will outperform BESSs, offering a cost advantage of up to 37.7–72.1%. Nonetheless, SSBs do not exhibit absolute cost competitiveness over other battery technologies. This is due not only to the high costs of SSBs, but also to the decreasing influence of battery cycle life and safety on the costs of grid services as battery technology continues to improve.
Overall, a longer cycle life, enhanced safety, and lower costs are pivotal for improving the cost competitiveness of EV-DESSs. Among these, battery cycle life and cost remain the most crucial factors in determining the cost-competitiveness of EV-DESSs. From the V2G techno-economic perspective, LFP batteries emerge as the optimal choice for EVs in the short term. However, in the long term, as battery costs decline, the distinctions between different battery technologies become less significant.
Figure 6 presents the results for Guangdong. As previously discussed, owing to differences in ambient temperature and electricity pricing policies, EV-DESSs in Guangdong achieve a lower LCOS. Despite these differences, the overall competitive landscape between EV-DESSs and BESSs remains similar. In the baseline scenario, LFP batteries continue to be the most cost-efficient option. The LCOS of EV-DESSs with LFP batteries providing three grid services ranges from 0.271 USD/kWh to 0.288 USD/kWh, 0.091 USD/kWh to 0.133 USD/kWh, and 0.090 USD/kWh to 0.131 USD/kWh, respectively. In Guangdong, EV-DESSs exhibit greater cost advantages. In the baseline scenario, EV-DESSs with LFP batteries attain a cost advantage up to 5.7–45.6%. While EV-DESSs with NCX batteries can achieve a maximum cost advantage of 2.2–29.4%, their costs tend to exceed those of BESSs in most cases when providing FR services alone. Analogous to the results for Beijing, the anticipated decline in costs further enhances EV-DESSs’ economic performance. EV-DESSs exhibit cost advantages against BESSs of up to 54.8–76.3% with LFP batteries, 40.1–72.8% with NCX batteries, 28.5–70.1% with SIBs, and 52.2–74.4% with SSBs. The Guangdong case demonstrates the competitive potential of EV-DESSs over BESSs under favorable policies and socio-economic conditions.
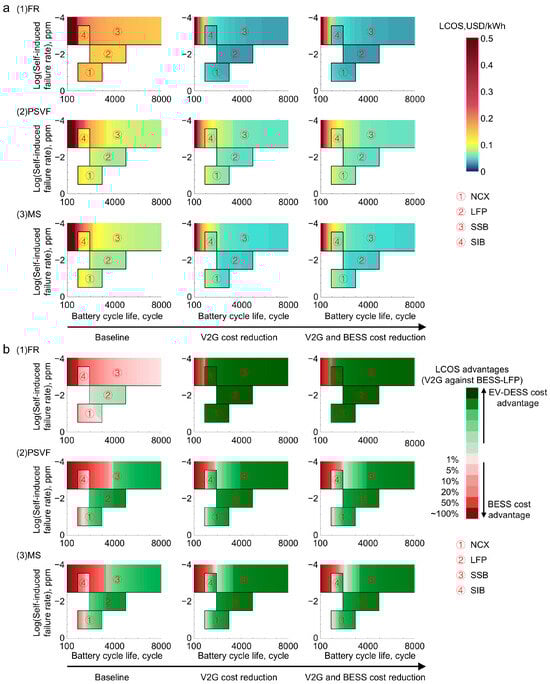
Figure 6.
Comparative LCOS analysis of EV-DESSs and BESSs in Guangdong. (a) Variations in LCOS of EV-DESSs for different grid services and scenarios. (b) LCOS-advantageous technologies for different grid services and scenarios. The settings correspond to those described in Figure 5.
4. Discussion
Our results indicate that, with lower upfront construction costs and full utilization of EV batteries, V2G-based EV-DESSs demonstrate strong economic competitiveness against BESSs across a wide range of battery technologies and cost reduction scenarios. In particular, the type of services provided by V2G matters significantly for its competitiveness. Regarding the current technologies and costs, EV-DESSs show advantages when providing PSVF and MS services. While EV-DESSs demonstrate minimal battery costs when exclusively providing FR services, the economic attractiveness is significantly undermined by high capital costs, stemming from EV-DESSs’ limited operational durations. The findings reveal that providing MS services through V2G technology offers significant advantages, as it can not only ensure robust cost competitiveness and profitability, but also addresses the dual grid demands for FR and PSVF services. Prior studies have investigated the feasibility of integrating multiple services via a single device [31,51]. Nevertheless, implementing coupling strategies that allow a single storage facility to provide both services concurrently presents practical scheduling challenges. In the practical operations of BESSs, providing multiple energy storage services requires scheduling and dispatch strategies across distinct temporal scales, substantially increasing the complexity of the optimal control of systems. Furthermore, the operation of BESSs must address the allocation of storage capacity among different services. Improper capacity allocation may result in underutilization of storage resources. Existing studies have extensively investigated optimization methodologies for coordinating battery energy storage systems in delivering multiple grid services [56,57,58].
The results from Beijing and Guangdong reveal significant geographical discrepancies in the economic competitiveness of EV-DESSs, with Guangdong showing a superior performance. This is partly due to the higher ambient temperatures prevalent in the southern area. With regard to EV driving, excessively high or low ambient temperatures lead to increased energy consumption rates (as shown in Figure 2d). In southern regions like Guangdong, ambient temperature tends to fall within the flatter section of the energy consumption curve, meaning that EVs in these areas consume less energy for commuting. As a result, more additional battery capacity is available for V2G participation. This not only allows for a greater dispersion of fixed costs, but also enables EVs to generate more profits. On the other hand, policies in electricity market critically determine the cost competitiveness and profitability of EV-DESSs, thereby influencing user willingness to participate in V2G. From a cost perspective, the lower valley electricity price in Guangdong reduces the charging costs for providing energy storage services. Conversely, from the perspective of profitability, the more aggressive TOU tariff policies in Guangdong create greater profit margins for EV-DESSs. In addition, current subsidies for FR services remain insufficient to ensure profitability. To optimize the economic viability of EV-DESSs and accelerate the commercial implementation of V2G technology, grid operators should prioritize increasing FR service subsidies and expanding peak–valley tariff differentials. Moreover, implementing real-time electricity pricing strategies that dynamically adjust based on grid load fluctuations offers a viable alternative. Such policies would not only improve the balance between power supply and demand, but also extend the operational window for energy storage devices providing PSVF services, thereby enhancing the overall economic performance.
Safety costs constitute a notable proportion of the total costs when FR services are provided independently. However, for PSVF and MS services, the proportion of safety-related costs is almost negligible due to the large energy throughput. This, however, does not imply that safety is of minor importance. EV-DESSs inherently possess enhanced safety as a distributed energy resource, constraining possible battery self-induced accidents within one vehicle rather than leading to large-scale battery fire hazards. It should be emphasized that the discussion of safety in this study only provides an analysis from the perspective of LCOS, and it is not the full value of battery safety. From a modeling perspective, apportioning the costs of an individual accident to the grid services provided over the entire lifecycle and considering its probability will inevitably dilute the proportion of safety costs. However, beyond economic losses, safety issues will also lead to a series of social issues [59]. In practical applications, battery safety remains a top priority. Thus, V2G’s potential to enhance storage safety represents a key advantage that warrants further attention within the industry.
This study provides insights into the development pathways of EV battery technologies from the perspective of EV-DESSs’ cost competitiveness. As discussed, battery cycle life and safety are key indicators for evaluating different battery chemistries. Given the current state of technological advancement and cost parameters, LFP batteries emerge as the most suitable option for V2G integration due to their superior cycle life and safety which collectively forecast improved economic returns. Conversely, NCX batteries and SIBs exhibit marginal deficiencies in either cycle life or safety benchmarks, diminishing their economic attractiveness for V2G deployment. Despite the promising extended cycle life of SSBs, their immediate prospects are hampered by the inability to commercialize them and by the associated elevated expenses. Prospectively, if future advancements bring SSB costs in line with conventional LIBs, these batteries could become more economically viable, offering enhanced competitiveness for V2G applications.
5. Conclusions
In summary, this study presents a techno-economic assessment of electric vehicle distributed energy storage systems with vehicle-to-grid technology and commercial battery energy storage systems, comparing their competitive landscape across various battery technologies and offering insights into the future development of electric vehicle batteries from the perspective of vehicle-to-grid technology’s economic viability. The results indicate that the levelized cost of storage of electric vehicle distributed energy storage systems and commercial battery energy storage systems, given the status of cost and technologies, ranges from 0.057 USD/kWh to 0.326 USD/kWh and from 0.123 USD/kWh to 0.350 USD/kWh, respectively. As for profitability, the benefit–cost ratio of these two technologies ranges from 26.3% to 270.1% and from 19.3% to 138.0%. Among the four electric vehicle battery technologies considered in this study, lithium iron phosphate batteries are identified as the most compatible solution to meet vehicle-to-grid technology’s requirements. Although solid-state lithium batteries theoretically offer significant cycle life, their current high costs do not confer a definitive cost advantage against other technologies.
It should be noted that this study focuses primarily on the techno-economic aspects of vehicle-to-grid technology, consequently excluding other battery performance metrics that exert a negligible influence, such as energy density. For instance, although ternary lithium-ion batteries may not rival lithium iron phosphate batteries in terms of cycle life and safety, they offer superior energy density. In practical electric vehicle applications, techno-economic viability of vehicle-to-grid technology represents only one of many factors to consider. The selection of battery technologies must, therefore, be a holistic decision that incorporates multiple considerations.
Furthermore, this study does not explore energy storage technologies beyond battery energy storage. The future power system is likely to incorporate various energy storage technologies, such as pumped hydro storage, compressed air energy storage, redox flow batteries, and hydrogen storage, all of which will influence the competitive landscape. Due to differences in performance parameters, these technologies have distinct applications across the generation, grid, or user side. For example, battery energy storage technology is primarily used for hour-level energy storage services, while pumped hydro storage and hydrogen storage are primarily used for month/season-level energy storage services. Additionally, regional disparities in external conditions lead to significant variations in economic evaluations. Future research should expand the scope to include more energy storage technologies, applications, and geographic boundaries, enabling a comprehensive analysis of cost competitiveness among energy storage technologies in different regions. In addition, due to data availability limitations, this study did not model peak shaving and valley filling services for energy storage systems based on load curve data. However, with the future enhancement of load curve data availability, the model structure could be further optimized, incorporating both load curves and time-of-use tariffs to model the operational processes and techno-economic performance of energy storage systems. Additionally, as discussed, this study solely evaluates the techno-economic performance of vehicle-to-grid technology, excluding its environmental impacts. For battery energy storage systems, providing energy storage services not only incurs additional costs, but also generates extra carbon emissions, primarily stemming from the manufacturing processes of related equipment and batteries, as well as energy losses due to battery roundtrip efficiency. Future research should adopt an integrated approach, considering the economic, environmental, and societal benefits of vehicle-to-grid technology to comprehensively assess its competitiveness in the future power system.
Supplementary Materials
The following supporting information can be downloaded at: https://www.mdpi.com/article/10.3390/wevj16040200/s1, Figure S1: Monthly Time-of-Use tariff period in 2023. (a) Beijing; (b) Guangdong; Figure S2: Ambient temperature. (a) Daily ambient temperature distribution in Beijing. (b) Daily ambient temperature distribution in Guangdong; Figure S3: Lookup table for the calendar aging coefficient a(SOCt,Tt) of lithium-ion battery; Table S1: Monthly Time-of-Use tariff policy in 2023 (USD/MWh); Table S2: Lookup table for the lithium-ion battery calendar aging coefficient a(SOCt,Tt); Table S3: Parameters for technical modeling; Table S4: Parameters for cost estimation; Table S5: Parameters for battery safety modeling. References [28,29,46,52,60,61,62,63,64,65,66,67,68,69,70,71,72,73,74,75,76,77,78,79,80,81,82,83,84,85,86,87,88,89,90,91,92] are mentioned in the Supplementary Materials.
Author Contributions
Conceptualization, H.H., Z.L. and F.Z.; methodology, J.G., H.H., X.H., M.L. and H.D.; formal analysis, J.G.; investigation, J.G.; writing—original draft preparation, J.G.; writing—review and editing, H.H., X.H., M.L. and H.D.; supervision, H.H.; project administration, H.H.; funding acquisition, H.H. All authors have read and agreed to the published version of the manuscript.
Funding
This study is sponsored by the National Natural Science Foundation of China (72122010), National Key R&D Program of China (2019YFC1908501), supported by Carbon Neutrality and Energy System Transformation (CNEST) Program led by Tsinghua University, and International Joint Mission on Climate Change and Carbon Neutrality.
Data Availability Statement
Data will be made available on request.
Conflicts of Interest
The authors declare that they have no known competing financial interests or personal relationships that could have appeared to influence the work reported in this paper.
References
- EVTank. China New Energy Vehicle Power Battery Industry Development White Paper. 2024. Available online: http://www.evtank.cn/DownloadDetail.aspx?ID=547 (accessed on 20 February 2025).
- Manufacturers CAoA. China Association of Automobile Manufacturers Information Conference. Available online: https://travel.sohu.com/a/751369426_430289 (accessed on 20 February 2025).
- Rahman, S.; Khan, I.A.; Khan, A.A.; Mallik, A.; Nadeem, M.F. Comprehensive review & impact analysis of integrating projected electric vehicle charging load to the existing low voltage distribution system. Renew. Sustain. Energy Rev. 2022, 153, 111756. [Google Scholar] [CrossRef]
- Boudina, R.; Wang, J.; Benbouzid, M.; Khoucha, F.; Boudour, M. Impact evaluation of large scale integration of electric vehicles on power grid. Front. Energy 2018, 14, 337–346. [Google Scholar] [CrossRef]
- Hashim, M.S.; Yong, J.Y.; Ramachandaramurthy, V.K.; Tan, K.M.; Mansor, M.; Tariq, M. Priority-based vehicle-to-grid scheduling for minimization of power grid load variance. J. Energy Storage 2021, 39, 102607. [Google Scholar] [CrossRef]
- IEA. Global EV Outlook 2022. International Energy Agency. Available online: https://www.iea.org/reports/global-ev-outlook-2022 (accessed on 30 May 2022).
- HUB, VG. V2G Around the World. Available online: https://www.v2g-hub.com/ (accessed on 20 February 2025).
- Commission PNDaR. Opinions on the Strengthening of New Energy Vehicles and Power Grid Integration. Available online: https://www.gov.cn/zhengce/zhengceku/202401/content_6924347.htm (accessed on 20 February 2025).
- Manojkumar, R.; Kumar, C.; Ganguly, S.; Catalão, J.P.S. Net Load Forecast Error Compensation for Peak Shaving in a Grid-Connected PV Storage System. IEEE Trans. Power Syst. 2023, 39, 4372–4381. [Google Scholar] [CrossRef]
- Manojkumar, R.; Kumar, C.; Ganguly, S.; Gooi, H.B.; Mekhilef, S.; Catalão, J.P.S. Rule-Based Peak Shaving Using Master-Slave Level Optimization in a Diesel Generator Supplied Microgrid. IEEE Trans. Power Syst. 2022, 38, 2177–2188. [Google Scholar] [CrossRef]
- Manojkumar, R.; Kumar, C.; Ganguly, S.; Catalao, J.P.S. Optimal Peak Shaving Control Using Dynamic Demand and Feed-In Limits for Grid-Connected PV Sources With Batteries. IEEE Syst. J. 2021, 15, 5560–5570. [Google Scholar] [CrossRef]
- Manojkumar, R.; Kumar, C.; Ganguly, S. Optimal Demand Response Using Dynamic Electricity Price Limit in a Hybrid AC/DC System. In Proceedings of the 2020 21st National Power Systems Conference (NPSC), Gujarat, India, 17–19 December 2020. [Google Scholar]
- Xu, C.; Zhu, M.; Chen, D.; Zhu, W.; Dong, S.; Zhang, S. Optimal Configuration of the User Side Energy Storage With Multiple Values Considering Frequency Regulation. In Proceedings of the 2021 IEEE 4th International Electrical and Energy Conference (CIEEC), Wuhan, China, 28–30 May 2021. [Google Scholar]
- Alliance EES. China’s New-Type Energy Storage Industry Development White Paper. 2024. Available online: https://www.sohu.com/a/769395364_121699293 (accessed on 20 February 2025).
- Putrus, G.; Kotter, R.; Wang, Y.; Das, R.; Bentley, E.; Dai, X.; O’Brien, G.; Heller, R.; Prateek, R.; Gough, R.; et al. State-of-the-Art Assessment of Smart Charging and Vehicle 2 Grid services. 2020. Available online: https://researchportal.northumbria.ac.uk/en/publications/state-of-the-art-assessment-of-smart-charging-and-vehicle-2-grid- (accessed on 20 February 2025).
- Agency, I.E. Grid Integration of Electric Vehicles: A Manual for Policy Makers. Available online: https://www.iea.org/reports/grid-integration-of-electric-vehicles (accessed on 31 December 2022).
- Conzen, J.; Lakshmipathy, S.; Kapahi, A.; Kraft, S.; DiDomizio, M. Lithium ion battery energy storage systems (BESS) hazards. J. Loss Prev. Process. Ind. 2022, 81, 104932. [Google Scholar] [CrossRef]
- McLaren, J.; Gagnon, P.; Anderson, K.; Elgqvist, E.; Fu, R.; Remo, T. Battery Energy Storage Market: Commercial Scale, Lithium-Ion Projects in the US; National Renewable Energy Lab (NREL): Golden, CO, USA, 2016. [Google Scholar]
- Kempton, W.; Tomić, J. Vehicle-to-grid power fundamentals: Calculating capacity and net revenue. J. Power Sources 2005, 144, 268–279. [Google Scholar] [CrossRef]
- White, C.D.; Zhang, K.M. Using vehicle-to-grid technology for frequency regulation and peak-load reduction. J. Power Sources 2011, 196, 3972–3980. [Google Scholar] [CrossRef]
- Han, S.; Han, S.; Sezaki, K. Economic assessment on V2G frequency regulation regarding the battery degradation. Conference Economic assessment on V2G frequency regulation regarding the battery degradation. In Proceedings of the 2012 IEEE PES Innovative Smart Grid Technologies (ISGT), Washington, DC, USA, 16–20 January 2012; IEEE: New York, NY, USA, 2012. [Google Scholar]
- Ahmadian, A.; Sedghi, M.; Mohammadi-Ivatloo, B.; Elkamel, A.; Golkar, M.A.; Fowler, M. Cost-Benefit Analysis of V2G Implementation in Distribution Networks Considering PEVs Battery Degradation. IEEE Trans. Sustain. Energy 2017, 9, 961–970. [Google Scholar] [CrossRef]
- Gough, R.; Dickerson, C.; Rowley, P.; Walsh, C. Vehicle-to-grid feasibility: A techno-economic analysis of EV-based energy storage. Appl. Energy 2017, 192, 12–23. [Google Scholar] [CrossRef]
- Li, X.; Tan, Y.; Liu, X.; Liao, Q.; Sun, B.; Cao, G.; Li, C.; Yang, X.; Wang, Z. A cost-benefit analysis of V2G electric vehicles supporting peak shaving in Shanghai. Electr. Power Syst. Res. 2020, 179, 106058. [Google Scholar] [CrossRef]
- Huda, M.; Koji, T.; Aziz, M. Techno Economic Analysis of Vehicle to Grid (V2G) Integration as Distributed Energy Resources in Indonesia Power System. Energies 2020, 13, 1162. [Google Scholar] [CrossRef]
- Huber, D.; De Clerck, Q.; De Cauwer, C.; Sapountzoglou, N.; Coosemans, T.; Messagie, M. Vehicle to Grid Impacts on the Total Cost of Ownership for Electric Vehicle Drivers. World Electr. Veh. J. 2021, 12, 236. [Google Scholar] [CrossRef]
- Zhao, Y.; Noori, M.; Tatari, O. Vehicle to Grid regulation services of electric delivery trucks: Economic and environmental benefit analysis. Appl. Energy 2016, 170, 161–175. [Google Scholar] [CrossRef]
- Schmidt, O.; Melchior, S.; Hawkes, A.; Staffell, I. Projecting the Future Levelized Cost of Electricity Storage Technologies. Joule 2019, 3, 81–100. [Google Scholar] [CrossRef]
- Beuse, M.; Steffen, B.; Schmidt, T.S. Projecting the Competition between Energy-Storage Technologies in the Electricity Sector. Joule 2020, 4, 2162–2184. [Google Scholar] [CrossRef]
- Goulart, V.V.; Neto, J.A.R.; Rüther, R. Method of techno-economic analysis of Battery Energy Storage System (BESS) function-stacking for medium voltage connected consumers. J. Energy Storage 2024, 83, 110754. [Google Scholar] [CrossRef]
- Li, S.; Xu, Q.; Huang, J. Research on the integrated application of battery energy storage systems in grid peak and frequency regulation. J. Energy Storage 2022, 59, 106459. [Google Scholar] [CrossRef]
- Xu, Y.; Pei, J.; Cui, L.; Liu, P.; Ma, T. The Levelized Cost of Storage of Electrochemical Energy Storage Technologies in China. Front. Energy Res. 2022, 10, 873800. [Google Scholar] [CrossRef]
- Schmidt, T.S.; Beuse, M.; Zhang, X.; Steffen, B.; Schneider, S.F.; Pena-Bello, A.; Bauer, C.; Parra, D. Additional Emissions and Cost from Storing Electricity in Stationary Battery Systems. Environ. Sci. Technol. 2019, 53, 3379–3390. [Google Scholar] [CrossRef] [PubMed]
- Ziegler, M.S.; Song, J.; Trancik, J.E. Determinants of lithium-ion battery technology cost decline. Energy Environ. Sci. 2021, 14, 6074–6098. [Google Scholar] [CrossRef]
- UK UPNI. V2G Global Roadtrip: Around the World in 50 Projects. Available online: https://d1oyzg0jo3ox9g.cloudfront.net/app/uploads/2023/10/V2G-Global-Roadtrip-Around-the-World-in-50-Projects.pdf (accessed on 30 October 2018).
- Arias, N.B.; Hashemi, S.; Andersen, P.B.; Træholt, C.; Romero, R. Assessment of economic benefits for EV owners participating in the primary frequency regulation markets. Int. J. Electr. Power Energy Syst. 2020, 120, 105985. [Google Scholar] [CrossRef]
- Hannan, M.; Wali, S.; Ker, P.; Rahman, M.A.; Mansor, M.; Ramachandaramurthy, V.; Muttaqi, K.; Mahlia, T.; Dong, Z. Battery energy-storage system: A review of technologies, optimization objectives, constraints, approaches, and outstanding issues. J. Energy Storage 2021, 42, 103023. [Google Scholar] [CrossRef]
- Brivio, C.; Mandelli, S.; Merlo, M. Battery energy storage system for primary control reserve and energy arbitrage. Sustain. Energy, Grids Networks 2016, 6, 152–165. [Google Scholar] [CrossRef]
- Zhang, Y.; Yao, W.; You, S.; Yu, W.; Wu, L.; Cui, Y.; Liu, Y. Impacts of Power Grid Frequency Deviation on Time Error of Synchronous Electric Clock and Worldwide Power System Practices on Time Error Correction. Energies 2017, 10, 1283. [Google Scholar] [CrossRef]
- Tamura, S.; Kikuchi, T. V2G strategy for frequency regulation based on economic evaluation considering EV battery longevity. In Proceedings of the 2018 IEEE International Telecommunications Energy Conference (INTELEC), Turino, Italy, 7–11 October 2018; IEEE: New York, NY, USA, 2019. [Google Scholar]
- Hao, X.; Wang, H.; Lin, Z.; Ouyang, M. Seasonal effects on electric vehicle energy consumption and driving range: A case study on personal, taxi, and ridesharing vehicles. J. Clean. Prod. 2020, 249, 119403. [Google Scholar] [CrossRef]
- Economic Analysis of Battery Energy Storage Systems. World Bank. Available online: https://openknowledge.worldbank.org/entities/publication/9bd48668-674b-5059-b496-022e5a27d232 (accessed on 31 May 2020).
- Srithapon, C.; Ghosh, P.; Siritaratiwat, A.; Chatthaworn, R. Optimization of Electric Vehicle Charging Scheduling in Urban Village Networks Considering Energy Arbitrage and Distribution Cost. Energies 2020, 13, 349. [Google Scholar] [CrossRef]
- Muñoz, S.J. ERA5-Land Monthly Averaged Data from 1950 to Present. Available online: https://cds.climate.copernicus.eu/datasets/reanalysis-era5-land-monthly-means?tab=overview (accessed on 23 June 2019).
- Lin, Z.; Greene, D.L. Assessing Energy Impact of Plug-In Hybrid Electric Vehicles: Significance of Daily Distance Variation over Time and Among Drivers. Transport Res. Rec. 2011, 2252, 99–106. [Google Scholar] [CrossRef]
- Shi, Y.; Zhang, Q.; He, A.; Pan, A.; Zhang, M.; Li, C.; Liao, Q.; Yang, X.; Wang, Z. A real-world investigation into usage patterns of electric vehicles in Shanghai. J. Energy Storage 2020, 32, 101805. [Google Scholar] [CrossRef]
- Cordoba-Arenas, A.; Onori, S.; Rizzoni, G. A control-oriented lithium-ion battery pack model for plug-in hybrid electric vehicle cycle-life studies and system design with consideration of health management. J. Power Sources 2015, 279, 791–808. [Google Scholar] [CrossRef]
- Yang, S.; Cheng, H.; Wang, M.; Lyu, M.; Gao, X.; Zhang, Z.; Cao, R.; Li, S.; Lin, J.; Hua, Y.; et al. Multi-scale Battery Modeling Method for Fault Diagnosis. Automot. Innov. 2022, 5, 400–414. [Google Scholar] [CrossRef]
- Wang, J.; Purewal, J.; Liu, P.; Hicks-Garner, J.; Soukazian, S.; Sherman, E.; Sorenson, A.; Vu, L.; Tataria, H.; Verbrugge, M.W. Degradation of lithium ion batteries employing graphite negatives and nickel–cobalt–manganese oxide + spinel manganese oxide positives: Part 1, aging mechanisms and life estimation. J. Power Sources 2014, 269, 937–948. [Google Scholar]
- Lonergan, K.E.; Egli, F.; Osorio, S.; Sansavini, G.; Pahle, M.; Schmidt, T.S.; Steffen, B. Improving the representation of cost of capital in energy system models. Joule 2023, 7, 469–483. [Google Scholar] [CrossRef]
- Bhoir, S.; Caliandro, P.; Brivio, C. Impact of V2G service provision on battery life. J. Energy Storage 2021, 44, 103178. [Google Scholar] [CrossRef]
- Geng, J.; Bai, B.; Hao, H.; Sun, X.; Liu, M.; Liu, Z.; Zhao, F. Assessment of vehicle-side costs and profits of providing vehicle-to-grid services. eTransportation 2023, 19, 100303. [Google Scholar] [CrossRef]
- Nam, K.; Chang, D.; Chang, K.; Rhee, T.; Lee, I.-B. Methodology of life cycle cost with risk expenditure for offshore process at conceptual design stage. Energy 2011, 36, 1554–1563. [Google Scholar] [CrossRef]
- Sang, J.; Tang, B.; Pan, K.; He, Y.-B.; Zhou, Z. Current Status and Enhancement Strategies for All-Solid-State Lithium Batteries. Accounts Mater. Res. 2023, 4, 472–483. [Google Scholar] [CrossRef]
- Balaish, M.; Gonzalez-Rosillo, J.C.; Kim, K.J.; Zhu, Y.; Hood, Z.D.; Rupp, J.L.M. Processing thin but robust electrolytes for solid-state batteries. Nat. Energy 2021, 6, 227–239. [Google Scholar] [CrossRef]
- Hanif, S.; Alam, M.; Roshan, K.; Bhatti, B.A.; Bedoya, J.C. Multi-service battery energy storage system optimization and control. Appl. Energy 2022, 311, 118614. [Google Scholar] [CrossRef]
- Haas, J.; Cebulla, F.; Nowak, W.; Rahmann, C.; Palma-Behnke, R. A multi-service approach for planning the optimal mix of energy storage technologies in a fully-renewable power supply. Energy Convers. Manag. 2018, 178, 355–368. [Google Scholar] [CrossRef]
- Engels, J.; Claessens, B.; Deconinck, G. Optimal Combination of Frequency Control and Peak Shaving With Battery Storage Sys-tems. IEEE Trans. Smart Grid 2020, 11, 3270–3279. [Google Scholar] [CrossRef]
- Kirkels, A.F.; Bleker, J.; Romijn, H.A. Ready for the Road? A Socio-Technical Investigation of Fire Safety Improvement Options for Lithium-Ion Traction Batteries. Energies 2022, 15, 3323. [Google Scholar] [CrossRef]
- China’s Commercial and Industrial Electricity Prices in 2023. 2023. Available online: https://data-pro.smm.cn/ (accessed on 20 February 2025).
- Nájera, J.; Arribas, J.R.; de Castro, R.M.; Núñez, C.S. Semi-empirical ageing model for LFP and NMC Li-ion battery chemistries. J. Energy Storage 2023, 72, 108016. [Google Scholar]
- Bureau BEM. Fengtai District “4–16” Large Fire Accident Investigation Report. 2021. Available online: https://yjglj.beijing.gov.cn/art/2021/11/22/art_4520_466.html (accessed on 20 February 2025).
- LYNKVERTX. Introduction of V2G Charging Pile. 2024. Available online: https://linkutec.com/V2G_Charging_Pile (accessed on 20 February 2025).
- Uddin, K.; Jackson, T.; Widanage, W.D.; Chouchelamane, G.; Jennings, P.A.; Marco, J. On the possibility of extending the lifetime of lithium-ion batteries through optimal V2G facilitated by an integrated vehicle and smart-grid system. Energy 2017, 133, 710–722. [Google Scholar] [CrossRef]
- Rahman, M.; Gemechu, E.; Oni, A.O.; Kumar, A. The development of a techno-economic model for assessment of cost of energy storage for vehicle-to-grid applications in a cold climate. Energy 2022, 262. [Google Scholar] [CrossRef]
- Wei, H.; Zhang, Y.; Wang, Y.; Hua, W.; Jing, R.; Zhou, Y. Planning integrated energy systems coupling V2G as a flexible storage. Energy 2022, 239, 122215. [Google Scholar]
- Englberger, S.; Gamra, K.A.; Tepe, B.; Schreiber, M.; Jossen, A.; Hesse, H. Electric vehicle multi-use: Optimizing multiple value streams using mobile storage systems in a vehicle-to-grid context. Appl. Energy 2021, 304, 117862. [Google Scholar] [CrossRef]
- Hossain, E.; Murtaugh, D.; Mody, J.; Faruque, H.M.R.; Sunny, S.H.; Mohammad, N. A Comprehensive Review on Second-Life Batteries: Current State, Manufacturing Considerations, Applications, Impacts, Barriers & Potential Solutions, Business Strategies, and Policies. IEEE Access 2019, 7, 73215–73252. [Google Scholar] [CrossRef]
- CATL. Storing Infinite Energy - Energy Storage System Solutions and Products. Available online: https://www.catl.com/en/uploads/1/file/public/202406/20240624152558_qft6x51t14.pdf (accessed on 20 February 2025).
- Geng, J.; Gao, S.; Sun, X.; Liu, Z.; Zhao, F.; Hao, H. Potential of electric vehicle batteries second use in energy storage systems: The case of China. Energy 2022, 253. [Google Scholar] [CrossRef]
- Borlaug, B.; Salisbury, S.; Gerdes, M.; Muratori, M. Levelized Cost of Charging Electric Vehicles in the United States. Joule 2020, 4, 1470–1485. [Google Scholar] [CrossRef]
- Qiao, Q.; Zhao, F.; Liu, Z.; He, X.; Hao, H. Life cycle greenhouse gas emissions of Electric Vehicles in China: Combining the vehicle cycle and fuel cycle. Energy 2019, 177, 222–233. [Google Scholar] [CrossRef]
- GB/T 15945-2008; Power Quality-Frequency Deviation for Power System. Standard TCsN. The China’s National Standard: Beijing, China, 2008.
- GB/T 40595-2021; Guide for Technology and Test on Primary Frequency Control of Grid-Connected Power Resource. Standard TCsN. The China’s National Standard: Beijing, China, 2021.
- Orangi, S.; Manjong, N.; Clos, D.P.; Usai, L.; Burheim, O.S.; Strømman, A.H. Historical and prospective lithium-ion battery cost trajectories from a bottom-up production modeling perspective. J. Energy Storage 2023, 76. [Google Scholar] [CrossRef]
- Schnell, J.; Knörzer, H.; Imbsweiler, A.J.; Reinhart, G. Solid versus Liquid—A Bottom-Up Calculation Model to Analyze the Manufacturing Cost of Future High-Energy Batteries. Energy Technol. 2020, 8, 1901237. [Google Scholar] [CrossRef]
- Agency JSaT. Secondary Battery System (Vol. 8): Cost Evaluation and Technological Challenges of an All-Solid-State Lithium-Ion Battery. 2019. Available online: https://www.jst.go.jp/lcs/en/proposals/fy2019-pp-12.html (accessed on 20 February 2025).
- Caitong Securities. Sodium-Ion Battery Cost Measurement. 2023. Available online: https://www.sgpjbg.com/baogao/118789.html (accessed on 20 February 2025).
- News CE. Sodium-Ion Battery Cost Advantage Still to Be Tapped. 2023. Available online: http://paper.people.com.cn/zgnyb/html/2023-03/06/content_25969888.htm (accessed on 20 February 2025).
- SMM. Price for Lithium-Ion Battery Recycling (2024.3.21). 2024. Available online: https://data-pro.smm.cn/ (accessed on 20 February 2025).
- U.S.DOE. 2022 Grid Energy Storage Technology Cost and Performance Assessment. 2022. Available online: https://www.energy.gov/eere/analysis/2022-grid-energy-storage-technology-cost-and-performance-assessment (accessed on 20 February 2025).
- Liao, Z.; Taiebat, M.; Xu, M. Shared autonomous electric vehicle fleets with vehicle-to-grid capability: Economic viability and environmental co-benefits. Appl. Energy 2021, 302. [Google Scholar] [CrossRef]
- Commission NDaR. Notice on the Establishment of the Market Price Mechanism for Electricity Ancillary Services. 2024. Available online: https://www.gov.cn/zhengce/zhengceku/202402/content_6931026.htm (accessed on 20 February 2025).
- Liu, X.; Zhao, F.; Geng, J.; Hao, H.; Liu, Z. Comprehensive assessment for different ranges of battery electric vehicles: Is it necessary to develop an ultra-long range battery electric vehicle? iScience 2023, 26, 106654. [Google Scholar] [CrossRef]
- Reform BMCoDa. Beijing Residential and Non-Residential Water Sales Price List. 2018. Available online: https://fgw.beijing.gov.cn/bmcx/djcx/jzldj/202003/t20200331_1752796.htm (accessed on 20 February 2025).
- Economics, T. China Labour Costs Index. 2024. Available online: https://tradingeconomics.com/china/labour-costs (accessed on 20 February 2025).
- McMahon, K.; Dahdah, S. The True Cost of Road Crashes: Valuing Life and the Cost of a Serious Injury; iRAP: London, UK, 2008. [Google Scholar]
- PRC SCot. Factbox: China’s Economic, Social Progress in 2023. 2024. Available online: http://en.cppcc.gov.cn/2024-03/03/c_966891.htm (accessed on 1 June 2024).
- IRS. Yearly Average Currency Exchange Rates; Internal Revenue Service: Washington, DC, USA, 2023.
- China-SAE. Technology Roadmap for Energy Saving and New Energy Vehicles 2.0; China-SAE: Beijing, China, 2024. [Google Scholar]
- Analysis of The Blade Battery Parameters. 2021. Available online: https://www.dongchedi.com/article/6949714583896556062 (accessed on 1 June 2024).
- EVE. EVE 4680 Cylindrical Cell. 2021. Available online: https://baijiahao.baidu.com/s?id=1766192947550732218&wfr=spider&for=pc (accessed on 1 June 2024).
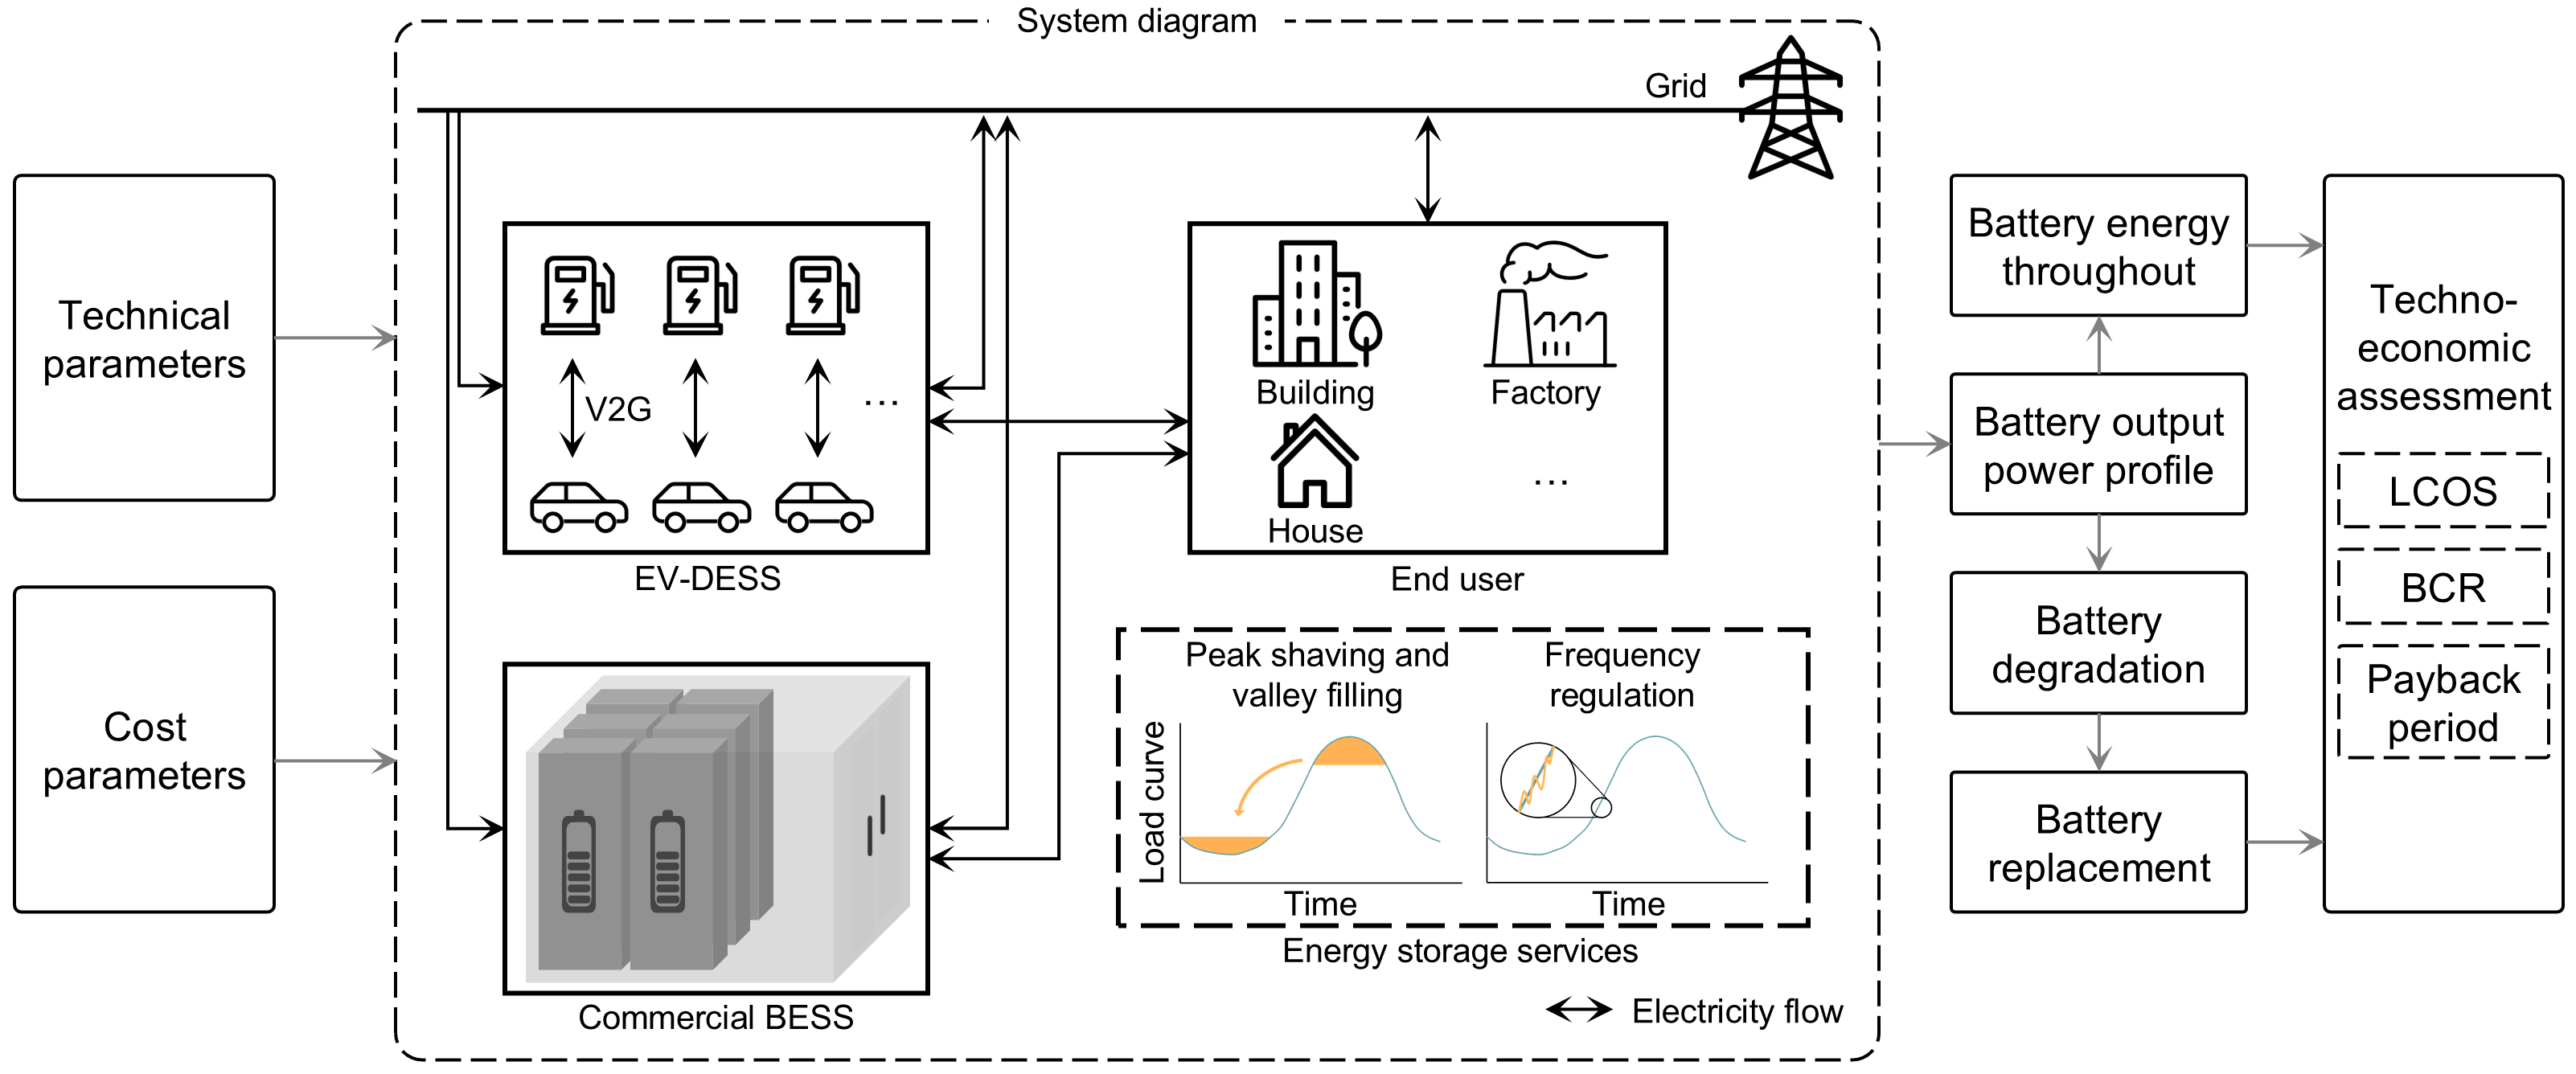
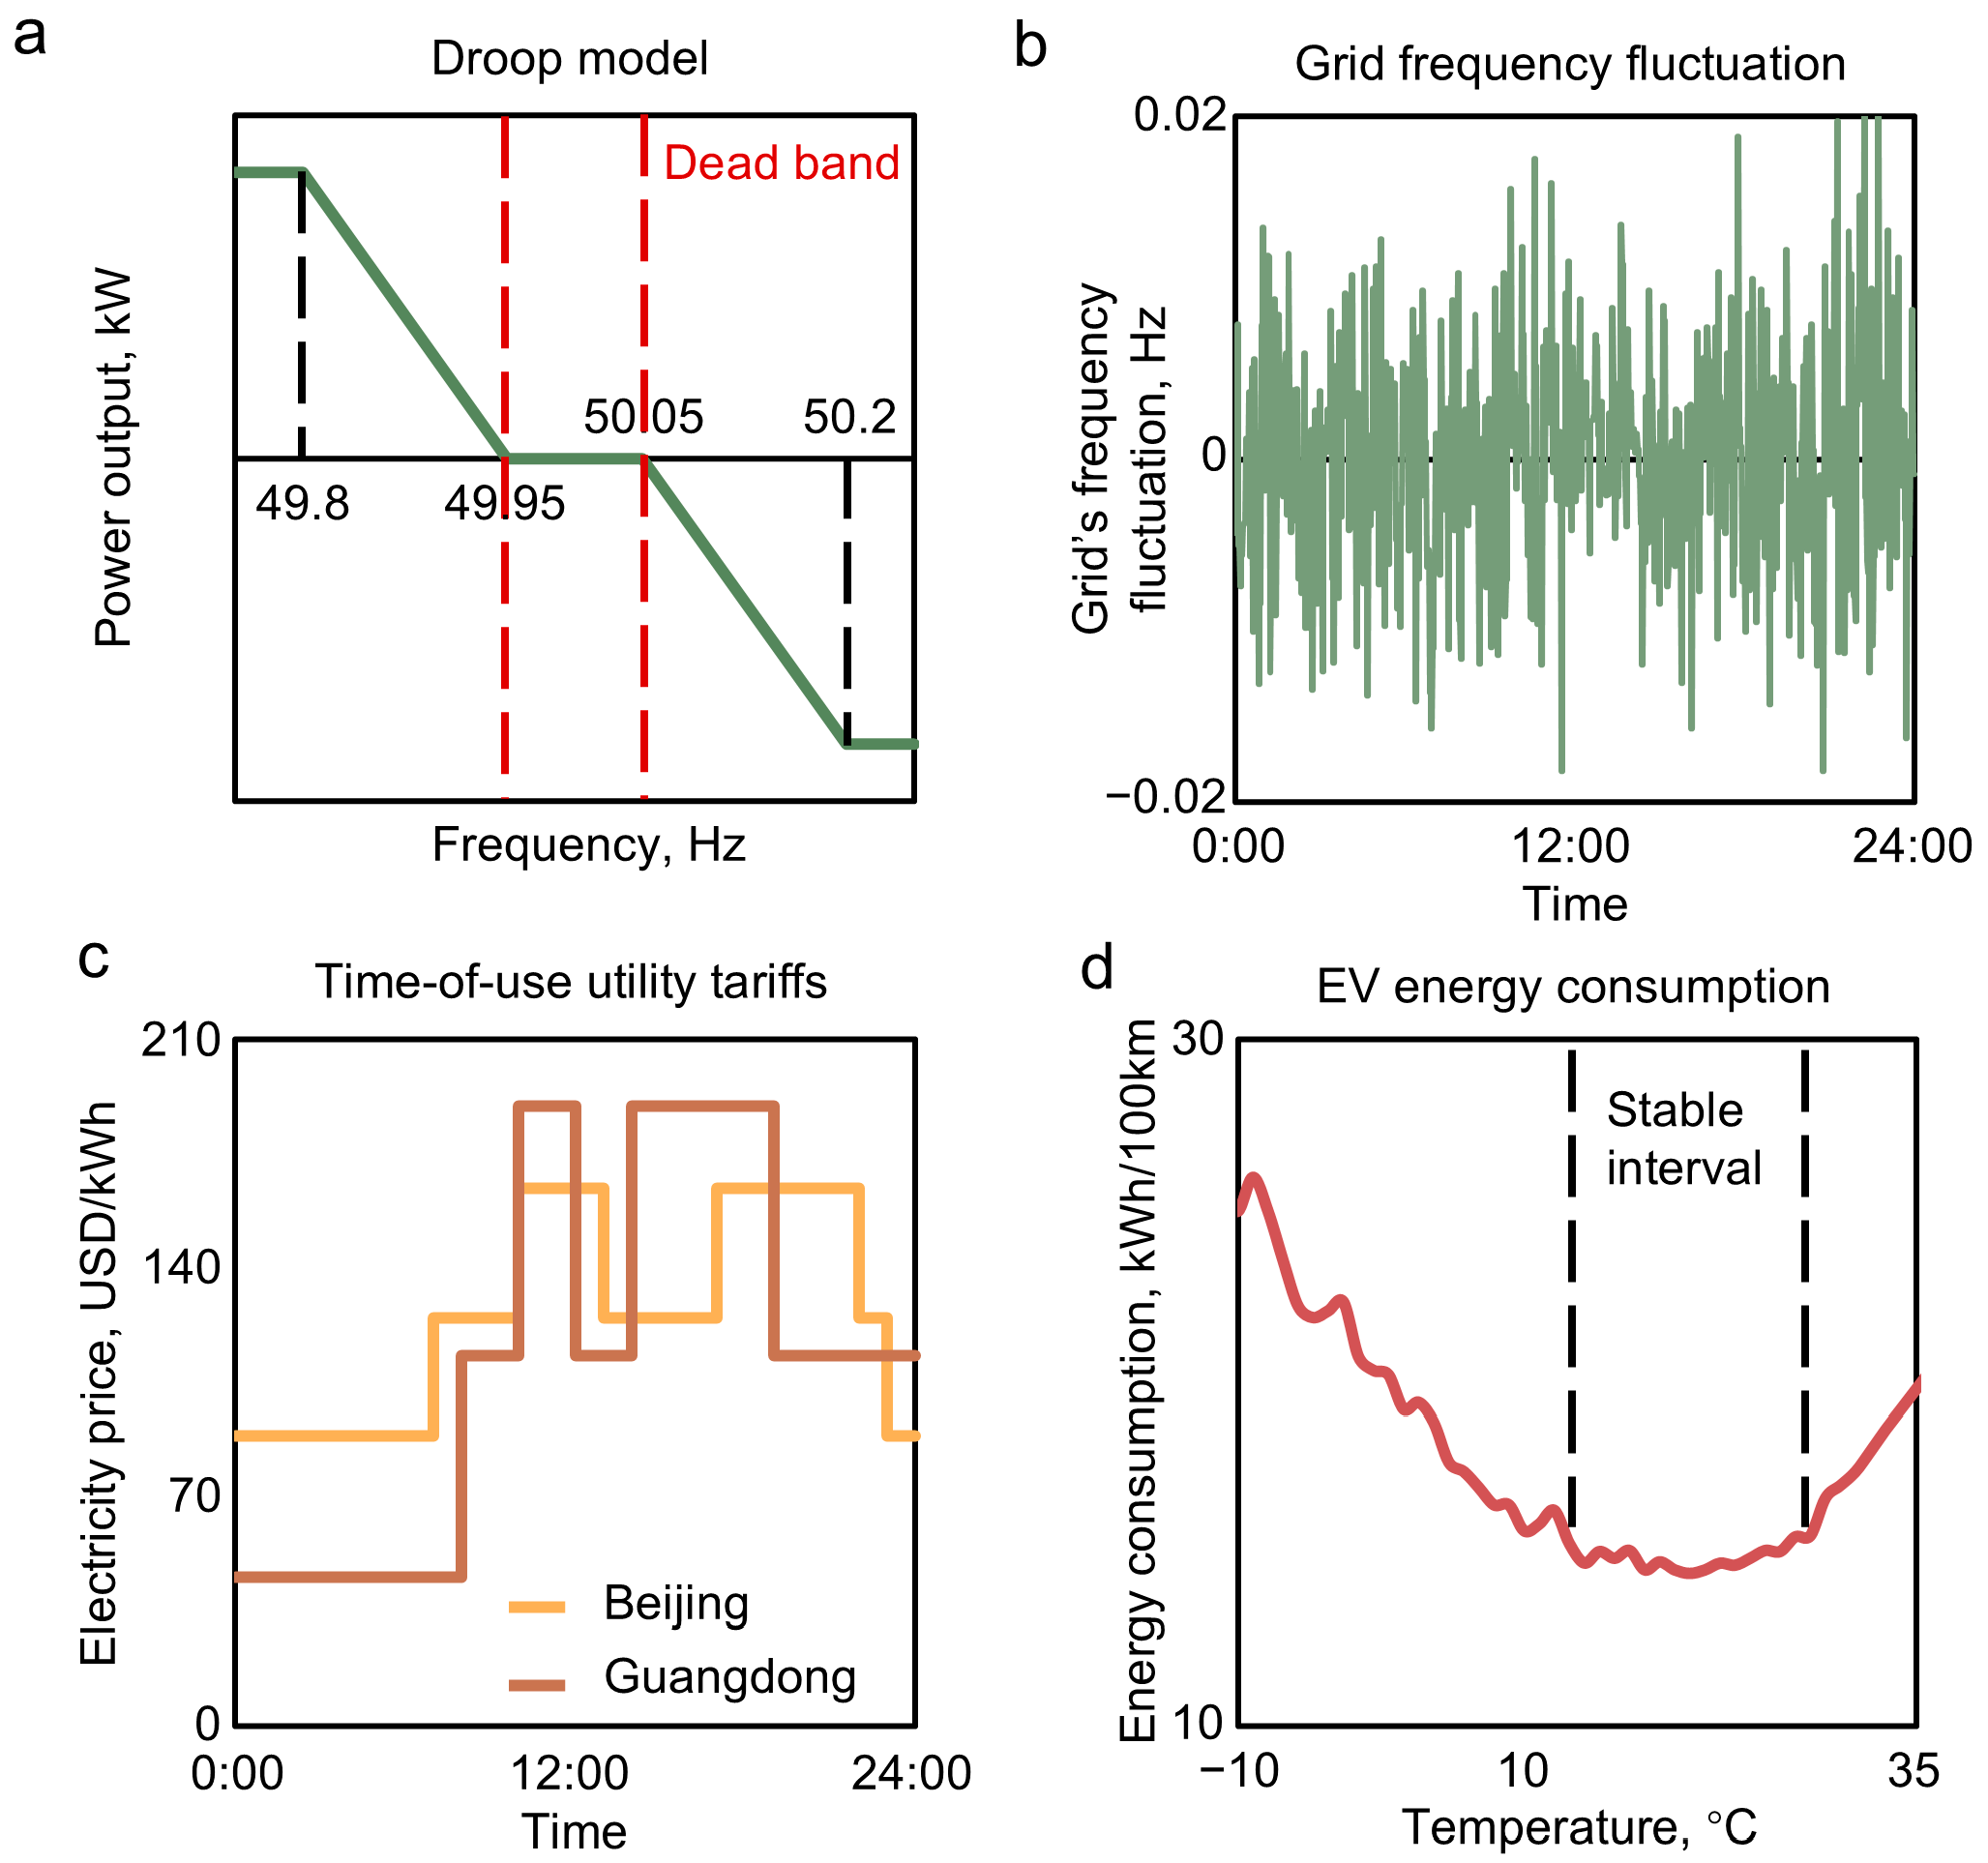
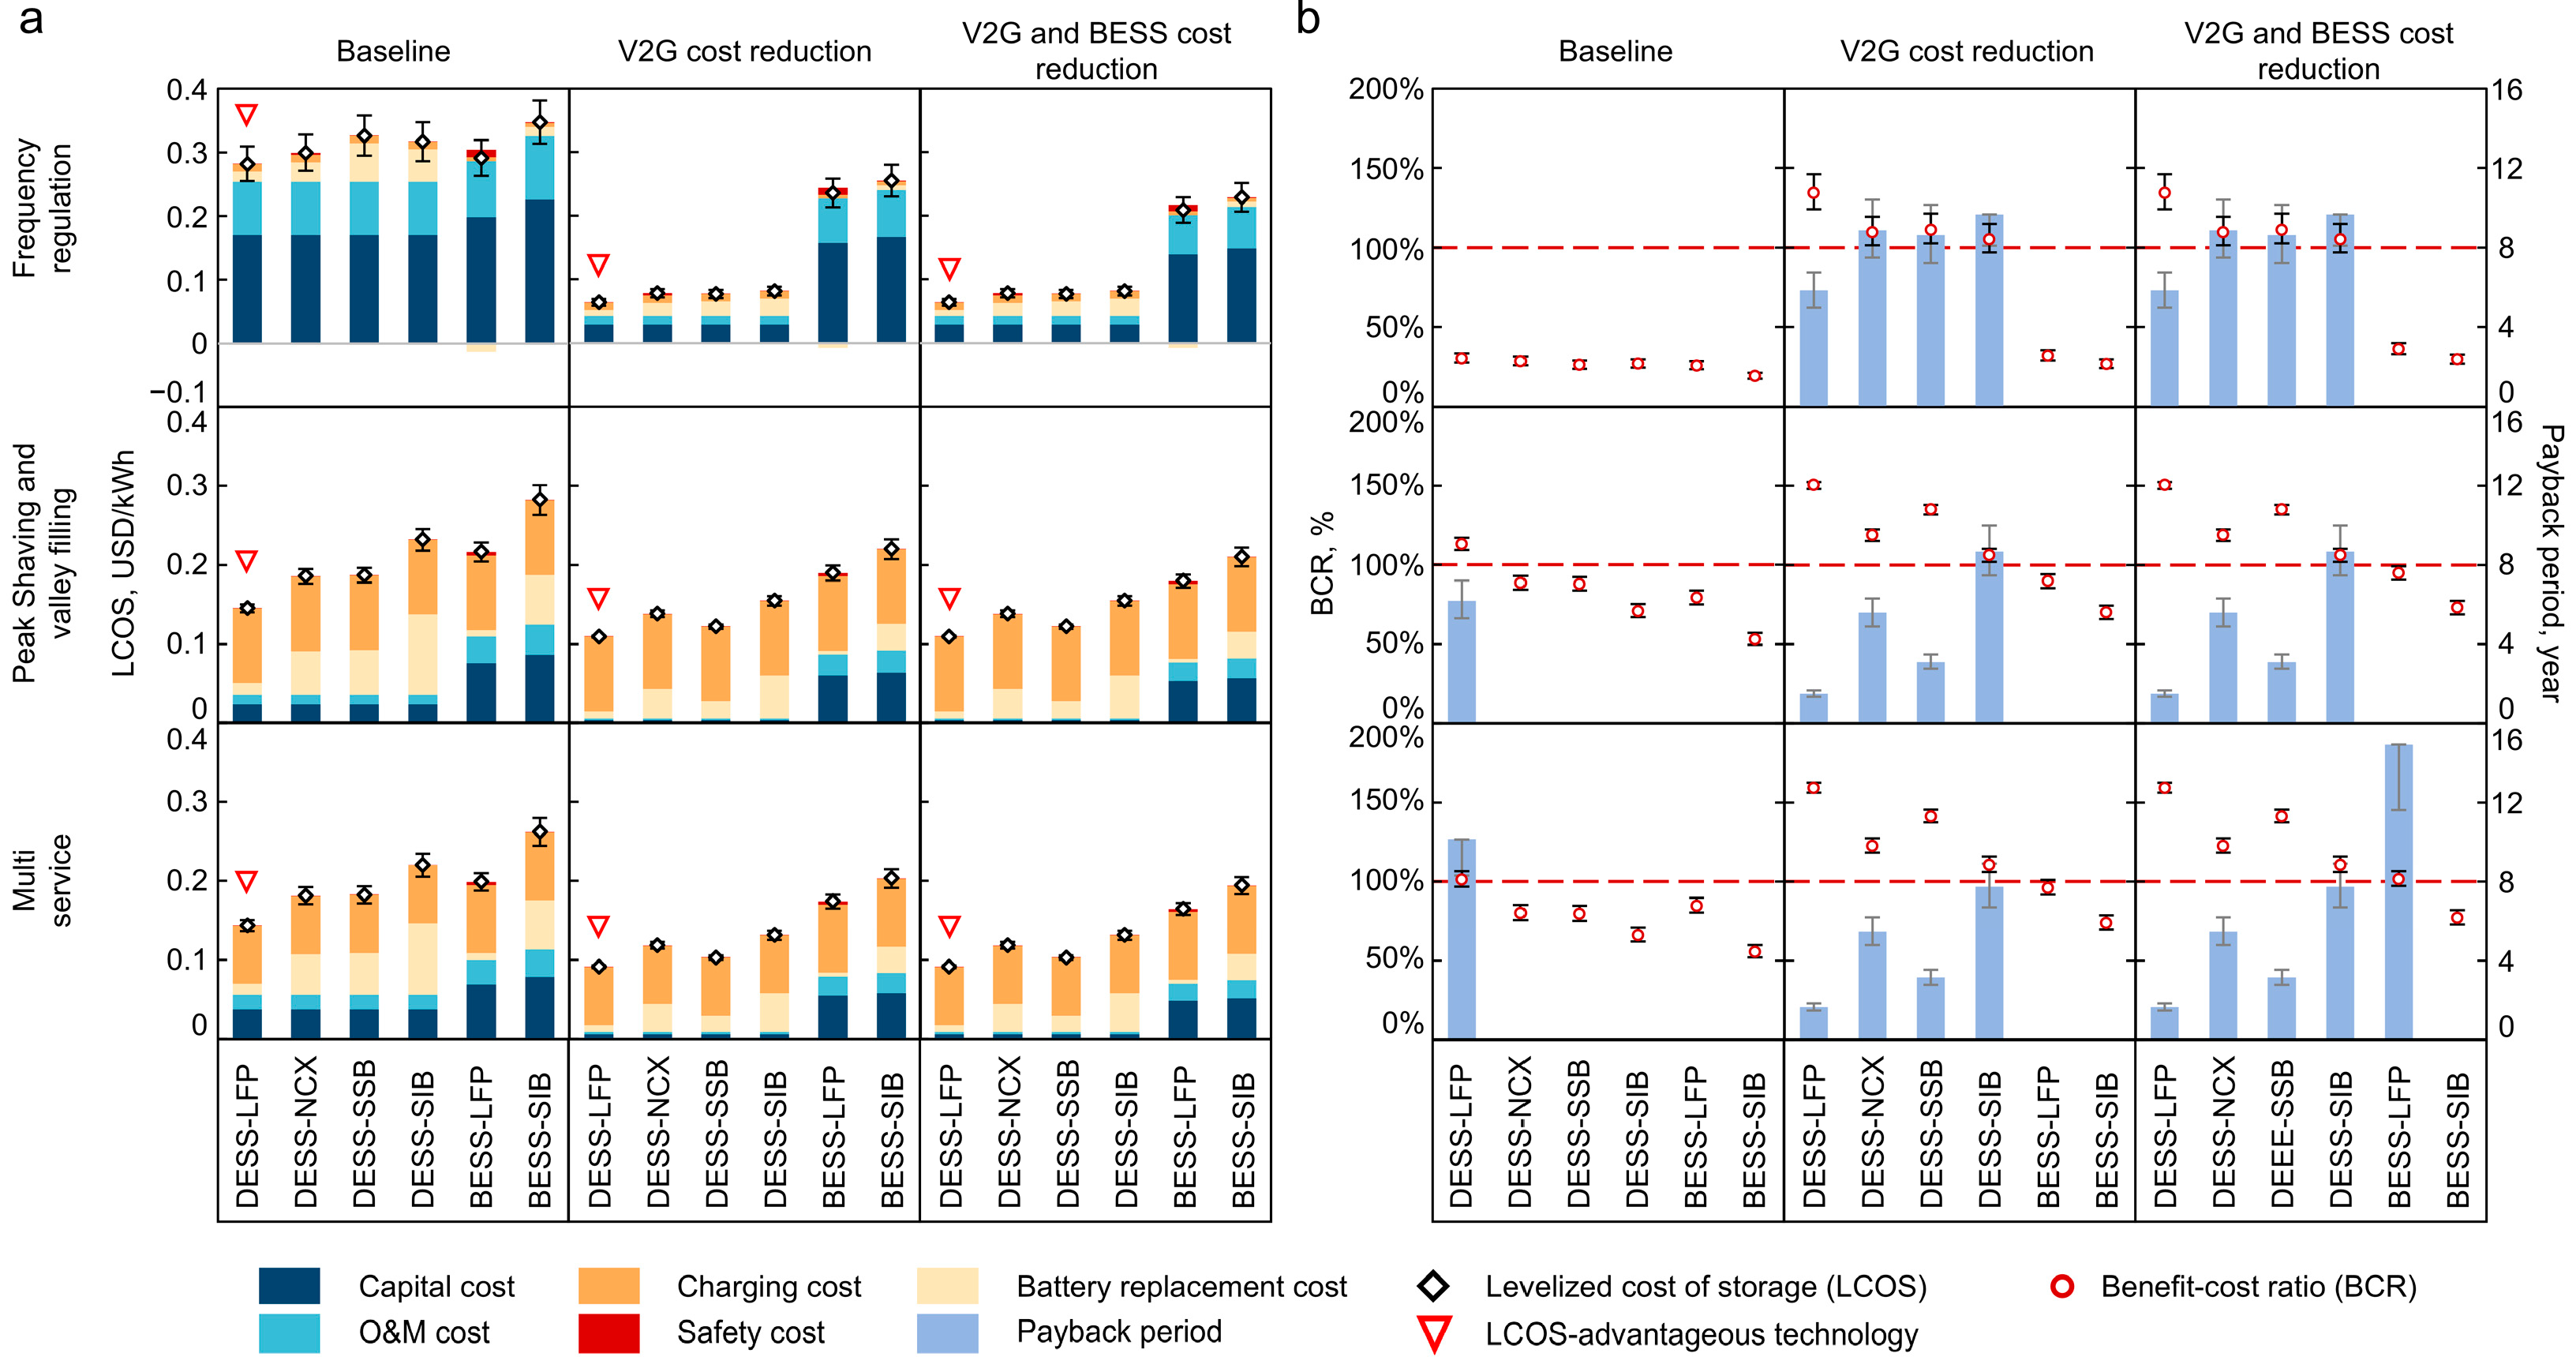


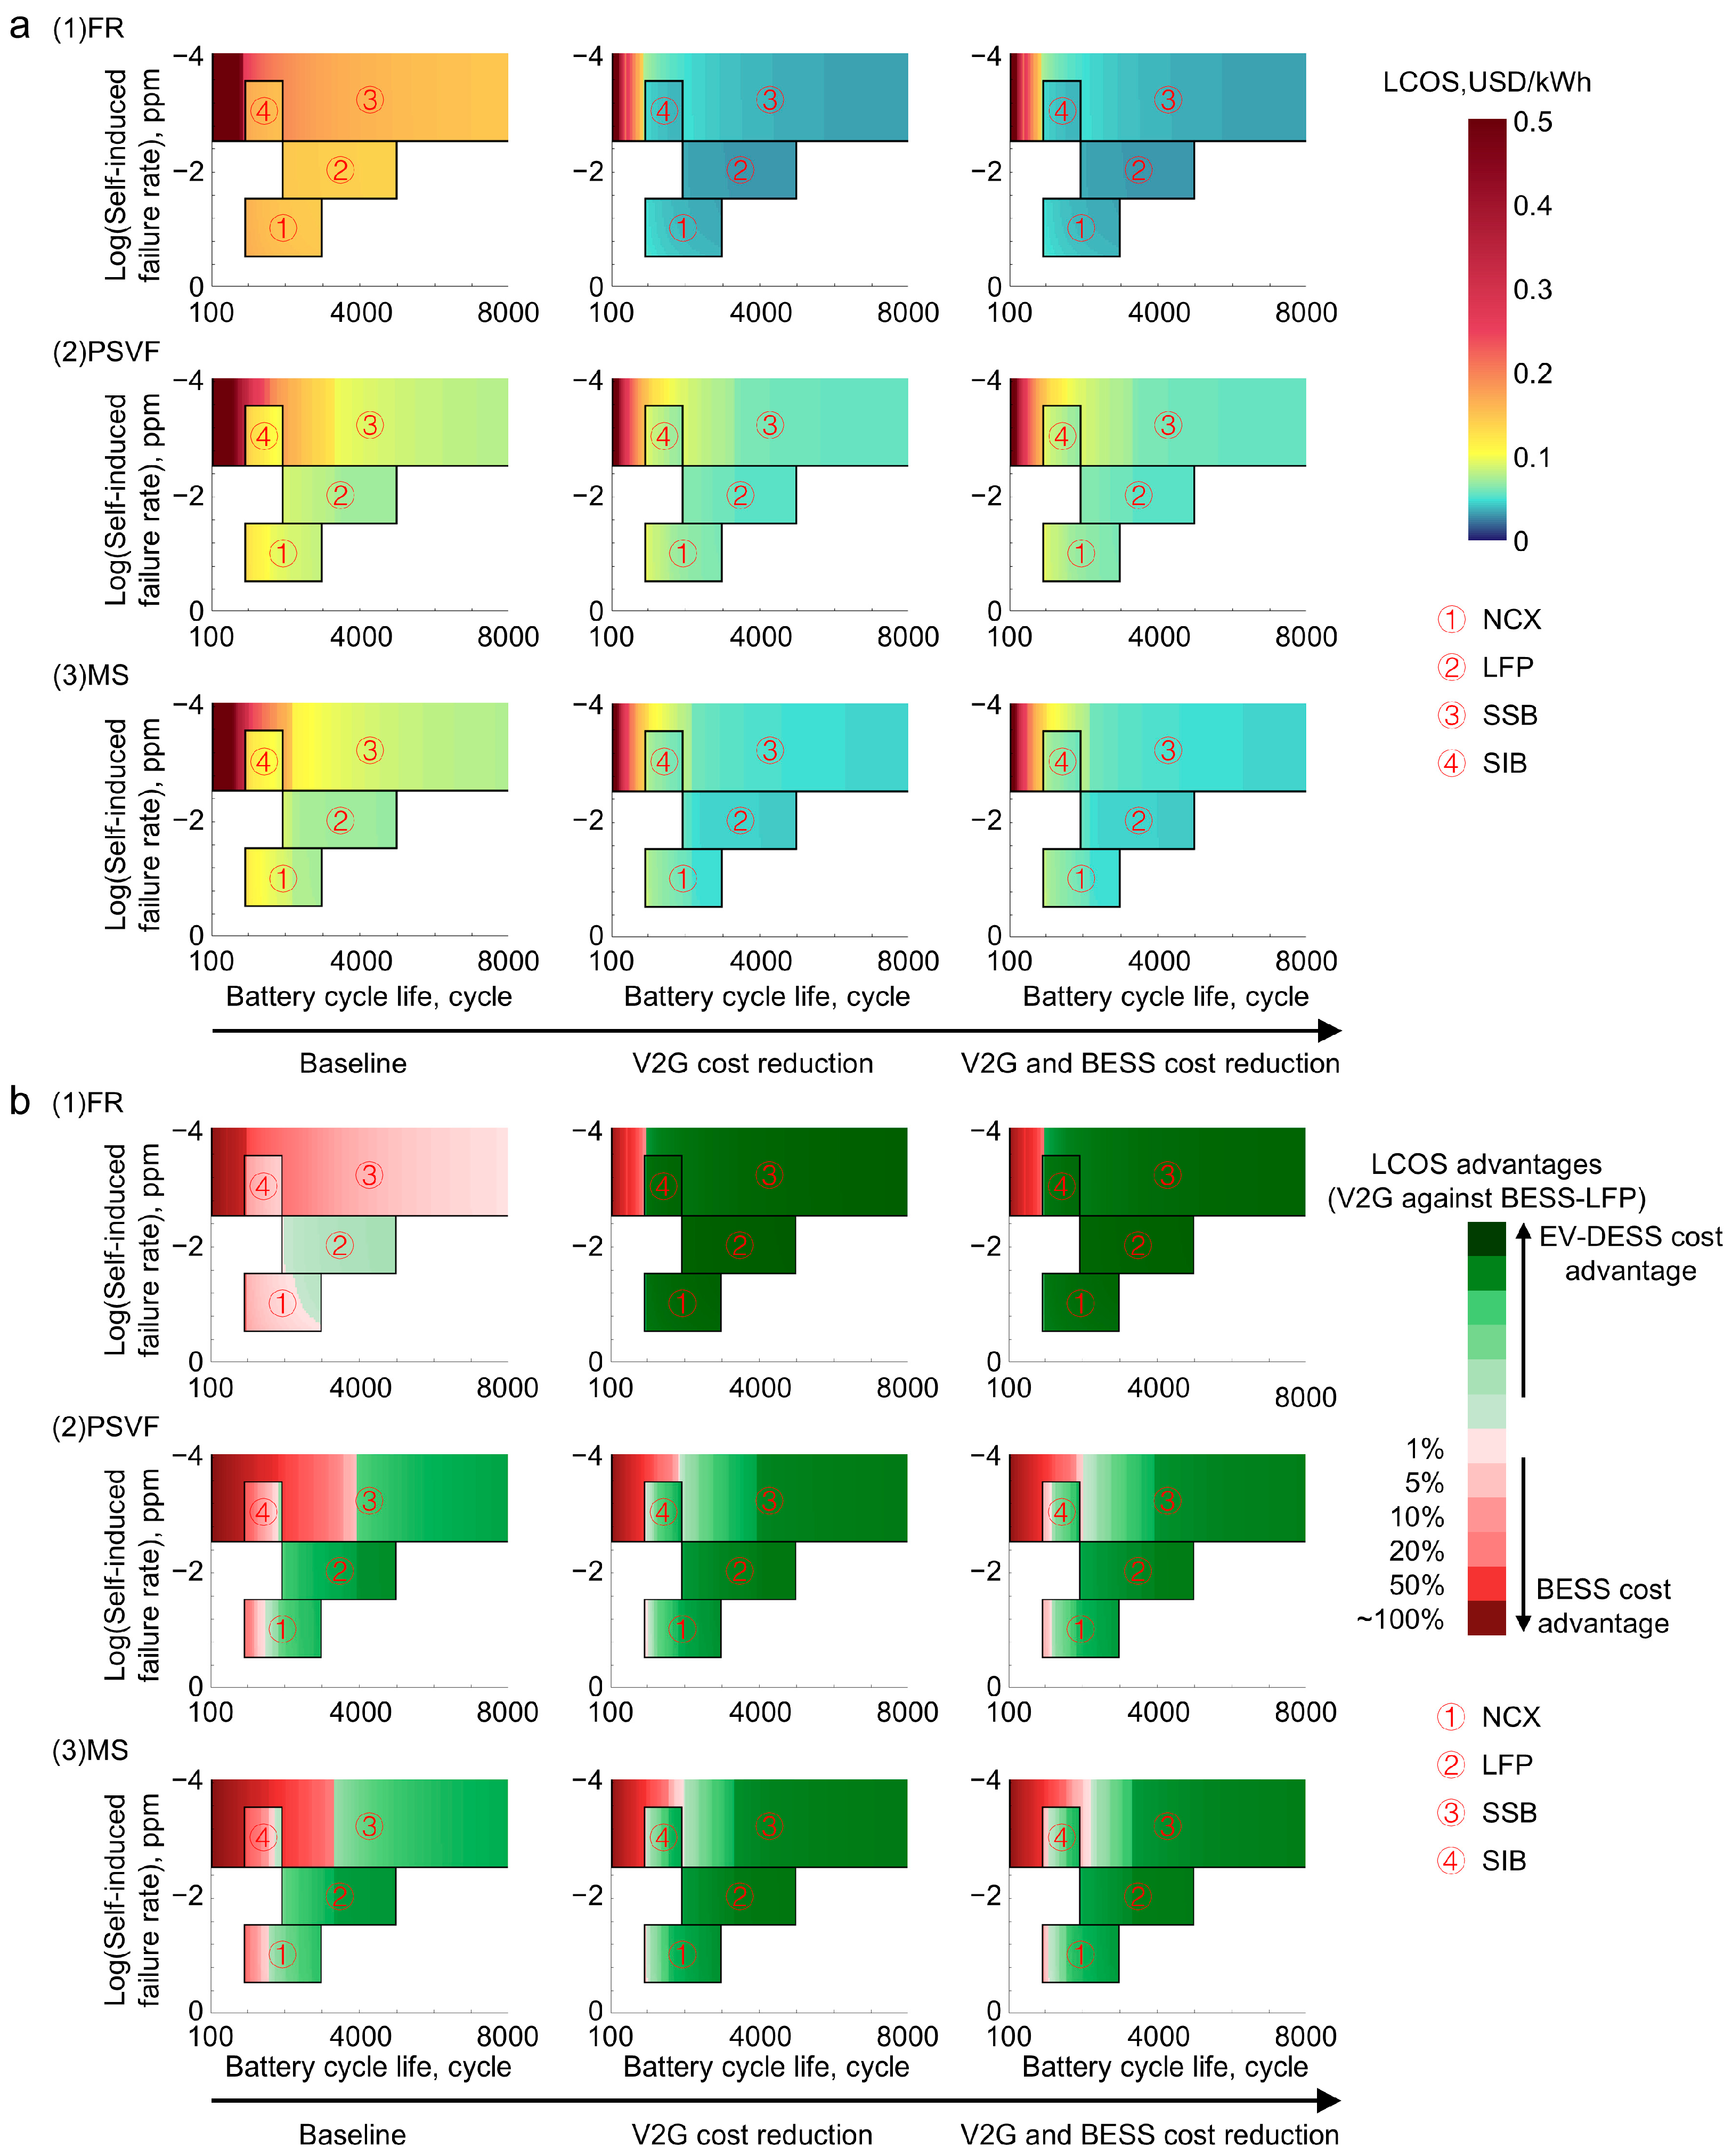
Disclaimer/Publisher’s Note: The statements, opinions and data contained in all publications are solely those of the individual author(s) and contributor(s) and not of MDPI and/or the editor(s). MDPI and/or the editor(s) disclaim responsibility for any injury to people or property resulting from any ideas, methods, instructions or products referred to in the content. |
© 2025 by the authors. Published by MDPI on behalf of the World Electric Vehicle Association. Licensee MDPI, Basel, Switzerland. This article is an open access article distributed under the terms and conditions of the Creative Commons Attribution (CC BY) license (https://creativecommons.org/licenses/by/4.0/).