
Hybrid Electric Propulsion Design and Analysis Based on Regional Aircraft Mission

Abstract
1. Introduction
- (1)
- The characteristics of three hybrid propulsion architectures are analyzed and compared.
- (2)
- Performance evaluations are conducted on the propulsion systems and flight mission capabilities, summarizing the effects of different architectures and design parameters on aircraft performance.
- (3)
- Finally, sensitivity analyses of critical technologies within the most advantageous architecture are performed, establishing their relevance to the development of hybrid propulsion systems and aircraft.
2. Physical Model
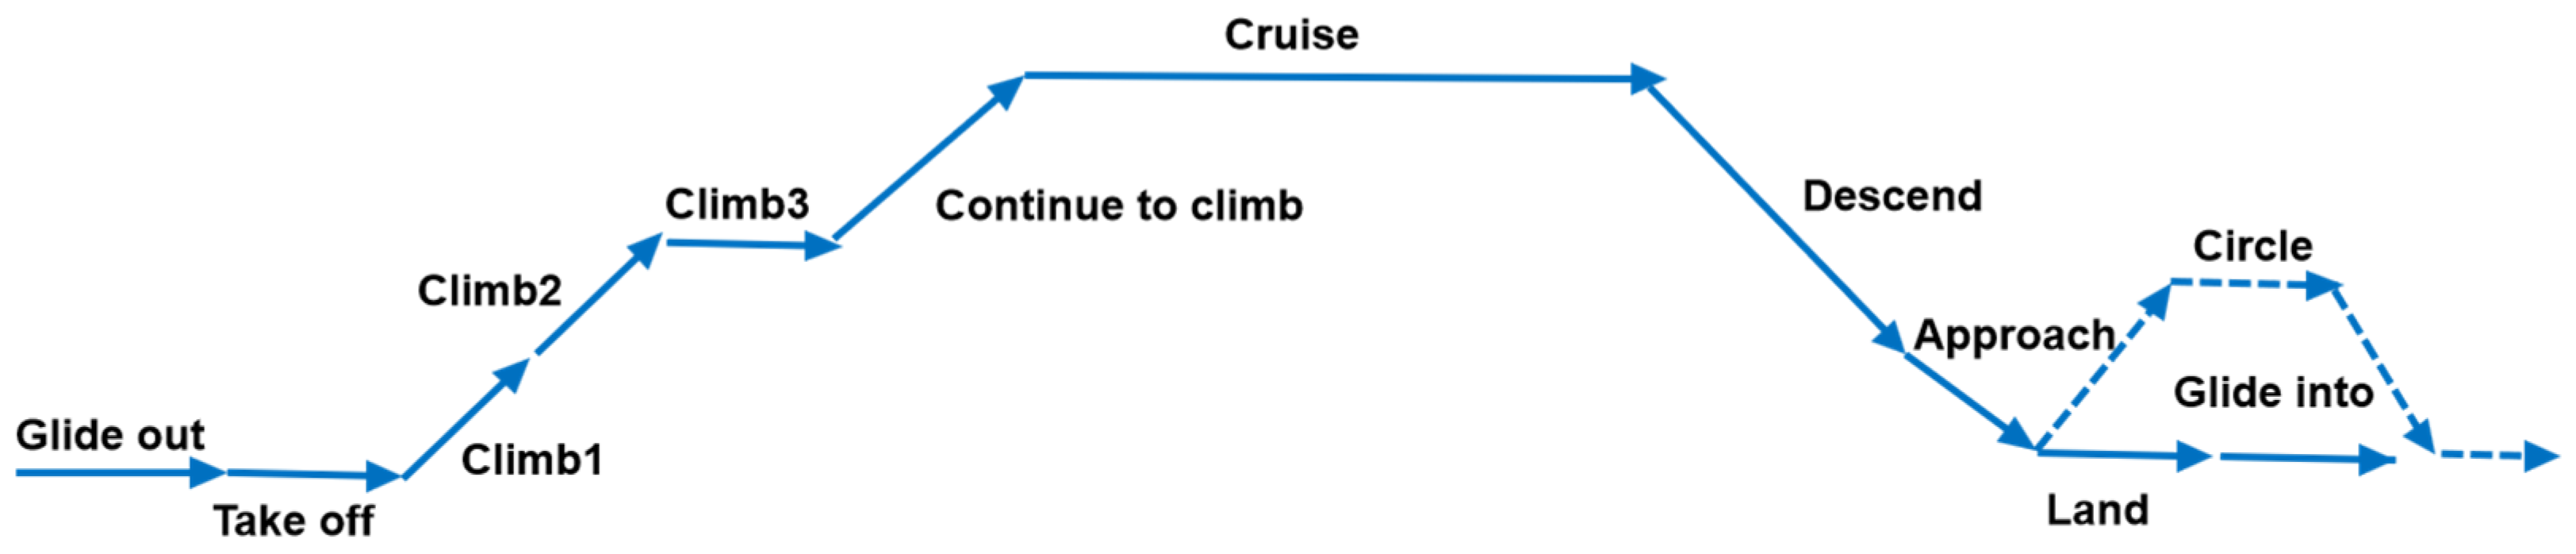
2.1. Mission
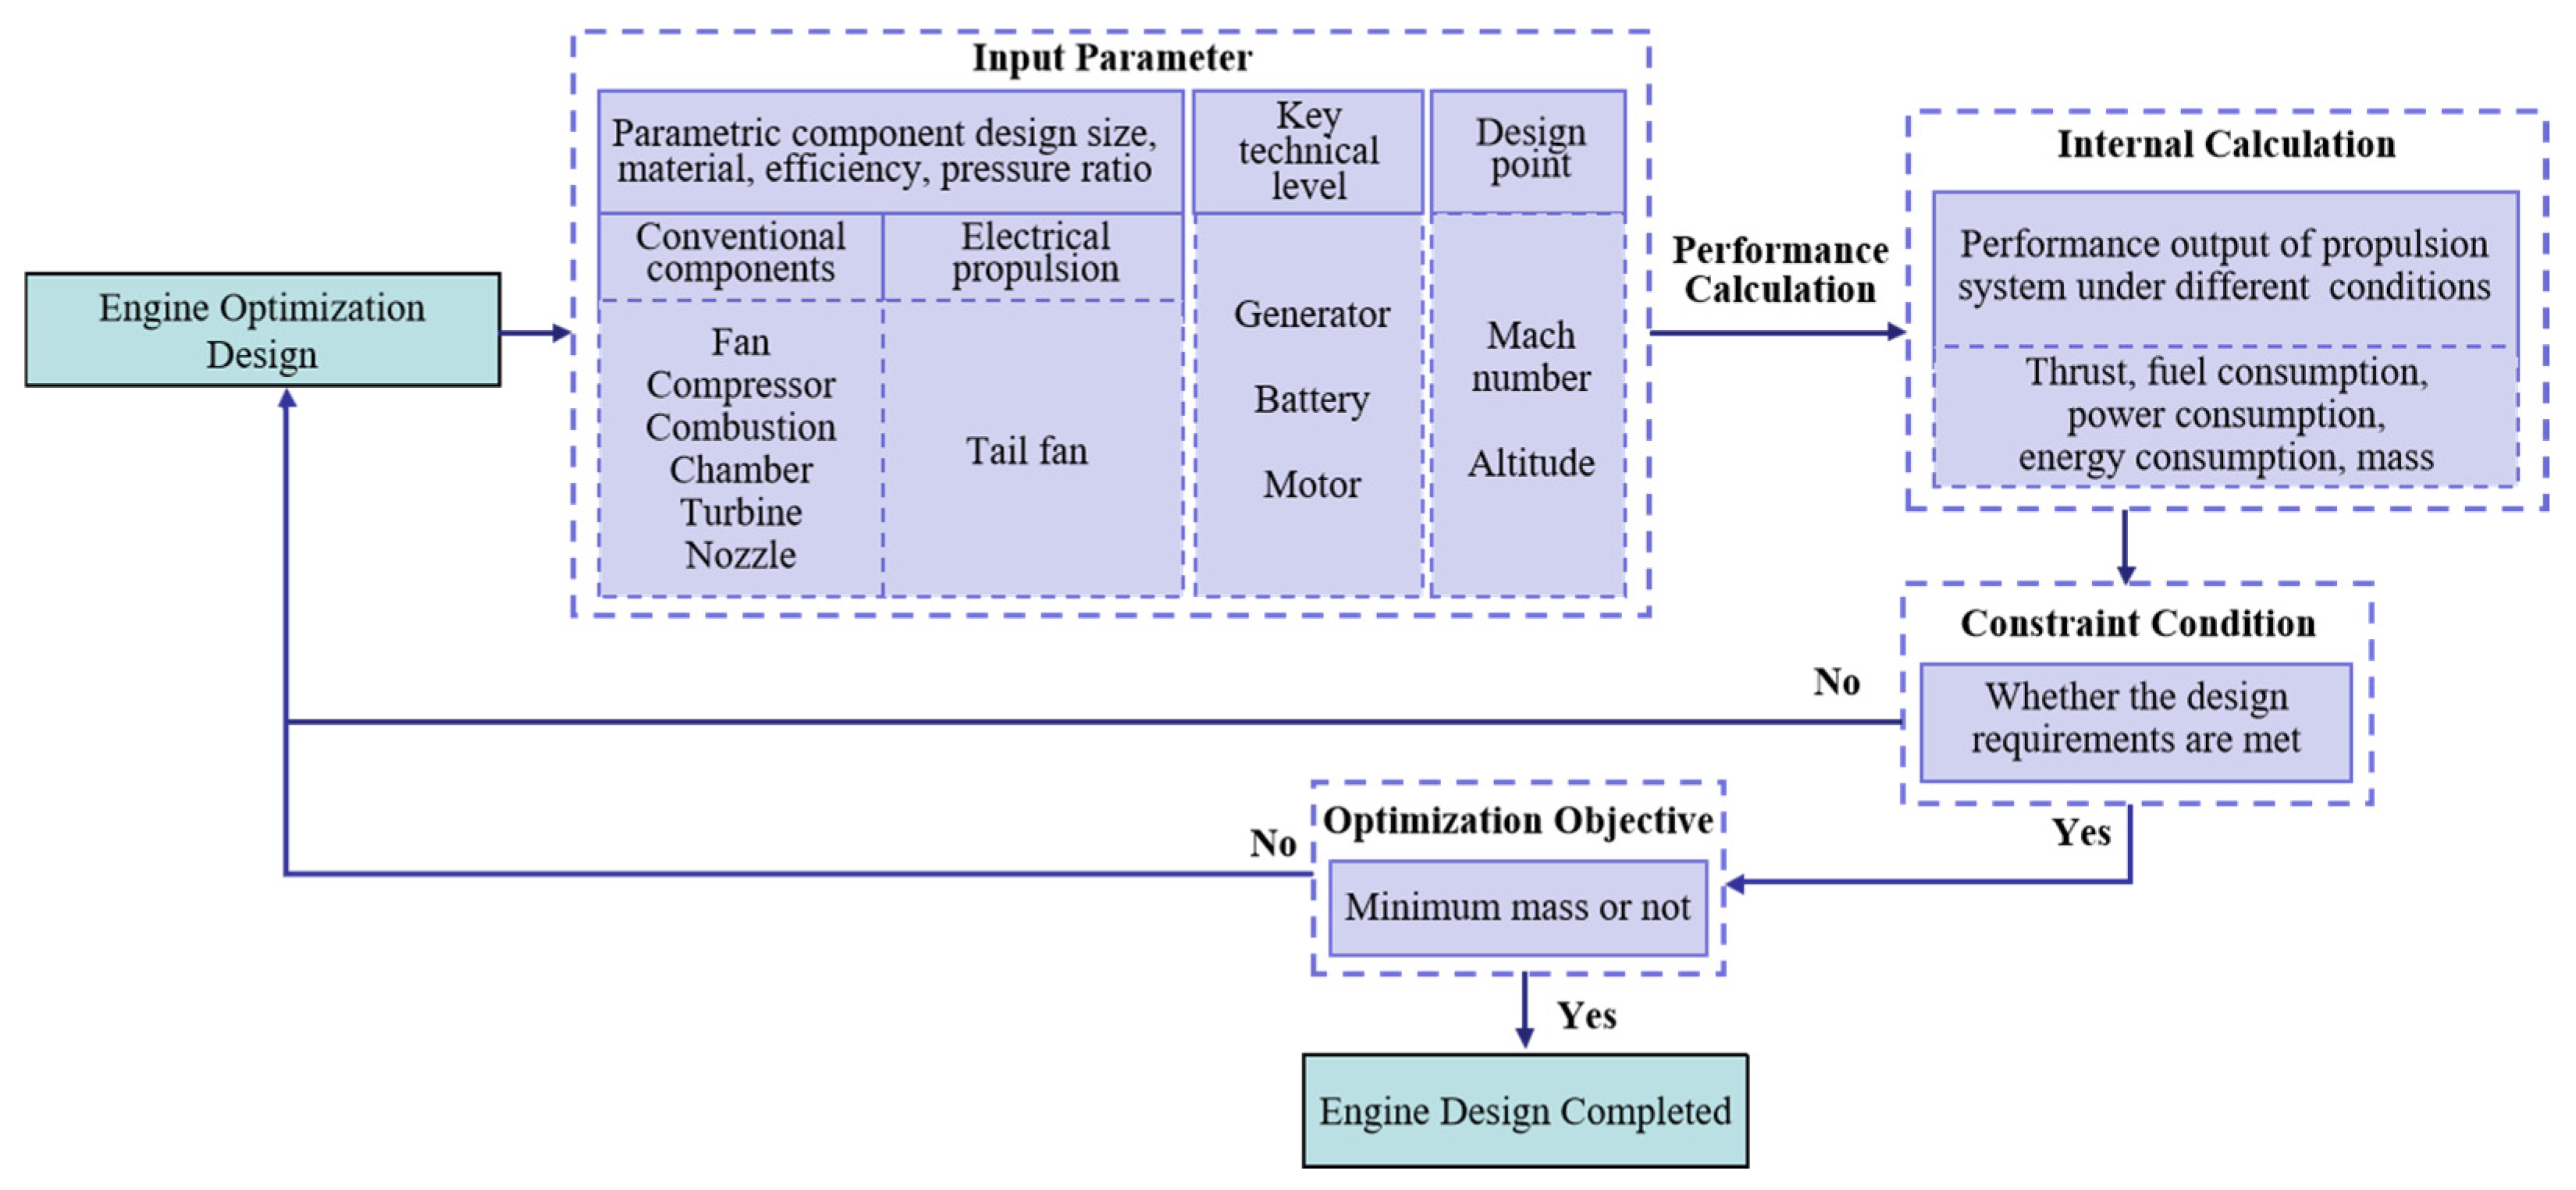
2.2. Propulsion
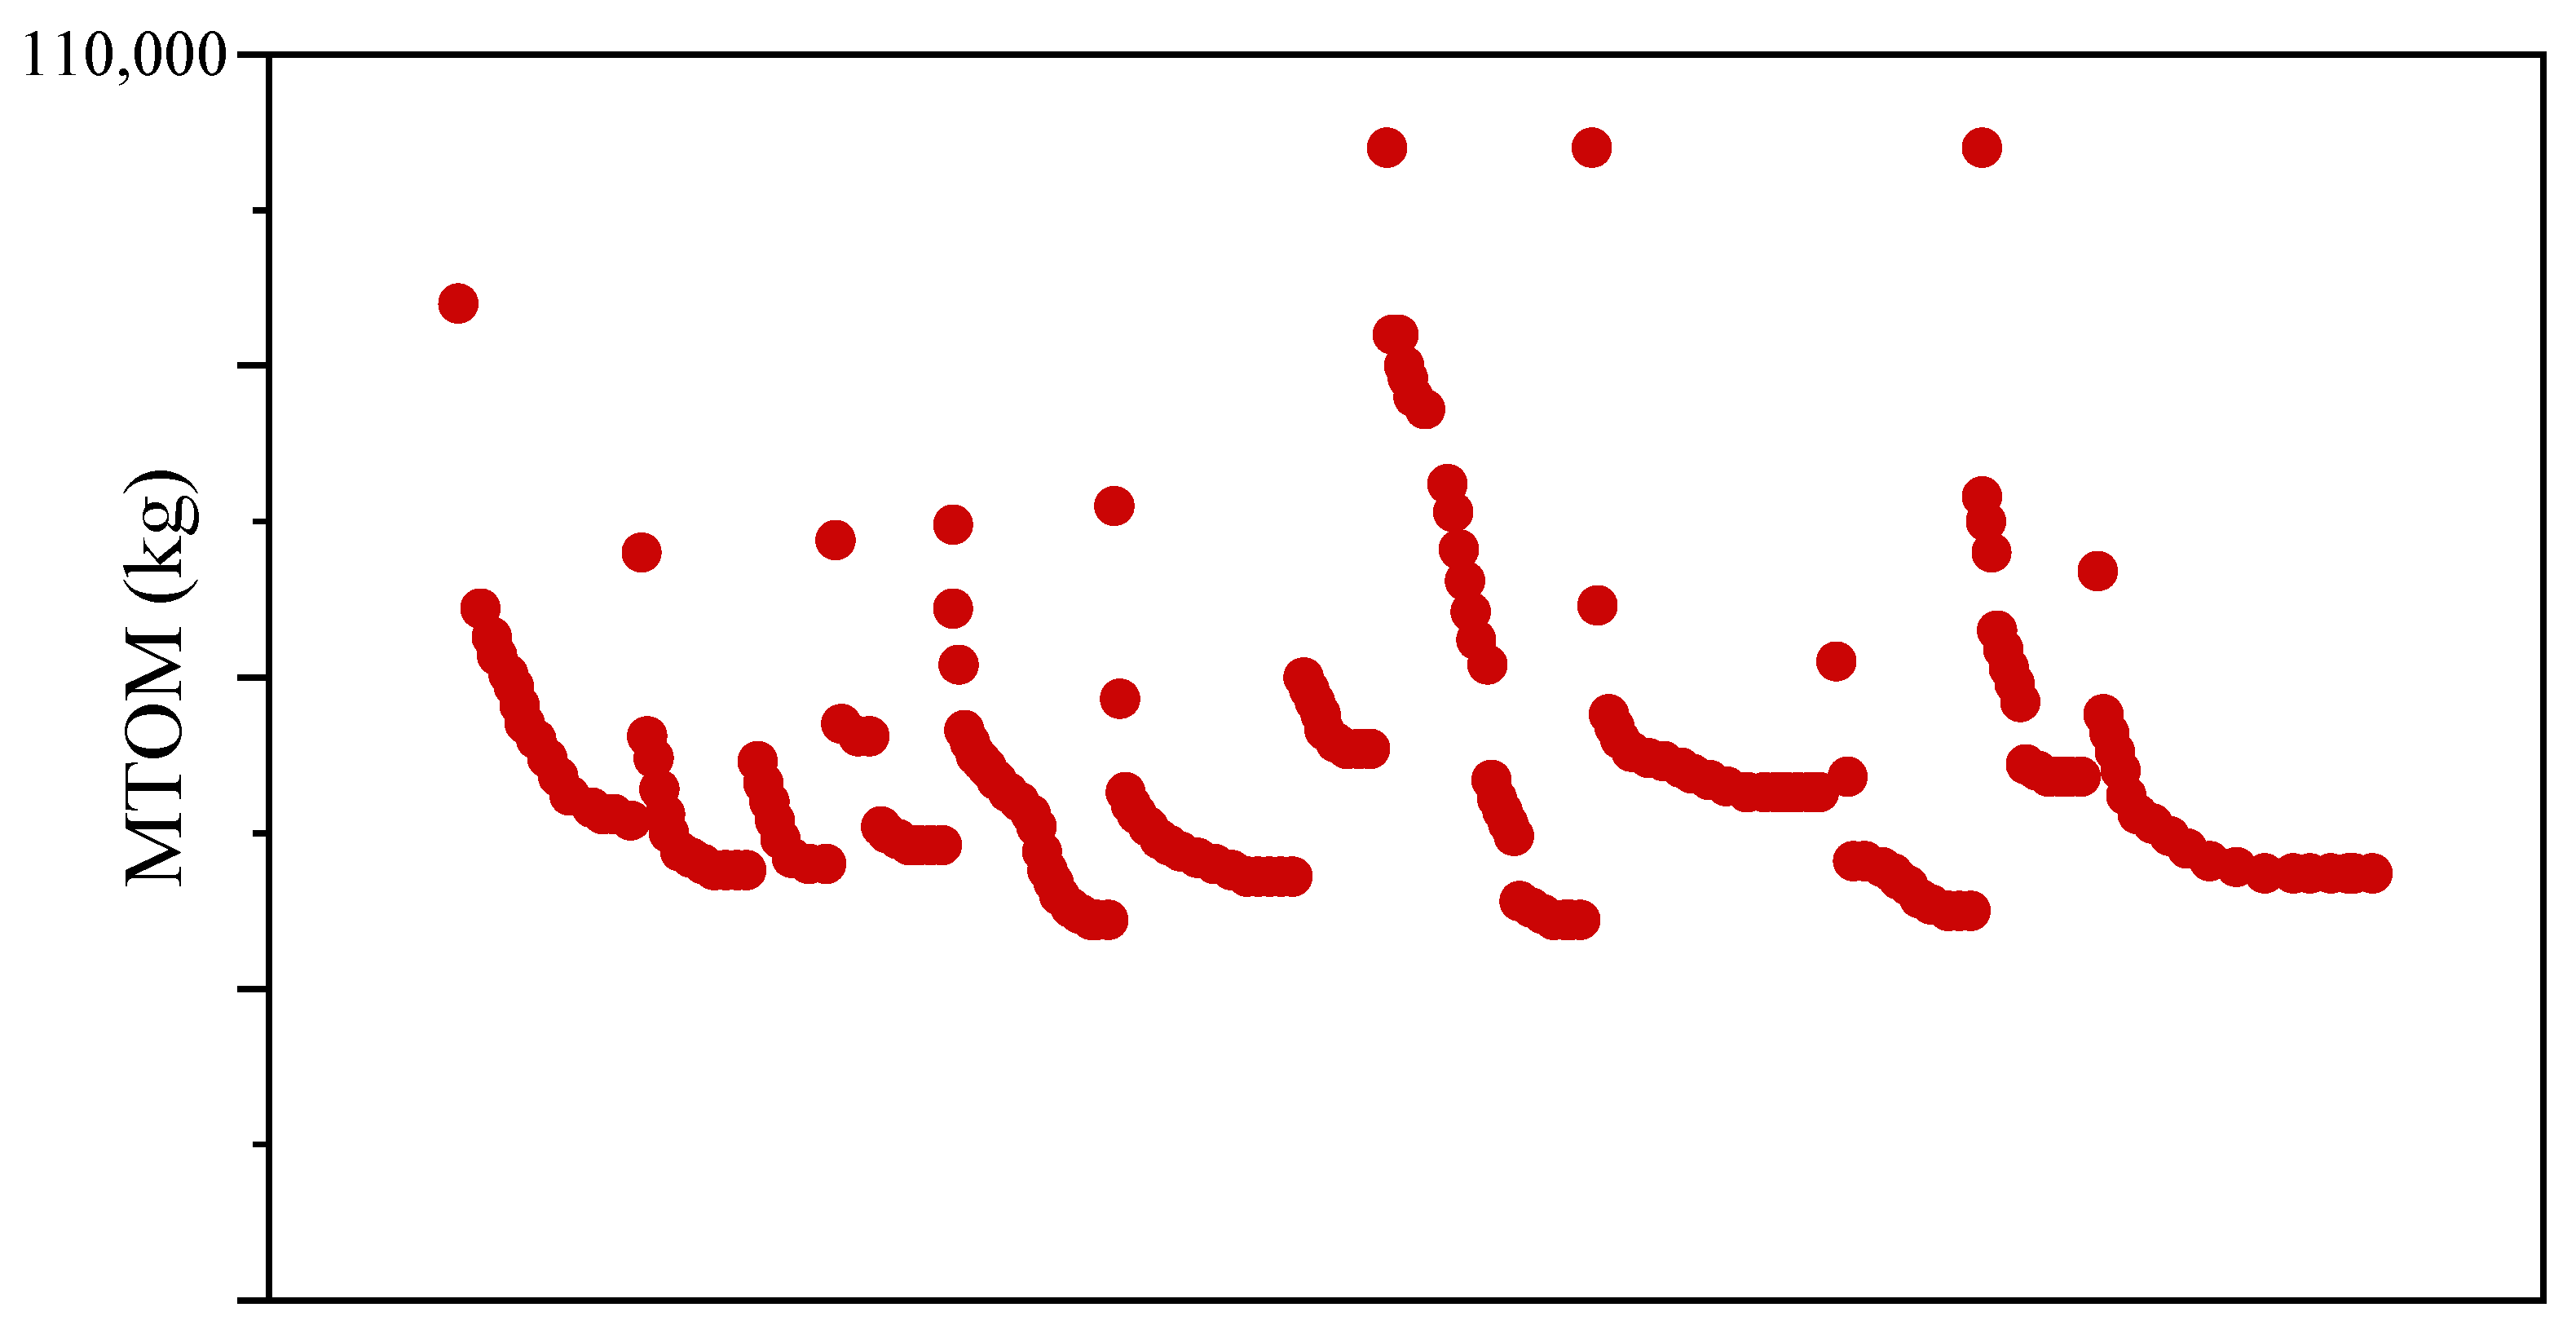
2.3. Mass Calculation
2.4. Profile Performance
2.5. Cost
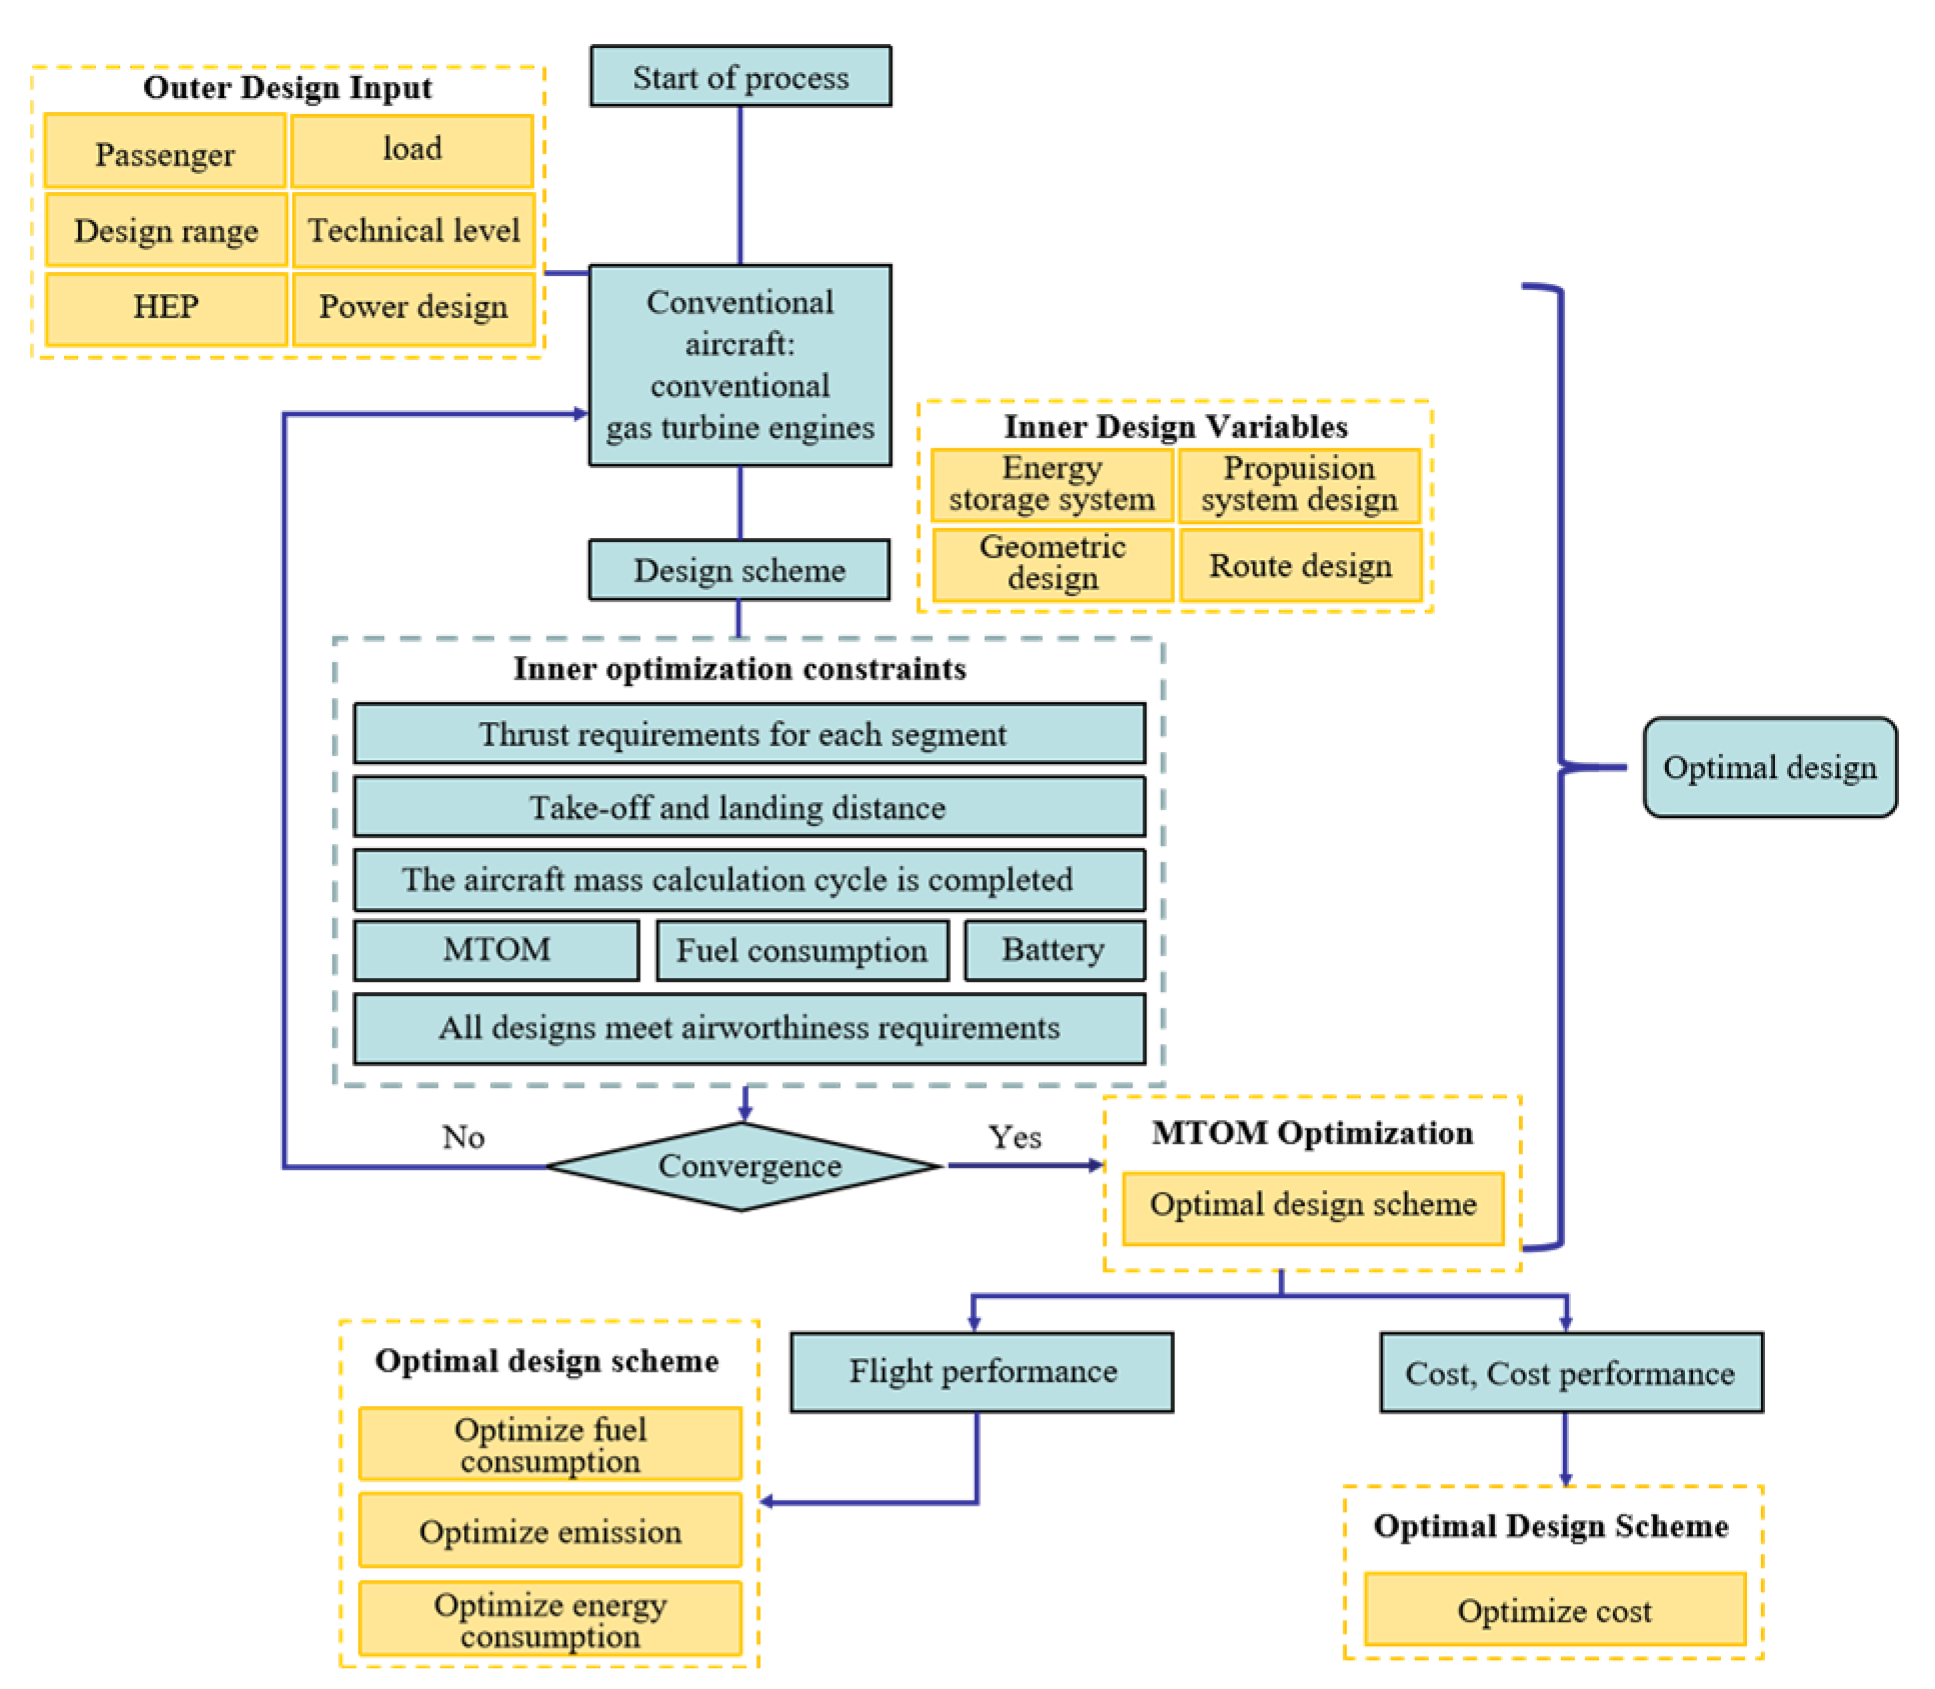
2.6. Optimization
2.7. Validation
3. Hybrid Electric Scheme
3.1. Key Technologies and Comparison Benchmark
3.2. Propulsion Schemes
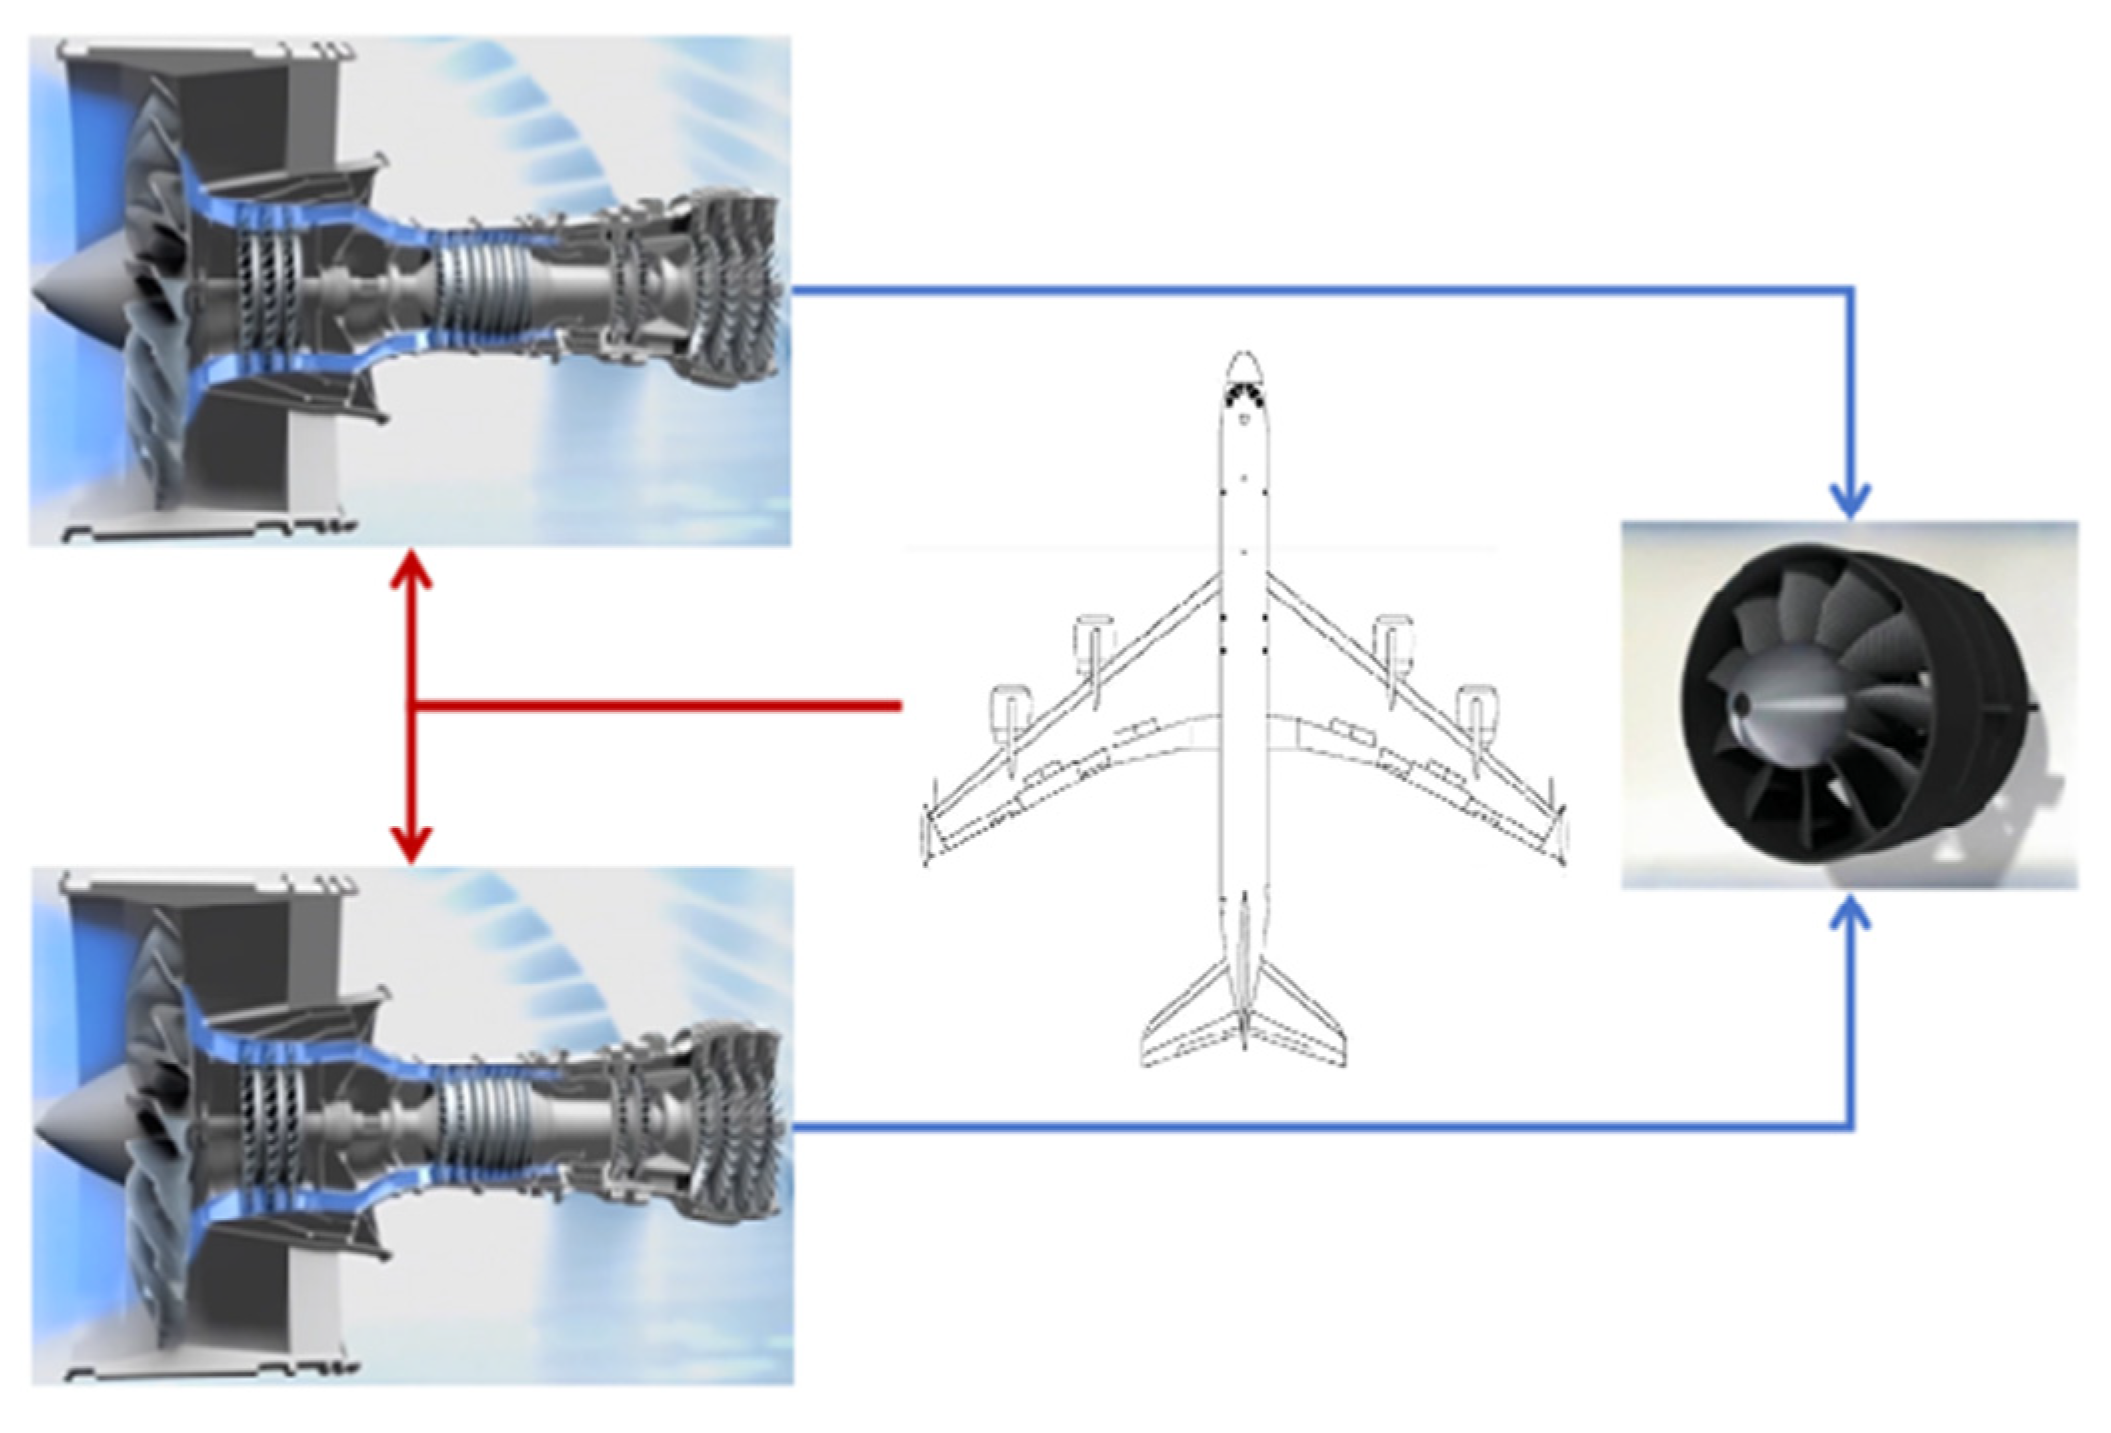
3.2.1. Series Hybrid Electric Powertrain
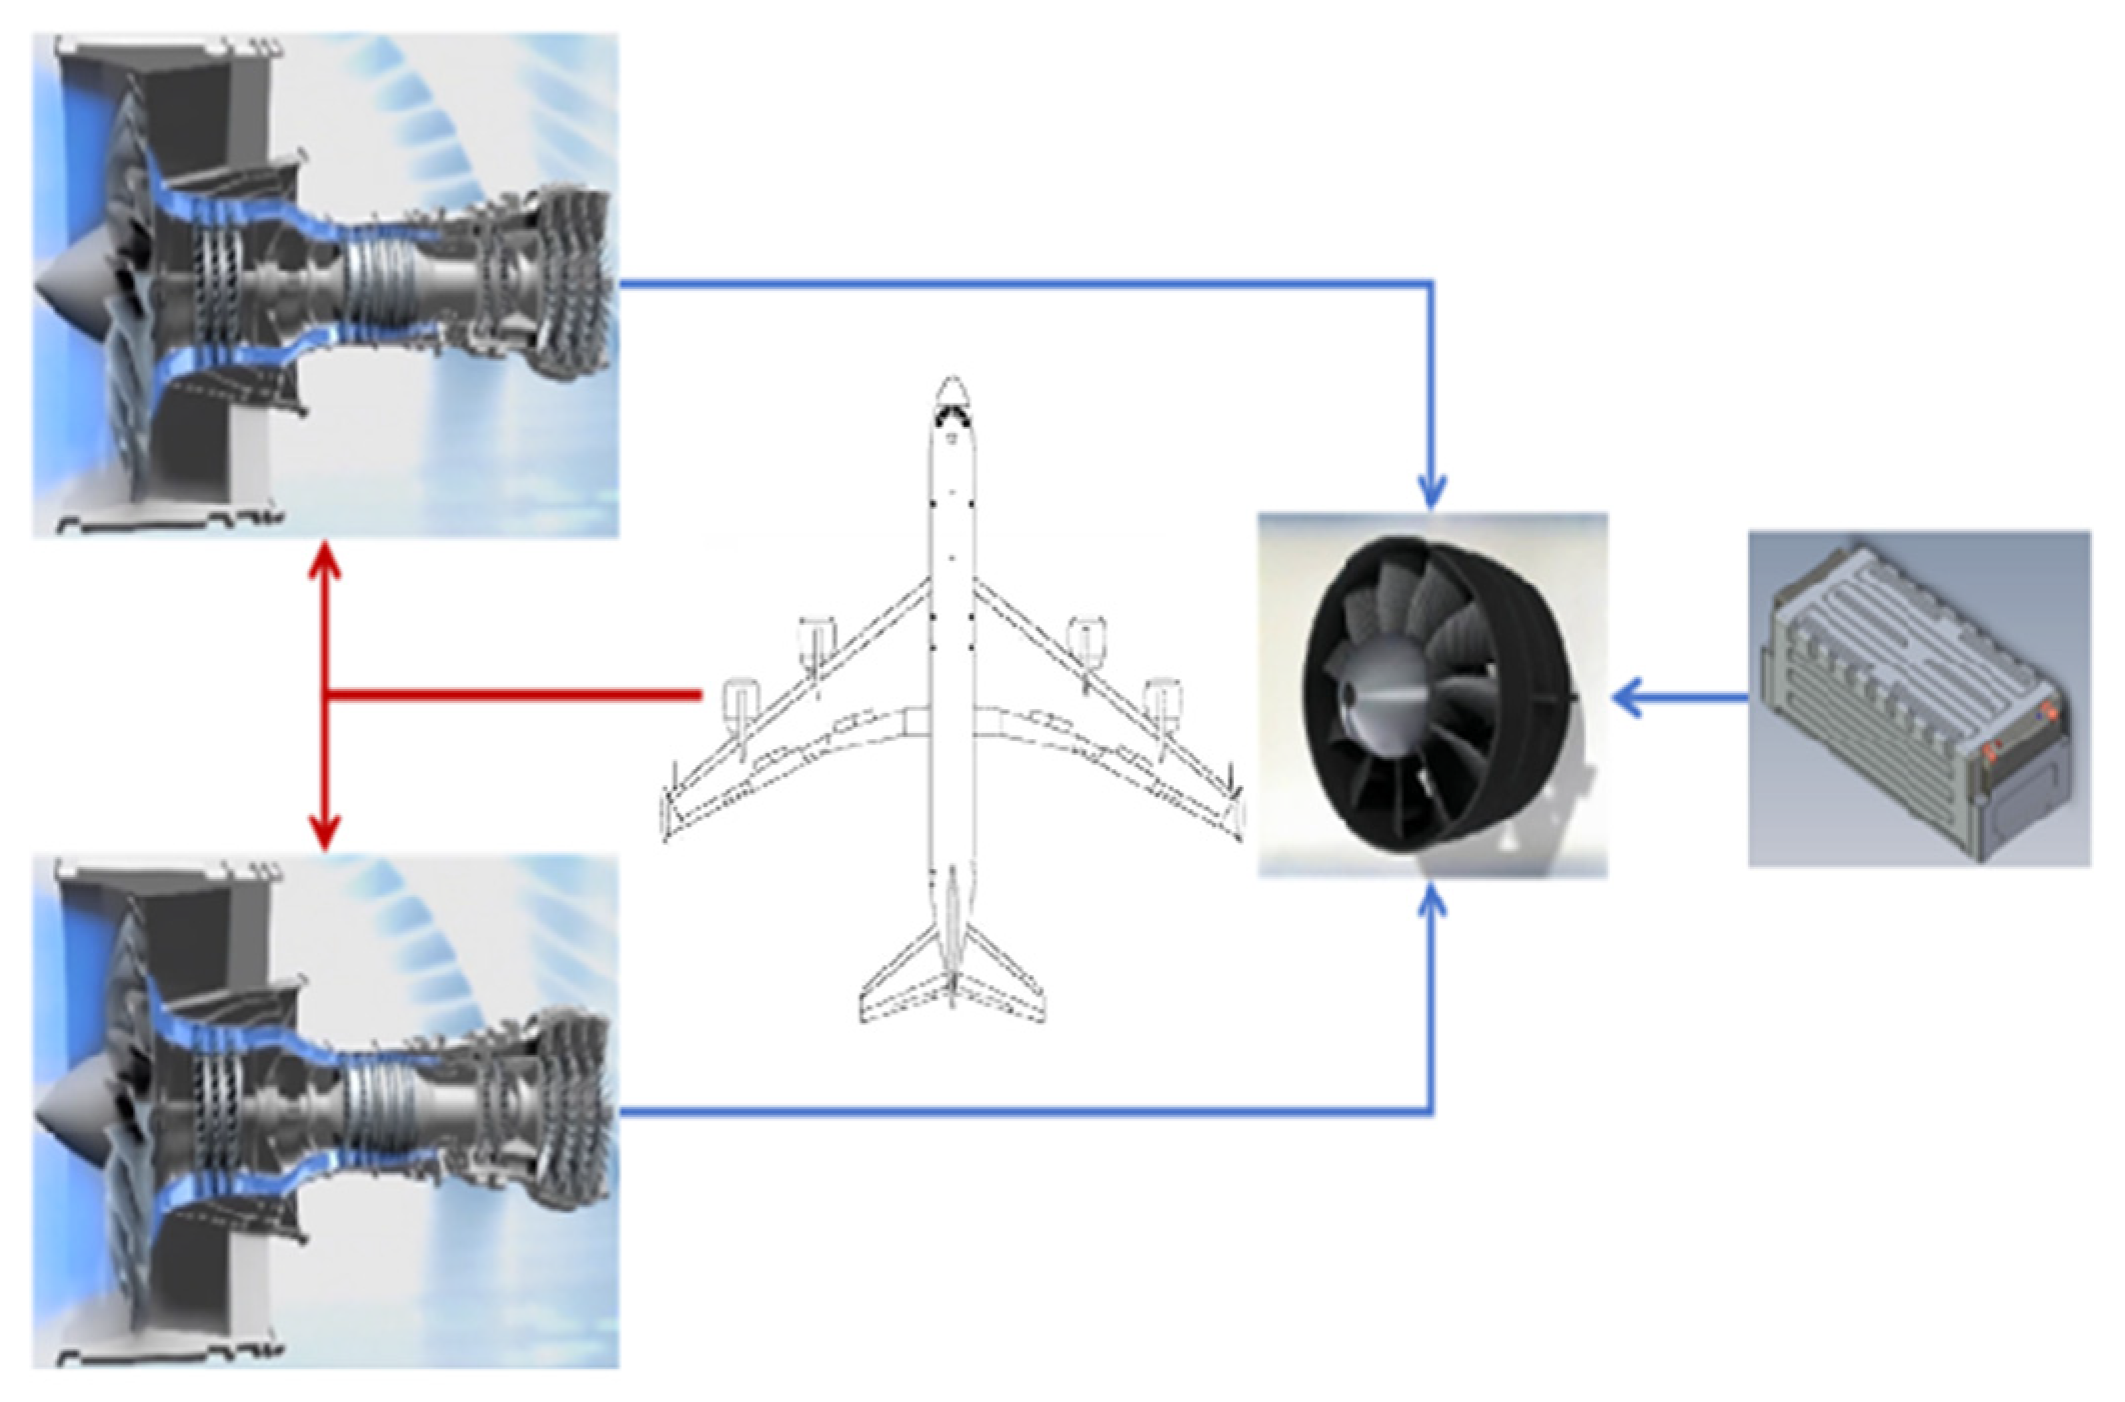
3.2.2. Parallel Hybrid Electric Powertrain
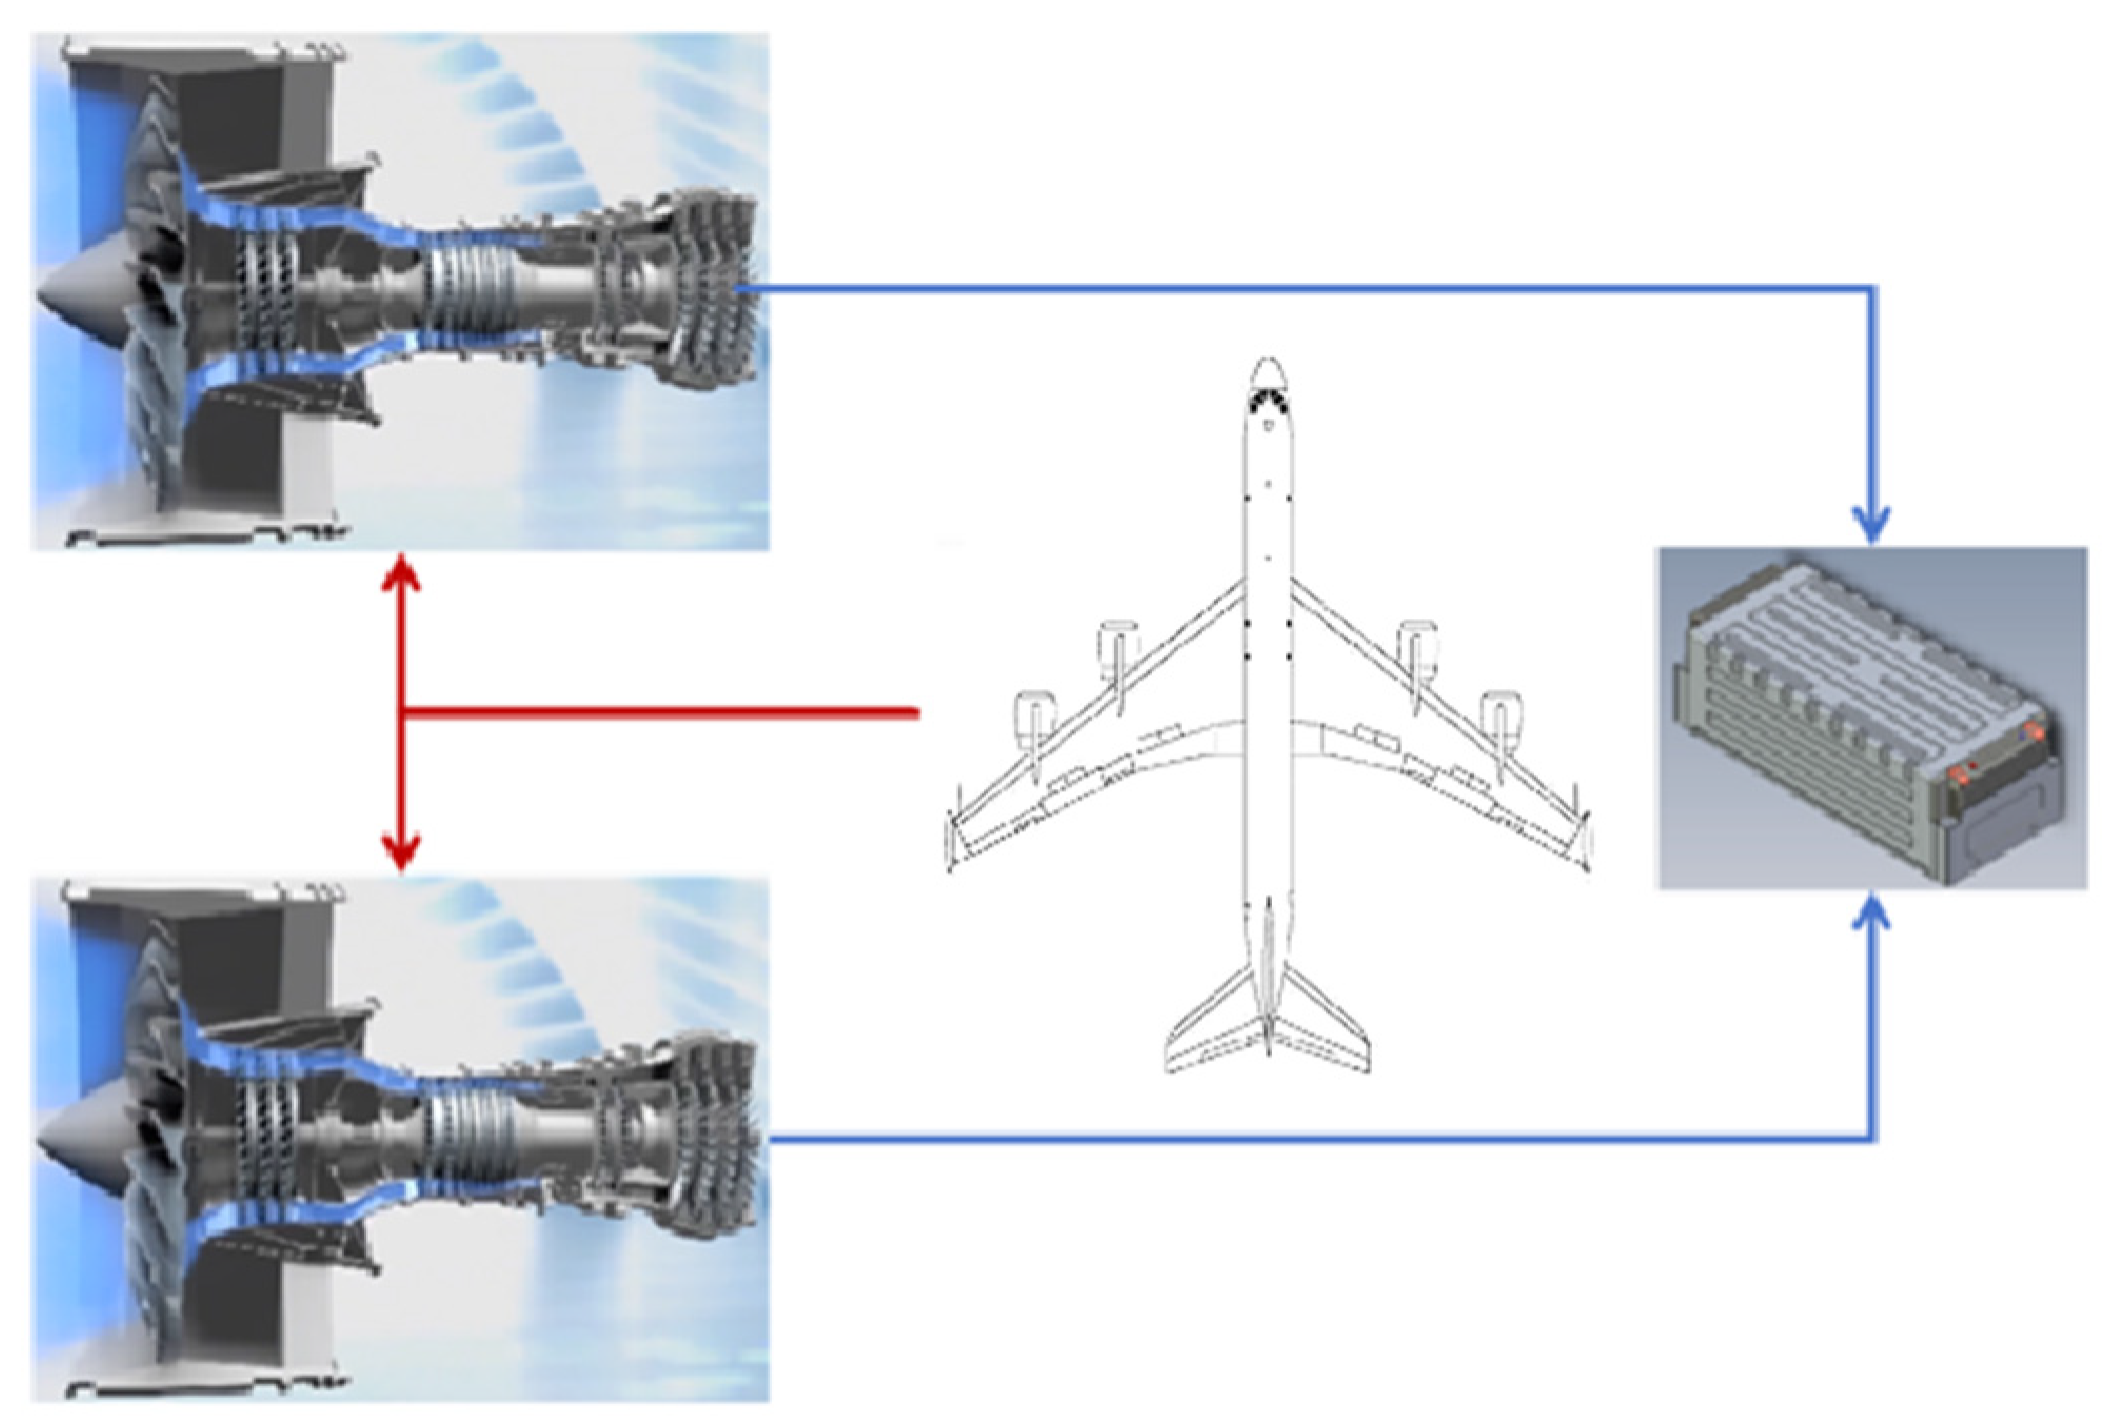
3.2.3. Series–Parallel Hybrid Electric Powertrain
3.3. Propulsion Evaluation
3.3.1. Performance Evaluation
3.3.2. Propulsion Mass Evaluation
3.4. Energy Storage
3.5. Profile Performance Evaluation
4. Results and Discussion
4.1. Power Hybridization
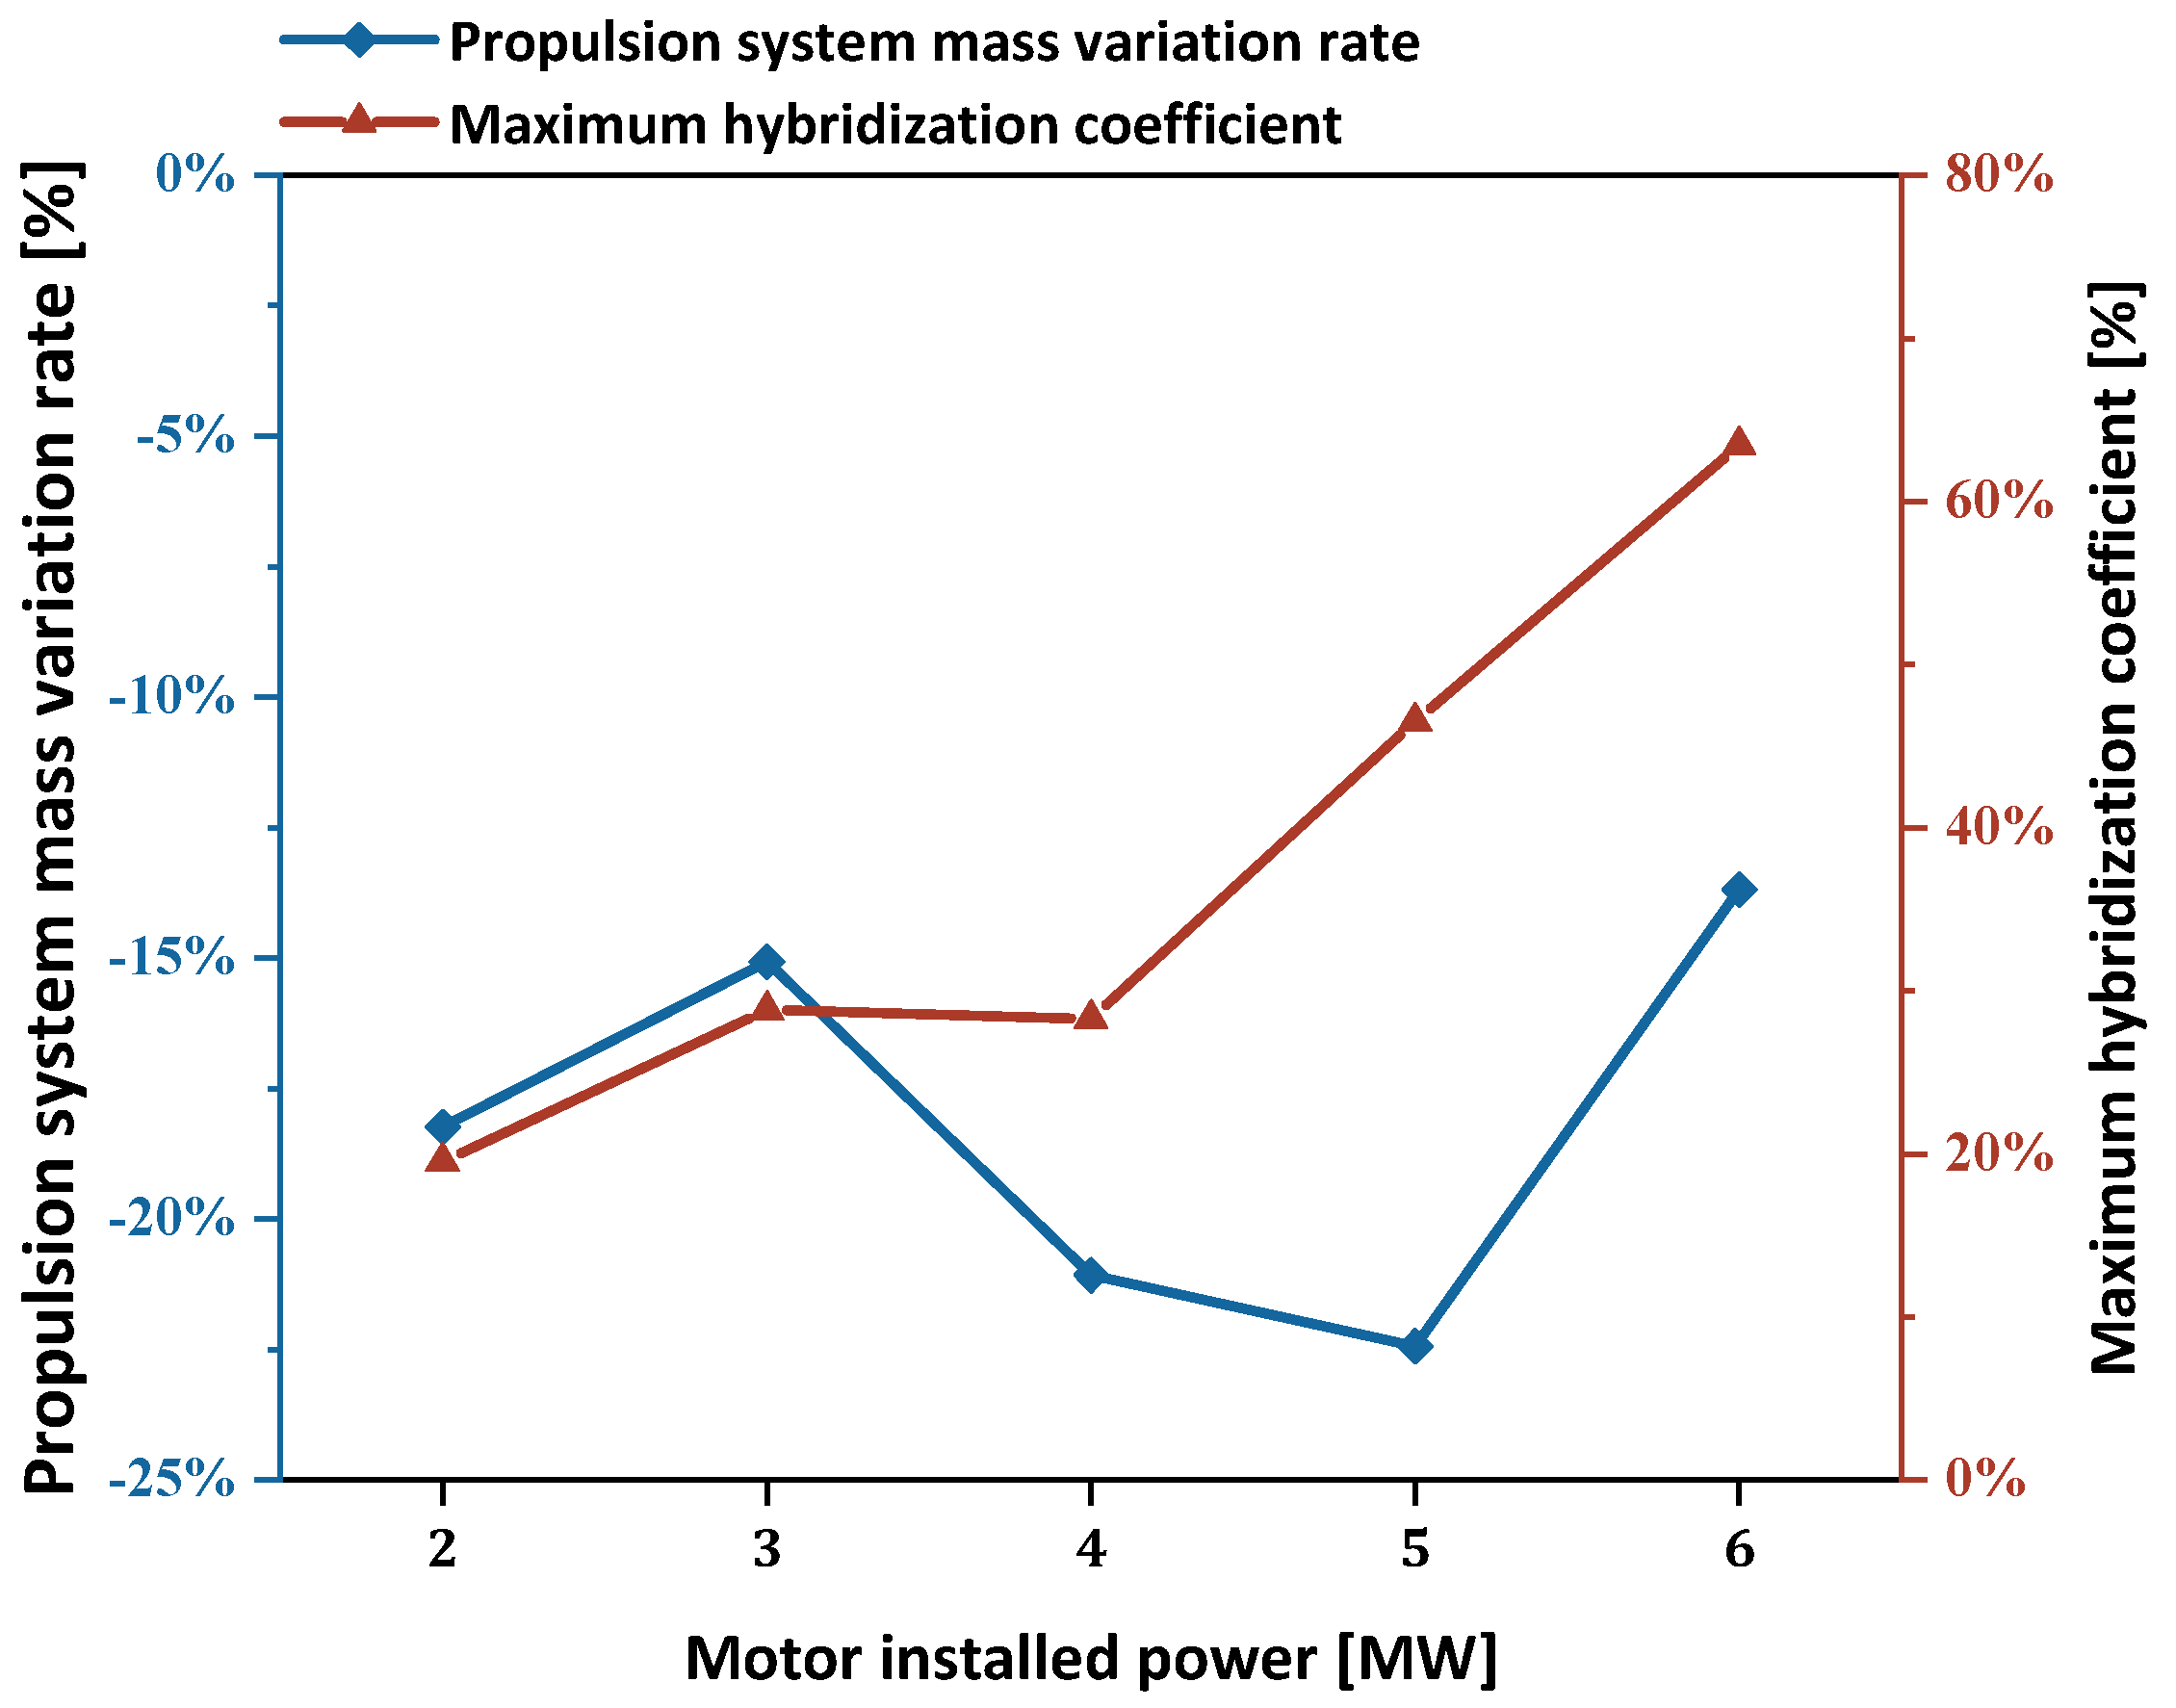
4.2. Installed Power
4.3. Specific Power of Electric System Components
5. Conclusions
- (1)
- Hybrid Electric Integrated Aircraft Design Methodology: A comprehensive performance model for hybrid aircraft was established, which includes sub-models for mission requirements, power systems, mass allocation, flight performance, and cost estimation. A hybrid electric aircraft design platform based on the integrated aircraft propulsion technology was developed using these models.
- (2)
- Model Validation: The validation of the hybrid electric aircraft performance model and the hybrid propulsion system performance calculations shows that the hybrid system and aircraft design accuracy meet the required standards. The model’s precision in calculating hybrid engine fuel consumption, thrust, and other performance parameters satisfies the needs of subsequent applications. Furthermore, the performance validation of the hybrid aircraft model demonstrates that the simulation error for aircraft with different power system configurations and key technology levels is minimal, meeting the design requirements for hybrid aircraft flight performance.
- (3)
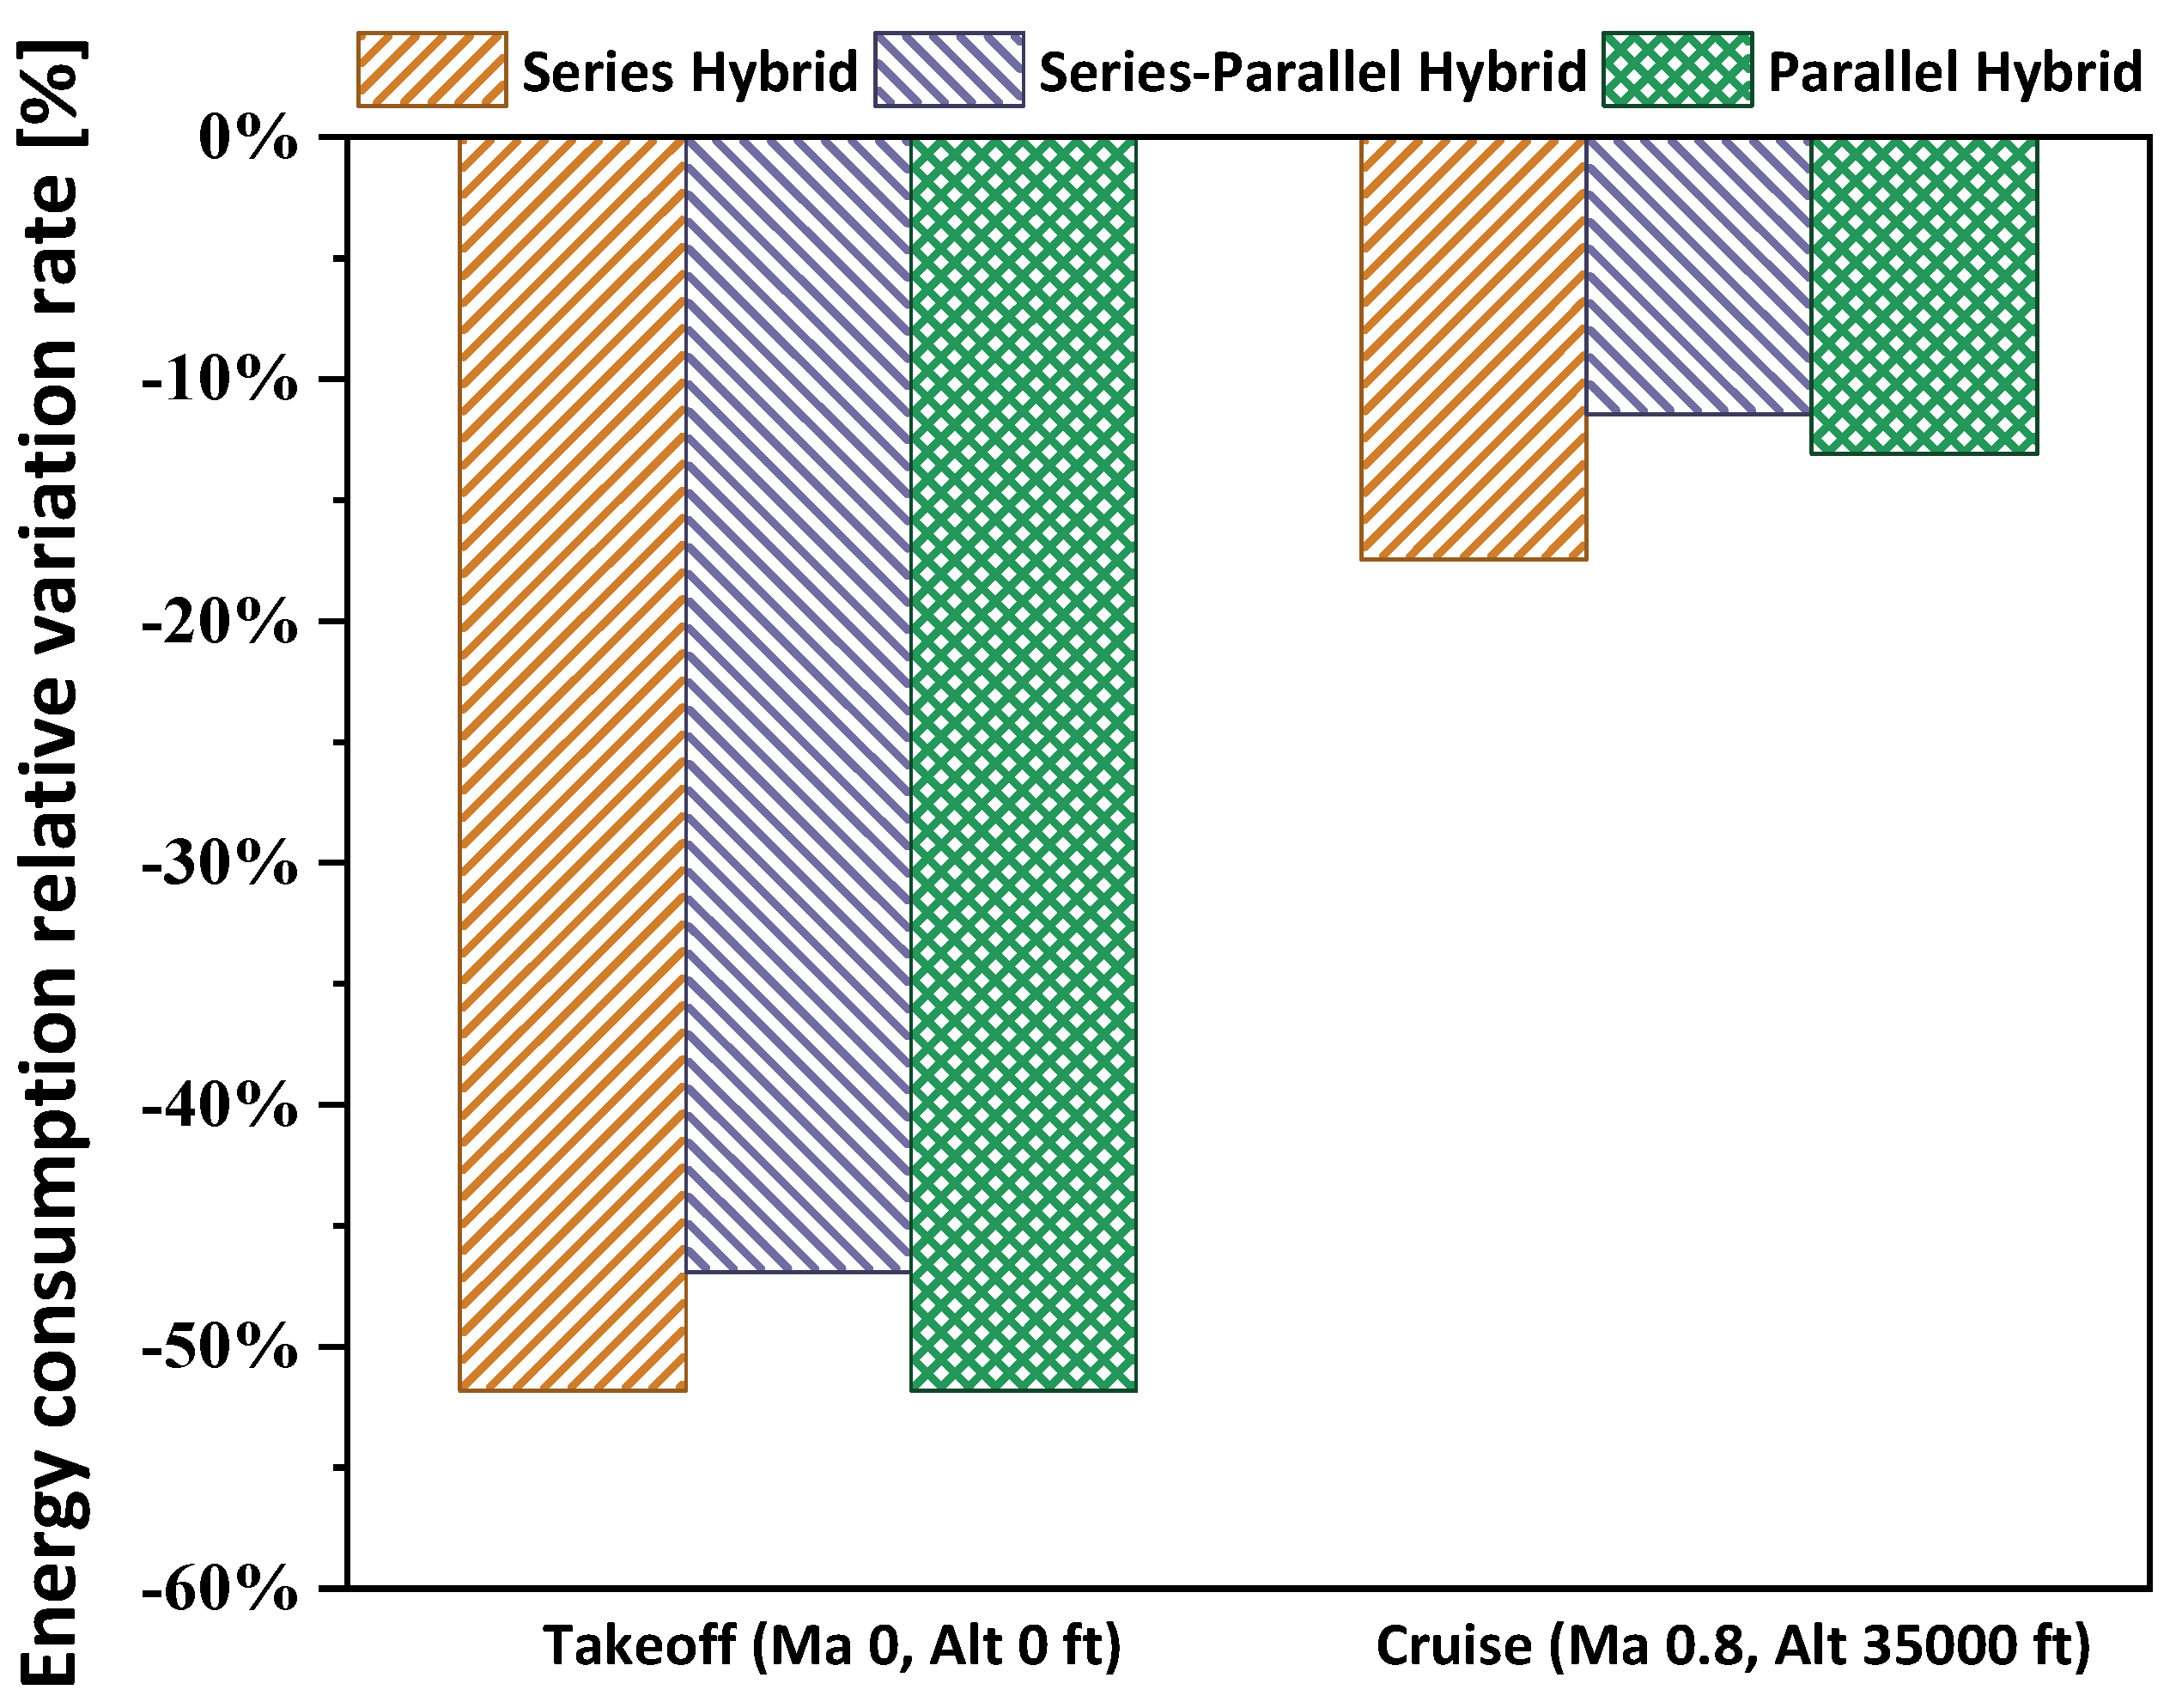
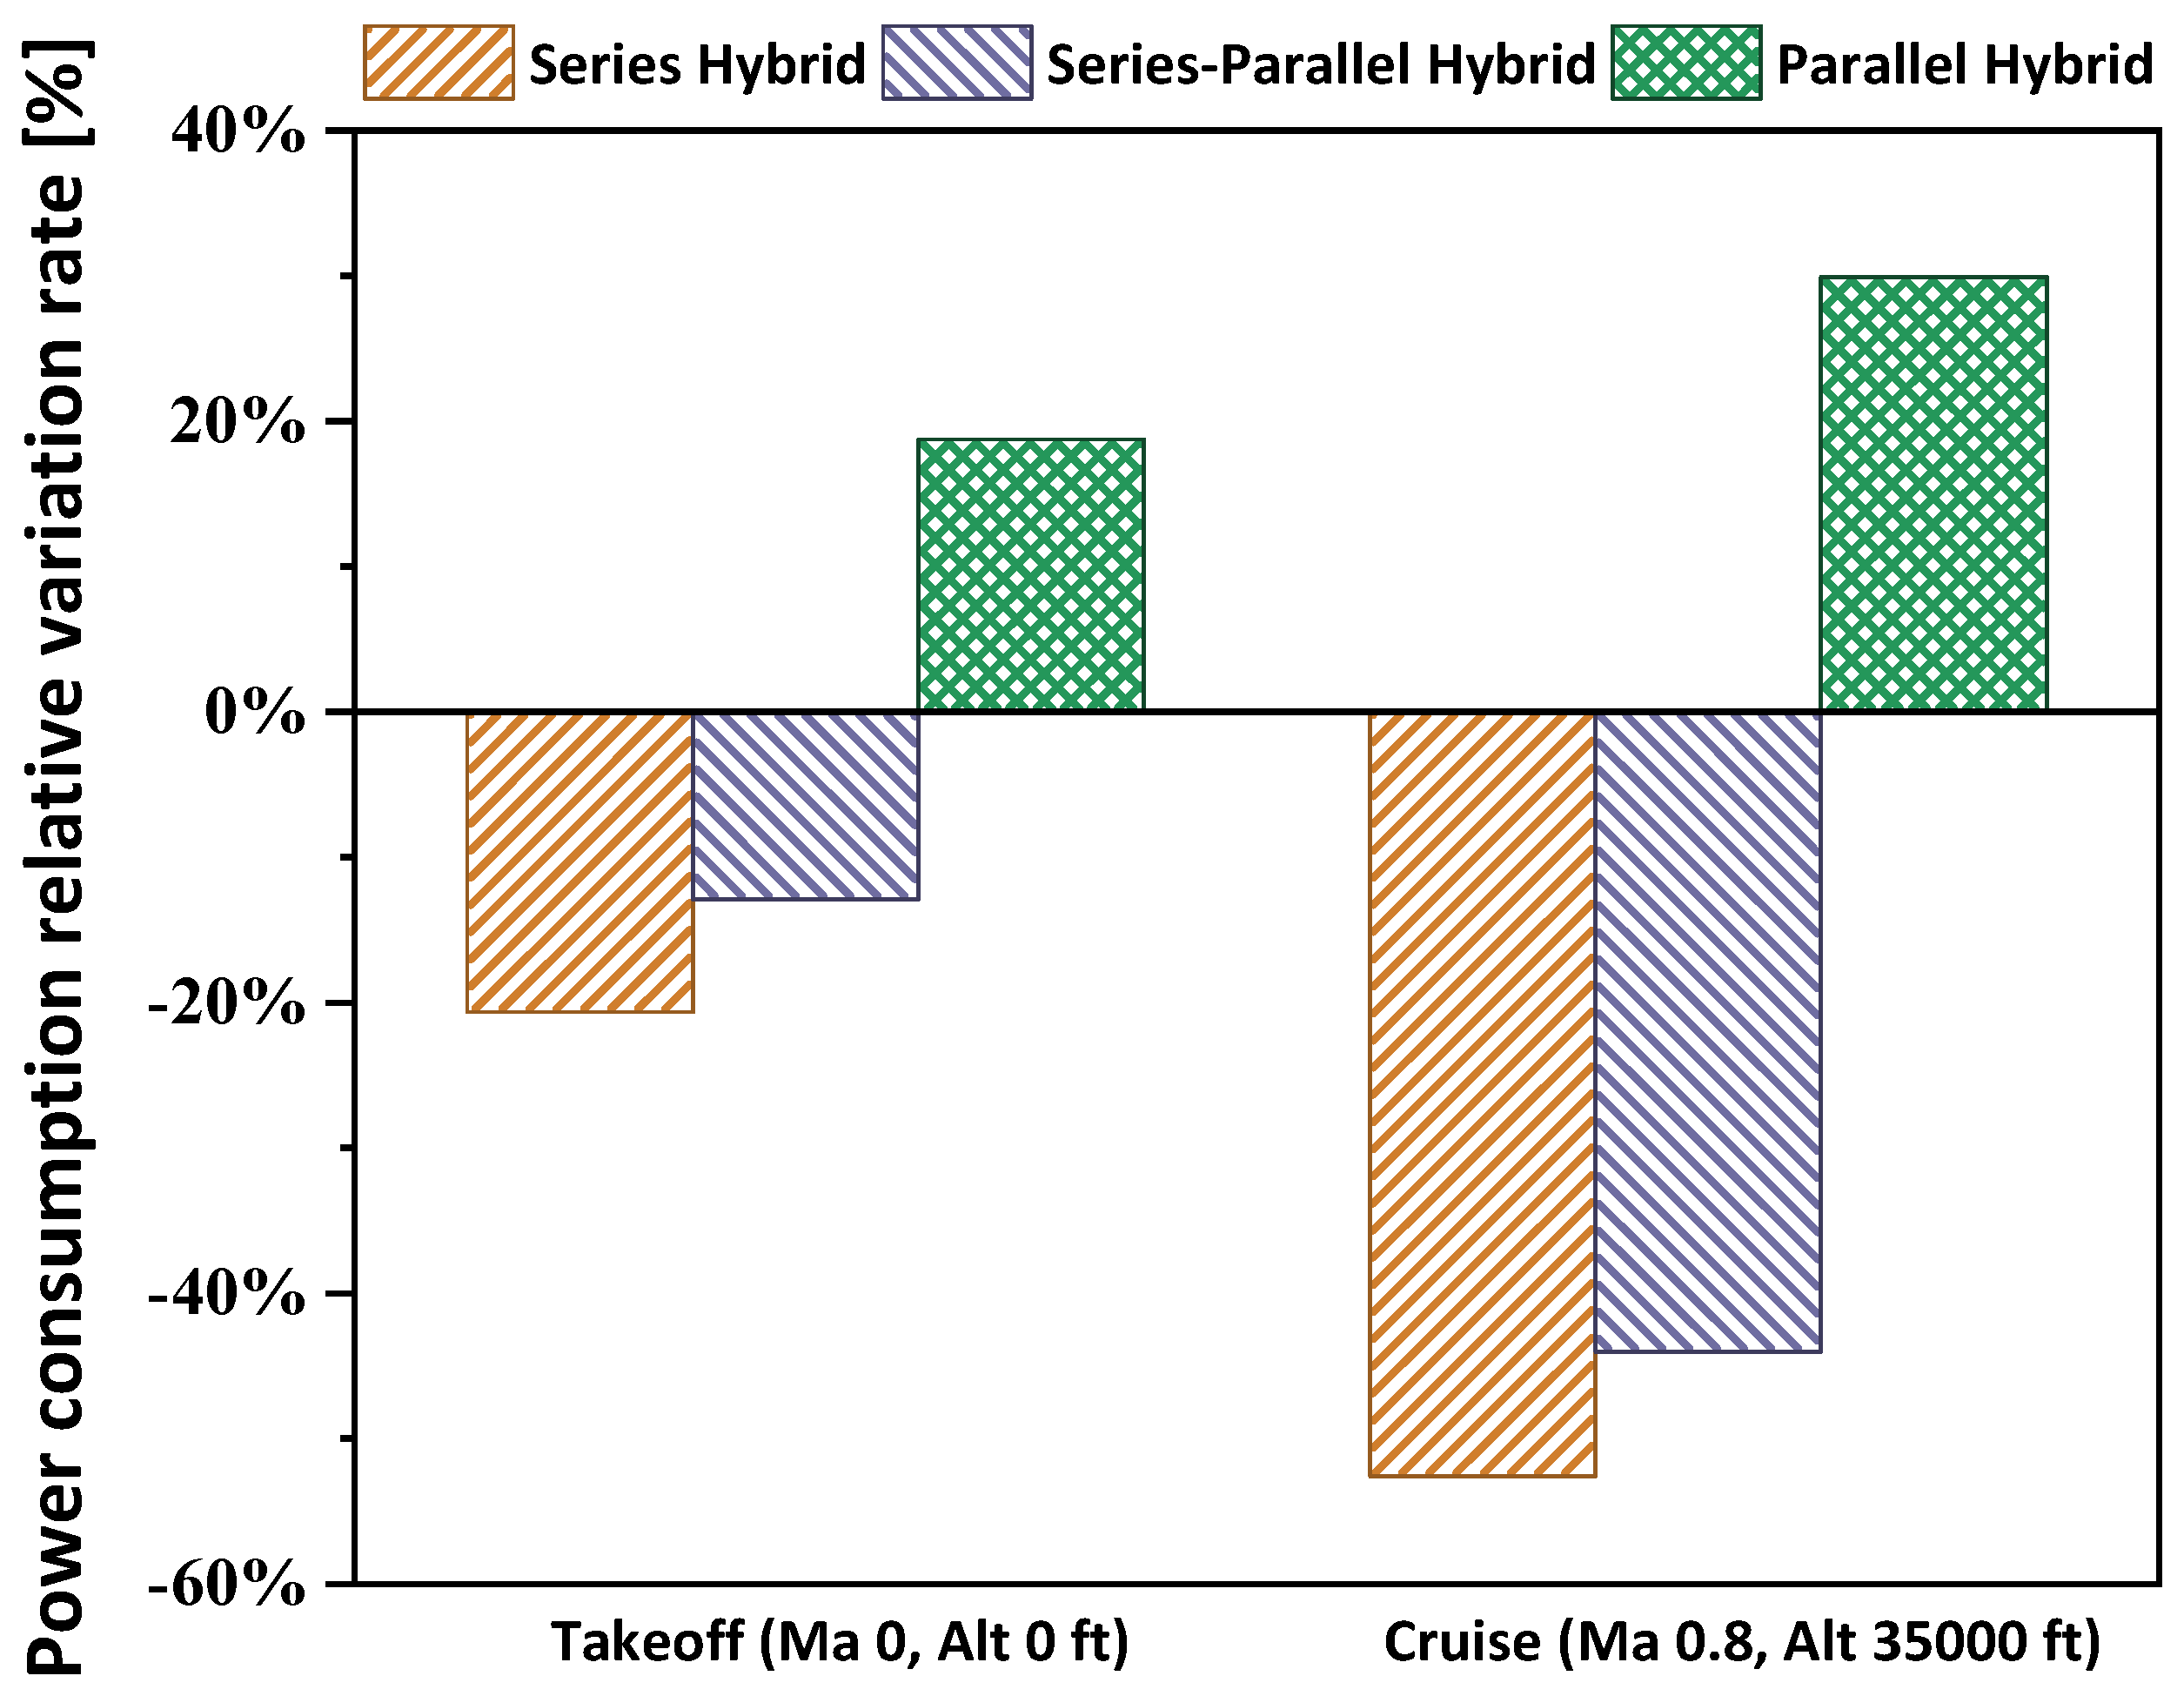
- Comparison of Hybrid Propulsion System Architectures: With the same design constraints, key technologies, and mission profiles, a comparative analysis of three hybrid propulsion system architectures reveals that the battery-equipped architecture offers weight reduction and overall energy-saving advantages. However, due to the low current energy density of batteries, it cannot alleviate fuel consumption pressures, leading to significant penalties in aircraft mass and energy consumption. The turbine–electric hybrid architecture, on the other hand, improves system efficiency and reduces fuel consumption without imposing additional burdens from the energy storage system. It is more feasible under current technology levels and could become a key focus for future application research.
- (4)
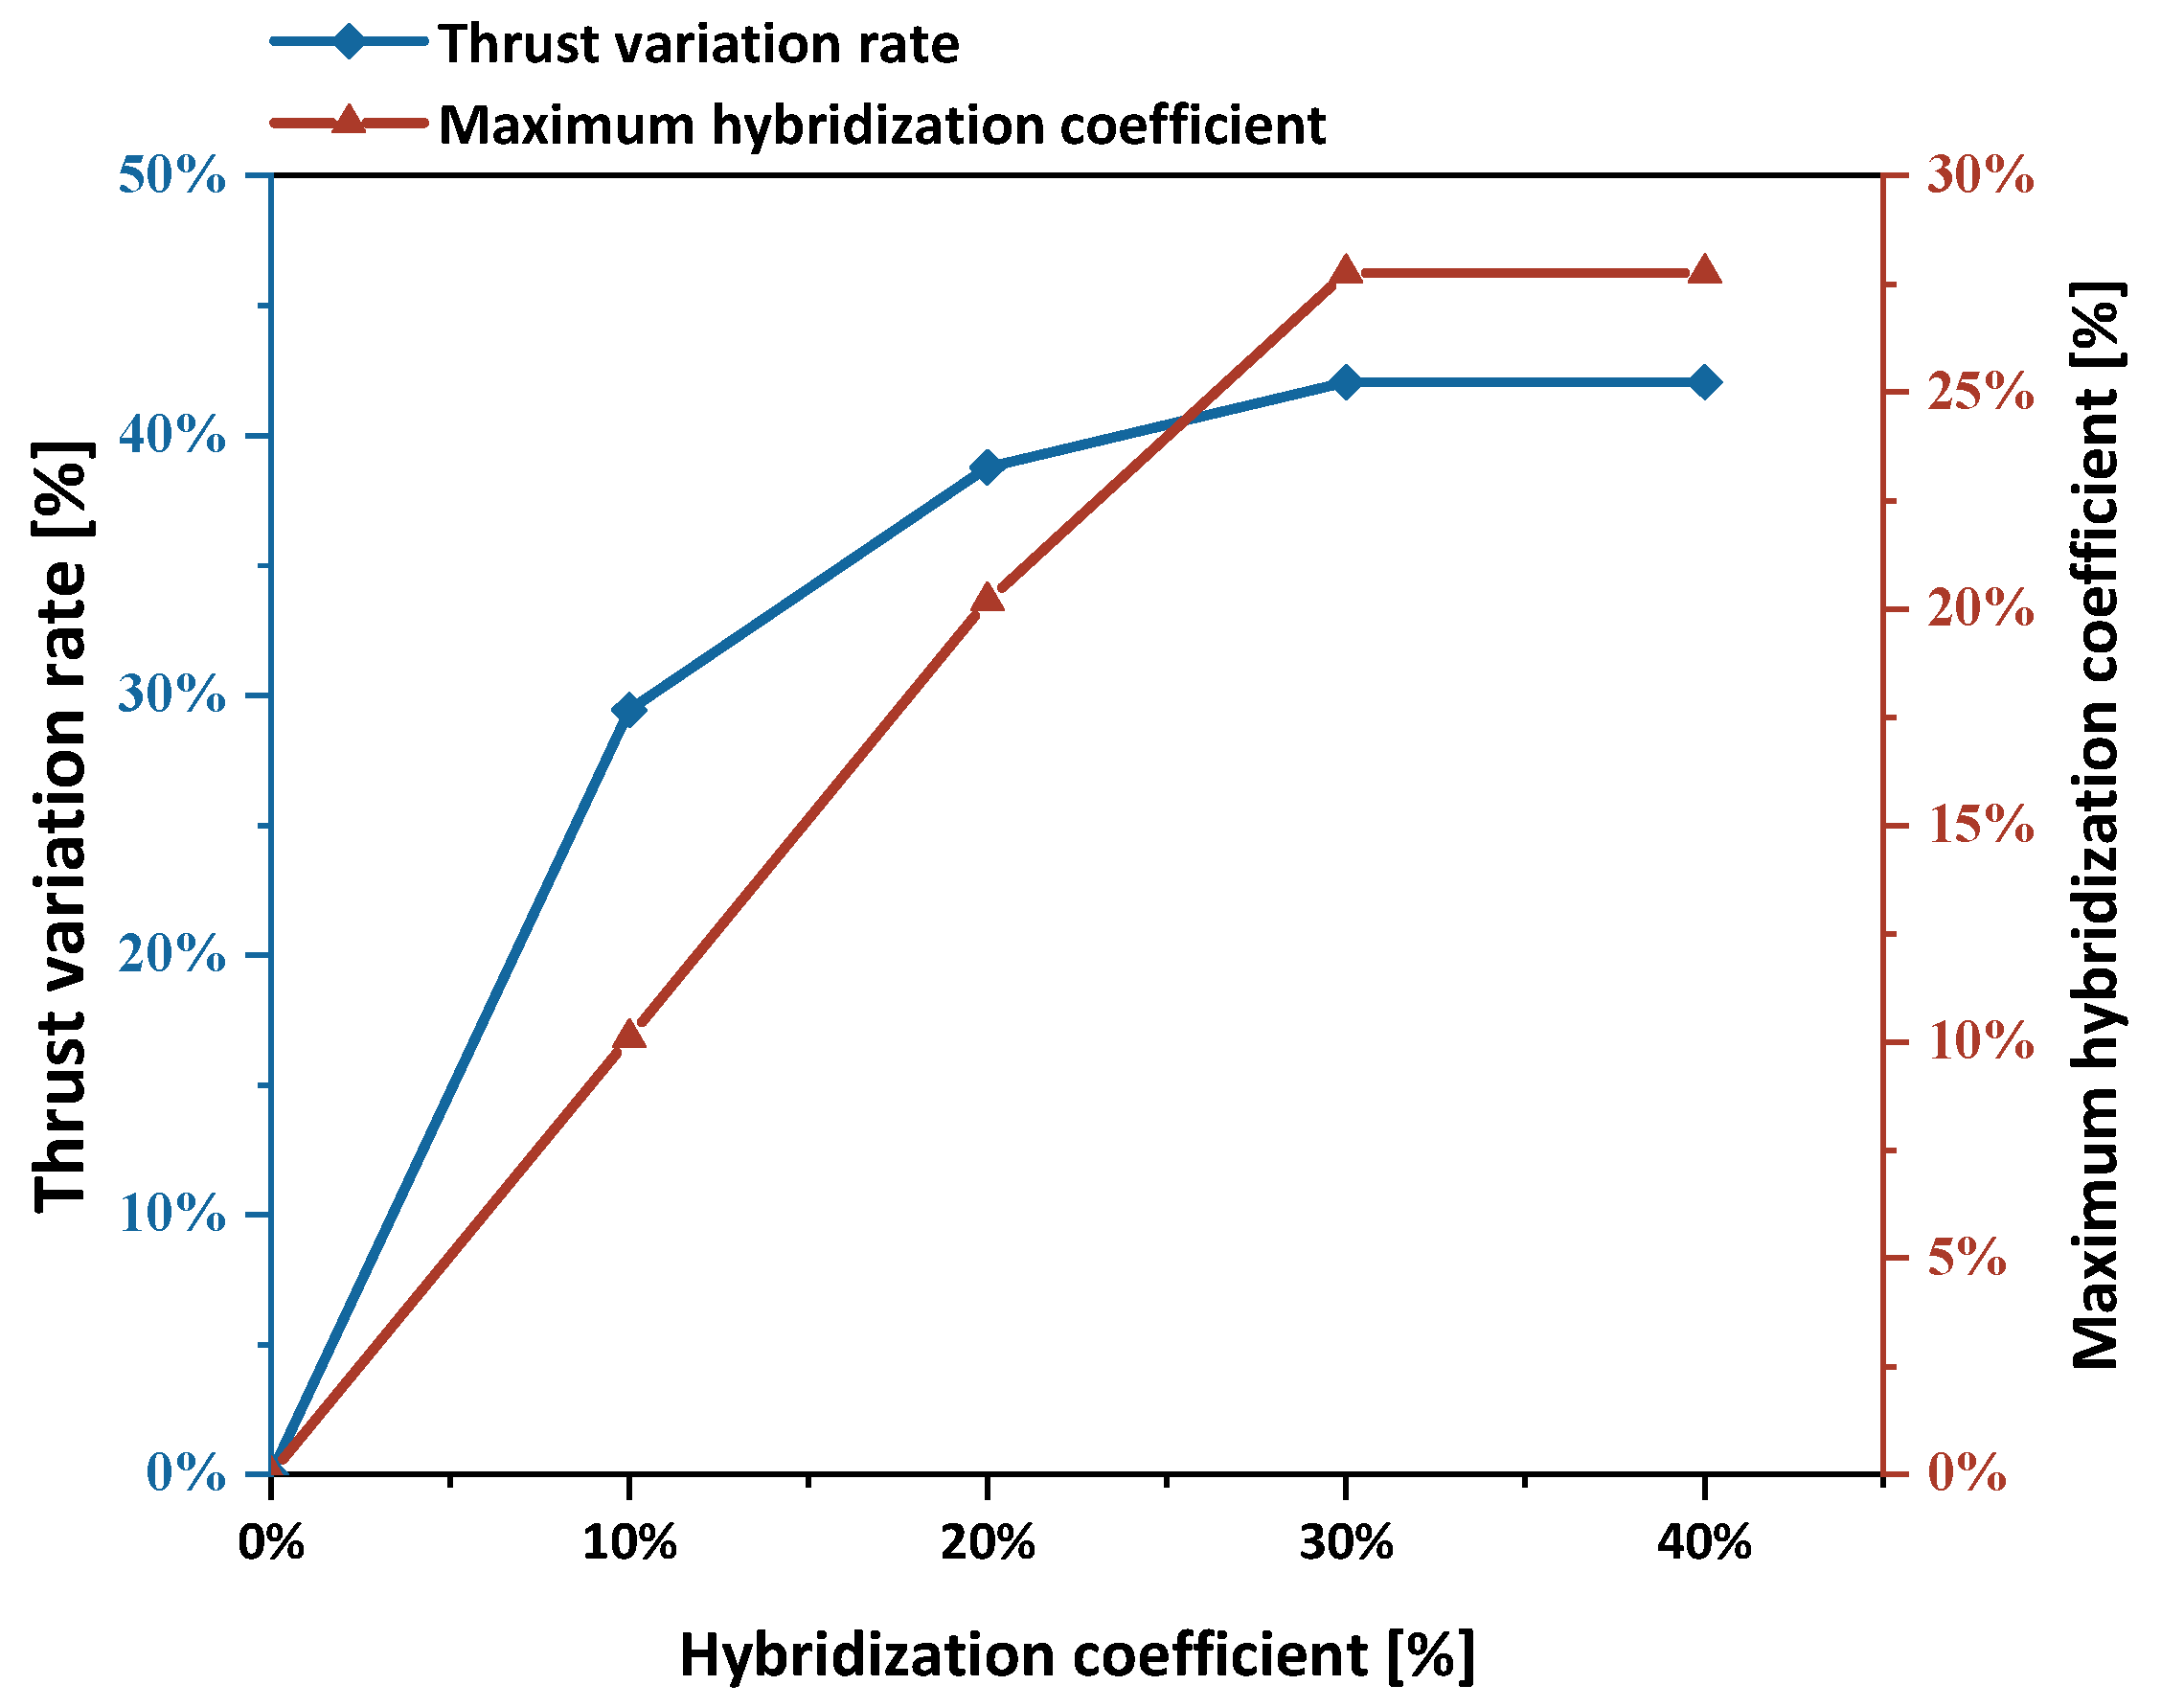
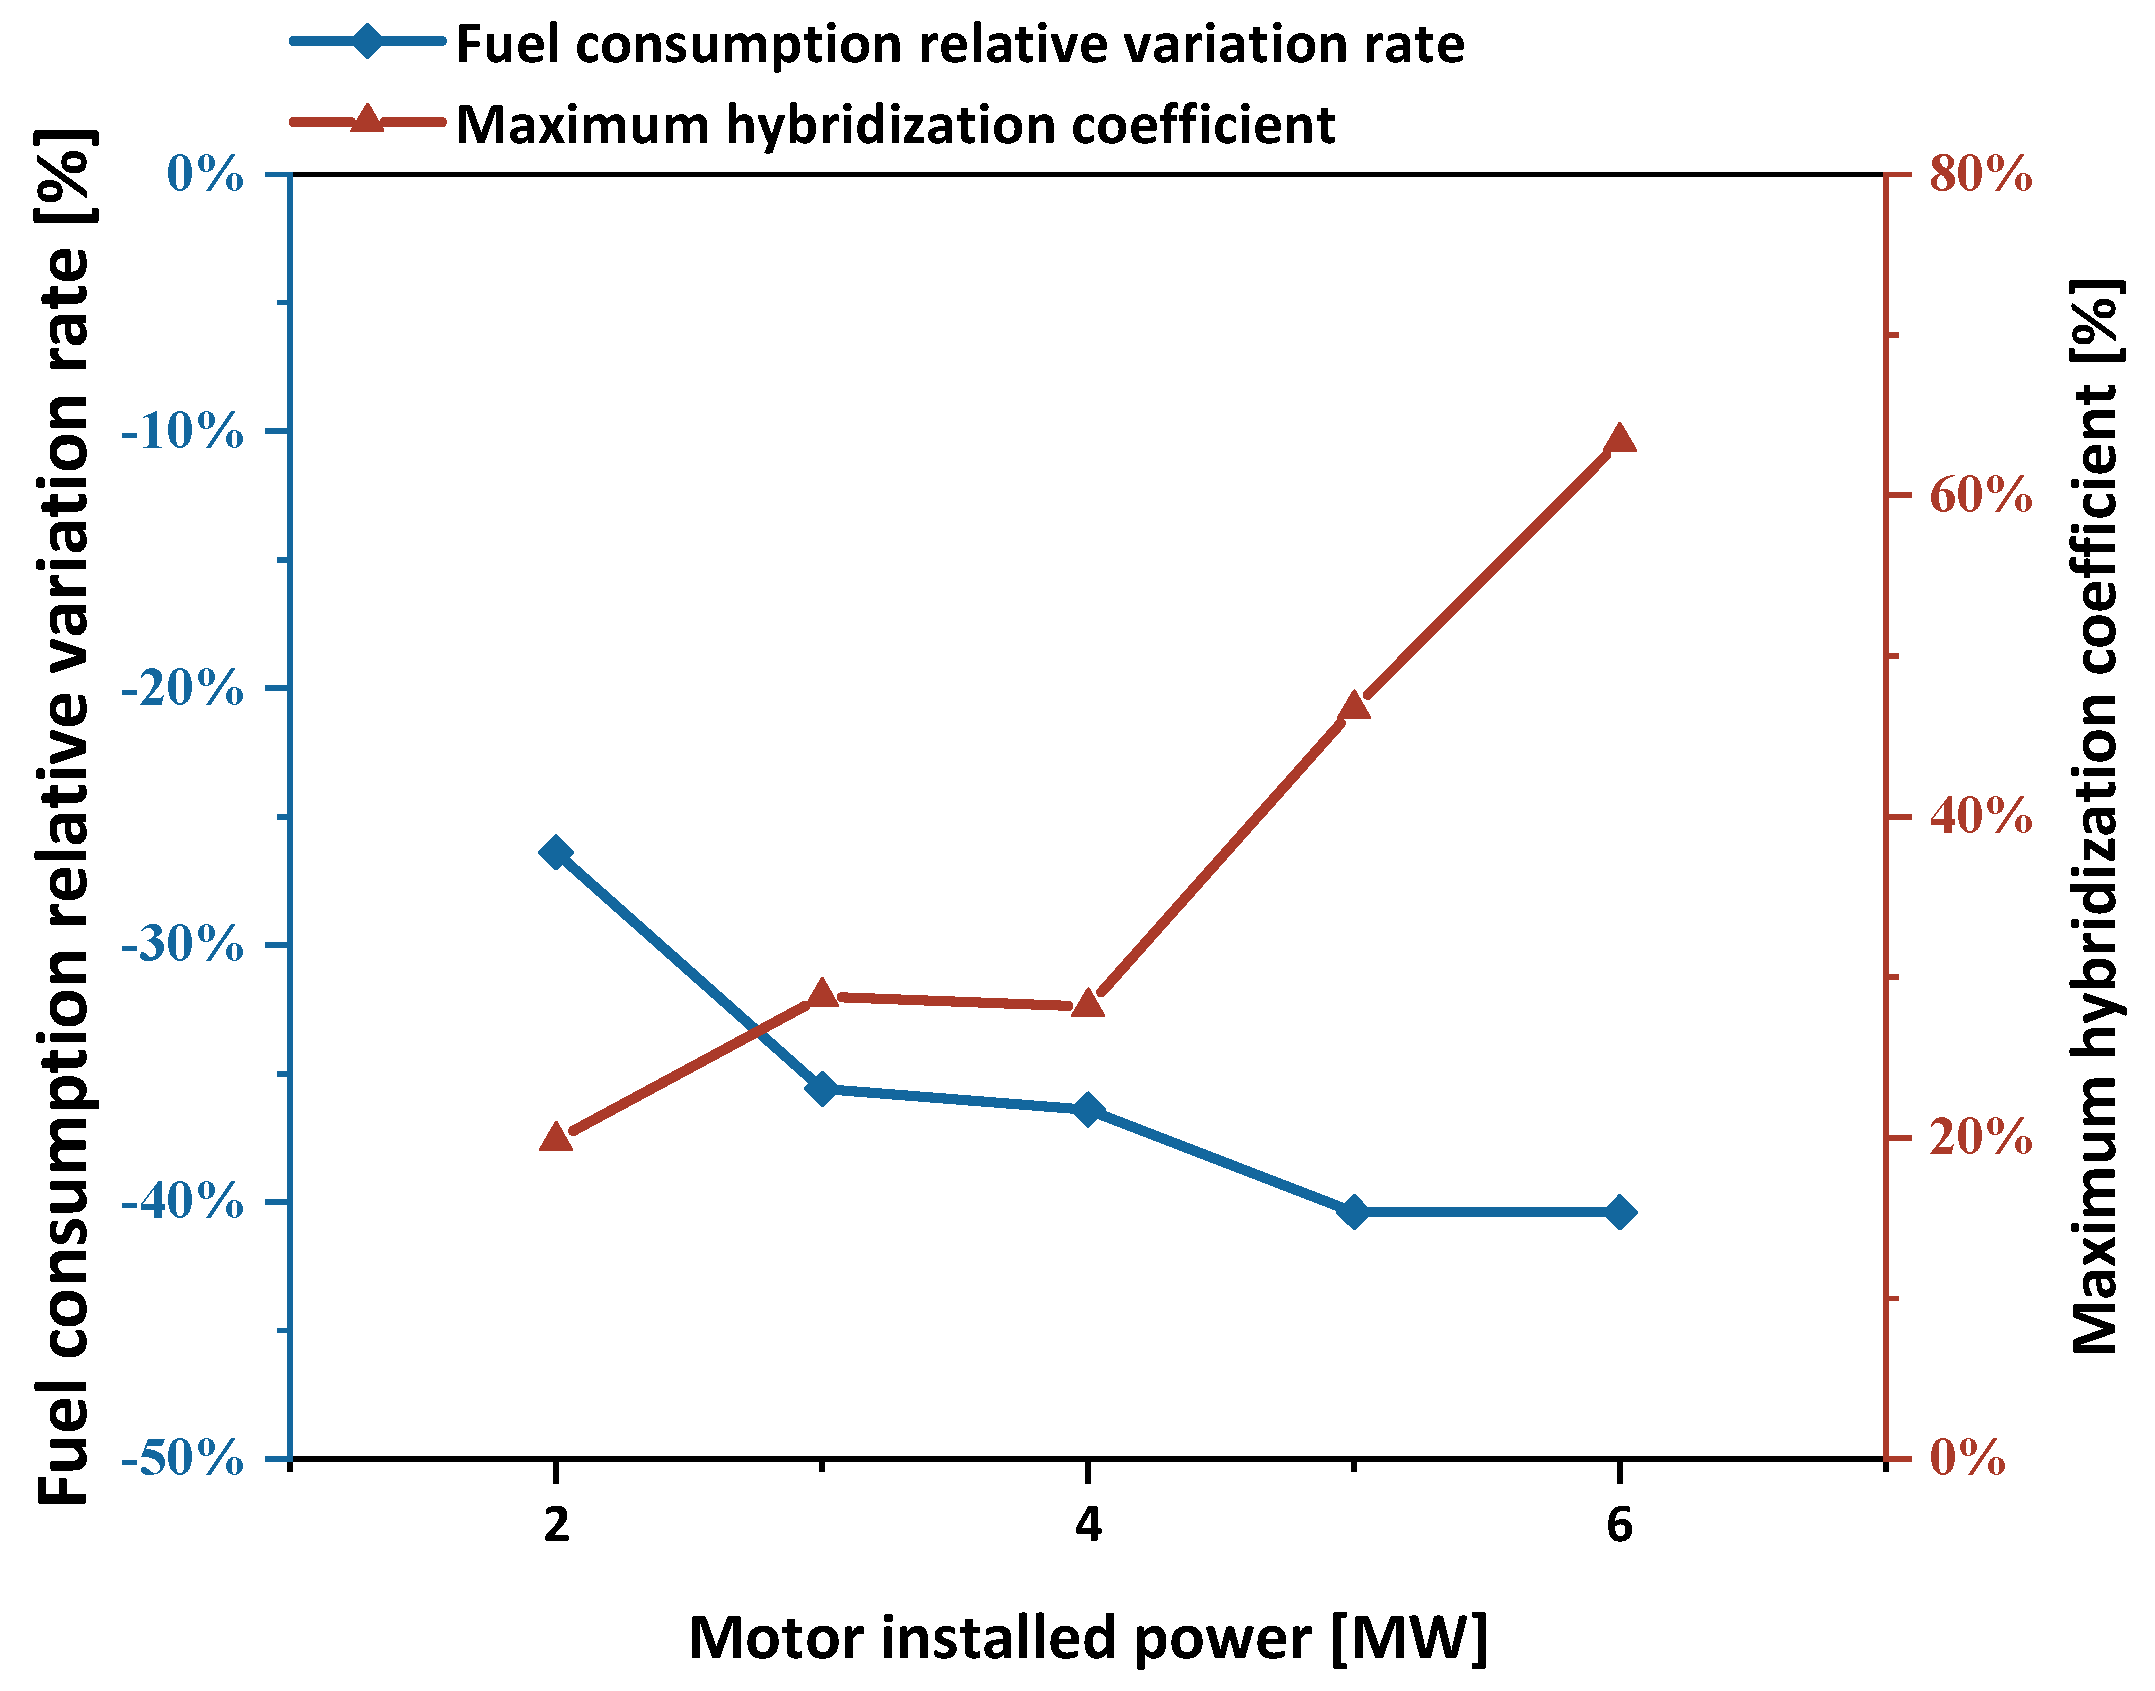
- Performance Sensitivity Analysis: Based on the design model, the turbine–electric hybrid architecture was selected for further analysis. Sensitivity analyses of power hybridization factors, motor power rating, and electric system specific power were conducted. The results indicate that total thrust and fuel consumption rate increase monotonically with the hybridization factor. When the power allocated to the electric system equals the motor power rating, the hybridization factor reaches its feasible maximum. Maximizing the hybridization factor as a power management strategy reduces fuel consumption by 29.30% and increases total thrust by 41.44%. The hybridization factor and motor power rating are directly proportional, and within the range of 2 MW to 6 MW motor power, each 1 MW increase in motor power reduces fuel consumption by 26.5% to 40.6%. From 2025 to 2030, the impact of specific power on the mass of the electric system will be limited. An 18% increase in specific power results in a 1.64% reduction in system mass, while a 137% increase in specific power leads to a 2.76% decrease in system mass.
Author Contributions
Funding
Data Availability Statement
Conflicts of Interest
References
- Yin, F.; Rao, A.G.; Bhat, A.; Chen, M. Performance assessment of a multi-fuel hybrid engine for future aircraft. Aerosp. Sci. Technol. 2018, 77, 217–227. [Google Scholar]
- Kroyan, Y.; Wojcieszyk, M.; Kaario, O.; Larmi, M. Modeling the impact of sustainable aviation fuel properties on end-use performance and emissions in aircraft jet engines. Energy 2022, 255, 124470. [Google Scholar]
- Bravo-Mosquera, P.D.; Catalano, F.M.; Zingg, D.W. Unconventional aircraft for civil aviation: A review of concepts and design methodologies. Prog. Aerosp. Sci. 2022, 131, 100813. [Google Scholar]
- Darecki, M.; Edelstenne, C.; Fernandez, E.; Hartman, P.; Herteman, J.-P.; Kerkloch, M.; King, I.; Ky, P.; Mathieu, M.; Orsi, G. Flightpath 2050: Europe’s Vision for Aviation; Maintaining Global Leadership and Serving Society’s Needs; European Commission, Ed.; Report of the High-Level Group on Aviation Research; European Commission: Luxembourg, 2011. [Google Scholar]
- Abu Salem, K.; Palaia, G.; Quarta, A.A. Impact of Figures of Merit Selection on Hybrid–Electric Regional Aircraft Design and Performance Analysis. Energies 2023, 16, 7881. [Google Scholar] [CrossRef]
- Chen, Z.; Liang, F.; Mao, J.; Wang, Z.; Jiang, X. Optimization Design of SOFC-GT Hybrid Power System for Aviation Application. Energies 2024, 17, 3681. [Google Scholar] [CrossRef]
- Epstein, A.H.; O’Flarity, S.M. Considerations for reducing aviation’s CO2 with aircraft electric propulsion. J. Propuls. Power 2019, 35, 572–582. [Google Scholar] [CrossRef]
- Hospodka, J.; Bínová, H.; Pleninger, S. Assessment of all-electric general aviation aircraft. Energies 2020, 13, 6206. [Google Scholar] [CrossRef]
- Karadotcheva, E.; Nguyen, S.N.; Greenhalgh, E.S.; Shaffer, M.S.; Kucernak, A.R.; Linde, P. Structural power performance targets for future electric aircraft. Energies 2021, 14, 6006. [Google Scholar] [CrossRef]
- Ansell, P.J.; Haran, K.S. Electrified airplanes: A path to zero-emission air travel. IEEE Electrif. Mag. 2020, 8, 18–26. [Google Scholar]
- Pettes-Duler, M.; Roboam, X.; Sareni, B. Integrated optimal design for hybrid electric powertrain of future aircrafts. Energies 2022, 15, 6719. [Google Scholar] [CrossRef]
- Pornet, C.; Isikveren, A.T. Conceptual design of hybrid-electric transport aircraft. Prog. Aerosp. Sci. 2015, 79, 114–135. [Google Scholar]
- Bradley, M. Identification and descriptions of fuel cell architectures for aircraft applications. In Proceedings of the 2022 IEEE Transportation Electrification Conference & Expo (ITEC), Long Beach, CA, USA, 15 June 2022; IEEE: Piscataway, NJ, USA, 2022; pp. 1047–1050. [Google Scholar]
- Bradley, M.K.; Droney, C.K. Subsonic Ultra Green Aircraft Research: Phase II–Volume II–Hybrid Electric Design Exploration; NASA CR-218704; Boeing Research and Technology: Huntington Beach, CA, USA, 2015; p. 378. [Google Scholar]
- Kratz, J.L.; Thomas, G.L. Dynamic analysis of the STARC-ABL propulsion system. In Proceedings of the AIAA Propulsion and Energy 2019 Forum, Indianapolis, IN, USA, 19–22 August 2019; p. 4182. [Google Scholar]
- Welstead, J.; Felder, J.L. Conceptual design of a single-aisle turboelectric commercial transport with fuselage boundary layer ingestion. In Proceedings of the 54th AIAA Aerospace Sciences Meeting, San Diego, CA, USA, 4–8 January 2016; p. 1027. [Google Scholar]
- Friedrich, C.; Robertson, P.A. Hybrid-electric propulsion for aircraft. J. Aircr. 2015, 52, 176–189. [Google Scholar]
- Vankan, W.; Lammen, W. Parallel Hybrid Electric Propulsion Architecture for Single Aisle Aircraft-Powertrain Investigation; NLR–Netherlands Aerospace Centre: Amsterdam, The Netherlands, 2019. [Google Scholar]
- Hoogreef, M.; Vos, R.; de Vries, R.; Veldhuis, L.L. Conceptual assessment of hybrid electric aircraft with distributed propulsion and boosted turbofans. In Proceedings of the AIAA Scitech 2019 Forum, San Diego, CA, USA, 7–11 January 2019; p. 1807. [Google Scholar]
- Riboldi, C.E. An optimal approach to the preliminary design of small hybrid-electric aircraft. Aerosp. Sci. Technol. 2018, 81, 14–31. [Google Scholar] [CrossRef]
- Hoelzen, J.; Liu, Y.; Bensmann, B.; Winnefeld, C.; Elham, A.; Friedrichs, J.; Hanke-Rauschenbach, R. Conceptual design of operation strategies for hybrid electric aircraft. Energies 2018, 11, 217. [Google Scholar] [CrossRef]
- Warwick, G. Staying power: Hybrid gasoline-electric propulsion gives new multicopter drones more endurance. Aviat. Week Space Technol. 2017, 179, 50. [Google Scholar]
- Thauvin, J. Exploring the Design Space for a Hybrid-Electric Regional Aircraft with Multidisciplinary Design Optimisation Methods; Institut National Polytechnique de Toulouse-INPT: Toulouse, France, 2018. [Google Scholar]
- Li, S.; Gu, C.; Xu, M.; Li, J.; Zhao, P.; Cheng, S. Optimal power system design and energy management for more electric aircrafts. J. Power Sources 2021, 512, 230473. [Google Scholar]
- Des Marais, D.J.; Allamandola, L.J.; Benner, S.A.; Boss, A.P.; Deamer, D.; Falkowski, P.G.; Farmer, J.D.; Hedges, S.B.; Jakosky, B.M.; Knoll, A.H. The NASA astrobiology roadmap. Astrobiology 2003, 3, 219–235. [Google Scholar] [PubMed]
- Kang, L.; Sun, Y.; Smith, H. MDAO method and optimum designs of hybrid-electric civil airliners. J. Aerosp. Eng. 2022, 35, 04022032. [Google Scholar] [CrossRef]
- Wayson, R.L.; Fleming, G.G.; Iovinelli, R. Methodology to estimate particulate matter emissions from certified commercial aircraft engines. J. Air. Waste. Manag. 2009, 59, 91–100. [Google Scholar]
- Lefebvre, A.H. The Role of Fuel Preparation in Low-Emission Combustion. J. Eng. Gas Turbines Power 1995, 117, 617–654. [Google Scholar]
- Gray, J.S.; Mader, C.A.; Kenway, G.K.; Martins, J.R. Approach to modeling boundary layer ingestion using a fully coupled propulsion-RANS model. In Proceedings of the 58th AIAA/ASCE/AHS/ASC Structures, Structural Dynamics, and Materials Conference, Grapevine, TX, USA, 9–13 January 2017; p. 1753. [Google Scholar]


| Parameter | Initial Value | Upper Boundary | Lower Boundary | |
|---|---|---|---|---|
| Objective | Minimize MTOM [kg] | 68,000 | 160,000 | 44,000 |
| Variable | Wingspan 1 [m] | 17.5 | 24.5 | 14 |
| Wingspan 2 [m] | 9 | 12.6 | 7.2 | |
| Wing chord 1 [m] | 3.35 | 4.69 | 2.68 | |
| Wing chord 2 [m] | 2.7 | 3.78 | 2.16 | |
| Fuel fraction | 0.05 | 0.1 | 0.01 | |
| Battery fraction | 0.05 | 0.3 | 0.01 | |
| BPR | 15 | 20 | 10 | |
| Constraint | MTOM error | |||
| Takeoff distance error | ||||
| Landing distance error | ||||
| 1st climb velocity error | ||||
| 2nd climb thrust error | ||||
| Missed approach thrust error | ||||
| Cruise thrust error | ||||
| Fuel mass error | ||||
| Fuel volume error | ||||
| Battery mass error | ||||
| Battery volume error | ||||
| SUGAR Free | Model | Error | |
|---|---|---|---|
| Thrust [N] | 121,436 | 111,487 | −8.19% |
| Fuel Consumption [kg] | 6392 | 6397 | 0.08% |
| SUGAR High | Model | Error | |
|---|---|---|---|
| Thrust [N] | 86,295 | 86,783 | 0.57% |
| Fuel Consumption [kg] | 2966 | 3079 | 3.81% |
| SUGAR Volt | Model | Error | |
|---|---|---|---|
| Thrust [N] | 80,068 | 85,744 | 7.09% |
| Fuel Consumption [kg] | 2554 | 2737 | 7.17% |
| Electricity Consumption [J] | 1.71 × 10¹⁰ | 1.56 × 10¹⁰ | −8.77% |
| Energy Consumption [J] | 1.27 × 10¹¹ | 1.34 × 10¹¹ | 4.87% |
| Parameter | Values |
|---|---|
| Total Installed Power of Electric Motor [MW] | 3 |
| Specific Power of Electric Motor [kW/kg] | 5.55 |
| Battery Specific Energy [wh/kg] | 500 |
| Specific Power of Electrical System [kW/kg] | 7.5 |
| Battery Specific Power [kW/kg] | 0.5 |
| Battery Energy Density [MJ/m3] | 5400 |
| Electric Transmission Efficiency | 89.1% |
| Power Transmission Efficiency | 89% |
| BLI Efficiency | 90% |
| Tail Fan Efficiency | 93% |
| Parameter | Values | Unit |
|---|---|---|
| MTOM | 79,000 | [kg] |
| OEM | 37,163 | [kg] |
| Cruise Mach | 0.79 | [-] |
| Cruise Altitude | 10,668 | [m] |
| Passenger | 180 | [seats] |
| Range | 1000 | [nm] |
| Block fuel | 14,152 | [kg] |
| Block energy | 6.10 × 10¹¹ | [J] |
| emission | 72.97 | [kg] |
| emission | 43,588 | [kg] |
| Parameter | Values | Unit |
|---|---|---|
| Design Mach | 0.79 | [-] |
| Design altitude | 10,668 | [M] |
| Pressure ratio | 32.8 | [-] |
| Bypass ratio of GTE | 5.1 | [-] |
| Installed power of motor | 7.5 | [MW] |
| Sea Level Thrust Requirement | 120 | [kN] |
| Parameter | Values | Unit |
|---|---|---|
| Taxing out time | 5 | [min] |
| Maximum takeoff distance | 3000 | [M] |
| 1st Climb gradient | 0.024 | [-] |
| 2nd Climb gradient | 0.024 | [-] |
| 3rd Climb time | 5 | [min] |
| Continuous climb time | 25 | [min] |
| Cruise Mach | 0.79 | [-] |
| Cruise altitude | 10,668 | [m] |
| Descend angle | 3 | [°] |
| Maximum landing distance | 3000 | [m] |
| Taxing in | 5 | [min] |
| Year | Rectifier Specific Power [Watt/kg] | Power Controller Specific Power [Watt/kg] | Thermal Management System Specific Power [Watt/kg] | Propulsion System Mass [kg] |
|---|---|---|---|---|
| 2025 | 7500 | 7500 | 3750 | 6635.89 |
| 2030 | 11,250 | 11,250 | 11,250 | 6540.07 |
| 2035 | 17,800 | 17,800 | 17,800 | 6452.51 |
| Year | Specific Power of Electric Motor [Watt/kg] | Propulsion System Mass [kg] |
|---|---|---|
| 2025 | 5500 | 6635.89 |
| 2030 | 6000 | 6576.80 |
| 2035 | 6500 | 6526.80 |
Disclaimer/Publisher’s Note: The statements, opinions and data contained in all publications are solely those of the individual author(s) and contributor(s) and not of MDPI and/or the editor(s). MDPI and/or the editor(s) disclaim responsibility for any injury to people or property resulting from any ideas, methods, instructions or products referred to in the content. |
© 2025 by the authors. Published by MDPI on behalf of the World Electric Vehicle Association. Licensee MDPI, Basel, Switzerland. This article is an open access article distributed under the terms and conditions of the Creative Commons Attribution (CC BY) license (https://creativecommons.org/licenses/by/4.0/).
Share and Cite
Shan, W.; Bao, S.; Lin, S.; Kang, L. Hybrid Electric Propulsion Design and Analysis Based on Regional Aircraft Mission. World Electr. Veh. J. 2025, 16, 212. https://doi.org/10.3390/wevj16040212
Shan W, Bao S, Lin S, Kang L. Hybrid Electric Propulsion Design and Analysis Based on Regional Aircraft Mission. World Electric Vehicle Journal. 2025; 16(4):212. https://doi.org/10.3390/wevj16040212
Chicago/Turabian StyleShan, Wenjuan, Shengze Bao, Shixuan Lin, and Le Kang. 2025. "Hybrid Electric Propulsion Design and Analysis Based on Regional Aircraft Mission" World Electric Vehicle Journal 16, no. 4: 212. https://doi.org/10.3390/wevj16040212
APA StyleShan, W., Bao, S., Lin, S., & Kang, L. (2025). Hybrid Electric Propulsion Design and Analysis Based on Regional Aircraft Mission. World Electric Vehicle Journal, 16(4), 212. https://doi.org/10.3390/wevj16040212