Article

Congestion Relief and Economic Optimization of Integrated Power Stations with Charging and Swapping Functions

1
College of Information Engineering, Henan University of Science and Technology, Luoyang 471000, China
2
State Grid Ruyang Electric Power Co., Ltd., Luoyang 471200, China
3
State Grid Integrated Energy Planning and D&R Institute Co., Ltd., Beijing 100052, China
*
Author to whom correspondence should be addressed.
World Electr. Veh. J. 2025, 16(4), 230; https://doi.org/10.3390/wevj16040230
Submission received: 28 February 2025 / Revised: 7 April 2025 / Accepted: 9 April 2025 / Published: 14 April 2025

Abstract

:
To effectively address the challenges of imbalanced equipment utilization, frequent congestion, and poor economic benefits faced by charging and swapping stations (ICSSs), this paper innovatively proposes a comprehensive scheduling strategy that combines user behavior regulation and battery management. In terms of user regulation, an intention-reshaping model for changing user cognition is proposed to equalize the use of charging and swapping (CAS) equipment, easing ICSS congestion. Moreover, an off-station scheduling model for electric vehicles (EVs) is developed to enhance overall ICSS revenue. Within the battery management terms, the suggested inventory battery threshold adjustment method and charging strategy by charging time segmentation are employed to ensure consistent inventory battery supply and cost-effective battery charging. Finally, a two-stage scheduling strategy of in-station and off-station scheduling is suggested for the ICSS, and an improved northern goshawk optimization algorithm (INGO) is used to solve it. The results showed that this strategy reduced the overall congestion of ICSSs by 34% and increased the average annual net revenue by 64%. The goal of alleviating congestion and improving the economic efficiency of ICSSs has been achieved.

1. Introduction

Recently, ICSSs have been rapidly developing nationwide, offering unique advantages such as speed, time efficiency, and flexibility in meeting diverse user CAS demands [1,2,3]. For instance, in 2024, the number of new ICSSs in China is projected to increase by up to 59.8% annually [4]. Furthermore, propelled by a series of policies, ICSSs are anticipated to sustain their growth momentum [5,6]. Nevertheless, the CAS cognitive and behavior variations in EV users impede the full realization of this benefit [7,8]. The manifestation is that an uneven allocation of CAS resources during peak hours leads to congestion in ICSSs, while idle CAS equipment during non-peak hours reduces the efficiency of ICSSs. Additionally, battery management on the swapping side (SS) poses substantial challenges. Improper battery management could result in a shortage of inventory batteries [9,10], leading to swapping congestion and a decline in the operational efficiency and economic viability of the ICSSs [11]. Hence, in ICSSs with a portion of EV users, addressing how to effectively guide EV users to change their CAS behaviors and cognitive patterns, alongside ensuring a consistent supply of batteries, has emerged as a critical concern for reducing ICSS congestion and enhancing ICSS operational revenue.
Several innovative approaches have been suggested to enhance station revenue by alleviating congestion in EV’s CAS operations. The authors of [12] utilized information-gap decision theory to implement demand response (DR) management for EVs, ensuring organized battery swapping. The authors of [13] established an optimal incentive price using the suggested EV willingness-driven model to facilitate the systematic charging of EVs and alleviate congestion at ICSSs. The authors of [14] introduced a market regulation mechanism that relies on sharing congestion information to assist users in selecting suitable charging times and alleviating congestion issues at stations. The authors of [15] suggested a price-sensitive DR strategy that employs a reward and penalty system based on unit tariffs to direct EVs towards orderly participation in CAS, thereby alleviating congestion and boosting economic advantages. The authors of [16] introduced a decentralized charging coordination strategy utilizing price signals to assist EVs in selecting appropriate charging times and power levels, addressing issues of EV charging congestion and economic downturn in stations. The authors of [17] proposed a method for systematically scheduling EVs using Markov decision processes linked to the EV travel sequence. This approach could efficiently optimize EV charging schedules, enhance the operational efficiency of stations, and alleviate congestion within them. Past research has delved into EV management from various angles to alleviate congestion at charging or swapping stations, consequently boosting station revenue. Nonetheless, these studies have overlooked congestion problems at ICSSs. This paper intends to revamp the approach by intentionally reshaping, enhancing the overall operational efficiency of ICSSs, and addressing congestion issues.
To optimize battery management, the authors of [18] suggested a real-time management approach for swapping station batteries, utilizing a state-of-charge-dependent scheduling method based on aggregate battery levels. The authors of [19] improved station efficiency by employing a life-cycle decision model that accounts for swapping prices and depreciation costs in battery charging management. The authors of [20] introduced a dynamic battery charging model that adjusts the charging rate based on congestion levels to maintain adequate battery inventory across different scenarios. The authors of [21] optimized power distribution between chargers in different layers to effectively manage batteries and reduce station operating costs The authors of [22] suggested utilizing batteries for swapping services while engaging in network response to boost station revenue. The authors of [23] proposed a station model integrating charging, swapping, and energy storage to minimize costs and carbon emissions by efficiently integrating various energy sources. The authors of [24] analyzed factors including battery charging costs, depreciation costs, and the benefits of battery swapping. They developed a battery charging model to reduce operating costs and avoid cost escalation due to uncontrolled charging practices. Past studies have mainly focused on optimizing battery charging power to boost station revenue and ensure inventory levels. However, this method is characterized by a high level of unpredictability. This research addresses the existing literature gap by flexibly adjusting the state of charge (SOC) threshold.
In the domain of enhancing the economic advantages of stations, researchers have introduced diverse optimization approaches. The authors of [25] introduced a multi-objective battery charging optimization model that takes into account factors like battery loss cost and vehicle waiting cost. The authors of [26] devised a comprehensive cost function for EVs considering travel time, waiting time, and swapping price, and solved it via an iterative optimal response algorithm to achieve optimal economic dispatch. The authors of [27] formulated a scheduling model for swapping stations to harmonize operational costs and the effective utilization of green electricity while attaining the aims of cost-efficient charging and systematic battery swapping. The authors of [28] introduced a dual-layer economic optimization model aiming to maximize social welfare and minimize operational costs. The initial layer of this model aims to decrease the station’s investment and operational expenses, while the second layer considers the concerns of EV users. The authors of [29] proposed a two-stage EV scheduling model based on day-ahead and real-time approaches to guarantee the stable functioning of the ICSS and enhance its total revenue. The authors of [30] suggested an EV economic dispatch model that integrates DR into the swapping strategy to reduce the operational costs of the station, encompassing DR costs. While these methods have notably boosted the station’s total revenue, research into ICSSs remains unexplored.
This study alleviated congestion at ICSSs during peak hours, enhanced economic benefits during non-peak hours, improved the supply consistency of inventory batteries, and optimized battery charging power. Furthermore, a comprehensive economic dispatch model was developed to achieve an optimal scheduling of ICSSs. The primary contributions of this study include the following:
  • Proposed an innovative intention-reshaping model based on the ABC attitude change theory. This model could coordinate the CAS demands of EVs, balance the utilization rate of CAS equipment during peak hours, and thus alleviate congestion in ICSS.
  • Proposed an out-station scheduling model based on vehicle and road conditions. This model could effectively manage out-station EVs, enhance the equipment utilization rate during off-peak hours, and consequently enhance the ICSS’s overall revenue.
  • Proposed an innovative method for adjusting the SOC threshold of inventory batteries. This method could ensure a consistent supply of inventory batteries. In addition, a novel battery charging strategy based on charging duration zoning has been introduced to optimize the charging economy.
  • To maximize ICSS revenue, a two-stage economic dispatch model based on on-station and off-station scheduling has been developed. This model considers economic and operational indicators and utilizes an INGO for optimization, resulting in an optimal economic dispatch for the ICSS.
The structure of the paper is outlined as follows: Section 2 introduces the intention-reshaping model and out-station scheduling methods. Section 3 presents the battery threshold adjustment method and the battery charging strategy. In Section 4, the economic optimization model of the ICSS is detailed. Section 5 proposes a two-stage scheduling strategy for ICSSs, encompassing both in-station and out-station scheduling, and addresses this issue using INGO. Following this, Section 6 conducts simulations and analyzes the outcomes. Lastly, Section 7 provides the conclusion.

2. EV

The peak interlocking characteristics resulting from variations in user CAS behaviors [31,32], combined with the growing compatibility advantages of EVs for CAS [33], make it possible to alleviate ICSS congestion by coordinating the CAS of EVs on both sides. However, varying user cognitions and disordered CAS behaviors not only hinder the effective utilization of these benefits but also lead to long-term idling for CAS equipment during off-peak periods, ultimately triggering a cascade of issues including an uneven allocation of CAS resources, ICSS congestion, and economic decline [13,17]. Consequently, this paper suggests a set of strategies to comprehensively tackle these challenges.

2.1. EV Queuing Model Based on Wealth Points and Battery Degradation Trust

This section focuses on queuing the EVs arriving at the ICSS at time t . Wealth points and battery degradation trust are chosen as evaluation metrics, and a just and efficient queuing model is proposed to ensure the orderly management of EVs in separate queues for CAS.

2.1.1. Wealth Points Management Mechanism

Within the wealth points management mechanism, EV i could earn initial points S EV i ini by participating in consumption for the first time. Subsequently, the points earned increased in a stepwise manner based on the amount of each consumption. The wealth points S j , EV i tot at the j -th consumption of EV i , are as shown in Equation (1).
S j , EV i tot = S EV i ini + j = 1 j 1 ( 1 + θ j ) · K j , EV i pay
θ j = a % ; i f : α EV pay < K j , EV i pay < β EV pay b % ; i f : β EV pay K j , EV i pay γ EV pay c % ; i f : K j , EV i pay > γ EV pay
where θ j is the additional reward coefficient. K j , EV i pay is the consumption amount of EV i in j -th time. α EV pay , β EV pay , and γ EV pay are the critical values for each consumption interval, respectively. a , b , and c are the percentages of integral growth, respectively.

2.1.2. Battery Degradation Trust Management Mechanism

In the battery degradation trust management mechanism, the EV i is first assigned an initial trust value R EV i ini , and thereafter, the trust value of the EV i will be dynamically updated based on the over-discharge level SOC j , EV i a of the battery at each arrival and the over-charge level SOC j , EV i l of the battery at each departure. The battery degradation trust value R j , EV i tot at the j -th consumption of EV i , is as shown in Equation (3).
R j , EV i tot = R EV i ini ω a · j = 1 j 1 SOC j , EV i a ω l · j = 1 j 1 SOC j , EV i l
SOC j , EV i a = m a x SOC min SOC j , EV i a , 0 SOC j , EV i l = m a x SOC j , EV i l SOC max , 0
where ω a and ω l are the over-limit penalty coefficients for EV arrival and departure, respectively. SOC max and SOC min are the upper and lower limits of battery SOC, respectively.
The comprehensive score S R j , EV i total of EV i during the j -th consumption is shown in Equation (5). Sort the comprehensive scores of the CAS EVs that arrive at the ICSS at time t in descending order to obtain the position L EV i , cha ABC or L EV i , swp ABC of EV i in the queue.
S R j , EV i total = ω S · S j , EV i tot + ω R · R j , EV i tot
where ω S and ω R are the adjustment coefficients for wealth points and battery degradation trust.

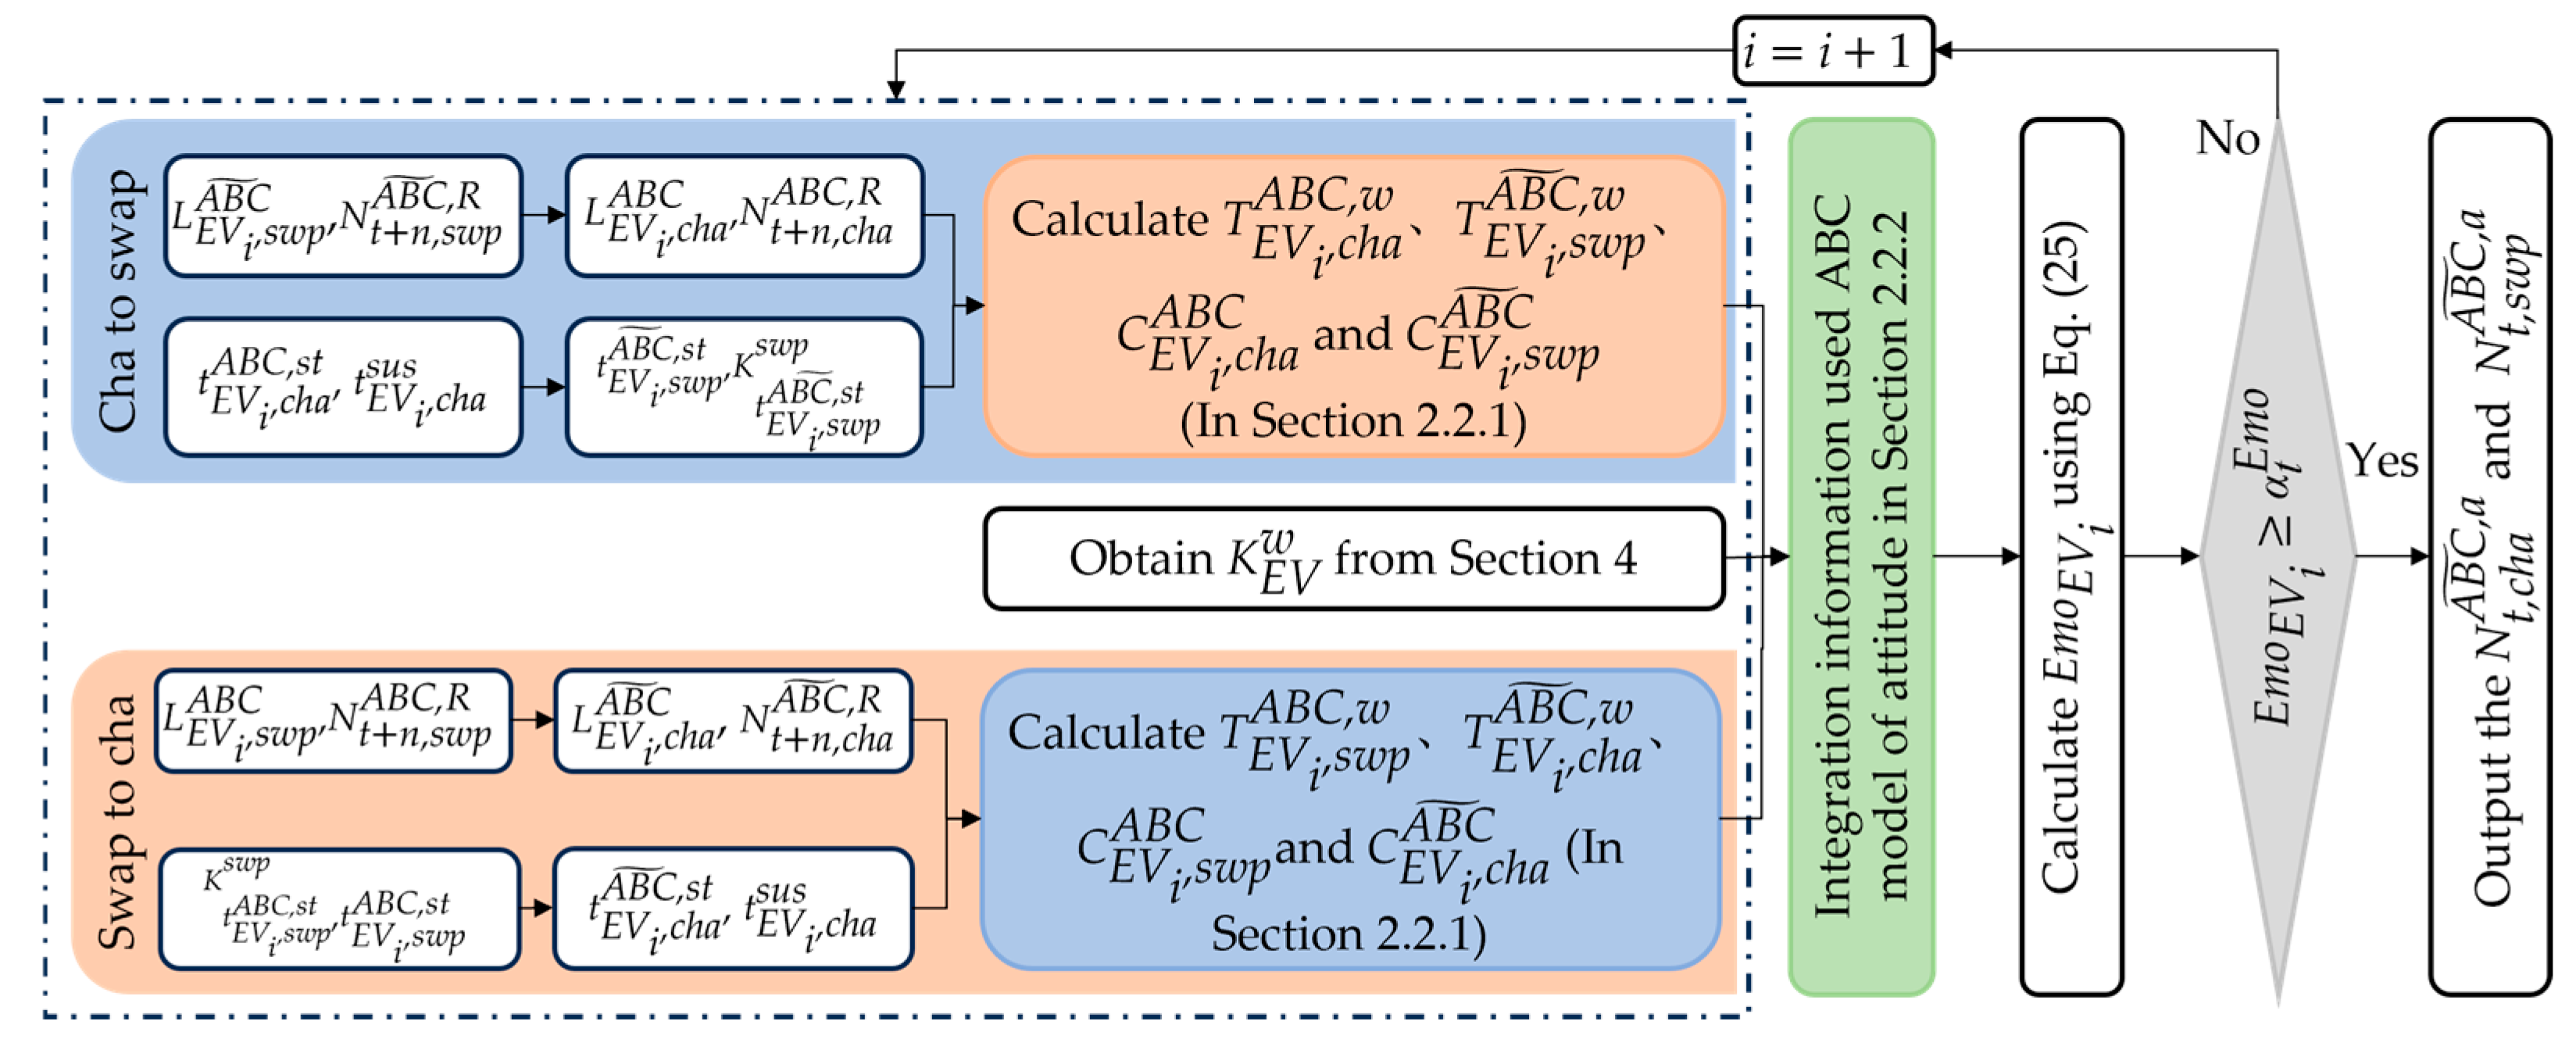
2.2. Intention-Reshaping Model

This section proposes a novel intention-reshaping model. This model could fully utilize the peak interlocking advantages, guide the CAS intentions of EVs upon arrival at the ICSS at time t, and coordinate CAS resources to alleviate congestion and enhance the overall economic benefits of the ICSS.

2.2.1. Waiting Time and Cost Change Model for EVs

This section aims to furnish EVs arriving at the ICSS at time t with an estimated waiting time and cost change before and after the conversion of intention, facilitating informed decision-making. This process occurs before the actual conversion of intention, so two prediction scenarios were chosen for trial calculation: conversions of all EVs from the charging side (CS) to the SS, and from the SS to the CS. Additionally, EVs with the conversion of intention should be positioned at the tail of the target queue in the original sequence, with their positions adjusted based on the new queue.
  • Scenario 1: charging to swapping
The charging waiting time T EV i , cha ABC , w before the EV i conversion is decided by the EV’s initial position L EV i , cha ABC in the charging queue (in Section 2.1) and the number of revolutions of the charging pile at each moment, as illustrated in Equation (6). The swapping waiting time T EV i , swp ABC ~ , w after the EV i conversion relies on the new position, L EV i , swp ABC ~ , from the charging queue to the swapping queue, and the number of revolutions of the swapping motor at each moment, as shown in Equation (7).
T EV i , cha ABC , w = 0 ; i f : N t , cha ABC , R L EV i , cha ABC t ; i f : N t , cha ABC , R + N t + 1 , cha ABC , R L EV i , cha ABC 2 · t ;   if :   N t , cha ABC , R + N t + 1 , cha ABC , R + N t + 2 , cha ABC , R L EV i , cha ABC
T EV i , swp ABC ~ , w = 0 ; i f : N t , swp ABC ~ , R L EV i , swp ABC ~ t ; i f : N t , swp ABC ~ , R + N t + 1 , swp ABC ~ , R L EV i , swp ABC ~ 2 · t ;   if : N t , swp ABC ~ , R + N t + 1 , swp ABC ~ , R + N t + 2 , swp ABC ~ , R L EV i , swp ABC ~
N t + n , cha ABC , R = N t + n 1 , cha ABC , id + N t + n 1 , cha ABC , l , n = 0 , 1 , 2 , 3 · · ·
N t + n , swp ABC ~ , R = min N swp , N t + n , in BMS ~ , n = 0 , 1 , 2 , 3 · · ·
L EV i , swp ABC ~ = N t , swp ABC , w + L EV i , cha ABC
where N t , cha ABC , R , N t + 1 , cha ABC , R , and N t + 2 , cha ABC , R are the number of revolutions of the charging pile at time t , t + 1 , and t + 2 , respectively, before the conversion. N t , swp ABC ~ , R , N t + 1 , swp ABC ~ , R , and N t + 2 , swp ABC ~ , R are the number of revolutions of the swapping motor at time t , t + 1 , and t + 2 , respectively, after the conversion. N t + n , cha ABC , R is the number of revolutions of the charging pile at time t + n . N t + n 1 , cha ABC , id is the number of idle charging piles at time t + n 1 , before the conversion. N t + n 1 , cha ABC , l is the number of EVs leaving the CS at time t + n 1 , before the conversion. N t + n , swp ABC ~ , R is the number of revolutions of the swapping motor at time t + n , after the conversion. N swp is the number of swapping motors. N t + n , in BMS ~ is the number of inventory batteries (Section 4) at time t + n , after the BMS. N t , swp ABC , w is the number waiting for swapping at time t , before the conversion.
The charging cost C EV i , cha ABC before the EV i conversion is obtained by accurately calculating the charging start time t EV i , cha ABC , st and charging sustain time t EV i , cha sus after queuing, and accumulating the cost at each moment during the entire charging cycle, as shown in Equation (11). The swapping cost C EV i , swp ABC ~ after the EV i conversion is determined by the multiplying of the tariff at the moment of swapping K t EV i , swp ABC , st swp and the actual capacity of swapping, based on the accurate calculation of the swapping starting time t EV i , swp ABC ~ , st after conversion, are as shown in Equation (14).
C EV i , cha ABC = h = t EV i , cha ABC , st t EV i , cha ABC , st + t EV i , cha ABC , sus K h cha · P e , cha EV · η e , cha EV · t / 60 , t EV i , cha ABC , st + t EV i , cha sus = t EV i , cha ABC , st + t , t EV i , cha ABC , st + 2 · t , · · · , t EV i , cha ABC , st + n · t ,
t EV i , cha ABC , st = t + T EV i , cha ABC , w
t EV i , cha sus = [ ( SOC EV i e SOC EV i a ) · SOH EV i B · E e B ] / P e , cha EV · η e , cha EV · t / 60
C EV i , swp ABC ~ = K t EV i , swp ABC ~ , st swp · SOC s B · SOH s B SOC EV i a · SOH EV i B · E e B
t EV i , swp ABC ~ , st = t + T EV i , swp ABC ~ , w
where K h cha is the charging tariff at time h . P e , cha EV is the rated charging power of EVs. η e , cha EV is the charging efficiency of EVs. SOC EV i e is the expected charging SOC of EV i . SOC EV i a is the SOC of EV i upon arrival at the ICSS. SOH EV i B is the SOH of the EV i battery. E e B is the rated capacity of the battery. SOC s B is the SOC of the batteries used for swapping. SOH s B is the SOH of batteries used for swapping.
  • Scenario 2: swapping to charging
The swapping waiting time T EV i , swp ABC , w before the EV i conversion is determined by the initial position L EV i , swp ABC of EV i in the swapping queue (In Section 2.1), as well as the number of revolutions of the swapping motor at each moment, as shown in Equation (16). The charging waiting time T EV i , cha ABC ~ , w after the EV i conversion depends on its new position at the charging queue L EV i , cha ABC ~ , as well as the number of revolutions of the charging pile at each moment, as shown in Equation (17).
T EV i , swp ABC , w = 0 ; i f : N t , swp ABC , R L EV i , swp ABC t ; i f : N t , swp ABC , R + N t + 1 , swp ABC , R L EV i , swp ABC 2 · t ;   if : N t , swp ABC , R + N t + 1 , swp ABC , R + N t + 2 , swp ABC , R L EV i , swp ABC
T EV i , cha ABC ~ , w = 0 ; i f : N t , cha ABC ~ , R L EV i , cha ABC ~ t ; i f : N t , cha ABC ~ , R + N t + 1 , cha ABC ~ , R L EV i , cha ABC ~ 2 · t ;   if : N t , cha ABC ~ , R + L t + 1 , EV i , cha ABC ~ , R + N t + 2 , cha ABC ~ , R L EV i , cha ABC ~
N t + n , swp ABC , R = min N swp , N t + n , in BMS , n = 1 , 2 , 3 · · ·
N t + n , cha ABC ~ , R = N t + n 1 , cha ABC ~ , id + N t + n 1 , cha ABC ~ , l , n = 0 , 1 , 2 , 3 · · ·
L EV i , cha ABC ~ = N t , cha ABC , w + L EV i , swp ABC
where N t , swp ABC , R , N t + 1 , swp ABC , R , and N t + 2 , swp ABC , R are the number of revolutions of the swapping motor at time t , t + 1 , and t + 2 , respectively, before the conversion. N t , cha ABC ~ , R , N t + 1 , cha ABC ~ , R , and N t + 2 , cha ABC ~ , R are the number of revolutions of the charging pile at time t , t + 1 , and t + 2 , respectively, after the conversion. N t + n , swp ABC , R is the number of revolutions of the swapping motor at time t + n , before the conversion. N t + n , in BMS is the number of inventory batteries at time t + n , before the BMS. N t + n , cha ABC ~ , R is the number of revolutions of the charging pile at time t + n , after the conversion. N t + n 1 , cha ABC ~ , id is the number of idle charging piles at time t + n 1 , after the conversion. N t + n 1 , cha ABC , l is the number of EVs leaving the CS at time t + n 1 , after the conversion. N t , cha ABC , w is the number waiting for charging at time t , before the conversion.
The swapping cost C EV i , swp ABC before the EV i conversion is determined by the multiplying of the tariff at the moment of swapping K t EV i , swp ABC , st swp and the actual capacity of swapping, based on the accurate calculation of swapping starting time t EV i , swp ABC , st , are as shown in Equation (21). The charging cost C EV i , cha ABC ~ is calculated by accurately calculating the charging start time t EV i , cha ABC ~ , st and charging sustain time t EV i , cha sus after queuing, and accumulating the cost of each moment during the entire charging cycle, as shown in Equation (23).
C EV i , swp ABC = K t EV i , swp ABC , st swp · SOC s B · SOH s B SOC EV i a · SOH EV i B · E e B
t EV i , swp ABC , st = t + T EV i , swp ABC , w
C EV i , cha ABC ~ = h = t EV i , cha ABC ~ , st t EV i , cha ABC ~ , st + t EV i , cha sus K h cha · P e , cha EV · η e , cha EV · t / 60 , ( t EV i , cha ABC ~ , st + t EV i , cha sus = t EV i , cha ABC ~ , st + t , t EV i , cha ABC ~ , st + 2 · t , · · · , t EV i , cha ABC ~ , st + n · t , )
t EV i , cha ABC ~ , st = t + T EV i , cha ABC ~ , w

2.2.2. ABC Model of Attitudes

This section aims to integrate stimulus information into the emotional intensity indicator using the ABC model of attitude, for a more intuitive coordination of EVs on both sides, ultimately alleviating congestion. The ABC model [34,35] involves cognition (C), affect (A), and behavior tendency (B). In this paper, C represents stimulus information. A, as the mediating link, represents intention. B represents the result of EV users’ decision-making.
  • C
The stimulating information in this paper includes the estimated waiting time and cost before and after conversion, as well as conversion reward funds (in Section 4).
  • A
This paper considers stimulus information as both output and input factors in the intention-reshaping process and introduces the value rate of items [36] to describe their interrelation, subsequently integrating them into user emotions via the first law of emotional intensity [37,38]. Nevertheless, the characteristics of stimulus information fluctuate between output and input based on the conversion type, necessitating a detailed breakdown, as outlined in Table 1.
As shown in the table, the conversion reward funds are consistently defined as the output, regardless of changes in the type of conversion. For the cost, the swapping cost is always higher than the charging cost. Therefore, when CS converts to SS, the cost increases, which is the input, as shown in Equation (27). When SS converts to CS, the total cost decreases, representing the output, as shown in Equation (29). Additionally, the uncertainty in waiting time necessitates flexible adjustments based on real-world situations.
Emo EV i = K m · log ( 1 + P EV i )
P EV i = P EV i P t 0
If charging to swapping,
P EV i = K EV w · T EV i , cha ABC , w T EV i , swp ABC ~ , w + K t , r ABC ~ C EV i , swp ABC ~ C EV i , cha ABC , i f : T EV i , cha ABC , w T EV i , swp ABC ~ , w K t , r ABC ~ K EV w · T EV i , swp ABC ~ , w T EV i , cha ABC , w + C EV i , swp ABC ~ C EV i , cha ABC , i f : T EV i , cha ABC , w < T EV i , swp ABC ~ , w
P t 0 = ω t r · K t , r ABC ~ + ω t w · K EV w · ( T EV i , cha ABC , w T EV i , swp ABC ~ , w ) + ω t C · C EV i , swp ABC ~ C EV i , cha ABC / 3
If swapping to charging,
P t , EV i = K t , r ABC ~ + C EV i , cha ABC ~ C EV i , swp ABC K EV w · T EV i , cha ABC ~ , w T EV i , swp ABC , w , i f : T EV i , swp ABC , w < T EV i , cha ABC ~ , w K t , r ABC ~ + C EV i , cha ABC ~ C EV i , swp ABC + K EV w · T EV i , swp ABC , w T EV i , cha ABC ~ , w , i f : T EV i , swp ABC , w T EV i , cha ABC ~ , w
P t 0 = ω t r · K t , r ABC ~ + ω t C · C EV i , cha ABC ~ C EV i , swp ABC + ω t w · K EV w · ( T EV i , swp ABC , w T EV i , cha ABC ~ , w ) / 3
where Emo EV i is the emotional intensity of EV i . K m is the emotional intensity of EV i . P EV i is the difference in value rate. P EV i is the difference in value rate. P t 0 is the median value rate. K t , r ABC ~ is the conversion reward at time t . K EV w is the waiting time cost of the EV.
  • B
The final reshaping result De EV i ABC ~ of EV i is determined by the emotional thresholds α t Emo and Emo EV i at time t , as shown in Equation (31). Among them, α t Emo is determined by the standard deviation of the emotional intensity of all EVs at time t [39,40].
De EV i ABC ~ = 0 , Emo EV i < α t Emo 1 , Emo EV i α t Emo
α t Emo = x · S t
S t = i = 1 N t , c h a ABC , n + N t , swp ABC , n ( Emo EV i Emo - EV ) 2 / N t , c h a ABC , n + N t , swp ABC , n 1
Emo - EV = i = 1 N t , c h a ABC , n + N t , swp ABC , n Emo EV i / N t , c h a ABC , n + N t , swp ABC , n
where x is an empirical multiple. S t is the standard deviation at time t . Emo - EV is the emotional mean of the EV at time t . N t , c h a ABC , n is the number of charging EVs arriving at the ICSS at time t . N t , swp ABC , n is the number of swapping EVs arriving at the ICSS at time t .
Before the conversion, the estimated waiting time and costs associated with each EV were calculated for both before and after conversion scenarios. Subsequently, these costs and conversion reward funds were integrated into emotional intensity indicators using the ABC model of attitude. Finally, the results of EV reshaping were obtained by comparing them to the α t Emo . Figure 1 provides a flowchart that illustrates this process.

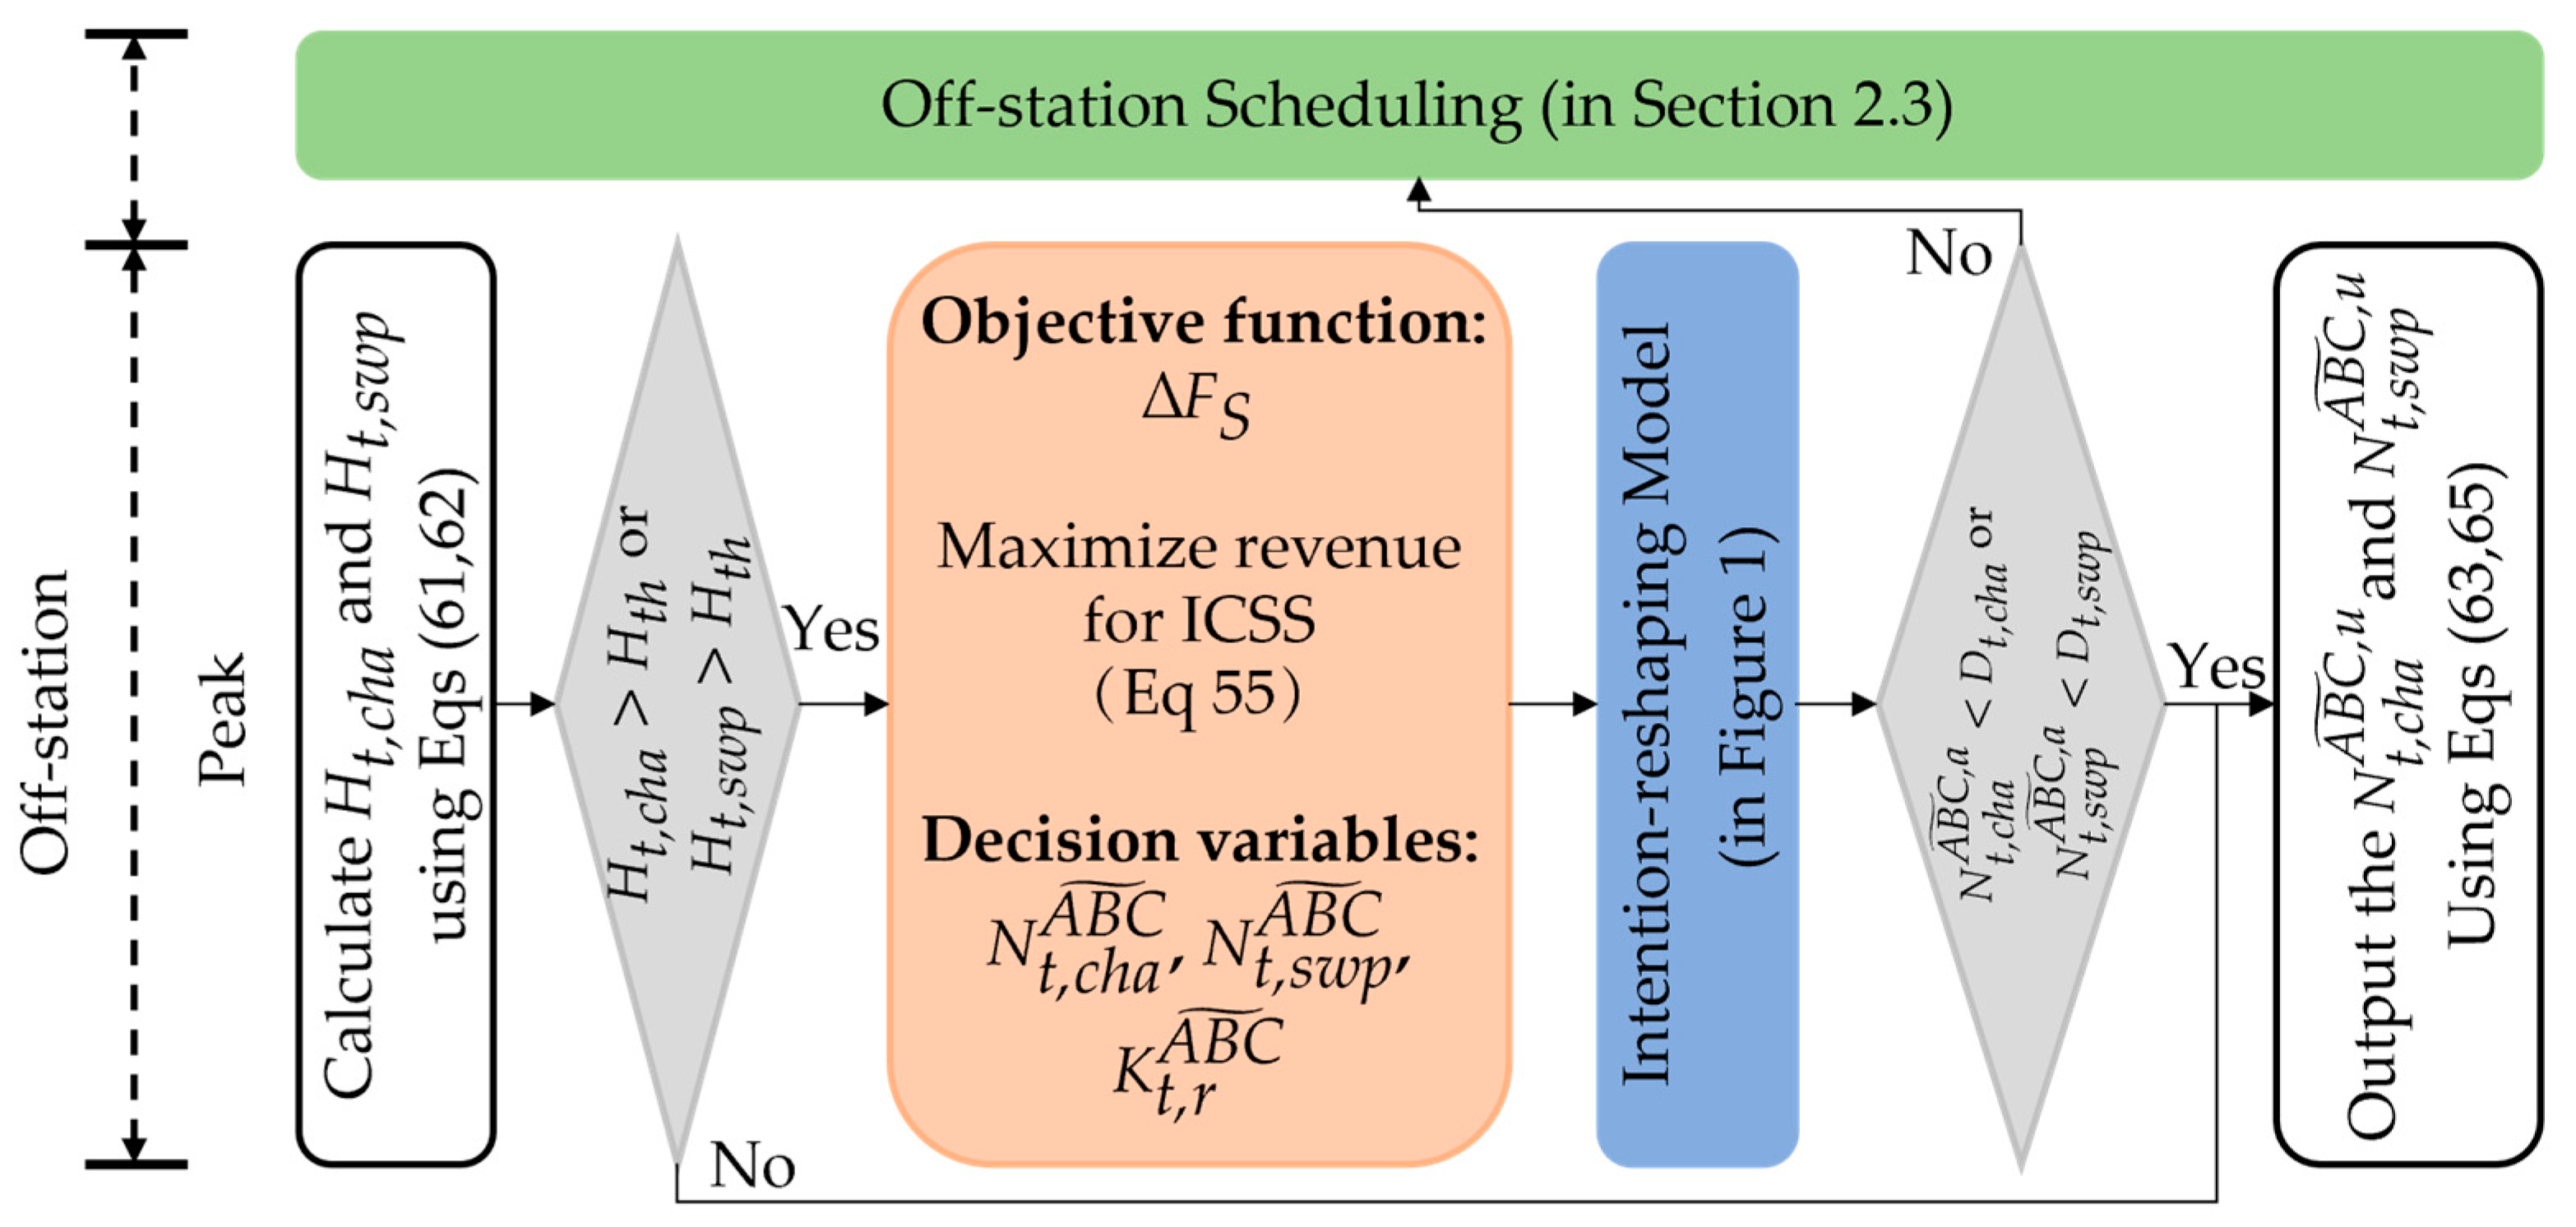
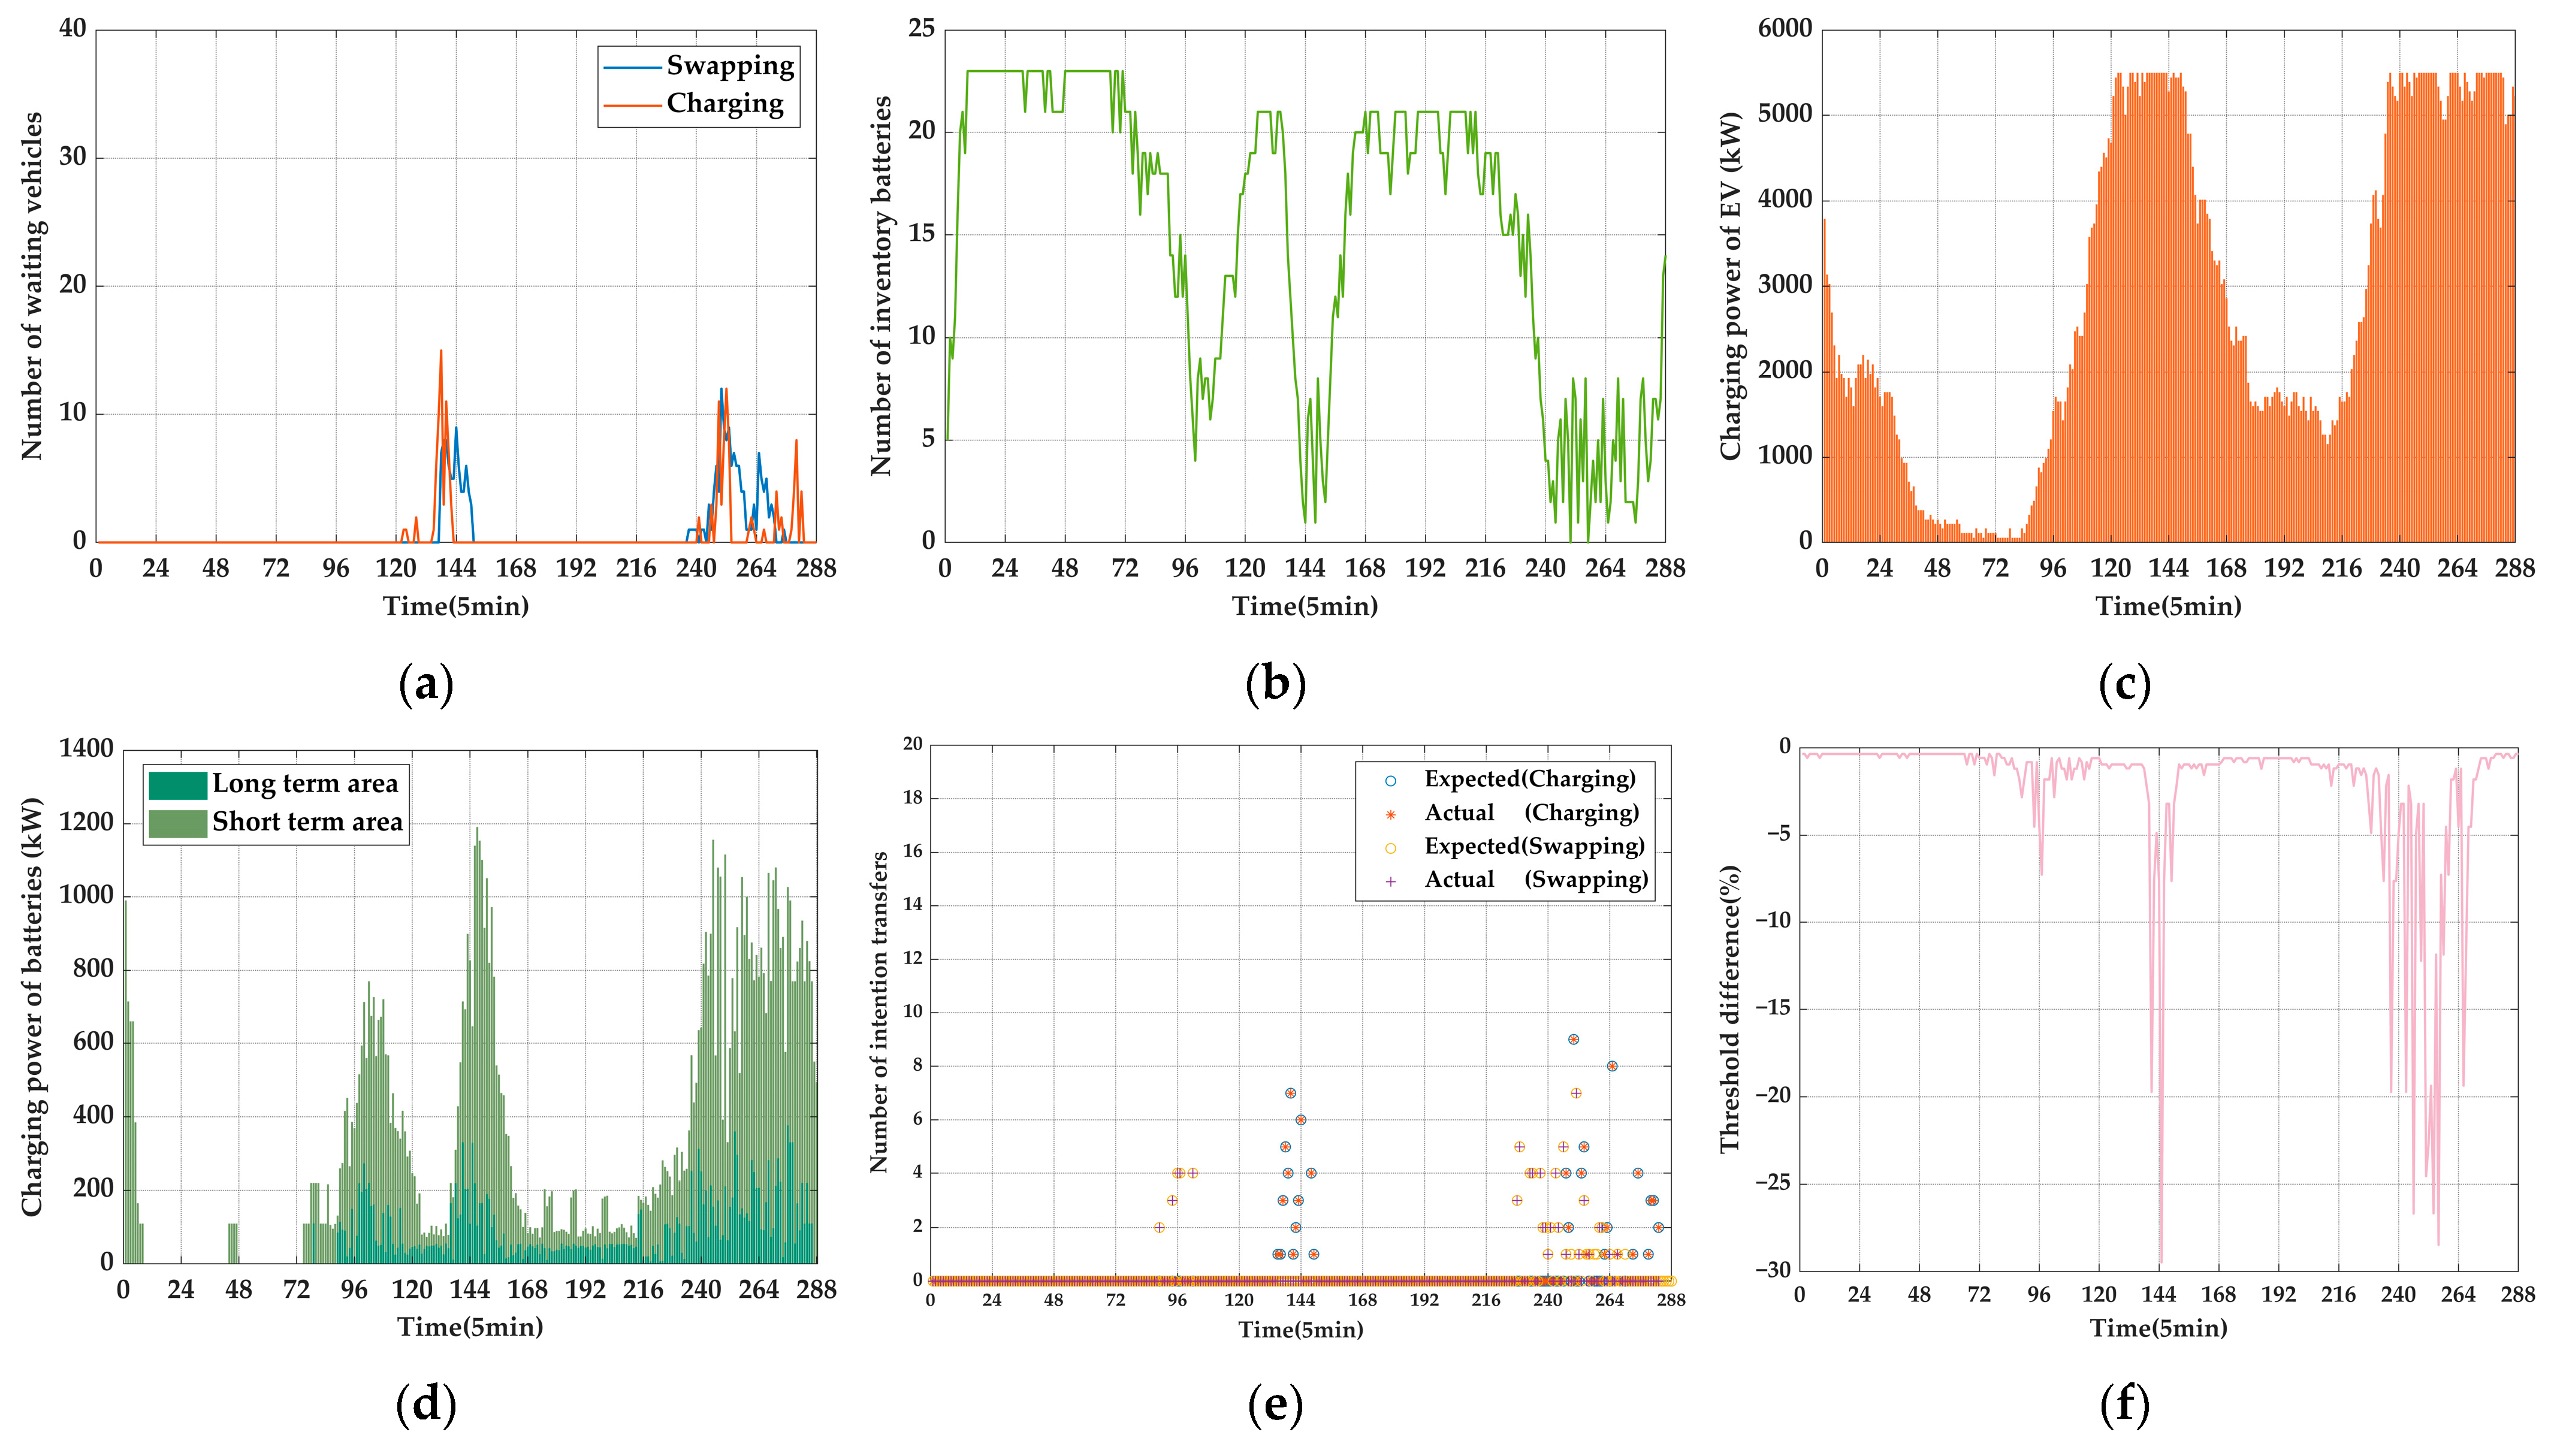
2.3. Off-Station Scheduling Model Based on Vehicle and Road Conditions

This section proposes an innovative off-station scheduling model that considers vehicle and road conditions. This model’s purpose is to address the long-term idling issue of CAS equipment during off-peak hours, which results in reduced revenue for ICSSs. By accounting for vehicle and road conditions, this model ensures availability and the timely scheduling of EVs.
To ensure that scheduled EVs have sufficient SOC reserves for CAS, the current SOC of all EVs in the scheduling area is first screened, as shown in Equation (35). Next, for each EV that passes the vehicle condition screening, the estimated arrival time, T t EV i , is calculated based on the distance d from its current location to the ICSS, along with real-time road congestion conditions, as shown in Equation (36). If the estimated arrival time T t EV i of the EV i is less than or equal to the latest allowable time T min , the EV i is considered schedulable; otherwise, it will be excluded. This process is designed to ensure timely scheduling.
SOC min OS SOC t EV i SOC max OS
T t EV i = V t , b EV V t , a EV · d V t , a EV
where SOC t EV i is the SOC of EV i at time t . SOC min OS is the lower limit of SOC for dispatching EVs off-station. SOC max OS is the upper limit of SOC for dispatching EVs off-station. V t , b EV is the reference speed. V t , a EV is the average driving speed.
Once the screening is complete, the ICSS sends DR information to all dispatchable EVs, including the number of charging demands N t , c h a DR and swapping demands N t , swp DR at time t , as shown in Equations (37) and (38). Upon receiving the invitation, intentional EVs need to promptly provide feedback to the ICSS regarding their preferred CAS methods, while EVs without intention need to submit a rejection response. Throughout this process, after each dispatchable EV makes a decision, the ICSS immediately updates the demand information until the demand reaches zero or all dispatchable EVs have finalized their decisions.
N t , c h a DR = N t 1 , cha id + N t 1 , cha l
N t , swp DR = min N swp , N t , in BMS ~
where N t 1 , cha id is the number of idle charging piles at time t 1 . N t 1 , cha l is the number of EVs leaving the CS at time t 1 .

3. Battery Compartment Management

Battery swapping, characterized by high efficiency and convenience, has gained widespread recognition, and the construction of ICSSs is progressing rapidly [1,30]. However, improper battery management could easily lead to shortages of battery supply during peak swapping periods, resulting in ICSS congestion [20]. Additionally, faced with fluctuations in tariffs, blind and unrestrained charging operations will inevitably increase the overall operating costs of ICSS.

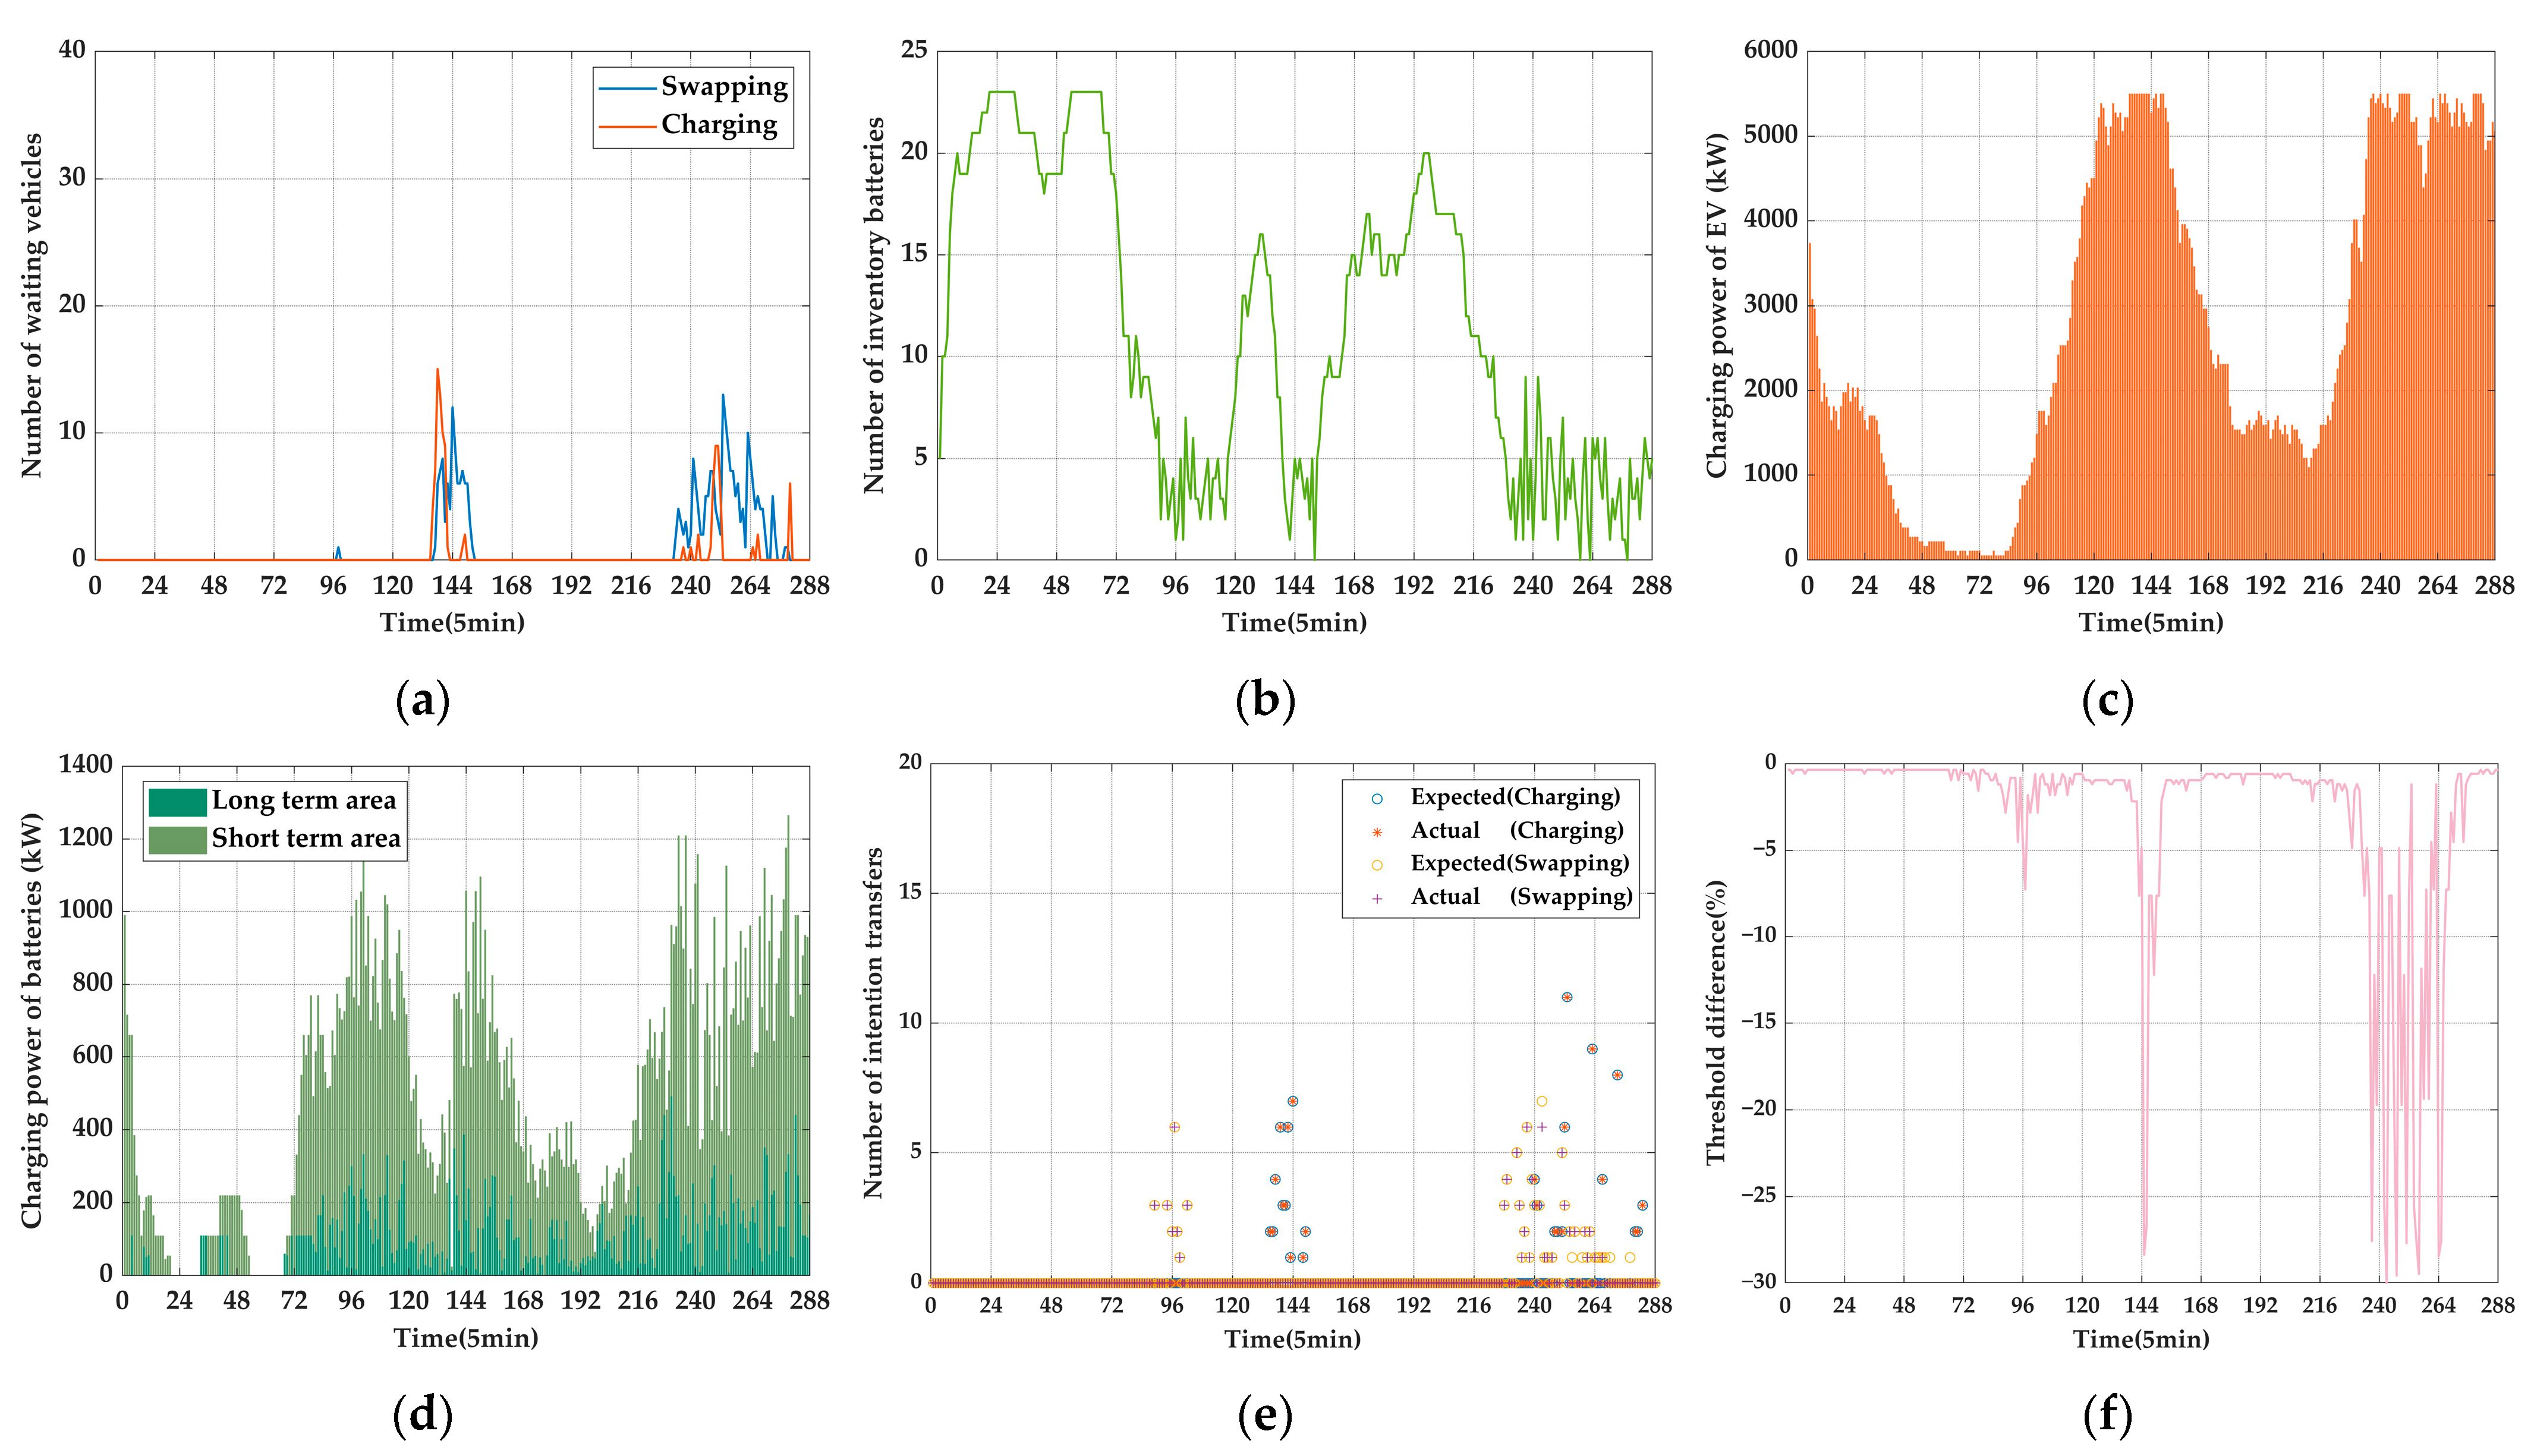
3.1. Battery Threshold Adjustment Strategy

This section proposes a flexible SOC threshold adjustment strategy designed to address issues such as battery shortages, ICSS congestion, and economic decline, which result from traditional fixed thresholds’ inability to adapt to fluctuations in battery swapping demand.
To achieve this, an SOC threshold adjustment model was developed using the number waiting for swapping N t , swp ABC ~ , w and the swapping tariff K t swp at time t as key indicators, as shown in Equation (39). This model could be flexibly adjusted to incorporate batteries with SOC slightly below the original threshold into the replaceable category, thereby mitigating battery supply shortages during peak swapping periods.
SOC t , t h BMS ~ = SOC t h BMS ω N · SOC t , N BMS ~ + ω K · SOC t , K BMS ~
SOC t , N BMS ~ = α N · e x p b N · N t , swp ABC ~ , w SOC t , K BMS ~ = α K · e x p c K · K t swp
where SOC t h BMS ~ is the adjusted battery threshold. SOC t h BMS is the standard threshold. ω N and ω K are weight coefficients. SOC t , N BMS ~ is the threshold change caused by N t , swp ABC ~ , w . SOC t , K BMS ~ is the threshold change caused by K t swp . α N and α K are the adjustment forces of the threshold change. b N and c K are the rates of change for the function.

3.2. Charging Strategy for Battery Compartment

This section proposes an innovative battery charging strategy designed to address the issue of blind and unrestrained charging, which leads to rising costs for ICSSs [22].
The batteries are classified as available for sale if the SOC reaches the threshold SOC t , t h BMS ~ at time t . Conversely, batteries failing to reach the threshold are defined as rechargeable. Rechargeable batteries are categorized into long-term saleable A l and short-term saleable A s areas based on the time T B i th of charging to the threshold and the critical time T t h , as shown in Equations (41) and (42). The T t h is chosen by analyzing the connection between battery charging duration and SOC.
T B i th = SOC t , th BMS ~ SOC t , B i · SOH t , B i · E e B / P e , cha B · η e , cha B · t / 60 , i f : SOC t , th BMS ~ > SOC t , B i 0 , i f : SOC t , th BMS ~ SOC t , B i
B i ϵ A l , i f : T B i th T t h B i ϵ A s , i f : T B i th < T t h
where SOC t , B i is the SOC of the battery B i at time t . SOH t , B i is the SOH of the battery B i at time t . P e , cha B is the rated charging power of the battery. η e , cha B is the rated charging efficiency of the battery.
After completing the classification, batteries in the two areas should be sorted based on SOC from high to low. Then, utilizing the optimal charging powers, P t , A l BMS ~ , P t , A s BMS ~ (in Section 4), and P e , cha B , determine the number of batteries to charge for each area, N t , A l BMS ~ and N t , A s BMS ~ , as illustrated in Equations (43) and (44). Ultimately, considering the computation outcomes and battery rankings in each region, priority will be assigned to charging batteries with high SOC.
N t , A l BMS ~ = P t , A l BMS ~ / P e , cha B
N t , A s BMS ~ = P t , A s BMS ~ / P e , cha B

4. Economic Dispatch Model

Within the economic dispatch model, conversion reward funds and waiting times are designated as incentivizing factors to guide users to convert their CAS approaches, with congestion as a pivotal metric for assessing ICSS operational efficiency. A dispatch model, contingent on the ICSS’s location, is formulated to minimize congestion and waiting to sustain time at the most cost-effective incentive level.

4.1. Objective Function

The change in power sales revenue G t , s ABC ABC ~ of the ICSS at the time t before and after the conversion is composed of two parts: the change in power sales revenue G t , s , cha ABC ABC ~ on the CS and the change in power sales revenue, G t , s , swp ABC ABC ~ , on the SS, as shown in Equation (45).
G t , s ABC ABC ~ = G t , s , cha ABC ABC ~ + G t , s , swp ABC ABC ~
G t , s , cha ABC ABC ~ = K t cha · P e , cha EV · η e , cha EV · N t , c h a ABC ~ N t , c h a ABC + N 0 t , c h a ABC ~ , sus · t / 60 G t , s , swp ABC ABC ~ = K t swp · N t , swp ABC ~ N t , swp ABC · E - swp EV
where K t cha is the charging tariff at time t . N t , c h a ABC ~ is the number of charging EVs at time t , after the conversion. N t , c h a ABC is the number of charging EVs at time t , before the conversion. N t , swp ABC ~ is the number of swapping EV at time t , after the conversion. N t , swp ABC is the number of swapping EVs at time t , before the conversion. N 0 t , c h a ABC ~ , sus is the number of EVs that have converted from 0 to t and are still charging continuously. K t swp is the swapping tariff at time t . E - swp EV is the average battery swapping capacity of EVs.
The change in purchasing cost C t , b ABC ABC ~ , BMS BMS ~ of the ICSS at time t is composed of the change in purchasing cost C t , b , cha ABC ABC ~ on the CS before and after the conversion at time t , and the change in purchasing cost, C t , b , swp BMS BMS ~ , on the SS before and after the battery management, as shown in Equation (47).
C t , b ABC ABC ~ , BMS BMS ~ = C t , b , cha ABC ABC ~ + C t , b , swp BMS BMS ~
C t , b , cha ABC ABC ~ = K t NW · P e , cha EV · η e , cha EV · N t , c h a ABC ~ N t , c h a ABC + N 0 t , c h a ABC ~ , sus · t / 60 C t , b , swp BMS BMS ~ = K t NW · η e , cha B · P t , A l BMS ~ + P t , A s BMS ~ N tot B N t , in BMS · P e , cha B · t / 60
where K t NW is the tariff of the network at time t . N tot B is the total number of batteries in the battery compartment. N t , in BMS is the number of inventory batteries at time t , before the conversion.
The change in conversion reward funds C t , r ABC ABC ~ of the ICSS at time t before and after the conversion is composed of the unit conversion reward funds and the number of conversions at time t , as shown in Equation (49).
C t , r ABC ABC ~ = K t , r ABC ~ · N t , c h a ABC ~ N t , c h a ABC + N t , swp ABC ~ N t , swp ABC
where K t , r ABC ~ is the unit price of the conversion reward funds at time t .
The change in battery depreciation cost C t , d ABC ABC ~ , BMS BMS ~ of the SS at time t is composed of two parts: the depreciation C t , d , cha ABC ABC ~ caused by the change in the number of charging EVs on the CS and the depreciation, C t , d , swp BMS BMS ~ , caused by the change in charging power after battery management on the SS, as shown in Equation (50).
C t , d ABC ABC ~ , BMS BMS ~ = C t , d , cha ABC ABC ~ + C t , d , swp BMS BMS ~
C t , d , cha ABC ABC ~ = K d B · η e , cha EV · P e , cha EV · N t , c h a ABC ~ N t , c h a ABC · t / 60 C t , d , swp BMS BMS ~ = K d B · η e , cha B · P t , A l BMS ~ + P t , A s BMS ~ N tot B N t , in BMS · P e , cha B · t / 60
where K d b is the unit depreciation cost of the battery.
The weighted sum of the change in congestion on the CS H t ABC ABC ~ and the change in congestion on the SS H t , swp ABC ~ constitutes the comprehensive congestion change H t ABC ~ of the ICSS at time t , as shown in Equation (52).
H t ABC ABC ~ = ω t , c h a ABC ~ · H t , c h a ABC ABC ~ + ω t , swp ABC ~ · H t , swp ABC ABC ~
H t , c h a ABC ABC ~ = N t , c h a ABC ~ , w N t , c h a ABC , w / N t , c h a ABC ~ , R N t , c h a ABC , R H t , swp ABC ABC ~ = N t , swp ABC ~ , w N t , swp ABC , w / N t , swp ABC ~ , R N t , swp ABC , R
where ω t , c h a ABC ~ and ω t , swp ABC ~ are the weights on both sides for CAS.
Managers may feel uneasy due to concerns about insufficient inventory affecting production and sales. The change in inventory anxiety level, A t , n BMS BMS ~ , before and after battery management is related to the decrease in inventory batteries at time t , as shown in Equation (54).
A t , i n BMS BMS ~ = exp β c · N t , i n BMS ~ N t , swp ABC ~ , w N t , i n BMS N t , swp ABC , w / N tot B
where β c is the speed factor. N t , n BMS ~ is the battery inventory at time t after the conversion.
Considering the above factors, the objective function F S of the ICSS is as follows:
Min :   F S = G t , s ABC ABC ~ + C t , b ABC ABC ~ , BMS BMS ~ + C t , r ABC ABC ~ + C t , d ABC ABC ~ , BMS BMS ~ + ω H · H t ABC ABC ~ + ω A · A t , n BMS BMS ~
where ω H is the crowding coefficient. ω A is the anxiety coefficient.

4.2. Constraint

0 N t , c h a ABC ~ N t , c h a ABC 0 N t , swp ABC ~ N t , swp ABC N t , c h a ABC ~ + N t , swp ABC ~ = N t , c h a ABC + N t , swp ABC
ω t , c h a ABC ~ + ω t , swp ABC ~ = 1
0 P t , A l BMS ~ P e , c h a B · N t , A l BMS ~ 0 P t , A s BMS ~ P e , c h a B · N t , A s BMS ~
N t , A l BMS ~ + N t , A s BMS ~ = N tot B
α · K - t , l ABC ~ K t , r ABC ~ β · K - t , l ABC ~

5. Two-Stage Scheduling Strategy Based on In-Station and Off-Station Scheduling

In the on-station scheduling phase, the first step is to calculate the congestion levels H t , c h a and H t , swp of the two CAS queues at time t , as shown in Equations (61) and (62). If H t , c h a and H t , swp are below the crowding threshold H th , it is considered non-crowded, and the EVs on both sides could be CAS in the predetermined order. On the contrary, if either H t , c h a or H t , swp exceeds the threshold H th , it is determined that there is congestion, and the EV needs to be scheduled reasonably according to the strategy described in Section 2.2.
H t , c h a = N t , c h a ABC ~ , w / N t , c h a ABC ~ , R
H t , swp = N t , swp ABC ~ , w / N t , swp ABC ~ , R
In the scheduling process, EVs arriving at the ICSS at time t are regarded as entities to be scheduled. They receive various information, including the queue order provided by the ICSS (Section 2.1), estimated waiting times and costs before and after the conversion (Section 2.2.1), and conversion reward funds for accepting the conversion (Section 4). This information includes stimulating factors and is integrated into more intuitive emotional indicators using the ABC model of attitude (Section 2.2). Each EV independently decides whether to convert its intentions based on its emotional evaluation results and preset emotional thresholds.
After the conversion is completed, based on the EV conversion result, the final number of conversions, N t , cha ABC ~ , u and N t , swp ABC ~ , u , on both sides will be obtained by comparing the expected number of conversions, N t , cha ABC ~ and N t , swp ABC ~ , from the ICSS with the actual number of conversions, N t , cha ABC ~ , a and N t , swp ABC ~ , a , from the EV. If the N t , cha ABC ~ , a or N t , swp ABC ~ , a equal or exceed N t , cha ABC ~ or N t , swp ABC ~ , select EVs with a high intention as conversion EVs. If the actual N t , cha ABC ~ , a or N t , swp ABC ~ , a is below N t , cha ABC ~ or N t , swp ABC ~ but within an acceptable range, D t , cha or D t , swp , the conversions will proceed based on the N t , cha ABC ~ , a or N t , swp ABC ~ , a . If the discrepancy in the number of conversions is significant, employ the off-station scheduling model described in Section 4 to address the shortfall. After the above process is completed, the queues on both sides of the CAS will be updated, and the charging and swapping will be carried out in sequence according to the updated queue order.
N t , cha ABC ~ , u = N t , cha ABC ~ , i f : N t , cha ABC ~ , a N t , cha ABC ~ N t , cha ABC ~ , a , i f : D t , cha N t , cha ABC ~ , a < N t , cha ABC ~ Off-station   scheduling , i f : e l s e
D t , cha = α t , cha · N t , cha ABC ~ , e N t , cha ABC ~ , a
N t , swp ABC ~ , u = N t , swp ABC ~ , i f : N t , swp ABC ~ , a N t , swp ABC ~ N t , swp ABC ~ , a , i f : D t , swp N t , swp ABC ~ , a < N t , swp ABC ~ Off-station   scheduling , i f : e l s e
D t , swp = α t , swp · N t , swp ABC ~ N t , swp ABC ~ , a
Figure 2 illustrates the two-stage scheduling process.
This paper coordinates the demand for CAS through the intention-reshaping model to alleviate ICSS congestion, constructs a threshold adjustment model to ensure the stable supply of inventory batteries, and designs a charging strategy based on charging time zoning to optimize the efficiency of the battery compartment. The coupling of multiple models results in complex characteristics of the objective function. The NGO has strong global search capabilities, fast convergence speed, and good robustness, making it suitable for solving complex scheduling optimization problems [41,42]. However, there is still room for further optimization in the initial position setting of the population for this algorithm. To this end, this paper introduces the refraction reverse learning strategy to initialize the population, aiming to improve the randomness and diversity of the population. The basic principle of the INGO is as follows:
The first stage is the prey recognition stage. The northern eagle will randomly select prey and launch rapid attacks, aiming to explore the search space to locate the global optimal area. The mathematical model of this process is shown in Equations (67)–(70).
x i , j = ub j + lb j / 2 + ub j + lb j / 2 · h rand · ub j lb j + lb j / h
P i = X k , i = 1 , 2 , · · · , N , k = 1 , 2 , · · · , i 1 , i + 1 , · · · , N
x i , j new , P 1 = x i , j + r · p i , j I · x i , j , F p i < F i x i , j + r · x i , j p i , j , F p i F i
X i P 1 = x i new , P 1 , F i new , P 1 < F i X i , F i new , P 1 F i
where x i , j is the initial position of the northern eagle. ub and lb are the upper and lower limits of the decision variable, respectively. h is the refractive index. P i is the prey location selected by the i -th eagle. F p i is the objective function value corresponding to the position of the prey. k is a random number. x i new , P 1 is the new state of the i -th individual after the first stage update. x i , j new , P 1 is the specific manifestation of the new state in the j -th dimension. F i new , P 1 is the objective function value of the solution in the first stage.
The second stage is the chase and escape phase. At this stage, prey will attempt to escape, while northern eagles will continue to chase and eventually capture them. This stage aims to enhance the local search capability of the algorithm. The mathematical model of this process is shown in Equations (71) and (72).
x i , j new , P 2 = x i , j + 0.02 · 1 t T
X i P 2 = x i new , P 2 , F i new , P 2 < F i X i ,               F i new , P 2 F i
where t is the number of iterations. T is the maximum number of iterations. x i new , P 2 is the new state of the i -th proposed solution. x i , j new , P 2 is the j -th dimension in this state. F i new , P 2 is the objective function value for the second stage.
In this paper, the INGO method is chosen to solve the economic model in Section 4, utilizing Equation (55) as objective functions. The solving process is outlined below:
Step1:
Set the number of swarms N and iterations T ;
Step2:
Set upper and lower limits for variables N t , cha ABC ~ , N t , swp ABC ~ , K t , r ABC ~ ,  P t , A s BMS ~ , and P t , A l BMS ~ ;
Step3:
Generate the x i , j of the northern eagle and the position P i of the prey;
Step4:
Calculate initial fitness F S ini of each x i , j by Section 4.1;
Step5:
Update the X i P 1 of each eagle after the first stage according to Equation (69);
Step6:
Update the X i P 2 of each eagle after the second stage according to Equation (71);
Step7:
Calculate the updated F S new and save the best solution found so far;
Step8:
Repeat steps 3 and 7 until the desired number of iterations is reached;
Step9:
Output the optimal solution obtained by the INGO algorithm.

6. Case Study

6.1. Simulation System

This paper constructs an ICSS model and sets a specific case based on it. Assuming there is a daily demand for CAS 2000 EVs in a certain area, an analysis of the current market inventory indicates that 1740 EVs are inclined towards charging, whereas the remaining 260 opt for swapping [43,44,45,46]. Additionally, considering the current ratio of CAS infrastructure to EVs, the ICSS is equipped with 100 charging piles, a swapping facility with three machines, and 23 backup batteries [47]. The technical specifications of the CAS apparatus and batteries are detailed in Table 2 [13,14,22,23,24]. The sample interval was set at 5 min over a 24 h period.
This paper utilizes the vehicle-batteries separation operation mode, where the ICSS leases batteries to users while retaining ownership. In operation, the ICSS serves as an intermediary between the network and users, profiting from the tariff difference between power purchase and sale. Nonetheless, due to ownership, the ICSS must cover the battery’s depreciation cost. Furthermore, the ICSS is responsible for the conversion reward fund during the intention reshaping. The above parameters are shown in Table 3 [12,13,22,24].
The Blue Book [48] highlights the challenges posed to ICSSs by users’ CAS behavioral and cognitive differences, including congestion and economic impacts. To tackle these challenges, the paper proposed a set of measures in Table 4. Case 1 involves the ICSS‘s standard operation. Case 2 focuses on alleviating ICSS congestion via intention reshaping. Case 3 utilizes the proposed battery management strategy to alleviate congestion from a limited battery supply. Case 4 aims to boost ICSS revenue through off-station scheduling.

6.2. Results Analysis

The simulation experiment in this paper is based on the following computing environment: Hardware platform: A computer equipped with an Intel Core i7-12700H processor, 32 GB DDR4 memory, and 1 TB NVMe solid-state drive is used to ensure the efficiency and stability of large-scale optimization model solving. Software tools: Algorithm development and simulation analysis are based on MATLAB R2022a, and experimental data visualization is achieved through the MATLAB drawing module.

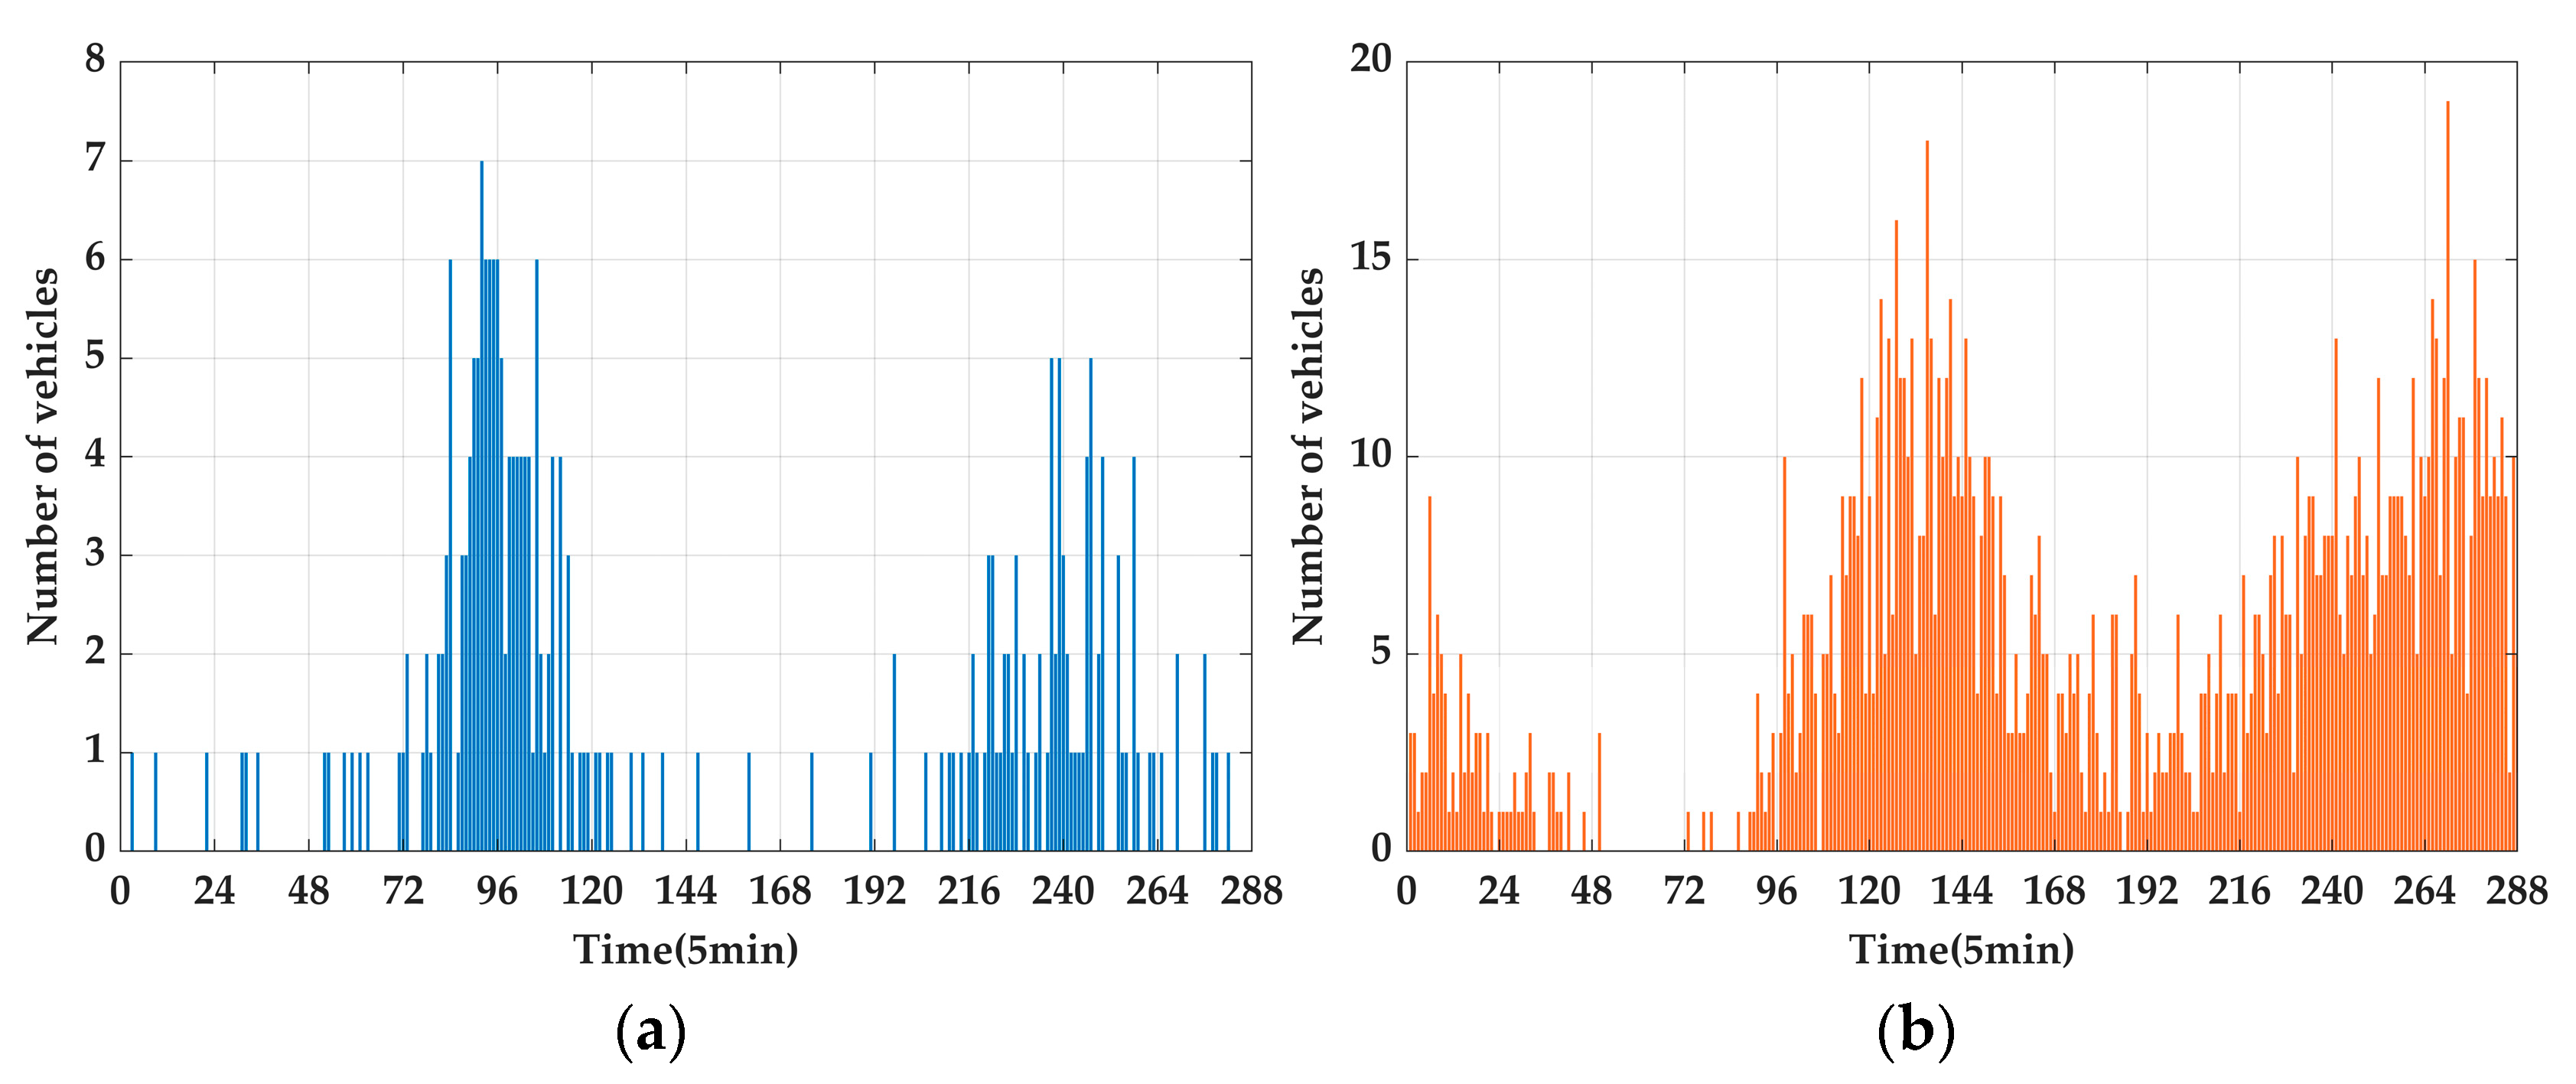
6.2.1. The ICSS’s Number of EVs Prediction Results

This paper aims to predict the ICSS’s number of EVs during different periods; therefore, only the ICSS starting time is selected as a feature factor to consider [49]. Meanwhile, the Monte Carlo algorithm is used for accurate prediction [50,51,52,53].
The prediction of EV numbers for the ICSS is illustrated in Figure 3. The figure reveals a bimodal distribution of EV numbers on both sides of the ICSS, indicating the existence of congestion risk. Notably, the swapping start time was around 6:00 a.m., which was approximately 2 h earlier than the charging start time, generally beginning at 8:00 a.m. Additionally, the duration of the swapping peak is about 4 h, which is about 2 h shorter than the duration of the charging peak. The above results indicate that there is fault tolerance during ICSS peak periods in terms of time.

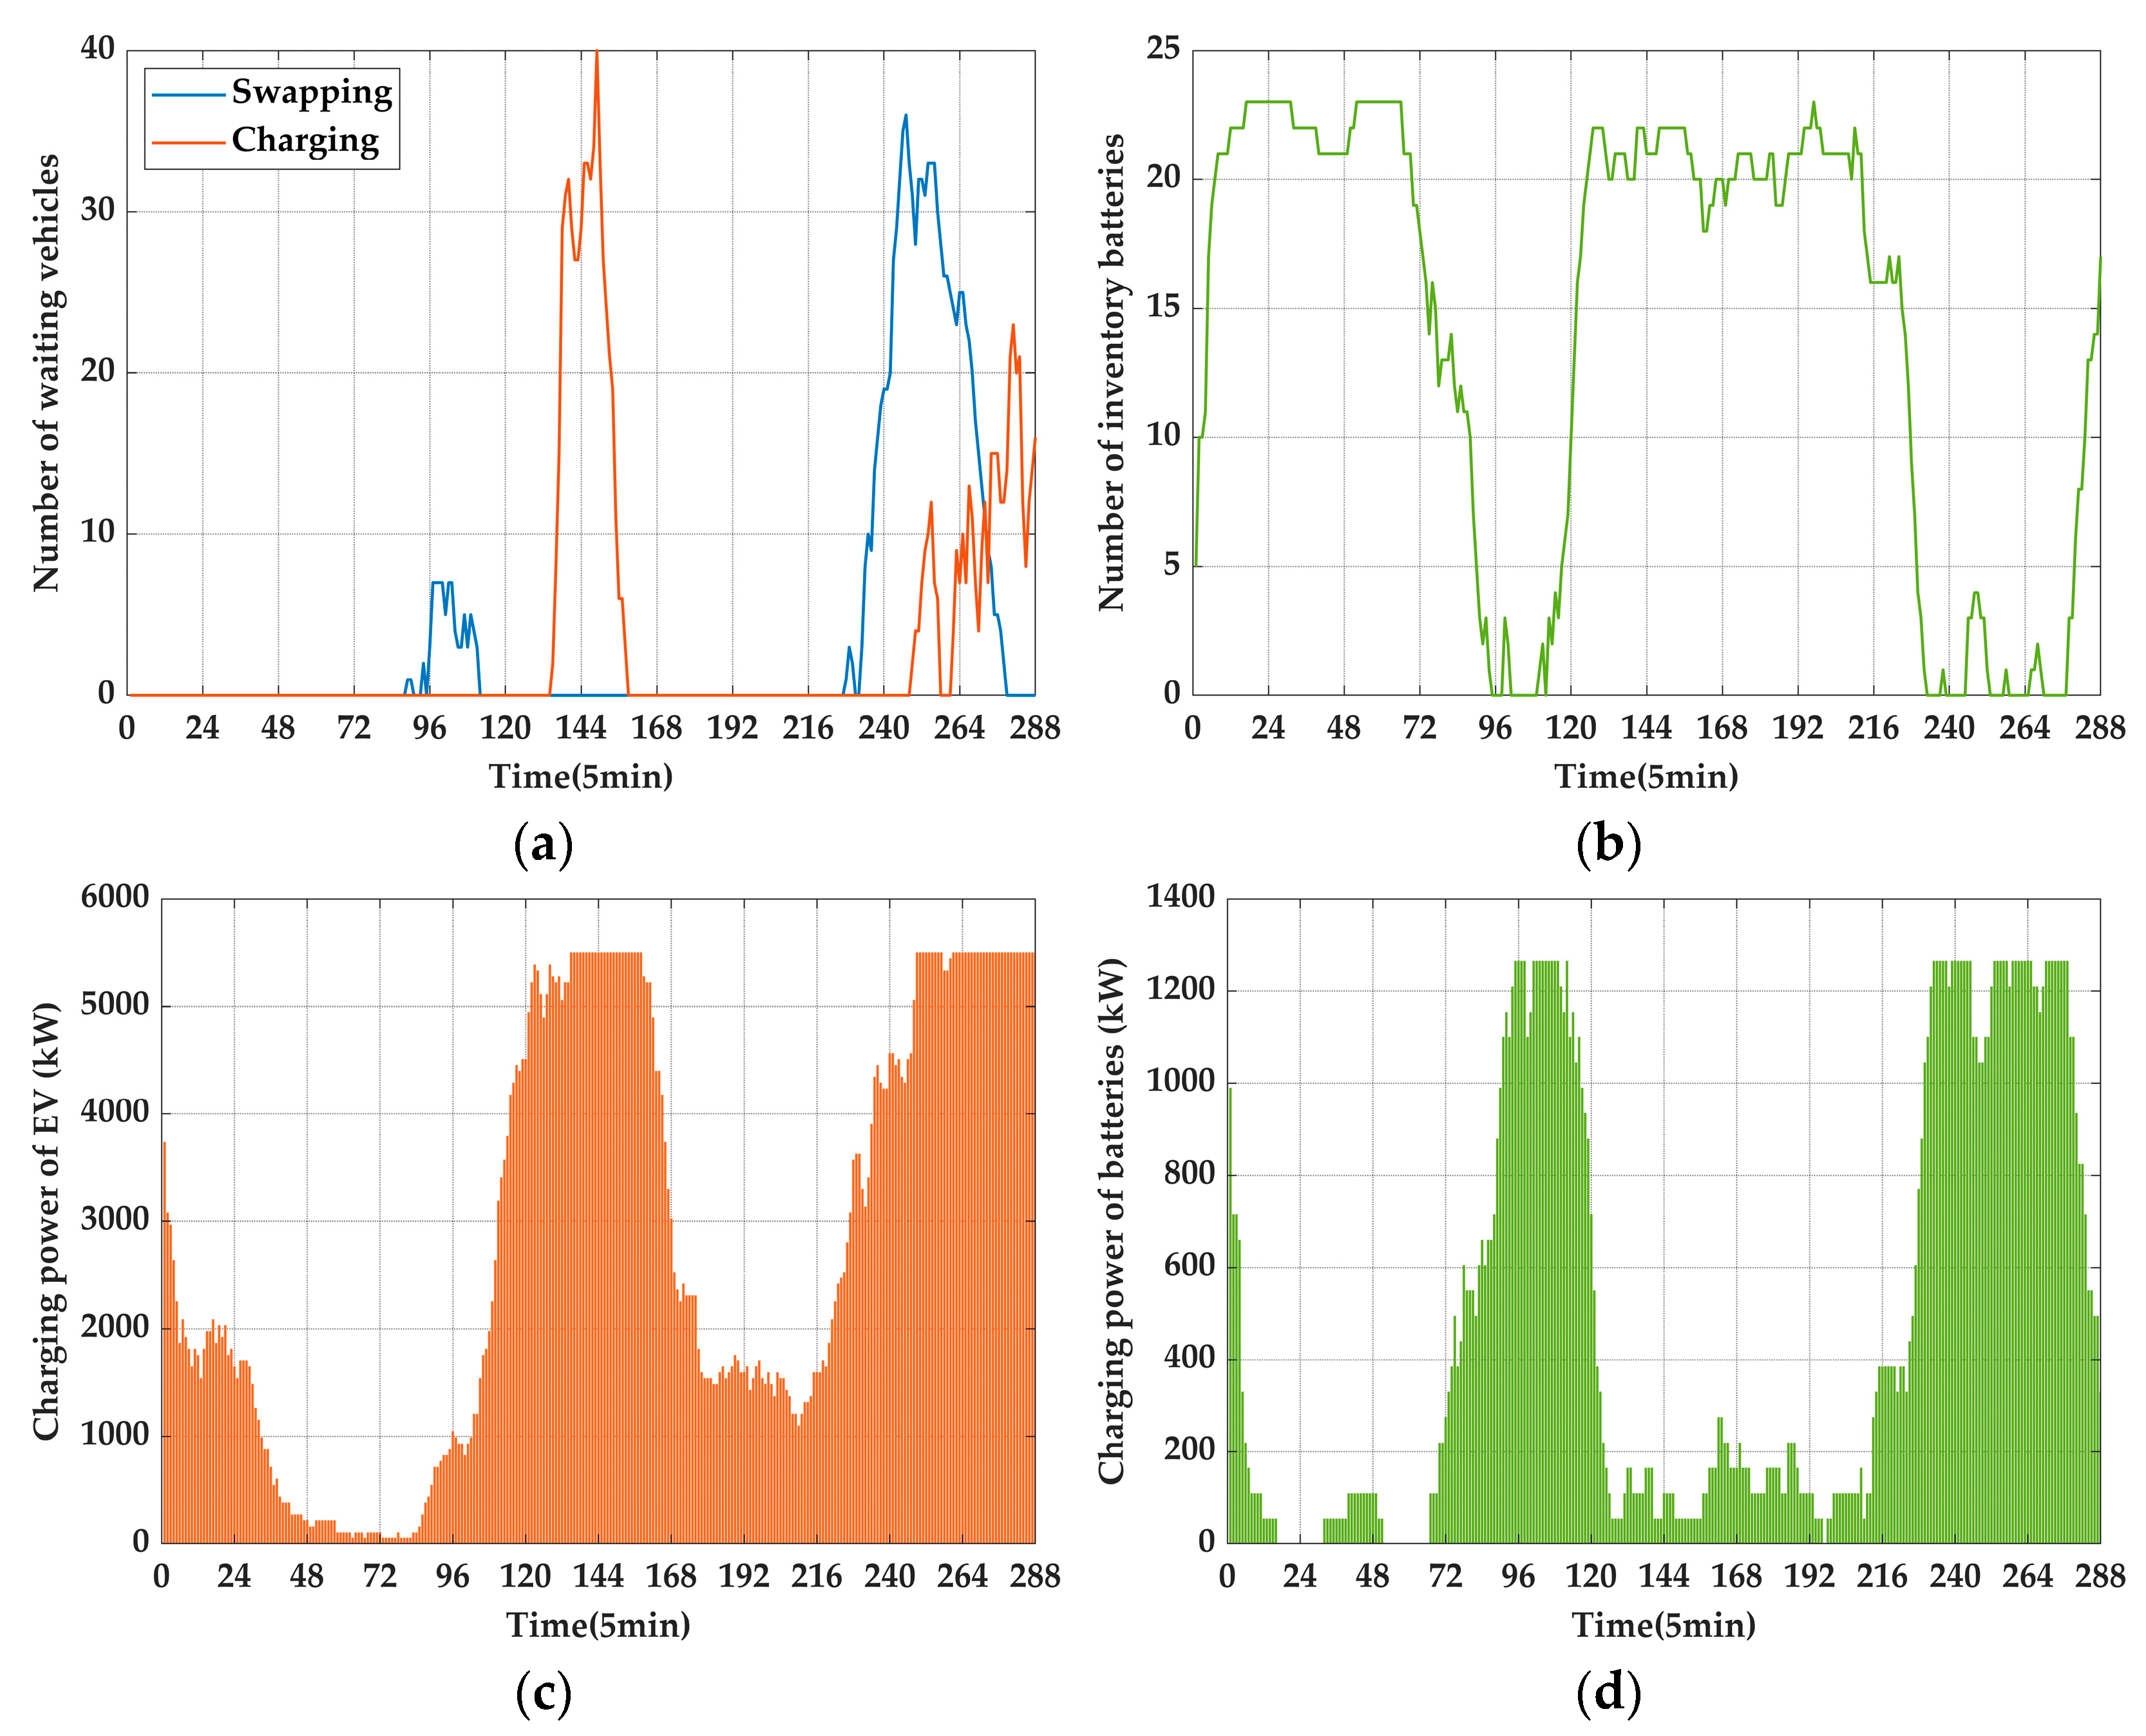
6.2.2. Results and Analysis
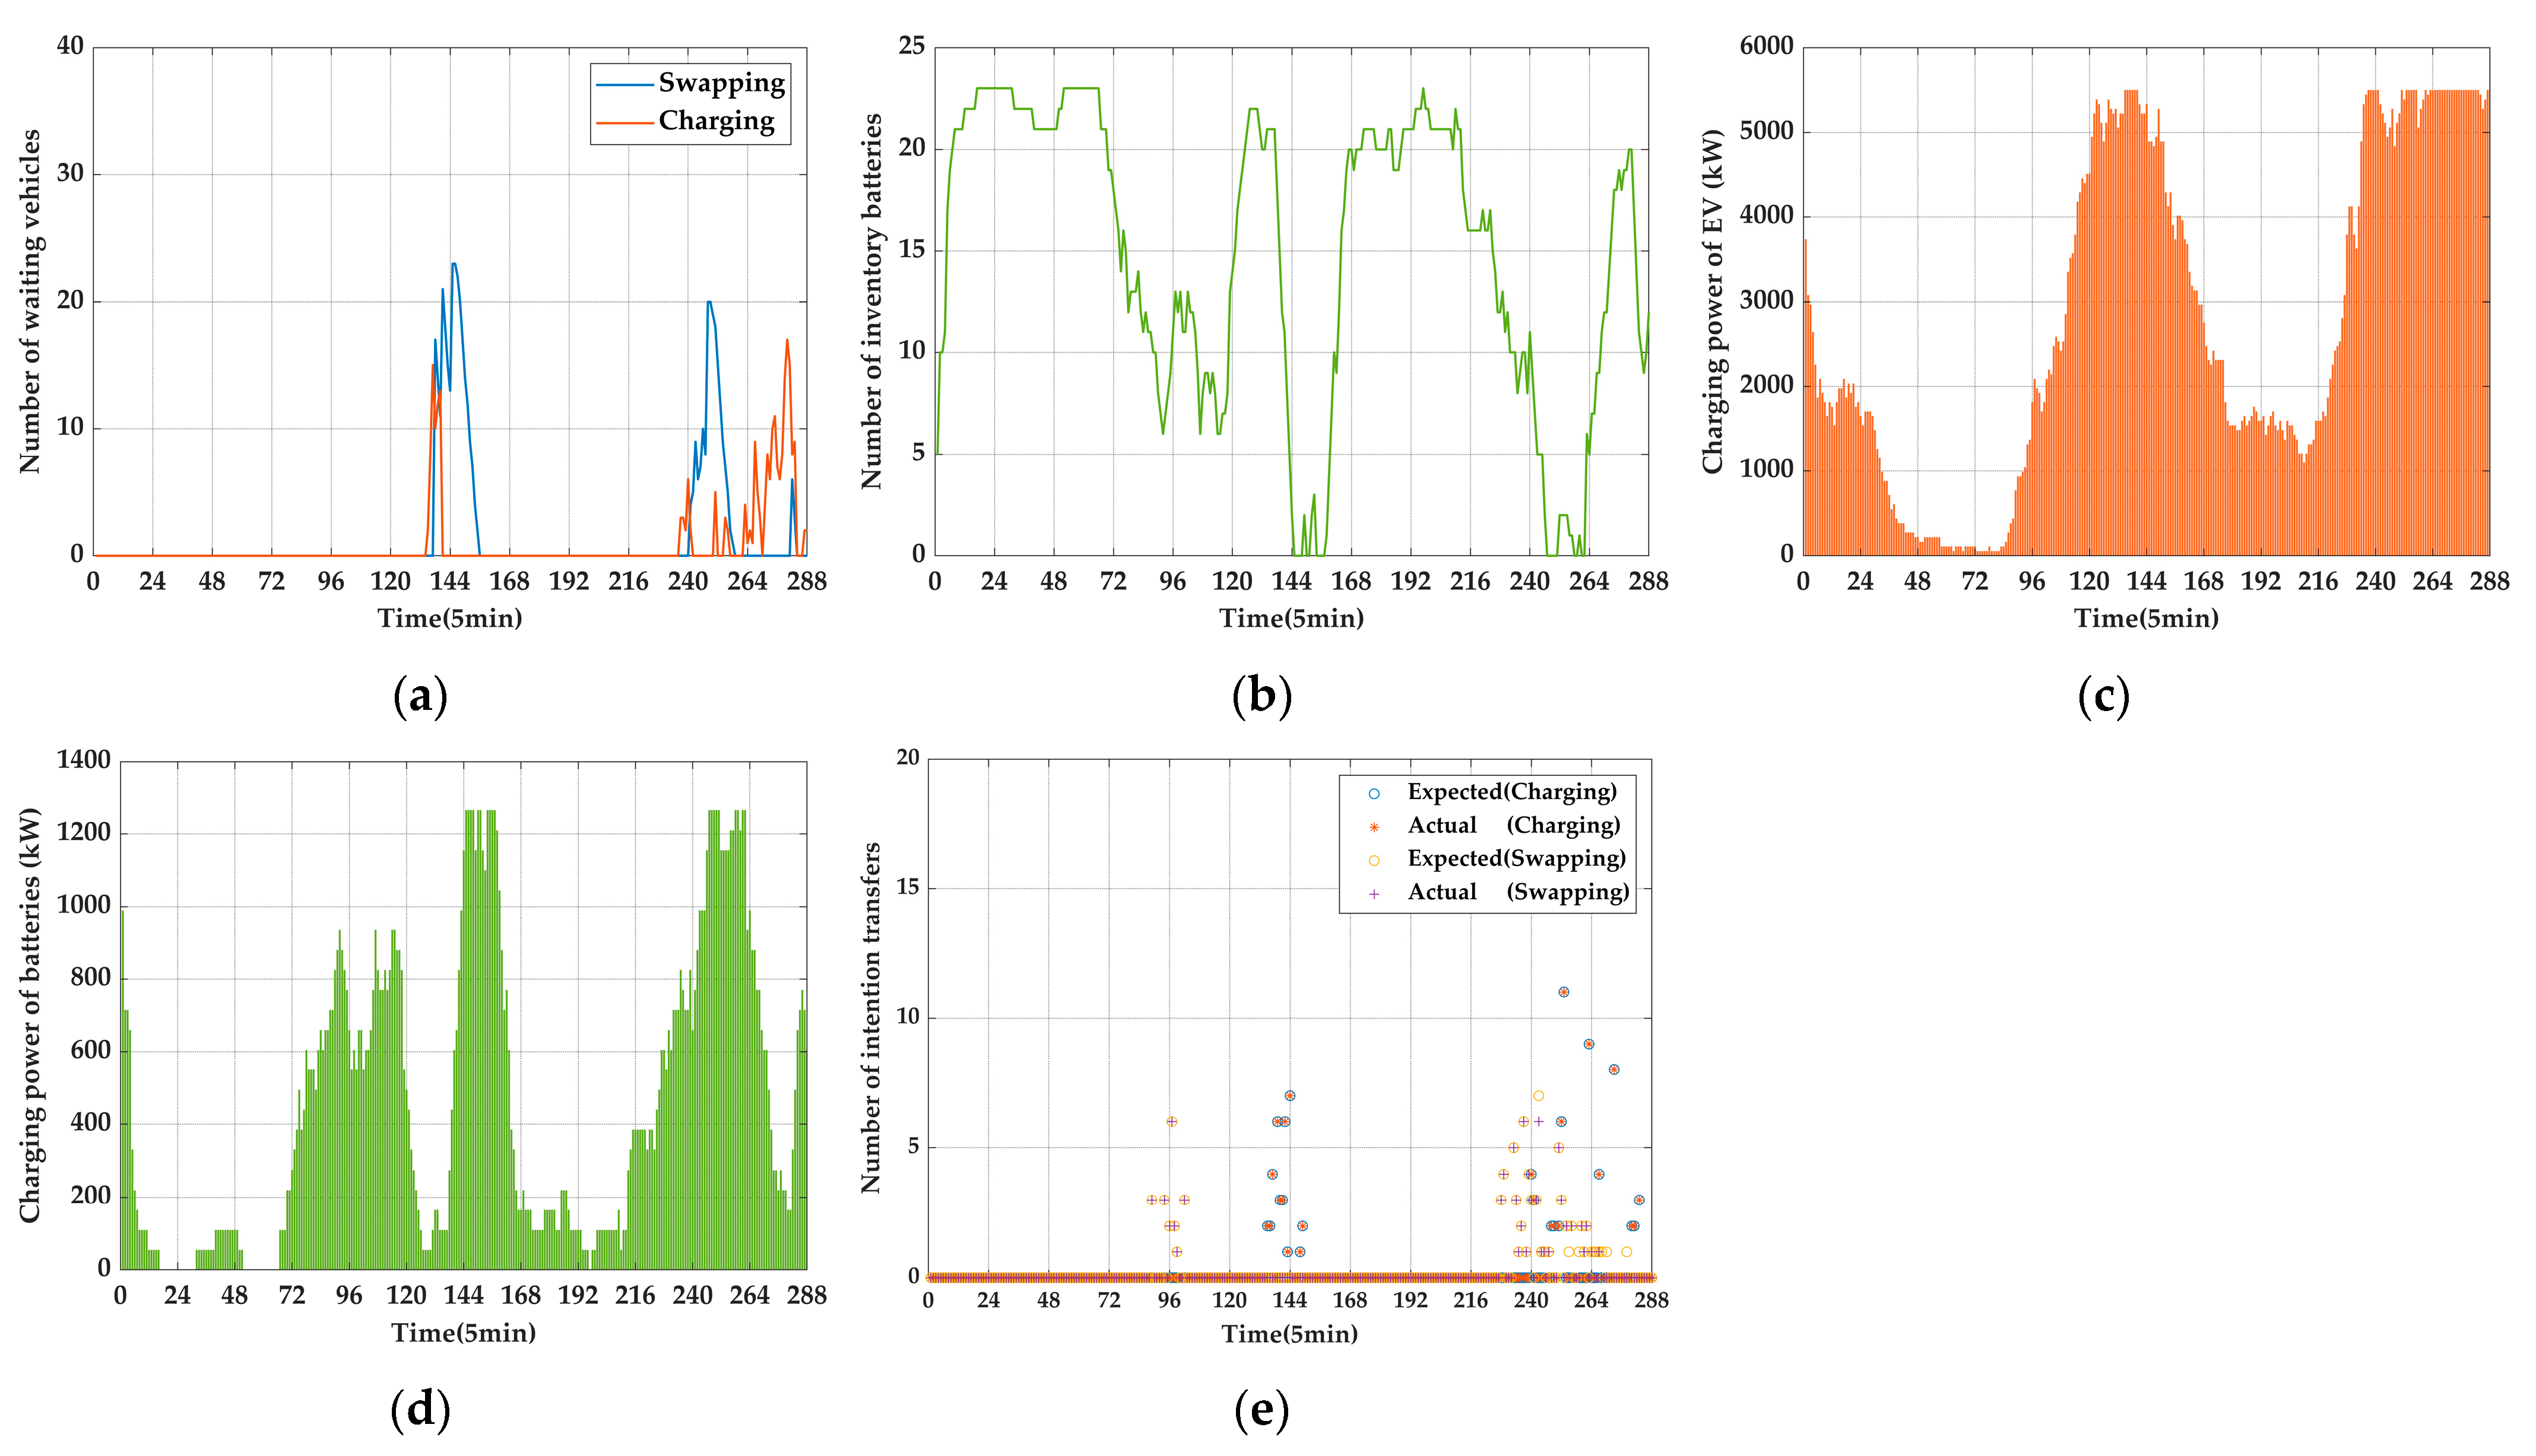
  • Case 1
Case 1 presents the operation of the ICSS in its natural state. In this case, batteries with an SOC above 90% are defined as inventory batteries for swapping services, while batteries with an SOC below 90% are always charging.
Figure 4a illustrates congestion at the ICSS under natural operating conditions. Significant congestion occurs during CAS, with peak congested vehicles at 40 and 35. Congestion lasts approximately 5 and 6 h, representing 21% and 25% of the day. Congestion periods for CAS are not entirely synchronized, some overlap occurs between 245 and 280 on the horizontal axis, while the remaining time reflects peak interlocking conditions, constituting 82% of total congestion time. This suggests the ICSS has substantial scheduling flexibility. Figure 4b displays battery inventory changes. Low or tight battery inventory periods last around 5 h, making up 21% of the day. A comparison of Figure 4a,b reveals an alignment between insufficient battery levels and swapping congestion, indicating that improper battery management causes congestion during these times.
Figure 4c,d show the EV charging power and the battery compartment charging power. Economic data for Case 1, calculated using the benefits and costs formula [22], are presented in Table 5.
  • Case 2
In Case 2, the ICSS adjusted its strategy using the intention reshaping in Section 2.2, utilizing the peak interlocking advantage of congestion periods to efficiently manage the demand for CAS.
Figure 5a illustrates the congestion status of the ICSS, after the conversion. A direct elimination of congestion during the initial battery swap (horizontal axis 90–110) was observed compared to Figure 4a. In addition, the coordination and collaboration of CAS significantly ameliorated congestion during other peak periods. Specifically, the reshaping strategy decreased peak congestion vehicles by approximately 55% and 34% on each side, and reduced congestion duration by about 1 h and 2 h, respectively. Figure 5b displays battery inventory changes, after the conversion. The period of low or near-full battery inventory in Figure 5b has shortened to around 3.5 h, constituting 15% of the day. Despite the improvement in battery inventory through coordinated CAS, swapping congestion due to insufficient inventory persists.
Figure 5c,d show the EV charging power and battery charging power, after the conversion. The economic data for Case 2, displayed in Table 6, indicate that after the conversion, the ICSS’s economic indicators remain largely steady compared to pre-reshaping, with a mere CNY 597.85 increase in total revenue. This outcome suggests that while willingness reshaping effectively coordinates ICSS habits, easing ICSS congestion, its impact on enhancing the stations’ economic benefits seems limited.
Figure 5e displays the outcomes of intention reshaping. Based on Equations (63) and (65) calculations, the variance between the anticipated and actual individuals transitioning between the CAS sides at any given time falls within an acceptable threshold, obviating the necessity for off-station scheduling.
  • Case 3
In Case 3, the ICSS flexibly adjusted the inventory battery threshold and optimized the management of battery charging methods based on the battery management strategy proposed in Section 3.
Figure 6a illustrates the congestion status of the ICSS, after battery management. In comparison to Figure 5a, the congestion level at the ICSS has notably decreased following the implementation of battery management. Specifically, the peak congested vehicles on each side reduced to 15 and 12, respectively, marking a reduction of around 35% and 33% from Case 2. This enhancement is credited to adequate battery inventory, which not only alleviates battery swapping congestion but also enhances scheduling flexibility for charging, thereby synergistically reducing congestion on the CS. Figure 6b displays inventory changes after the battery management strategy. In contrast to Figure 5b, efficient battery management has minimized insufficient inventory time from 3.5 h in Case 2 to just a few fleeting moments. This signifies a significant improvement in inventory status, ensuring consistent supply fulfillment.
Figure 6c,d depict the EV charging power and battery charging power, after battery management. The economic data for Case 3, as displayed in Table 7, reveal a reduction of CNY 2565.18 in electricity purchase costs for the ICSS, alongside a revenue increase of CNY 3037.63. This improvement stems from Case 3’s shift away from the indiscriminate charging methods of Cases 1 and 2, opting instead for charging prioritization based on current inventory and pricing. Figure 6e showcases the outcome of intention reshaping, while Figure 6f displays the impact of SOC threshold adjustment.
  • Case 4
Case 4 utilizes the proposed off-station scheduling to effectively manage off-station EVs.
Figure 7a illustrates the congestion status of the integrated ICSS, after the off-station dispatch. In contrast to Figure 6a, the peak congested vehicle count and congestion duration remain relatively stable following off-station scheduling. This is due to the scheduling being restricted to non-peak hours to prevent worsened congestion during peak times. Figure 7b displays battery inventory adjustments after the off-station scheduling, indicating that the battery inventory remains sufficient to meet the demand for consistent supply.
Figure 7c,d illustrate the EV charging power and battery charging power, after the off-station scheduling. The economic data for Case 4, displayed in Table 8, indicate a total revenue increase of CNY 6972.77, corresponding to a growth rate of 23.8%. In Case 4, off-peak CAS aligns with off-peak electricity purchase prices. Implementing off-station scheduling at this juncture enables the ICSS to enhance power sales revenue significantly at an optimal purchase cost, maximizing cost-effectiveness. Furthermore, off-station scheduling strategies during off-peak periods could effectively regulate user ICSS patterns, redirect activities to non-peak hours to ease peak-hour pressure, and enhance ICSS operations’ stability and efficiency. Figure 7e showcases intention-reshaping results, while Figure 7f displays SOC threshold adjustments.
  • Net profit of annual average
Based on the technical parameters provided in Table 2, the economic parameters provided in Table 3, and the configuration parameters of the ICSS in Section 6.1 (100 charging piles, three motor replacements, and 2024 batteries), it is calculated that the average annual investment for charging piles in ICSS is CNY 260 thousand, the average annual investment for motor replacements is CNY 60 thousand, the average annual investment for batteries is CNY 20.24 million, the average annual operation and maintenance cost of the ICSS is CNY 500 thousand, and the average annual rental income for batteries is CNY 17.6817 million. Based on this, the annual average net income of the ICSS was calculated for each scenario, as shown in Table 9.
Table 9 shows the average annual net income of ICSSs in different cases. Specifically, in Case 1, the ICSS encountered severe congestion characterized by high volume and prolonged duration, resulting in the lowest net profit of the annual averages. Case 2 introduced the intention-reshaping model, nearly doubling the peak congested vehicles on both CAS sides, underscoring the model’s significant impact on alleviating ICSS congestion. Case 3 implemented a battery management strategy and initially achieved an average annual net profit growth of 22.1%. Case 4’s off-station scheduling strategy is aimed at boosting overall revenue for the ICSS. Following the strategy’s implementation, the ICSS ‘s net profit annual average surged significantly, with a growth rate reaching 64.5%. In summary, the strategy proposed in this paper significantly increases the benefits of ICSSs and provides strong support for their efficient operation.

7. Conclusions

The exponential rise in EVs presents unprecedented challenges to ICSSs’ optimization and scheduling capabilities. Effectively managing ICSS congestion while maximizing economic benefits has emerged as a pressing issue. This study delves into EV scheduling and battery management within ICSSs, addressing issues stemming from an uneven allocation of resources and improper battery management. Through the integration of in-station and out-of-station scheduling models, the research introduces a novel approach to substantially reduce ICSS congestion and enhance economic benefits.
To address the current congestion issue in ICSSs, an innovative intention-reshaping model based on ABC attitude change theory is proposed. This model optimizes resource utilization by coordinating the preferences of EV users, reducing idle time, and alleviating congestion. The results indicate that the model has a significant effect on alleviating congestion in ICSSs, successfully reducing congestion on both sides by 55% and 34%, respectively. However, the effect on improving net income is not good, with an average annual net income increase of only CNY 21.82 thousand.
To ensure a stable supply of inventory batteries, an innovative SOC threshold adjustment strategy based on the number of people waiting for battery swapping and the swapping tariff is proposed. This strategy increases the inventory battery number to ensure continuous battery swapping. In addition, a battery compartment charging strategy based on charging duration zoning has been proposed. This strategy establishes a connection between battery charging power and existing inventory and optimizes the charging power of the battery compartment. The results showed that compared with Case 2, the above strategy reduced congestion on both sides of the charging and swapping by 35% and 33%, respectively, with an average annual net profit increase of only CNY 1.1087 million.
To further improve the comprehensive benefits of ICSSs, an innovative off-station scheduling model based on vehicle condition road conditions is proposed. This model fully considers the availability of EVs within the scheduling area and guides EVs to perform CAS during non-peak hours to improve equipment utilization and ultimately enhance the overall benefits of ICSS. The results showed that off-station scheduling not only did not increase the congestion burden on the ICSS but also resulted in an average annual net profit increase of CNY 2.5451 million compared to Case 3.
While some progress has been achieved in our study, there remain several limitations warranting further investigation. Firstly, although this paper proposes strategies to alter user habits, existing research has not extensively examined user satisfaction and preferences concerning CAS, crucial for designing precise incentive mechanisms to steer user behavior change. Secondly, although the potential for deep ICSS integration with the network has been acknowledged, additional research is required to effectively balance network loads, boost operational stability, encourage the widespread adoption of clean energy, and facilitate the green transformation of the energy system. Moreover, the analysis of limitations faced by battery compartments in the actual operation of swapping stations remains insufficient, directly impacting the flexibility, efficiency, sustained stability, and economic viability of the battery compartment and ICSS. In response to these limitations, we are actively conducting pertinent investigations, focusing on these endeavors for future research. The outcomes will be detailed in forthcoming publications.

Author Contributions

Conceptualization, Z.W.; methodology, Z.W., X.Z. (Xiaohong Zhang) and Q.Y.; software, X.Z. (Xiaohong Zhang) and Q.Y.; validation, Z.W., X.Z. (Xiaohong Zhang), Q.Y., X.Z. (Xiaokang Zhang) and Y.L.; formal analysis, Z.W.; investigation, X.Z. (Xiaohong Zhang), Q.Y., X.Z. (Xiaokang Zhang) and Y.L.; resources, X.Z. (Xiaokang Zhang); data curation, Z.W., X.Z. (Xiaohong Zhang) and Q.Y.; writing–original draft, Z.W., X.Z. (Xiaohong Zhang) and Q.Y.; writing–review & editing, Z.W. and Q.Y.; supervision, Z.W., X.Z. (Xiaokang Zhang) and Y.L.; funding acquisition, Z.W. All authors have read and agreed to the published version of the manuscript.

Funding

This research was funded the Key Science and Technology Program of Henan Province (No. 252102240060).

Data Availability Statement

The data and simulation codes that support the findings of this study are available from the corresponding author.

Conflicts of Interest

Author Xiaokang Zhang was employed by the company State Grid Luoyang Electric Power Co., Ltd. Author Yanxue Li was employed by the company State Grid Integrated Energy Planning and D&R Institute Co., Ltd. The remaining authors declare that the research was conducted in the absence of any commercial or financial relationships that could be construed as a potential conflict of interest.

References

  1. Zhan, W.; Wang, Z.; Zhang, L.; Liu, P.; Cui, D.; Dorrell, D.G. A Review of Siting, Sizing, Optimal Scheduling, and Cost-Benefit Analysis for Battery Swapping Stations. Energy 2022, 258, 124723. [Google Scholar] [CrossRef]
  2. Zhang, S.; Li, X.; Li, Y.; Zheng, Y.; Liu, J. A Green-Fitting Dispatching Model of Station Cluster for Battery Swapping under Charging-Discharging Mode. Energy 2023, 276, 127600. [Google Scholar] [CrossRef]
  3. Wei, S. A Sequential Game Analysis on Carbon Tax Policy Choices in Open Economies: From the Perspective of Carbon Emission Responsibilities. J. Clean. Prod. 2021, 283, 124588. [Google Scholar] [CrossRef]
  4. Gonyan Research Institute. Report on the Comprehensive Survey and Market Evaluation of China’s New Energy Swap Station Industry from 2025 to 2031. 2025. Available online: https://www.gonyn.com/about/ (accessed on 2 March 2024).
  5. National Development and Reform Commission. Several Measures to Promote Automobile Consumption. 2023. Available online: https://www.gov.cn/zhengce/zhengceku/202307/content_6893476.htm (accessed on 28 March 2024).
  6. Ministry of Industry and Information Technology. Notice on Organizing the Pilot Work of Comprehensive Electrification of Public Vehicles in the Pilot Zone. 2023. Available online: https://www.gov.cn/zhengce/zhengceku/2023-02/03/content_5739955.htm (accessed on 20 April 2024).
  7. Energy Internet Research Institute. Blue Book on the Development of Electric Vehicle Swapping Industry (2022–2023). 2022. Available online: https://www.cnenergynews.cn/peixun/2024/06/03/detail_20240603163043.html (accessed on 26 July 2024).
  8. Dou, Y.; Zhang, T.; Meng, X. A Theoretical Model of Sequential Combinatorial Games of Subsidies and Penalties: From Waste to Renewable Energy. Front. Energy Res. 2021, 9, 719214. [Google Scholar] [CrossRef]
  9. Hemmati, R. Dynamic Expansion Planning in Active Distribution Grid Integrated with Seasonally Transferred Battery Swapping Station and Solar Energy. Energy 2023, 277, 127719. [Google Scholar] [CrossRef]
  10. Al-Zaidi, W.K.M.; Inan, A. Optimal Planning of Battery Swapping Stations Incorporating Dynamic Network Reconfiguration Considering Technical Aspects of the Power Grid. Appl. Sci. 2024, 14, 3795. [Google Scholar] [CrossRef]
  11. Tang, M.; Zhang, C.; Zhang, Y.; Yan, Y.; Wang, W.; An, B. A Dual-Layer MPC of Coordinated Control of Battery Load Demand and Grid-Side Supply Matching at Electric Vehicle Swapping Stations. Energies 2024, 17, 879. [Google Scholar] [CrossRef]
  12. Wang, Z.; Hou, S. Optimal Participation of Battery Swapping Stations in Frequency Regulation Market Considering Uncertainty. Energy 2024, 302, 131815. [Google Scholar] [CrossRef]
  13. Zhang, K.; Xu, Y.; Sun, H. Bilevel Optimal Coordination of Active Distribution Network and Charging Stations Considering EV Drivers’ Willingness. Appl. Energy 2024, 360, 122790. [Google Scholar] [CrossRef]
  14. Menghwar, M.; Yan, J.; Chi, Y.; Asim Amin, M.; Liu, Y. A Market-Based Real-Time Algorithm for Congestion Alleviation Incorporating EV Demand Response in Active Distribution Networks. Appl. Energy 2024, 356, 122426. [Google Scholar] [CrossRef]
  15. He, Z.; Hou, H.; Hou, T.; Fang, R.; Tang, J.; Xie, C. Multi-Objective Optimization for Improving EV Users’ Adhesion with Hybrid Demand Response Strategy. Energy Rep. 2023, 9, 316–322. [Google Scholar] [CrossRef]
  16. Deb, S.; Goswami, A.K.; Chetri, R.L.; Roy, R. Charging Coordination of Plug-in Electric Vehicles Considering Machine Learning Based State-of-Charge Prediction for Congestion Management in Distribution System. Electr. Power Compon. Syst. 2023, 51, 131–150. [Google Scholar] [CrossRef]
  17. Yan, P.; Yu, K.; Chao, X.; Chen, Z. An Online Reinforcement Learning Approach to Charging and Order-Dispatching Optimization for an e-Hailing Electric Vehicle Fleet. Eur. J. Oper. Res. 2023, 310, 1218–1233. [Google Scholar] [CrossRef]
  18. Wang, F.Y.; Chen, Z.; Hu, Z. Comprehensive Optimization of Electrical Heavy-Duty Truck Battery Swap Stations with a SOC-Dependent Charge Scheduling Method. Energy 2024, 308, 132773. [Google Scholar] [CrossRef]
  19. Chen, X.; Yang, Y.; Wang, J.; Song, J.; He, G. Battery Valuation and Management for Battery Swapping Station. Energy 2023, 279, 128120. [Google Scholar] [CrossRef]
  20. Zhou, K.; Cheng, L.; Wen, L.; Lu, X.; Ding, T. A Coordinated Charging Scheduling Method for Electric Vehicles Considering Different Charging Demands. Energy 2020, 213, 118882. [Google Scholar] [CrossRef]
  21. Tan, M.; Dai, Z.; Su, Y.; Chen, C.; Wang, L.; Chen, J. Bi-Level Optimization of Charging Scheduling of a Battery Swap Station Based on Deep Reinforcement Learning. Eng. Appl. Artif. Intell. 2023, 118, 105557. [Google Scholar] [CrossRef]
  22. Zhang, M.; Yu, S.S.; Yu, H.; Li, P.; Li, W.; Muyeen, S.M. Dispatchable Capacity Optimization Strategy for Battery Swapping and Charging Station Aggregators to Participate in Grid Operations. Energy Rep. 2023, 10, 734–743. [Google Scholar] [CrossRef]
  23. Liu, W.; Xin, S.; Zhang, Z.; Fan, C.; Hao, G.; Xu, Q. Collaborative Planning of Electric Vehicle Integrated ICSS Stations and Distribution Network for Carbon Emission Reduction. Energy Rep. 2024, 12, 5846–5862. [Google Scholar] [CrossRef]
  24. Saha, M.; Thakur, S.S.; Bhattacharya, A. Hybrid Differential Evolution-Prairie Dog Optimization Algorithm Approach for Optimal Scheduling of Battery Swapping Charging Station Considering Uncertainty. J. Energy Storage 2025, 112, 115494. [Google Scholar] [CrossRef]
  25. Yi, H.; Zhang, H.; Li, J.; Zhao, Y. Hybrid Intelligent Optimization Strategy of Battery Swapping Station for Electric Vehicles Based on Reinforcement Learning. Comput. Urban Sci. 2025, 5, 6. [Google Scholar] [CrossRef]
  26. Zhang, Y.; Han, T.; He, W.; Xia, J.; Cui, L.; Ma, Z.; Liu, S. Battery Swapping Scheduling for Electric Vehicles: A Non-Cooperative Game Approach. Front. Energy Res. 2024, 12, 1488234. [Google Scholar] [CrossRef]
  27. Zhang, S.; Li, X.; Li, Y.; Xue, J. A Bi-Objective Battery Dispatching Model of Taxi Battery Swapping Station Network Considering Green Power Consumption. Renew. Energy 2025, 239, 122162. [Google Scholar] [CrossRef]
  28. Duan, L.; Taylor, G.; Lai, C.S. Solar–Hydrogen-Storage Integrated Electric Vehicle Charging Stations with Demand-Side Management and Social Welfare Maximization. WEVJ 2024, 15, 337. [Google Scholar] [CrossRef]
  29. Cha, J.; Han, C.; Song, S.; Kang, S.; Lee, D.; Chang, M.; Jang, G. Hierarchical Co-Optimization of EV Scheduling Considering Customer and System in Distribution Networks. Sustain. Energy Grids Netw. 2024, 38, 101361. [Google Scholar] [CrossRef]
  30. Nayak, D.S.; Misra, S. An Operational Scheduling Framework for Electric Vehicle Battery Swapping Station under Demand Uncertainty. Energy 2024, 290, 130219. [Google Scholar] [CrossRef]
  31. Puhua Policy. Market Research Report on the Battery Swap Service Industry. 2023. Available online: https://baijiahao.baidu.com/s?id=1818778726660670306&wfr=spider&for=pc (accessed on 20 June 2024).
  32. Baidu Maps. 2023 China Urban Transportation Report. 2023. Available online: https://jiaotong.baidu.com/cms/reports/traffic/2023/index.html (accessed on 20 April 2024).
  33. Iresearch. China New Energy Vehicle Battery Swap Market Research Report. 2022. Available online: https://www.xdyanbao.com/doc/zh7he93eil?userid=57555079&bd_vid=11066103399936229079 (accessed on 2 January 2024).
  34. Liu, B.; Xu, Y.; Yang, Y.; Lu, S. How Public Cognition Influences Public Acceptance of CCUS in China: Based on the ABC (Affect, Behavior, and Cognition) Model of Attitudes. Energy Policy 2021, 156, 112390. [Google Scholar] [CrossRef]
  35. Xu, Y.; Mohd Hasan, N.A.; Mohd Jalis, F.M. Purchase Intentions for Cultural Heritage Products in E-Commerce Live Streaming: An ABC Attitude Theory Analysis. Heliyon 2024, 10, e26470. [Google Scholar] [CrossRef]
  36. Zhang, S.; Yu, K.; Yu, Y. Industrial Transformation for Synergistic Carbon and Pollutant Reduction in China: Using Environmentally Extended Multi-Regional Input-Output Model and Multi-Objective Optimization. Energy 2025, 318, 134830. [Google Scholar] [CrossRef]
  37. Derzsi, Z.; Volcic, R. Not Only Perception but Also Grasping Actions Could Obey Weber’s Law. Cognition 2023, 237, 105465. [Google Scholar] [CrossRef]
  38. García-Cuesta, E.; Gómez-Vergel, D.; Gracia-Expósito, L.; López-López, J.M.; Vela-Pérez, M. Prediction of Opinion Keywords and Their Sentiment Strength Score Using Latent Space Learning Methods. Appl. Sci. 2020, 10, 4196. [Google Scholar] [CrossRef]
  39. Li, D.; Du, J.; Sun, M.; Han, D. How Conformity Psychology and Benefits Affect Individuals’ Green Behaviours from the Perspective of a Complex Network. J. Clean. Prod. 2020, 248, 119215. [Google Scholar] [CrossRef]
  40. Ding, Z. Optimizing Economic Management Paths on Consumer Conformity Psychology from a Psychological Perspective. CNS Spectr. 2023, 28, S129. [Google Scholar] [CrossRef]
  41. Ma, M.; Xu, E.; Zheng, W.; Qin, J.; Huang, Q. The Optimized Real-Time Energy Management Strategy for Fuel-Cell Hybrid Trucks through Dynamic Programming. Int. J. Hydrogen Energy 2024, 59, 10–21. [Google Scholar] [CrossRef]
  42. Liang, Y.; Hu, X.; Hu, G.; Dou, W. An Enhanced Northern Goshawk Optimization Algorithm and Its Application in Practical Optimization Problems. Mathematics 2022, 10, 4383. [Google Scholar] [CrossRef]
  43. Ministry of Public Security. Opinions on Accelerating the Comprehensive Green Transformation of Economic and Social Development. 2024. Available online: https://news.qq.com/rain/a/20240815A09OIS00 (accessed on 2 January 2024).
  44. National Energy Administration. Action Plan for Accelerating the Construction of a New Power System (2024–2027). Available online: https://www.ndrc.gov.cn/xxgk/jd/jd/202408/t20240809_1392336.html (accessed on 26 January 2024).
  45. The State Council. Development Plan for New Energy Vehicle Industry (2021–2035). Available online: https://www.gov.cn/xinwen/2020-11/02/content_5556762.htm (accessed on 20 April 2024).
  46. China Charging Alliance. Operation of National Electric Vehicle Charging and Swapping Infrastructure in September 2024. Available online: https://chd.in-en.com/html/chd-2447788.shtml (accessed on 25 June 2024).
  47. NIO. NIO Official Website. Available online: https://app.nio.com/ (accessed on 17 June 2024).
  48. China Energy Research Association. Blue Book on the Development of Electric Vehicle Swapping Industry (2022–2023). Available online: https://www.163.com/dy/article/J2VJJ3N80519QIKK.html (accessed on 17 June 2024).
  49. China Electric Vehicle Promotion Alliance. 2022 White Paper on Charging Behavior of Chinese Electric Vehicle Users. Available online: https://www.nea.gov.cn/2023-03/20/c_1310703965.htm? (accessed on 13 October 2024).
  50. Beijing Transport Institute. The Beijing Transport Development Annual Report of 2023. Available online: https://www.bjtrc.org.cn/List/index/cid/7.html (accessed on 1 August 2023).
  51. U.S. Department of Transportation. Summary of Travel Trends: 2022 National Household Travel Survey. Available online: https://nhts.ornl.gov/assets/2022/pub/2022_NHTS_Summary_Travel_Trends.pdf (accessed on 1 January 2024).
  52. Cavus, M.; Dissanayake, D.; Bell, M. Next Generation of Electric Vehicles: AI-Driven Approaches for Predictive Maintenance and Battery Management. Energies 2025, 18, 1041. [Google Scholar] [CrossRef]
  53. Cavus, M.; Ayan, H.; Bell, M.; Oyebamiji, O.K.; Dissanayake, D. Deep Charge-Fusion Model: Advanced Hybrid Modelling for Predicting Electric Vehicle Charging Patterns with Socio-Demographic Considerations. Int. J. Transp. Sci. Technol. 2025, in press. [Google Scholar] [CrossRef]
Figure 1. Intention reshaping process.
Wevj 16 00230 g001
Figure 2. Two-stage scheduling process based on in-station and off-station scheduling.
Wevj 16 00230 g002
Figure 3. The ICSS number of EVs prediction results: (a) swapping and (b) charging.
Wevj 16 00230 g003
Figure 4. Operation status of the ICSS in Case 1. (a) Number of EVs waiting for CAS. (b) Number of batteries in inventory. (c) Charging power of EVs. (d) Charging power of batteries.
Wevj 16 00230 g004
Figure 5. Operation status of the ICSS in Case 2. (a) Number of EVs waiting for CAS. (b) Number of batteries in inventory. (c) Charging power of EVs. (d) Charging power of batteries. (e) Number of conversions.
Wevj 16 00230 g005
Figure 6. The operation status of the ICSS in Case 3. (a) Number of EVs waiting for CAS. (b) Number of batteries in inventory. (c) Charging power of EVs. (d) Charging power of batteries. (e) Number of conversions. (f) Threshold variation.
Wevj 16 00230 g006
Figure 7. The operation status of the ICSS in Case 4. (a) Number of EVs waiting for CAS. (b) Number of batteries in inventory. (c) Charging power of EVs. (d) Charging power of batteries. (e) Number of conversions. (f) Threshold variation.
Wevj 16 00230 g007
Table 1. Stimulating information characteristics.
Conversion Reward FundsCostsWaiting Time
Cha to swapOutputIncrease (Input)Increase (Input)
OutputIncrease (Input)Reduce (Output)
Swap to chaOutputReduce (Output)Increase (Input)
OutputReduce (Output)Reduce (Output)
Table 2. Technical parameters.
TypeParametersCharacterValueUnit
Charging pileRated power P e , cha EV 64.5kW
Rated efficiency η e , cha EV 90%
Service life-10year
Swapping facilityService life-15year
BatteryUpper limit of SOC SOC max 90%
Lower limit of SOC SOC min 20%
Rated power P e , cha B 64.5kW
Rated efficiency η e , cha B 90%
Service life-8year
Capacity E e B 75kWh
Table 3. Economy and other parameters.
TypeParametersCharacterValueUnit
EconomyWaiting time cost K EV w 0.23CNY
Depreciation cost of batteries K d B 0.46CNY
Investment of charging pile C CP 26,000CNY/piece
Investment of swapping facility C SF 300,000CNY/piece
Investment of battery C battery 80,000CNY/piece
O&M of ICSS C O & M 500,000CNY/year
Battery rent G rent 728CNY/piece/month
OtherEmpirical multiple x 1.5 -
Standard threshold SOC t h BMS 90%
Average swapping capacity E - swp EV 40kWh
Table 4. Case classification.
Intention ReshapingBattery ManagementOff-Station Scheduling
Case 1
Case 2
Case 3
Case 4
Table 5. Revenues of Case 1.
C t , b C t , d G t , s C t , r Amount
Annual85,099.5737,595.81148,410.61025,715.23
Data units in the table: CNY.
Table 6. Revenues of Case 2.
C t , b C t , d G t , s C t , r Amount
Annual84,560.3935,767.88147,588.3594726,313.08
Data units in the table: CNY.
Table 7. Revenues of Case 3.
C t , b C t , d G t , s C t , r Amount
Annual81,995.2134,952.59147,087.578929,350.71
Data units in the table: CNY.
Table 8. Revenues of Case 4.
C t , b C t , d G t , s C t , r Amount
Annual80,643.2134,165.95151,775.6164336,323.48
Data units in the table: CNY.
Table 9. Net profit of annual average in Case 1–Case 4.
CaseGross RevenueNet Profit
1938.61600.78
2960.43622.60
31071.30733.47
41325.81987.98
Data units in the table: CNY 104.
Disclaimer/Publisher’s Note: The statements, opinions and data contained in all publications are solely those of the individual author(s) and contributor(s) and not of MDPI and/or the editor(s). MDPI and/or the editor(s) disclaim responsibility for any injury to people or property resulting from any ideas, methods, instructions or products referred to in the content.

