Article

Multidimensional Analysis of Technological Innovation Efficiency in New Energy Vehicles: Industrial Chain Heterogeneity and Key Drivers

1
The School of Management Engineering, Qingdao University of Technology, Qingdao 266520, China
2
School of Economics and Management, Qingdao University of Science and Technology, Qingdao 266061, China
*
Authors to whom correspondence should be addressed.
World Electr. Veh. J. 2025, 16(4), 233; https://doi.org/10.3390/wevj16040233
Submission received: 11 March 2025 / Revised: 5 April 2025 / Accepted: 14 April 2025 / Published: 15 April 2025

Abstract

:
As the world accelerates efforts to combat climate change and transition toward a green, low-carbon economy, the new energy vehicle (NEV) industry has become a key driver of carbon reduction. Its ability to innovate efficiently is critical to long-term sustainable development. This study builds on the innovation value chain theory and introduces an evaluation framework that accounts for undesirable outputs such as energy consumption and pollutant emissions. Using a super-efficiency network SBM–Malmquist model and Tobit regression, we analyze the technological innovation efficiency of 272 A-share listed NEV enterprises in China from 2016 to 2023. Expanding beyond traditional overall assessments, we examine efficiency at different stages of the industry chain and find that: (a) overall technological innovation efficiency has declined, mainly due to weak pure technical efficiency, underscoring the need for better R&D management and resource allocation; (b) efficiency varies across the industry chain, with midstream firms performing better than those upstream and downstream, reflecting differences in technological accumulation and market conditions; (c) R&D tax deductions and market competition significantly boost innovation efficiency by creating pressure-driven incentives, while mismatched labor skills, the “welfare dependence” effect of tax incentives and financing constraints hinder progress. By introducing a two-stage innovation efficiency evaluation framework, this study not only pinpoints where efficiency losses occur along the industry chain but also provides empirical insights to guide targeted policy decisions, offering valuable implications for the sustainable growth of the global NEV industry.

1. Introduction

The escalating global climate crisis has driven an international consensus on the urgency of green and low-carbon development [1]. Within this context, new energy vehicles (NEVs) have emerged as a critical technology for reducing carbon emissions and are now a key driver of the green economic transition. To align with this trend, countries across the globe have introduced innovation strategies for the NEV industry, refined industrial ecosystems and promoted the formation of industrial clusters. In 2023, global NEV sales reached 14.65 million units, marking a year-on-year growth of 35.4% and highlighting the sector’s robust expansion [2].
However, as the NEV market matures, governments worldwide are progressively reducing fiscal subsidies for the industry. This shift has transitioned the primary drivers of industry growth from policy support to market demand and technological innovation. As a result, competition has intensified, leading to decreased corporate profit margins and a market approaching saturation. In this highly competitive environment, NEV companies face dual challenges of cost control and technological innovation. Given the extended payback period typical of technological innovation and R&D investments, some firms prioritize short-term gains in market share over long-term R&D commitments, ultimately undermining their capacity for technological innovation. Despite policy initiatives to boost the NEV industry, numerous companies still struggle with weak core technological innovation capabilities and an underdeveloped innovation culture.
These issues result in low innovation efficiency and hinder breakthrough progress, further exacerbating cutthroat competition within the industry. In light of these challenges, a comprehensive evaluation of the technological innovation efficiency of NEV firms and an in-depth exploration of its influencing factors are essential for promoting healthy industrial development and enhancing global competitiveness. Technological innovation efficiency measures the relationship between corporate inputs and outputs and indicates how close a firm’s innovation activities are to the industry’s technological frontier [3]. This study focuses on the following key questions: (a) What is the overall trend in the technological innovation efficiency of NEV companies? (b) Are there significant differences in innovation efficiency across different segments of the industry chain? (c) What are the primary factors influencing technological innovation efficiency in NEV companies, and do these factors have differential impacts on innovation efficiency across industry chain segments?
Given China’s prominence in the global NEV market, evidenced by its leadership in industry scale, technological innovation and policy support, this study uses Chinese NEV companies as a case study. This study employs the innovation value chain theory to develop an evaluation system incorporating undesirable outputs such as energy consumption and pollutant emissions. Using the super-efficiency network SBM–Malmquist model, we measure the technological innovation efficiency of 272 A-share listed NEV enterprises in China from 2016 to 2023, enhancing the accuracy of the assessment and addressing the static and homogeneous shortcomings of previous studies. Additionally, we introduce a novel evaluation framework based on industry chain stratification, offering fresh insights into the innovation efficiency of NEV companies. Furthermore, by applying Tobit regression models, we identify key factors influencing innovation efficiency, providing empirical evidence for refining industrial policies and boosting corporate technological competitiveness.
The remainder of this paper is structured as follows: Section 2 reviews the relevant literature and proposes research hypotheses; Section 3 details the research methods, model development and data sources; Section 4 presents the empirical analysis and results; Section 5 concludes with policy recommendations and directions for future research.

2. Literature Review

The introduction summarizes the research background and central issues. The following sections systematically review and comment on the relevant literature to solidify the theoretical foundation and clarify the framework for measuring technological innovation efficiency and its influencing factors.

2.1. Measurement of Technological Innovation Efficiency of Enterprises

Technological innovation efficiency is measured using parametric or non-parametric production frontier surface analysis methods, depending on whether they estimate production frontier surface parameters. In numerical methods, stochastic frontier analysis (SFA) with high accuracy is used to assess the efficiency of a single input with a single output or multiple inputs with a single output for explicit production functions. Using SFA, Lutz et al. (2017) studied German manufacturing firms’ technological innovation efficiency [4]. The non-parametric data envelopment analysis (DEA) method is suitable for multiple-input, multiple-output situations where the production function is challenging to specify. It has been widely adopted due to its proximity to actual innovation activities. Al-Refaie et al. (2019) used the DEA method to measure the pharmaceutical industry’s technological innovation efficiency [5], while Xiao et al. (2017) studied high-tech industry efficiency. Due to its multi-dimensional index system, the DEA model can assess the innovation efficiency of multiple inputs and outputs in new energy vehicles [6]. Fang and others (2020) used the DEA method to measure the technological innovation efficiency of 23 Chinese new energy automobiles. They found that input-output conversion efficiency significantly impacts technological innovation in the field, providing a new perspective for measuring new energy automobile enterprises’ innovation efficiency [7]. Review and comment on the relevant literature to solidify the theoretical foundation and clarify the framework for measuring technological innovation efficiency and its influencing factors.

2.2. Key Factors Affecting the Efficiency of Technological Innovation in Enterprises

An enterprise’s technological innovation efficiency is affected by various factors, including internal resource allocation and organizational structure, as well as external factors, such as market competition and policy support.

2.2.1. Internal Factors of the Enterprise

Internal factors affecting enterprise technological innovation efficiency are mostly related to their survival and development, such as enterprise size, management style, financial resources and human resources. Enterprise size affects technological innovation efficiency, and different-sized enterprises have different innovation efficiency. Large companies have scale advantages in R&D funding and resource allocation, so they innovate more efficiently than SMEs. However, firm size does not continually improve innovation efficiency. Some studies suggest managerial complexity may hinder innovation efficiency when scale growth exceeds a threshold (Chen and Chien, 2004) [8]. Besides firm size, ownership and financial status also affect technological innovation efficiency. Due to their flexible management model and market-oriented strategy, Jefferson et al. (2006) found that non-state-owned firms (NSOEs) outperform SOEs in innovative resource allocation and efficiency [9]. Foreign-funded firms also introduce technology and use resources more efficiently than local firms, and their flexible innovation strategies ensure resource efficiency (Zhang et al., 2020) [10]. Human resource factors like core employee quality and incentive systems boost innovation efficiency. Companies can boost employee motivation and technological innovation efficiency through fair compensation and equity incentives (Florian and Gustavo, 2013) [11].

2.2.2. External Factors

External factors are mainly related to the economic and social conditions and changes outside the enterprise, covering political, economic, cultural, scientific and technological factors, such as the policy environment (Michele et al., 2021) [12], the market environment (Hecker and Ganter, 2013) [13] and intellectual property rights (Amara et al., 2008) [14], which show geographical and temporal variability. Michele et al.’s study focuses on technological innovation policies in European countries and finds that tax policies significantly enhance firms’ innovation efficiency [12]. However, the policy effect does not grow linearly, and excessive government subsidies may weaken firms’ market orientation (Czarnitzki, D. and Lopes-Bento, C, 2014) [15], which reduces firms’ innovation drive and leads to a decline in innovation efficiency. Secondly, the degree of market competition, as one of the external factors, has a positive effect on the improvement of innovation efficiency of enterprises. In a highly competitive market environment, firms tend to increase R&D investments and accelerate technology updating to maintain their competitive advantage (Norlia, 2013) [16]. In addition, the strength of intellectual property protection directly affects firms’ motivation to innovate. Strong IPR protection measures in knowledge-intensive industries can enhance firms’ confidence in technological innovation and motivate them to invest more resources in R&D (Amara et al., 2008) [14].

2.3. Research Gaps and Contributions

Existing studies primarily focus on regional or industry-level analysis, with limited micro-level investigations of specific enterprises. While such studies help understand broader trends, they fail to offer actionable insights into the internal mechanisms of resource allocation, organizational structure and technological transformation at the enterprise level. Parametric and non-parametric methods have strengths; DEA, in particular, is suitable for assessing innovation efficiency in new energy vehicle companies, as it requires no predefined production function. However, most existing studies rely on static efficiency models, overlooking the dynamic nature of technological innovation, and fail to address the heterogeneous factors across different segments of the industrial chain. Future research should focus on the diversity of influencing factors and segment-specific efficiency optimization.
Consequently, the potential marginal contributions of this article are as follows: First, building on previous research, this study incorporates the unique characteristics of the new energy vehicle (NEV) industry. It comprehensively considers government subsidies and energy consumption while integrating environmental factors as an undesirable output indicator. This approach establishes a comprehensive and precise evaluation system for NEV technological innovation efficiency. Second, this study overcomes the limitations of traditional static analyses by applying innovation value chain theory and the network super-SBM model. It reveals the internal structure of the technological innovation process [17], addressing the shortcomings of prior research that treated this process in a generalized manner [18]. This study identifies inefficient stages and provides a scientific basis for formulating targeted innovation policies. Third, this research moves beyond firm-level analysis by developing a multi-tiered evaluation framework based on the industrial chain. It thoroughly examines the differentiated contributions of upstream, midstream, and downstream segments to the collaborative development of the industry, offering empirical support for improving the overall efficiency of technological innovation across the value chain. Finally, regarding influencing factors, traditional studies primarily focus on internal corporate governance and capital investment. In contrast, this study considers the unique characteristics of the NEV industry by incorporating policy-related factors such as market competition intensity, tax incentives, and additional pre-tax deductions for R&D expenditures. Furthermore, it expands the analytical perspective to explore the heterogeneous drivers of technological innovation efficiency across different segments of the industrial chain. This study aims to provide theoretical support for enhancing technological innovation efficiency in NEV enterprises and offers valuable insights for policymakers.

3. Research Hypothesis

This paper examines the changes in technological innovation efficiency of new energy automobile enterprises by analyzing their positioning and characteristics, existing research literature and internal and external factors. Internal factors include enterprise development endowment, human capital and economic foundation, whereas external factors encompass market environment and fiscal and tax policies. This paper systematically examines the impact of external factors, including tax incentives, market competitiveness, and additional pre-tax deduction policies for R&D expenditures, alongside internal factors such as labor quality, financial leverage, financing constraints and equity concentration, on firms’ technological innovation efficiency, thereby offering theoretical support for innovation enhancement.

3.1. The Influence of External Factors on the Efficiency of Technological Innovation of Enterprises

Government fiscal policies and market competition influence firms’ technological innovation efficiency in the external environment. Fiscal policies directly impact firms’ innovation input and risk-bearing capacity through incentive mechanisms, while market competition drives technological progress via competitive pressure and differentiation strategies. Accordingly, this paper first examines the impact of tax incentives and R&D expense super-deduction policies on the technological innovation efficiency of new energy vehicle enterprises.

3.1.1. Impact of Tax Incentives and Additional Deduction for R&D Expenses on Technological Innovation Efficiency of New Energy Automobile Enterprises

The “incentive effect” in economics posits that the government frequently implements in fiscal policies to steer industrial development, encourage enterprises to define technological innovation objectives and accelerate innovation. Initially, fiscal policy can enhance the efficiency of technological innovation by offering direct economic assistance. Tax incentives can enhance cash flow, bolster enterprise liquidity and stimulate R&D investment, augmenting enterprise innovation capacity (Teng and Ullah, 2024) [19]. The second objective is to mitigate uncertainty surrounding technological innovation to enhance motivation and confidence in innovation. Bao et al. (2024) observed that including R&D expense deductions enhances corporate innovation by alleviating short-term financial burdens and fostering confidence in long-term, high-risk technological research and development [20]. The new energy automobile sector is technology-intensive, necessitating long-term support in capital, technological accumulation and patent protection for its innovation. Tax deductions for R&D expenditures incentivize companies to increase their investment in research and development, thereby enhancing the efficiency of converting technological innovations into practical applications for product development and marketing (Zhu et al., 2024) [21]. Consequently, this paper posits hypothesis 1.
H1a: 
Tax incentives positively affect the technological innovation efficiency improvement of new energy vehicle companies.
H1b: 
Deduction of R&D expenses have a positive effect on the improvement of technological innovation efficiency of enterprises into new energy vehicles.

3.1.2. Impact of Market Competition on the Technological Innovation Efficiency of New Energy Vehicle Enterprises

The competition incentive effect demonstrates that intense market rivalry compels companies to enhance their technology to maintain competitiveness and acquire market share. Market competition fosters technological innovation in two primary ways: it enables companies to differentiate their products and expand their market share (Sana et al., 2022) [22]. Confronted with competition from conventional automotive and nascent electric vehicle companies, Lv et al. (2024) recommended that firms augment R&D expenditures to enhance product performance and decrease costs via technological innovation [23]. Secondly, market pressure heightens firms’ sensitivity to innovation returns, expediting the technology research, development cycle and transformation process (Yu et al., 2024) [24]. Businesses must not remain stagnant in a competitive market, which enhances resource allocation and advances industrial technology through natural selection (Autor et al., 2017) [25]. Consequently, this paper posits hypothesis 2.
H2: 
The degree of market competition can promote the technological innovation efficiency of new energy automobile enterprises.

3.2. The Influence of Internal Factors on the Efficiency of Technological Innovation in Enterprises

Following the analysis of external environmental factors’ impact on technological innovation efficiency, this section further explores the role of internal factors, focusing on the mechanism of internal resource allocation in enterprises and its effect on innovation efficiency.

3.2.1. The Impact of Labor Quality on the Technological Innovation Efficiency of New Energy Vehicle Enterprises

The innovation-driven development theory posits that technological innovation propels economic growth, with high-quality human capital facilitating this process. Superior labor enhances organizational knowledge acquisition and technological research and development (Aytun et al., 2024) [26]. A high-quality labor force possesses enhanced learning capabilities and professional skills, rapidly assimilating external knowledge and recognizing and converting tacit knowledge into explicit knowledge, thereby generating technological innovation outcomes for enterprises (Ghasemi et al., 2018) [27]. Nevertheless, the innovative thinking and avant-garde viewpoints of high-quality workforces enhance technological advancements and product optimization, thereby increasing corporate competitiveness (Soh et al., 2022) [28]. An exceptional workforce can facilitate knowledge exchange and collaboration, cultivate a robust innovation culture and enhance the efficiency of technological innovation (Dubiei et al., 2020) [29]. In technology-intensive sectors such as new energy vehicles, workforce quality enhances technological innovation, accelerating new product development and broadening market application (Yuan et al., 2024) [30]. Skilled labor can assist companies in adapting to swift technological advancements and sustaining their competitive edge in innovation via agile research and development strategies. Consequently, this paper posits hypothesis 3.
H3: 
The quality of the labor force facilitates the technological innovation efficiency of new energy automobile enterprises.

3.2.2. The Impact of Financial Leverage and Financing Constraints on the Technological Innovation Efficiency of New Energy Enterprises

Technical innovation entails greater risk; therefore, it employs financial leverage to optimize fund allocation and guarantee adequate cash flow for supporting innovation endeavors. Financial leverage should be employed judiciously. Financial leverage can elevate corporate financial risks, bankruptcy crises, agency problems and unpredictability in the operating environment (Shahzad et al., 2015) [31]. Moreover, elevated leverage ratios exacerbate companies’ financial limitations and resource distribution challenges, diminishing their resilience to innovation setbacks, fostering a more conservative approach and reducing backing for high-risk innovations (Iqbal et al., 2020) [32]. Elevated financial leverage intensifies capital chain strain and risk aversion in new energy vehicle firms, diminishing R&D efficiency (Ren et al., 2021) [33]. Over-leveraged companies experience declining financial stability and credibility, resulting in increased uncertainty regarding technological innovation (Jao et al., 2020) [34]. Tighter restrictions creditors impose on the fund utilization of highly leveraged firms may impede technological research and development.
New energy vehicle enterprises, characterized by high technology and capital intensity, necessitate substantial capital investment and prolonged payback periods for research and development, complicating external financing efforts. The industry’s significant reliance on policy and fragile asset structure intensifies the issue of financing constraints. The theory of preferential financing posits that enterprises should prioritize internal financing; however, its instability may hinder the technological innovation process (Oliver, 2003) [35], thereby constraining efficiency enhancement. Nonetheless, the substantial capital needed for the development of new energy vehicles increases the likelihood of depleting research and development funds due to financial limitations, thereby impacting the continuity of innovation (Wang et al., 2020) [36]. Financial limitations may compel firms to prioritize production and operations over innovative research and development. This paper posits hypothesis 4.
H4: 
Financial leverage and financing constraints inhibit the technological innovation efficiency of new energy automobile enterprises.

3.2.3. Impact of Equity Concentration on the Technological Innovation Efficiency of New Energy Enterprises

Agency theory posits that conflicts of interest may arise between shareholders and management, particularly in cases of dispersed equity, leading management to prioritize personal interests over those of shareholders, which can result in suboptimal strategic decisions (Jensen et al., 1976) [37]. Nevertheless, elevated equity concentration typically signifies the centralization of corporate decision-making authority and resource distribution, potentially resulting in short-termism and risk aversion (Chen et al., 2021) [8]. Major shareholders may prioritize immediate financial returns over long-term, high-risk investments in technological innovations, thereby hindering investment in innovative R&D (Victor et al., 2014) [38]. The concentration of shareholding may restrict oversight and diversity of perspectives within the firm, hindering the expression and adoption of innovative ideas and suggestions, leading to a homogeneous innovation trajectory and insufficient incentives and promotion. Excessive shareholder intervention may restrict the autonomy and flexibility of technology R&D, hindering the capacity of R&D personnel to experiment and impeding innovation. This paper posits hypothesis 5.
H5: 
Equity concentration has a dampening effect on the technological innovation efficiency of new energy automobile firms.
The schematic diagram of the research structure in this article is shown in Figure 1:

4. Research Design

This section details the research methods and model construction. To ensure rigorous and scientific analysis, the next step specifies the rationale for selecting input and output variables and confirms their suitability for measuring technological innovation efficiency.

4.1. Model Specification

Considering the characteristics of technological innovation in new energy vehicle enterprises, this paper employs relevant DEA models to assess innovative efficiency and analyze its dynamic changes and influencing factors. It uses the SBM network DEA model to reveal multi-stage features, the super-efficiency SBM model to account for undesirable outputs, the DEA-BCC model for validation, the Malmquist–Luenberger index to examine time trends and the Tobit regression model to identify key influencing factors. The following outlines the model construction process.

4.1.1. DEA Model of SBM Network

Network SBM (slack-based measure) model breaks through the limitations of the traditional single-stage data envelopment analysis (DEA) model to reveal the efficiency of the multi-stage production process within each decision-making unit (DMU), which can clarify the specific sources of inefficiency. The form of the model is as follows: assuming the existence of n decision-making units (DMUs), denoted as j (j = 1, 2,..., n, in this paper, we take n = 272), each DMU contains k phases (in this paper, we take k = 2), and each phase is equipped with mk input indexes and rk output indexes, respectively (in this paper, we take m1 = 3, m2 = 2; r1 = 3, r2 = 3). The relevant indexes are shown in Table 1. The input vector of the jth DMU in the R&D stage is Xj(k), the intermediate variable is Zj(1,2), the input of the results transformation stage is Xj(2) and its output vector is Yj(2). Each stage is weighted equally Wk (W1 = W2 = 0.5).
The parameters mk and rk represent the number of input and output indicators (m1 = 3, m2 = 2; r1 = 3, r2 = 3). See Table 1 for the related indicators for node k (k = 1, 2,..., K, in this paper, K = 2), X j 1 = X 1 j 1 , X 2 j 1 , , X m j 1 T , which represents the vector of inputs in the R&D stage of the jth DMU and the outputs during the R&D period, i.e., intermediate variables, are Z j ( 1,2 ) = ( Z 1 j ( 1,2 ) , Z 2 j ( 1,2 ) , . . . , Z t j ( 1,2 ) ) . The investment in the transformation period, X j 2 = X 1 j 2 , X 2 j 2 , , X m j 2 T . Y j 2 = Y 1 j 2 , Y 2 j 2 , , Y m j 2 T , represents the output vector of the jth DMU in the result transformation stage, and Wk is the weight of node k(W1 = W2 = 0.5).
Production in the R&D input phase may be set as the following:
P 1 = X 1 , Z 1,2 | j = 1 n λ 1 j X 1 j X 1 , j = 1 n λ 1 j Z j 1,2 Z 1,2 , λ 1 j 0
In the R&D stage, the input X 1 must meet or exceed the weighted value of the reference unit, and the intermediate variable Z 1,2 must not exceed the weighted value of the reference unit.
The production of the resultant transformation phase may be set as the following:
P 2 = X 2 , Z 1,2 , Y 2 j = 1 n λ 2 j X 2 j X 2 , j = 1 n λ 2 j Z j 1,2 Z 1,2 , j = 1 n λ 2 j Y 2 j Y 2 , λ 2 j 0
In the technology commercialization stage, the input X 2 must meet or exceed the weighted value of the reference unit, the intermediate variable Z 1,2 must meet or exceed the weighted value of the reference unit and the output Y 2 must not exceed the weighted value of the reference unit.
The network SBM model under non-directed can be expressed as follows:
ρ * = m i n k = 1 2 W k 1 1 m k i = 1 m k s k i x k i 0 + k = 1 2 W k 1 + 1 r k r = 1 r k s k + r + y k r 0 s . t j = 1 n λ k j x k i j + s k i = x k i 0 , i = 1,2 , . . . , m k j = 1 λ k j z t j s z t = z t 0 , t = 1,2 , . . . , T j = 1 n λ k j y k r j s k + r + = y k r 0 , r = 1,2 , . . . , r k j = 1 n λ k j = 1 , λ k j 0 , s k i 0 , s k + r + 0 , k = 1,2
where ρ * is the overall integrated efficiency value of the DMU, x k i 0 and y k r 0 are the ith input and rth output of stage k, respectively, s k + r + and s k i are the slack variables for input wastage and output deficiency, respectively, which characterize the specific sources of efficiency losses.

4.1.2. SBM Super-Efficiency Model Incorporating Undesired Outputs

The traditional DEA method cannot distinguish between multiple effective decision-making units with an efficiency value of one, and it is difficult to fully consider the impact of non-desired outputs on efficiency. In addition, non-desired outputs such as pollutant emissions will appear in the energy use process. By introducing non-expected outputs, the super-efficient SBM model can further refine the comparison between effective decision-making units and optimize the assessment of real production efficiency. The formula is shown by Equation (2) as follows:
ρ = m i n 1 + 1 m i = 1 m s i x i k 1 1 q 1 + q 2 r = 1 q 1 s r + y r k + t = 1 q 2 b t b t k s . t j = 1 n λ k j x k i j + s k i = x k i 0 , i = 1,2 , . . . , m k j = 1 λ k j z t j s z t = z t 0 , t = 1,2 , . . . , T j = 1 n λ k j y k r j s k + r + = y k r 0 , r = 1,2 , . . . , r k j = 1 n λ k j = 1 , λ k j 0 , s k i 0 , s k + r + 0 , k = 1,2
For any DMUj (j = 1, 2, ..., n), the input variables include m resources, denoted xi (i = 1, 2, ..., m), capable of producing simultaneously u1 desired outputs (in this paper we take u1 = 4), denoted yr (r = 1, 2, .... q1) and u2 undesired outputs (in this paper, we take u2 = 1), denoted as bt (t = 1, 2, ..., q2); xik denotes the actual value of the ith input in the kth DMU. yrk denotes the actual amount of the rth desired output in the kth DMU. btk denotes the actual amount of the tth undesired output in the kth DMU. ρ is target efficiency value, λ j is the weight of the cross-section observations for each DMU. Input redundancy, expected output shortfall, and undesired output redundancy are shown at s i ,   s r + and b t , respectively.

4.1.3. The DEA-BCC Model

For any DMUj (j = 1, 2, ..., n), the input variables include m kinds of resources, denoted xi (i = 1, 2, ..., m). The ability to simultaneously produce s outputs, denoted as yr (r = 1, 2, ..., s). X j = X 1 j , X 2 j 1 , , X m j , representing the jth input quantity of the jth decision unit DMUj, and the output vector is Y j = Y 1 j , Y 2 j , , Y m j , representing the rth output quantity of the jth decision unit DMUj. Non-expected outputs are used as negative input variables in this model.
M i n ε r = 1 s s r + i = 1 m s i s . t j = 1 n λ j x i j + s i = x i 0 ,   i = 1 , , m j = 1 n λ j y r j s r + = y r 0 ,   r = 1 , , s j = 1 n λ j = 1 ,   λ j ,   s i ,   s r + 0
The parameters λ j represent the weights assigned to each DMU in the cross-sectional observations. The parameters s i and s r + represent input redundancy and output deficiency, respectively. The parameter denotes combined technical efficiency (CRSTE), which incorporates both pure technical efficiency and scale efficiency.

4.1.4. Malmquist–Luenberger Index

While capable of measuring efficiency, the static network SBM model cannot reveal the pattern of change in production efficiency in the time dimension. The Malmquist–Luenberger (ML) index remedies this deficiency by assessing the dynamic change in the efficiency of a decision unit from period t to period t+1. The index is decomposed into two parts: technical progress change (TC) and technical efficiency change (EC):
M L t + 1 t = E t + 1 x t + 1 , y t + 1 E t x t , y t E t x t + 1 , y t + 1 E t + 1 x t + 1 , y t + 1 1 2 E t x t , y t E t + 1 x t , y t 1 2 = E C × T C
where E t x t , y t denotes the level of technical efficiency in period t expressed in terms of period t technology, and E t + 1 x t + 1 , y t + 1 is the same. Further, changes in technical efficiency can be divided into two parts: changes in scale efficiency (SEC) and changes in pure technical efficiency (PEC). When ML > 1, it indicates an upward trend in the efficiency of technological innovation, and vice versa, it indicates a decline in efficiency.
E C = E t + 1 P T E x t + 1 , y t + 1 E t P T E x t , y t E t S E C x t + 1 , y t + 1 E t + 1 S E C x t + 1 , y t + 1 1 2 E t S E C x t , y t E t + 1 S E C x t , y t 1 2 = P E C × S E C
E t P T E x t , y t and E t S E C x t , y t denote the pure technical efficiency and scale efficiency in period t expressed in terms of the technology in period t, respectively. In period t, E t P T E x t , y t and E t S E C x t , y t represent pure technical efficiency and scale efficiency, respectively, both measured based on the technology available in that period. E t + 1 P T E x t + 1 , y t + 1 similar to E t + 1 S E C x t + 1 , y t + 1 ; EC > 1 indicates an improvement in technical efficiency, while the opposite implies a decrease in efficiency; TC > 1 indicates technological progress, while the opposite indicates regression.

4.1.5. Tobit Modeling

This paper further analyzes the influencing factors of enterprise technological innovation efficiency based on the SBM-DEA model and Malmquist index research results. Based on the input–output indicators and domestic and international research bases combined with the characteristics of new energy automobile enterprises, seven factors affecting the technological innovation efficiency of enterprises were selected. Namely, the quality of enterprise employees (Qos), financial leverage (Leve), financing constraints (WW), market competition (EC), equity concentration (OC), additional pre-tax deductions of R&D expenditures (Rded) and pre-tax benefits (Taxb). The Tobit regression model is constructed as follows.
IEit = β0 + β1qosit + β2leveit + β3growthit + β4finit + β5ecit + β6ocit + β7rdedit + β8 taxbit + εit
The parameter IEit represents the technological innovation efficiency, where i denotes the decision-making unit (i.e., enterprise) and t denotes the time period (i.e., year). It is measured as the comprehensive technical efficiency calculated using the super-efficiency DEA model. The parameter β0 is the constant term, β18 are the regression coefficients of the respective variables, and εit represents the random error term.

4.2. Selection of Indicators

This section details the research methods and model construction. To ensure rigorous and scientific analysis, the next step specifies the rationale for selecting input and output variables and confirms their suitability for measuring technological innovation efficiency.

4.2.1. Input–Output Variables

The investment of R&D resources serves as a fundamental driver of innovation in new energy vehicle enterprises, encompassing both human and financial inputs. This study measures key input factors through government funding, the full-time equivalent of R&D personnel and the percentage of R&D expenditure.
To evaluate the innovative performance of these enterprises, it is essential to capture both their technological competitiveness and the economic benefits of technological advancements. Therefore, this study selects the number of R&D-related patent applications, the number of active invention patents, total energy efficiency, operating profit margin and return on net assets as the primary output indicators.
In summary, the selected input variables emphasize human and financial resources, while the output variables cover three dimensions: energy efficiency, economic returns (expected output) and undesirable output. Patents, beyond being a direct outcome of R&D investment, also serve as a forward-looking indicator of future technological advancements, embodying both input and output attributes. Considering patents as an intermediate variable allows for a more comprehensive assessment of their socioeconomic impact and conversion efficiency, offering a holistic approach to measuring technological innovation efficiency. Ultimately, this study incorporates nine input and output indicators, as detailed in Table 1.

4.2.2. Influencing Factors

To delve deeper into the pivotal factors influencing the technological innovation efficiency of new energy vehicle enterprises, this study, drawing on relevant literature and considering the unique characteristics of these companies, has meticulously selected a set of core variables. These include employee quality (Qos), financial leverage (Leve), corporate growth potential (Growth), financing constraints (WW), market competitiveness (EC), shareholding concentration (OC), additional pre-tax deductions for R&D expenses (Rded) and tax incentives (Taxb). Detailed measurement methods for each variable are presented in Table 2.

4.3. Sample Selection and Data Sources

This paper examines new energy automobile companies listed in A-share from 2016 to 2023, excluding ST, *ST enterprises and companies with missing data or abnormal financial indicators for accuracy and representativeness. Finally, 272 representative listed companies were sampled, yielding 2176 observations. The study relied on the Cathay Pacific database, the EPS data platform, the China Urban Statistical Yearbook, province statistical yearbooks and Bureau of Statistics data. Enterprises emit industrial wastewater and exhaust as non-desired output. Mao et (2022) standardize pollutant emissions by converting the measures for the administration of sewage charge collection standards’ pollution equivalent values into a uniform number and summing them up (plus one to take the logarithm) to reflect the enterprises’ non-desired outputs [39].

5. Empirical Analysis

This chapter delves into the empirical analysis to examine the current state of technological innovation efficiency in new energy vehicle enterprises, as well as the specific factors and mechanisms influencing it.

5.1. Measurement of Technological Innovation Efficiency in New Energy Automobile Industry

To comprehensively evaluate the technological innovation efficiency of new energy vehicle enterprises, this paper first uses the super-efficiency SBM-DEA model for static measurement and employs the DEA-BBC model for robustness testing. Subsequently, to further analyze the differences in technological innovation efficiency across various industrial chain segments and their dynamic evolution, this section investigates three aspects: overall efficiency measurement, industrial chain segmentation analysis and dynamic evolution using the Malmquist index.

5.1.1. Static Analysis of SBM-DEA Model and DEA-BCC Model Validation

The results of technological innovation efficiency for the new energy vehicle industry, calculated using Formula (2), are shown in Table 3. Comprehensive technical efficiency dropped from 0.7606 to 0.4924, from 2016 to 2023, similar to pure technical efficiency. Industry scale efficiency (SE) fluctuates “N”-style. Technical innovation efficiency can be divided into pure technical efficiency (PTE) and scale efficiency (SE). From 2016 to 2023, comprehensive technical efficiency declined from 0.7606 to 0.4924, mirroring pure technical efficiency. In contrast, scale efficiency (SE) exhibited an “N”-shaped fluctuation over the same period. Technological innovation efficiency consists of pure technical efficiency (PTE) and scale efficiency (SE). As shown in Figure 2, pure technical efficiency remained consistently lower than scale efficiency from 2016 to 2023. According to the formula TE = PTE×SE, low pure technical efficiency is the primary reason for the decline in technological innovation efficiency. PTE reflects a company’s ability to maximize output or minimize input under given conditions. The persistently low PTE in the new energy vehicle industry suggests inefficiencies in innovation management stemming from irrational resource allocation, ineffective R&D management and poor technology commercialization. Enterprises should go beyond scale expansion and R&D investment to enhance technological innovation efficiency. It is crucial to optimize management practices, strengthen internal controls and allocate resources for innovation more effectively. These findings indicate that in fast-growing emerging industries, firms often prioritize scale expansion at the expense of innovation management. This aligns with the dynamic capability theory, which emphasizes “managerial flexibility” as a key factor in technological catch-up. From a practical perspective, enterprises should place equal emphasis on optimizing innovation management and increasing R&D investment. For policymakers, integrating innovation management capabilities into industrial support policies can help shift firms from scale-driven to efficiency-driven growth, ultimately enhancing overall technological innovation efficiency.
To further validate the resulting trend, the traditional DEA-BBC model was used for review (calculated using Formula (4)), and the results are shown in Table 4, which showed a fluctuating downward trend in the technological innovation efficiency of new energy automobile enterprises (See Figure 3 for details). By using two different DEA models for cross-validation, the consistency of the obtained conclusions effectively enhances the reliability of the research results, indicating that the trend is not a model-specific chance result, but reflects the universality of the actual situation.

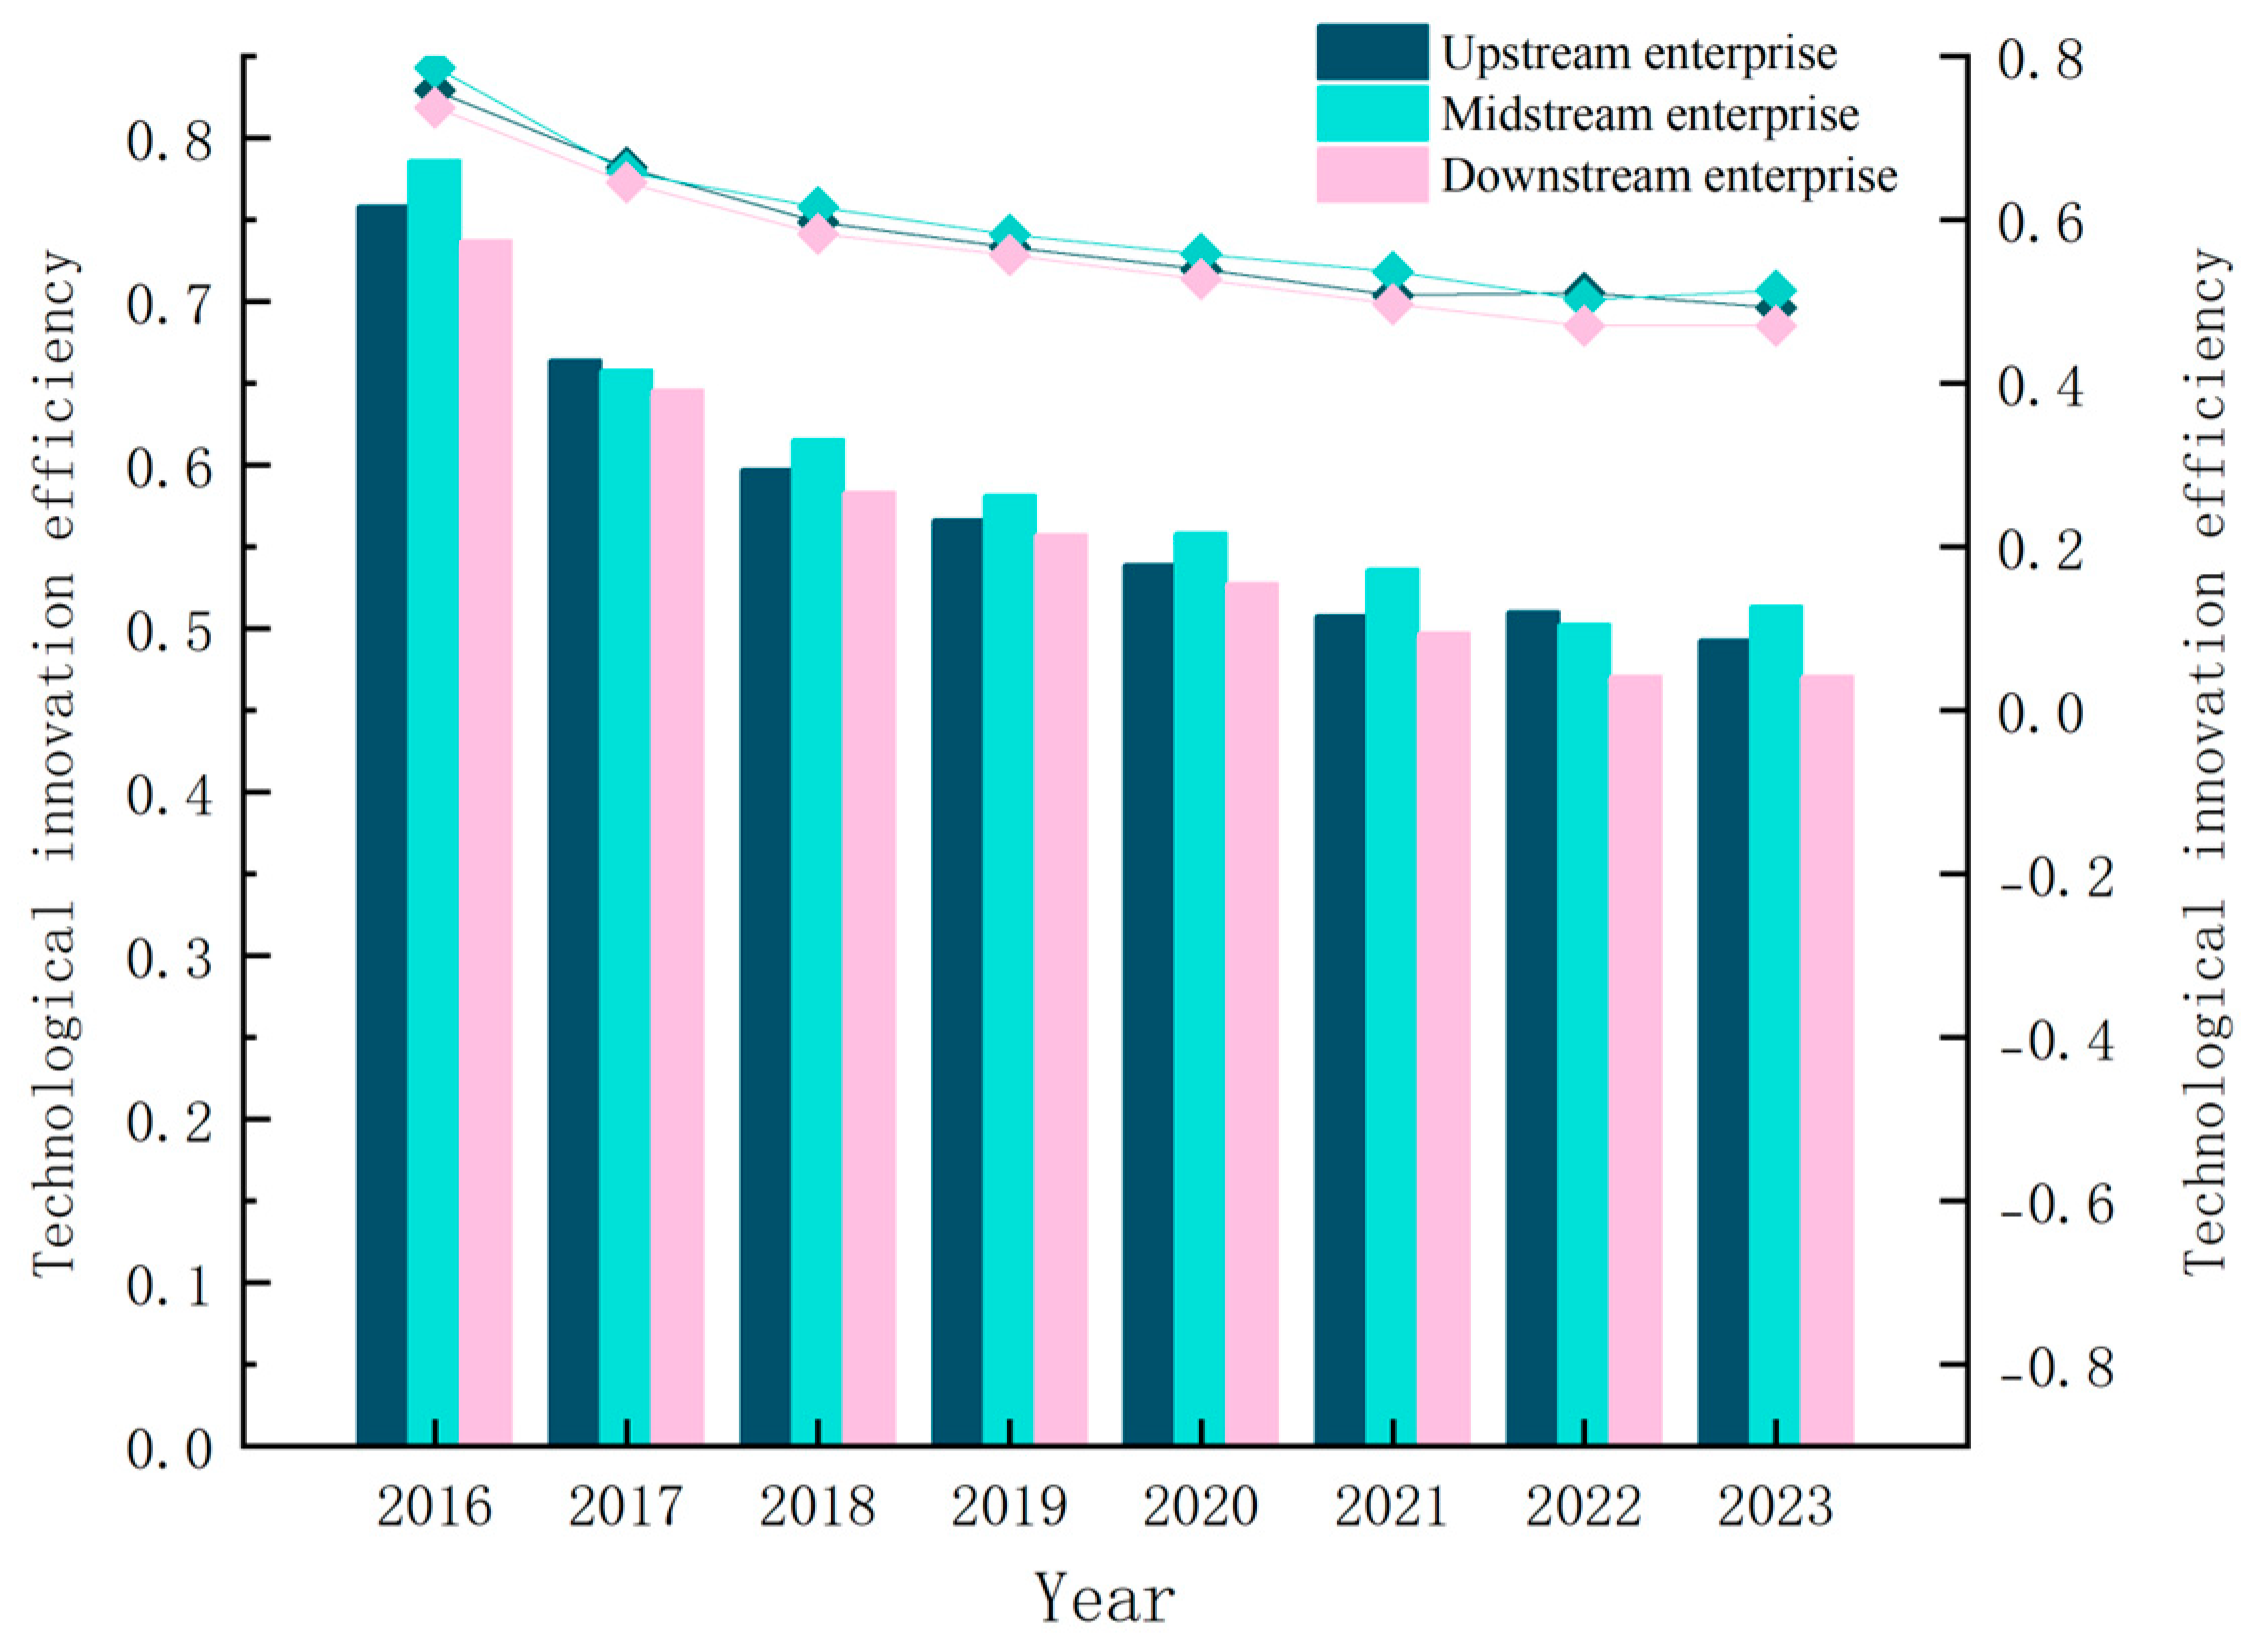
5.1.2. Based on Industry Chain Link Analysis

Table 5 presents the technological innovation efficiency across the new energy vehicle industry chain’s upstream, midstream, and downstream segments from 2016 to 2023. While enterprises in all segments exhibit a fluctuating downward trend in efficiency over this period, significant disparities persist among the different stages of the value chain (See Figure 4 for details). The data shows that the average technological innovation efficiency for midstream enterprises is 0.5940, slightly higher than the upstream figure of 0.5796, while the downstream stands at only 0.5613. This creates a trend of gradually decreasing efficiency from the midstream to upstream and downstream segments. This phenomenon reflects imbalanced development in resource allocation, technological accumulation and market environments across different segments.
A detailed analysis of the evolution of technological innovation efficiency across the three segments of the industrial chain shows that the midstream segment maintained relatively high efficiency in most years. However, it experienced the sharpest decline, dropping from 0.7863 in 2016 to 0.5136 in 2023. One possible explanation is that as market competition intensifies and technology advances rapidly, firms must continuously invest heavily in R&D to maintain their technological edge. While this drives technological progress, it also increases cost pressures, ultimately reducing efficiency. The upstream segment saw its efficiency decrease from 0.7582 in 2016 to 0.4928 in 2023, generally maintaining lower efficiency levels. This can be attributed to its focus on raw material extraction and primary processing. Constrained by resource availability, technological limitations, and environmental policies, firms in this segment prioritize stable production and cost control, often at the expense of R&D investment. This finding aligns with Smith et al. (2021), who noted that resource-intensive industries typically face weak innovation incentives [40]. Meanwhile, the downstream segment experienced a decline in efficiency from 0.7373 in 2016 to 0.4708 in 2023, consistently ranking the lowest among the three segments. Several factors contribute to this trend. Downstream activities primarily involve sales, services, and end-user applications, where intense market competition drives firms to focus on marketing and channel expansion rather than core technological breakthroughs. Additionally, frequent fluctuations in consumer demand and policy environments create uncertainty in innovation direction, further constraining efficiency. Notably, since 2018, the efficiency gap between the downstream and the other two segments has widened significantly. Addressing this widening disparity should be a priority for future policy interventions.
This discovery offers a novel theoretical viewpoint and empirical support for comprehension of innovation distribution across industrial chains. It unveils the intrinsic mechanism behind innovation efficiency differences among enterprises at various chain segments, thereby enriching relevant theories in industrial economics and innovation management. Consequently, enterprises should thoroughly comprehend their position in the industrial chain and devise differentiated strategies according to each segment’s unique characteristics. This approach will facilitate a systemic enhancement in overall innovation efficiency.

5.1.3. Dynamic Analysis of the DEA-Malmquist Index

The quantitative Malmquist–Luenberger Index (ML) tracks technological innovation’s dynamic evolution. The technological innovation performance of new energy automobile enterprises rises when the ML index is greater than one and falls when it is less than one. The ML index comprises the technical progress index (TC) and the technical efficiency change index (EC). Table 6 presents the Malmquist–Luenberger productivity indices decomposed from formulas (4) and (5) for new energy vehicle manufacturers. The data indicates that from 2016 to 2023, the Malmquist–Luenberger (ML) index for China’s new energy vehicle enterprises fluctuated, with an annual average total factor productivity of 0.954, suggesting an overall growth trend. The ML index failed to break one during the study period because the technical efficiency change index was more significant than one in 2016–2017 and 2018–2021. However, the technological progress index is consistently lower than one. The low ML index of enterprises is due to the high barriers of technological innovation, R&D investment not being converted into technological progress and other issues. In 2022–2023, the ML index peaks due to the double positive driving force of the ratio of changes in technical efficiency and the ratio of technological progress, especially the technological progress index, which grows the most this year and helps the index rise. These findings uncover the intrinsic patterns of technological innovation efficiency evolution in new energy vehicle enterprises, offering empirical evidence for understanding the dynamic changes of technological innovation over time. Enterprises can use these insights to adjust their R&D strategies, balancing investments in technological efficiency improvements and technological progress across different periods to optimize overall innovation performance.

5.2. Analysis of Research on Influencing Factors

After measuring the technological innovation efficiency of the new energy vehicle industry, it is essential to further investigate its influencing factors. This exploration aims to uncover the critical variables that either drive or hinder the improvement of technological innovation efficiency, thereby providing empirical evidence for subsequent policy refinement.

5.2.1. Descriptive Statistics of Variables

In this paper, Stata17 was used for correlation analysis, and the descriptive statistics of the variables are listed in Table 7.

5.2.2. Analysis of Tobit Overall Regression Results

In the regression analysis using the Tobit model (calculated using Formula (6)), the original dataset contained 2176 observations. However, the final adequate sample size was 2127 due to missing values during the data cleaning or the dependent variable being restricted to a truncated interval. All deleted observations did not meet the applicability conditions of the model or contained missing data and, therefore, were not involved in the analysis. Table 8 reports the Tobit regression results examining determinants of technological innovation efficiency in the new energy vehicle industry.
Table 8 (1) shows that, from an external factors perspective, different types of fiscal policy support have varying effects on technological innovation efficiency. This finding contrasts with the empirical conclusions of scholars like Norlia (2014) and Tengfei (2024), who suggest that tax incentives can effectively stimulate corporate innovation 1619. Our empirical results indicate a regression coefficient of −0.0763 for tax incentives, significant at the 1% level, suggesting that such policies may significantly inhibit improvements in firms’ technological innovation efficiency. One reason is that government qualification is a prerequisite for receiving funds. The process is easily affected by external factors. In addition, some firms may develop a “welfare dependency” mindset. They may ignore market-driven forces. This weakens the core competitiveness of long-term R&D. This finding aligns with the conclusions of Czarnitzki and Lopes-Bento (2014), who suggest that tax incentives can lead to resource misallocation, especially when policy targets are poorly defined [17]. Firms lacking genuine innovation potential may also benefit, diverting limited fiscal resources and failing to enhance overall innovation efficiency. This finding offers crucial insight for reevaluating the design logic of incentive policies on innovation. Policymakers should establish a more refined subsidy allocation mechanism, linking tax incentives closely to firms’ innovation output and performance in technology commercialization. This ensures precise and effective policy implementation, steering resources toward enterprises with genuine innovation potential. Therefore, hypothesis H1a is rejected.
The regression coefficient for the additional deduction of R&D expenses is 0.00216, significant at the 1% level. This policy promotes technological innovation efficiency in new energy vehicle companies. With increasing market competition, more firms recognize the importance of continuous R&D to enhance market competitiveness and achieve sustainable development. The policy encourages higher R&D investment in technological innovation and product upgrades. This improves innovation efficiency. This finding provides a clear direction for optimizing innovation policy tools. Future policies may further expand the scope of additional deductions. They could include supporting investments in talent training and equipment upgrades. This would support the entire innovation chain. The above discovery charts a clear course for governments to enhance innovation policy tools. Future policy design should expand the scope of super-deductions’ to include supporting investments like talent development and equipment upgrades, thus creating a comprehensive support system for the entire innovation chain. Hence, hypothesis H1b is accepted.
Market competition significantly promotes technological innovation efficiency at the 1% level. This finding is consistent with the “competition incentive” effect observed by Sana et al. (2022). The primary reasons for this may be multifaceted 22. First of all, intense competition forces firms to seek technological breakthroughs. Firms strive to outperform competitors in product performance, cost control and brand strength. In a competitive environment, firms tend to invest more in R&D. They allocate resources strictly to high-priority innovation projects. This improves the use of funds and talent and avoids ineffective investments. Competition keeps firms sensitive to consumer needs, driving rapid product and technology iterations. Moreover, competition encourages firms to explore technological cooperation and innovation models. This speeds up technology collaboration and achievement conversion. The results support the “competition drives innovation” theory and highlight the key role of market mechanisms in resource allocation. They also encourage governments to maintain a fair, competitive environment and help firms benchmark against competitors. This converts market pressure into an internal drive for continuous innovation. These results affirm the “competition drives innovation” theory, underscoring the market mechanism’s role in optimizing resource allocation. They also encourage governments to safeguard fair competition and guide enterprises in benchmarking against competitors’ innovations, converting market pressure into an internal drive for sustained innovation. This is especially vital for the NEV industry during policy phase-out periods. Therefore, hypothesis H2 is accepted.
Regarding internal factors, their impact on technological innovation efficiency differ. The regression coefficient for labor quality is −0.00139, significant at the 1% level. This finding contrasts with the assertion by Ghasemi et al. (2018) and Dubiei (2020) that high-quality talent has a positive effect on technological innovation in enterprises2729. Our results instead reveal that high-quality talent may have an inhibitory effect on improving technological innovation efficiency. In new energy vehicle companies, there may be a mismatch between labor quality and the needs of innovation tasks. High-quality labor can enhance overall innovation capacity. However, their skills not matching specific requirements may lead to overinvestment and resource waste. Training and recruiting high-quality labor require substantial investment and time. Early stages of technological innovation usually prioritize infrastructure and R&D investment. This dual pressure may lead to inefficient resource allocation. This unexpected finding challenges traditional human capital theory and underscores the need for an industry-specific evaluation system. In practice, the human resources department of enterprises should revise their talent selection criteria by prioritizing industry experience and technical fit over academic qualifications, thereby enhancing the precision and alignment of talent supply. Thus, hypothesis H3 is rejected.
The regression coefficient for financial leverage is −0.00139, but it is not statistically significant. This may be due to information asymmetry during the innovation process. In an uncertain environment, firms may become overly cautious. They fear that higher debt risk will lead to conservative innovation decisions. This prevents the practical improvement of innovation efficiency. Agency problems may also lead to biased resource allocation and investment choices. This limits the support available for technological innovation. The result enriches the application of capital structure theory in innovation. It implies that financial managers need a refined financing strategy. They should balance debt leverage and innovation investment, especially during critical technological breakthroughs. This result enriches the understanding of capital structure theory within the innovation context. For financial managers, this implies developing more sophisticated financing strategies to balance debt leverage with innovation investment, particularly maintaining financial flexibility during critical technology breakthrough phases.
The regression coefficient for financing constraints is −0.0649, significant at the 1% level. This indicates that financing constraints significantly hinder improvements in technological innovation efficiency. New energy vehicle companies need substantial funds for R&D, equipment upgrades and talent recruitment. Financing constraints make funds challenging to obtain or raise their cost. This leads to a shortage of funds and restricts R&D investment. In addition, financing difficulties force firms to rely on internal funds, leading to inefficient resource allocation. This lack of flexibility and continuity in innovation further reduces efficiency. Financing pressure also makes companies pay more attention to short-term financial performance, reduce long-term innovation investment and ultimately lower innovation efficiency. Therefore, hypothesis H4 is accepted.
Finally, equity concentration is significantly negative at the 1% level. High equity concentration significantly hinders technological innovation efficiency. Excessive concentration may weaken internal supervision. Major shareholders may act in a self-centered manner and lack transparency in decision-making. This affects key decisions in the innovation process and limits creative ideas. Major shareholders may focus on short-term financial returns. This increases short-termism and neglects long-term, high-risk innovation and R&D investments. This result deepens our understanding of the relationship between corporate governance and innovation. Firms should optimize their equity structure. They can introduce strategic investors to balance major shareholders’ power. They should establish innovation tolerance mechanisms and include long-term innovation performance in executive evaluations. This result deepens the study of the relationship between corporate governance and innovation. In governance practice, firms should optimize equity structures by introducing strategic investors to check major shareholders’ power. Concurrently, establish an innovation fault-tolerance mechanism and incorporate long-term innovation performance into executive evaluation systems. Therefore, hypothesis H5 is accepted.

5.2.3. Analysis by Industry Chain

Based on their industry chain links, companies are classified as upstream, midstream, or downstream. Following this categorization framework, the Tobit model is used to analyze enterprise factors in each link to identify key issues and provide more precise policy recommendations and guidance on enterprise practices to improve technological innovation.
As shown in columns (2)–(4) of Table 8, financial leverage, tax incentives and R&D expense deductions differ significantly among enterprises in different industrial chain links. Different capital demands, innovation characteristics, and risk-taking abilities of enterprises in each link may explain these differences.
Financial leverage negatively impacts the technological innovation efficiency of midstream and downstream new energy vehicle (NEV) enterprises but positively affects upstream firms, though none are significant. Upstream firms, focused on raw material and basic technology R&D with lower risks and stable returns, leverage financial resources to accelerate R&D and capacity expansion. Their larger asset bases enable higher borrowing capacity to spread risks and enhance innovation. Conversely, midstream firms like battery manufacturers require extensive R&D cycles and significant capital. Excessive leverage may limit their ability to fund high-risk, high-return R&D, thus hindering innovation. Downstream firms, centered on assembly and sales, depend on stable cash flows for production scaling and market expansion, making them vulnerable to liquidity issues under high leverage, further constraining innovation.
R&D tax deductions significantly boost the technological innovation efficiency of upstream and midstream enterprises at the 1% significance level. However, they have a negative but statistically insignificant impact on downstream firms. This is likely because R&D tax deductions reduce pre-tax R&D costs, directly easing financial burdens and encouraging investment in innovation. For upstream and midstream enterprises, particularly those reliant on technological breakthroughs, these incentives directly support increased R&D spending, improving innovation efficiency. In contrast, downstream firms prioritize marketing, branding and distribution rather than R&D. Their innovation mainly focuses on automation and smart manufacturing, which depend more on market conditions than on direct R&D incentives. As a result, the policy’s impact on their technological innovation is limited.
Tax incentives significantly reduce the technological innovation efficiency of midstream and downstream enterprises but do not have an apparent adverse effect on upstream firms. This is likely because tax incentives cover a broad range of fiscal policies, including deductions for equipment investment and production expansion, rather than focusing solely on R&D. Their primary goal is to encourage capacity expansion rather than technological breakthroughs. Downstream firms refine existing technologies and adjust to market demands rather than pursue high-risk innovation. As a result, tax incentives may drive production growth and process optimization but fail to promote fundamental technological progress. Tax incentives may create short-term financial pressure for midstream enterprises with long R&D cycles and high capital demands. Instead of directing funds toward disruptive innovation, firms might use them to expand production or cut costs, such as upgrading manufacturing facilities. This misallocation reduces the effectiveness of tax incentives in fostering long-term innovation efficiency.

6. Conclusions and Responses

Building upon the prior theoretical and empirical analysis of technological innovation efficiency in new energy vehicle enterprises, we now distill the key findings and offer targeted policy recommendations. These are designed to offer practical guidance for enhancing technological innovation efficiency in these enterprises.

6.1. Conclusions of the Study

This study, grounded in the innovation value chain theory, develops an evaluation framework incorporating undesirable outputs such as energy consumption and pollutant emissions. Utilizing the super-efficiency network SBM–Malmquist model and Tobit regression, we empirically analyze the technological innovation efficiency of 272 A-share listed new energy vehicle companies in China from 2016 to 2023. The results indicate that overall technological innovation efficiency declined from 0.7606 in 2016 to 0.4924 in 2023, mainly due to a decrease in pure technical efficiency (from 0.7807 to 0.4979), reflecting shortcomings in resource allocation, R&D management and technology transfer. Analysis by industry chain segment reveals that midstream companies have a higher average efficiency (0.5940) than upstream (0.5796) and downstream (0.5613) firms, highlighting differences in technological accumulation and market conditions. In the dynamic analysis, the average annual total factor productivity measured by the Malmquist–Luenberger index is only 0.954, primarily due to lagging technological progress and low conversion efficiency of R&D investment. Further, Tobit regression results show that the “welfare dependency” effect of tax incentives and misalignment of workforce skills hinder efficiency improvements, whereas R&D super-deduction and market competition significantly promote technological innovation efficiency. By introducing a two-stage efficiency evaluation framework, this study comprehensively quantifies the technological innovation efficiency and its dynamic changes in the new energy vehicle sector, providing empirical evidence for optimizing R&D management, resource allocation, and policy formulation, with important implications for the high-quality development of the global new energy vehicle industry.
Despite its contributions, this study has certain limitations. First, the data mainly come from A-share listed companies in China, so the findings may not fully represent global trends in NEV technological innovation. Second, the research focuses primarily on internal corporate factors, such as R&D investment and fiscal incentives, without deeply exploring how collaborative innovation among upstream and downstream firms influences efficiency. Additionally, while the study examines government fiscal incentives and related policies, policy effects often take time to materialize. The limited time frame of this research makes it challenging to capture long-term policy impacts on corporate innovation. Finally, the study does not explore different innovation models and organizational structures in depth, leaving room for further analysis of their roles in shaping technological innovation efficiency.
Future research can address these gaps in several ways. Expanding the data scope and conducting cross-market comparisons can help analyze how different market environments influence innovation efficiency. Exploring collaborative innovation within the NEV industrial chain through network analysis could provide deeper insights into how firms interact to drive innovation. Employing time–series analysis or dynamic panel models can help assess the long-term effects of government policies. Investigating the impact of different innovation models and organizational structures can offer practical guidance for optimizing corporate innovation management. By addressing these areas, future research can contribute to a more comprehensive understanding of technological innovation in NEV enterprises and provide more substantial theoretical and practical support for the industry’s sustainable growth.

6.2. Recommendations for Countermeasures

6.2.1. Optimize Resource Management and Innovation

Enhance technological efficiency and resource allocation in new energy vehicle enterprises by implementing goal-oriented R&D performance appraisal systems, prioritizing high-potential domains and fostering cross-departmental collaboration to reduce inefficiencies. Establish regional technology transformation centers to accelerate the commercialization of laboratory achievements, leveraging partnerships between enterprises, research institutions and universities. Technology incubators can expedite market validation and the transition from R&D to mass production.

6.2.2. Refine Fiscal and Tax Policies

Tailor fiscal policies to incentivize corporate R&D effectively. Align tax incentives with enterprise achievements, such as patents and technical standards, to prevent inefficiencies and misreporting. Provide targeted tax benefits for SMEs and startups to alleviate innovation costs. Develop region-specific policies, such as R&D incentives for midstream technology-centric areas and consumption tax exemptions for downstream manufacturing hubs.

6.2.3. Balance R&D and Production for Upstream Sustainability

Ensure upstream sustainability by balancing investments in R&D and production operations. Enhance supply chain management to stabilize raw material quality and minimize risks. Promote environmental protection through eco-friendly technologies, resource efficiency and pollution reduction. This dual approach improves corporate image and competitiveness while fostering economic and social sustainability.

6.2.4. Boost Midstream Core Technological Competitiveness

Invest in key areas like battery energy density and motor efficiency to drive midstream innovation. Encourage long-term partnerships across the supply chain to enhance collaborative innovation. Introduce policies to localize technology and reduce reliance on foreign suppliers for production equipment and materials.

6.2.5. Promote Market-Driven Downstream Innovation

Downstream enterprises should focus on intelligent, platform-based production and align R&D with consumer demand through market-oriented strategies. Encourage the development of advanced driving technologies and modular production platforms to lower costs and improve adaptability. Strengthen consumer incentive policies and implement credit support programs to expand market opportunities, thereby driving technological innovation in the downstream sector.

Author Contributions

Conceptualization, Y.X.; methodology, Y.L.; software, Y.X.; validation, Y.X., Y.L. and Z.W; formal analysis, Y.L.; investigation, Y.L.; resources, Z.W.; data curation, Y.L; writing—original draft preparation, Y.L.; writing—review and editing, Y.L. and Z.W; visualization, Y.X.; supervision, Y.X.; project administration, Y.L.; funding acquisition, Y.X. All authors have read and agreed to the published version of the manuscript.

Funding

Ministry of Education Humanities and Social Sciences Research General Project “Study on the Responsibility Sharing Accounting and Accountability Mechanism for Coordinated Air Pollution Control in the Yellow River Basin” Project No: 24YJC630260.

Data Availability Statement

The raw data supporting the conclusions of this article will be made available by the authors on request.

Acknowledgments

The authors sincerely thank the National Bureau of Statistics of China for providing related datasets.

Conflicts of Interest

The authors declare no competing financial interests or personal relationships that could influence the work reported in this paper.

Abbreviations

DUMDecision-making units
MLMalmquist-Luenberger
TCTechnological Change
ECEfficiency Change
PECPure Efficiency Change
SECScale Efficiency Change
IEEfficiency of technological innovation
QosQiality of labor force
LeveFinancial everage
GrowthEnterprise growth capacity
WWFinancing constrains
ECMarket competitivenes
OCShareholding concentration
RdedDeduction of R&D expenses
TaxbTax incentives

References

  1. Axios. Axios AM Thought Bubble: New Climate Reality. Axios. Available online: https://www.axios.com/newsletters/axios-thought-bubble-7567eb80-fdfe-11ef-9ad5-c39624c669a2 (accessed on 10 March 2025).
  2. Times Union. Editorial: Fiddling While the World Warms. Times Union. Available online: https://www.timesunion.com/opinion/article/editorial-fiddling-world-warms-20213267.php (accessed on 10 March 2025).
  3. Cheng, X.Z.; Tang, X.T. Research on the Efficiency of Technological Innovation and Influencing Factors in Strategic Emerging Industries: A Perspective from the New Energy Vehicle Industry. East China Econ. Manag. 2024, 38, 54–64. [Google Scholar] [CrossRef]
  4. Lutz, B.J.; Massier, P.; Sommerfeld, K.; Löschel, A. Drivers of energy efficiency in German manufacturing: A firm-level stochastic frontier analysis. Soc. Sci. Electron. Publ. 2017, 2017, 17–68. [Google Scholar] [CrossRef]
  5. Al-Refaie, A.; Wu, C.-W.; Sawalheh, M. DEA window analysis for assessing efficiency of blistering process in a pharmaceutical industry. Neural Comput. Appl. 2019, 31, 3703–3717. [Google Scholar] [CrossRef]
  6. Xiao, R.; Ding, J. Green innovation efficiency of enterprises in China and its spatial spillover effect: Based on two-stage value chain perspective. J. Shanxi Univ. Financ. Econ. 2017, 39, 14. [Google Scholar]
  7. Fang, S.; Xue, X.; Yin, G.; Fang, H.; Zhang, Y. Evaluation and improvement of technological innovation efficiency of new energy vehicle enterprises in China based on DEA-Tobit model. Sustainability 2020, 12, 7509. [Google Scholar] [CrossRef]
  8. Chen, V.Z.; Li, J.; Shapiro, D.M. Ownership structure and innovation: An emerging market perspective. Asia Pac. J. Manag. 2014, 31, 1–24. [Google Scholar] [CrossRef]
  9. Jefferson, G.H.; Su, J. Privatization and restructuring in China: Evidence from shareholding ownership, 1995–2001. J. Comp. Econ. 2006, 34, 146–166. [Google Scholar] [CrossRef]
  10. Zhang, Z.; Shao, Q.; La, R. Research on the efficiency of technological innovation resource allocation in national independent innovation demonstration zones. Henan Sci. 2020, 38, 9. [Google Scholar]
  11. Ederer, F.; Manso, G. Is pay for performance detrimental to innovation? Manag. Sci. 2013, 59, 1496–1513. [Google Scholar] [CrossRef]
  12. Michele, M.; James, M.; Joyce, T. Political influences on biotechnology-based innovation for European agriculture: Risk-assessment and risk management. Technol. Anal. Strateg. Manag. 2021, 33, 271–282. [Google Scholar]
  13. Hecker, A.; Ganter, A. The influence of product market competition on technological and management innovation: Firm-level evidence from a large-scale survey. Eur. Manag. Rev. 2013, 10, 17–33. [Google Scholar] [CrossRef]
  14. Amara, N.; Landry, R.; Traore, N. Managing the protection of innovations in knowledge-intensive business services. Res. Policy 2008, 37, 1530–1547. [Google Scholar] [CrossRef]
  15. Czarnitzki, D.; Lopes-Bento, C. Innovation subsidies: Does the funding source matter for innovation intensity and performance? Empirical evidence from Germany. Ind. Innov. 2014, 21, 380–409. [Google Scholar] [CrossRef]
  16. Norlia, A. Technological innovations and consumer needs: An analysis of the mobile communications market. ASEAN Mark. J. 2013, 3, 1. [Google Scholar]
  17. Fukuyama, H.; Weber, W.L. A directional distance function approach to dynamic efficiency measurement. Eur. J. Oper. Res. 2010, 207, 1103–1110. [Google Scholar]
  18. Hao, J.; Zhang, J.; Li, Y. Innovation efficiency in China’s high-tech industry: A dynamic network DEA approach. Technol. Forecast. Soc. Change 2018, 135, 1–10. [Google Scholar]
  19. Tengfei, L.; Ullah, A. Impact of fiscal policies and green financing on firm innovation and firm value for green economic recovery. Heliyon 2024, 10, e30145. [Google Scholar] [CrossRef]
  20. Bao, J.; Li, F. The impact of R&D expense deduction policy on innovation output of high-tech enterprises. Tax Res. 2024, 2024, 32–41. [Google Scholar]
  21. Zhu, P.; Ji, Y.; Yao, Q.; Wang, Y.S. Incentive effect of R&D expense deduction policy for high-tech enterprises: Based on an extended counterfactual model. Econ. Res. 2024, 2024. [Google Scholar]
  22. Sana, S.S.; Boros, E. A Structural Mathematical Model on a Two-Echelon Supply Chain System; Springer: Berlin/Heidelberg, Germany, 2022. [Google Scholar]
  23. Lv, H.; Qian, H. Research on improving innovation efficiency of new energy vehicle enterprises in China from the perspective of innovation value chain. Manag. Adm. 2024, 2024. [Google Scholar]
  24. Yu, Y.; Cheng, L.; Zhang, D.; Linton, J. How Does Market Competition Affect Enterprise Cooperative Innovation? The Moderating Role of Intellectual Property Protection and Government Subsidies; Elsevier: Amsterdam, The Netherlands, 2024. [Google Scholar]
  25. Autor, D.; Dorn, D.; Hanson, G.; Pisano, G.; Shu, P. Foreign competition and domestic innovation: Evidence from U.S. patents. Am. Econ. Rev. Insights 2017, 2, 357–374. [Google Scholar] [CrossRef]
  26. Aytun, C.; Erdogan, S.; Pata, U.K.; Cengiz, O. Associating environmental quality, human capital, financial development, and technological innovation in 19 middle-income countries: A disaggregated ecological footprint approach. Technol. Soc. 2024, 76, 102445. [Google Scholar] [CrossRef]
  27. Ghasemi, R.; Mahbanooei, B.; Beigi, R.G. The relationship between labor market efficiency and innovation. In Proceedings of the 11th International Seminar on Industrial Engineering & Management (ISIEM), Sulawesi Selatan, Indonesia, 27–29 November 2018. [Google Scholar]
  28. Soh, F.; Grover, V. Leveraging platform boundary resources: The role of distributed sensemaking. J. Manag. Inf. Syst. 2022, 39, 366–394. [Google Scholar] [CrossRef]
  29. Dubiei, Y.V. Interrelation between human capital and innovation in the context of technical and technological development of a country. Sci. Bull. Natl. Min. Univ. 2020, 6. [Google Scholar] [CrossRef]
  30. Yuan, X.; Wang, H.; Tan, W. Impact of creative talent agglomeration on innovation efficiency of creative industries. J. Shanghai Bus. Sch. 2024, 2024. [Google Scholar]
  31. Shahzad, S.J.H.; Ali, P.; Ahmad, A.; Tanveer, A. Financial leverage and corporate performance: Does financial crisis owe an explanation? Pak. J. Stat. Oper. Res. 2015, 2015, 67–90. [Google Scholar] [CrossRef]
  32. Iqbal, N.; Xu, J.F.; Fareed, Z.; Wan, G.; Ma, L. Financial leverage and corporate innovation in Chinese public-listed firms. Eur. J. Innov. Manag. 2022, 25, 299–323. [Google Scholar] [CrossRef]
  33. Ren, D.; Wu, F.; Chang, X. Corporate leverage and technological innovation: Promotion or inhibition? Empirical evidence based on channel mechanism and structural heterogeneity. J. Humanit. 2021, 2021, 50–59. [Google Scholar]
  34. Jao, R.; Hamzah, D.; Laba, A.R.; Mediaty, M. Investor decision in estimating the effect of earning persistence, financial leverage, and foreign ownership toward company reputation and value. Int. J. Financ. Res. 2020, 11, 453–461. [Google Scholar] [CrossRef]
  35. Oliver, H. Incomplete contracts and public ownership: Remarks, and an application to public-private partnerships. Econ. J. 2003, 486, C69–C76. [Google Scholar]
  36. Wang, W.; Hu, B.; Liu, J. Can external auditing promote corporate technological innovation? Empirical evidence from Chinese firms. Audit. Econ. Res. 2020, 35, 11. [Google Scholar]
  37. Jensen, M.C.; Meckling, W.H. Theory of the firm: Managerial behavior, agency costs, and ownership structure. J. Financ. Econ. 1976, 3, 305–360. [Google Scholar] [CrossRef]
  38. Victor, D.; Zhou, D.; Ahmed, E.H.M.; Dadhich, P.K.; Olivier, J.; Rogner, H.H.; Sheikho, K.; Yamaguchi, M.; Edenhofer, O.; Pichs-Madruga, R.; et al. Introductory chapter. In Climate Change 2014: Mitigation of Climate; Cambridge University Press: Cambridge, UK, 2014. [Google Scholar]
  39. Mao, J.; Guo, Y.; Cao, J. Financing platform debt and environmental pollution management. Manag. World 2022, 38, 96–118. (In Chinese) [Google Scholar]
  40. Smith, A.; Williams, R. Innovation Dynamics in Resource-Intensive Industries: Challenges and Opportunities. J. Ind. Econ. 2021, 69, 456–478. [Google Scholar]
Figure 1. Structural framework diagram.
Wevj 16 00233 g001
Figure 2. Trend chart of comprehensive technological innovation efficiency in the new energy automobile industry from 2016 to 2023 (SBM-DEA model).
Wevj 16 00233 g002
Figure 3. Trend chart of comprehensive technological innovation efficiency in the new energy automobile industry from 2016 to 2023 (DEA-BBC model).
Wevj 16 00233 g003
Figure 4. 2016–2023 technological innovation efficiency of all industrial chain links.
Wevj 16 00233 g004
Table 1. Variable names and descriptions.
PointIndicator CategoryIndicator NameDescription of Indicators
Science and technology research and development phaseManpower inputsR&D personnel equivalent X 1 1 Number of enterprise R&D personnel in the year (persons)
Capital investmentR&D investment intensity X 2 1 Enterprise R&D investment expenditure/enterprise revenue
Government subsidy X 3 1 Enterprise government subsidies/enterprise operating income
Intermediate outputsR&D patent applications Y 1 1   o r   X 1 2 Total number of patents obtained by enterprises independently and jointly
Transformation phaseNumber of R&D effective invention patents Y 2 1   o r   X 2 2 Number of invention patents granted to enterprises in the course of R&D and still in the protection period
Energy inputsTotal energy consumption X 3 1 Tons of standard coal
Expected outputsCorporate operating margin Y 1 2 Profit from business/revenue from business
Enterprise return on net assets Y 2 2 Corporate net profit/shareholders’ equity
Non-expected outputsTotal pollutant emission intensity Y 3 2 ln (combined water pollution equivalent + air pollution emission equivalent + 1)
Table 2. Definition of influencing factor variables.
Indicator NameIndicator NameVariable SymbolDescription of Indicators
Efficiency of technological innovationEfficiency of technological innovationIEResults from SBM-DEA calculations
Quality of labor forceQuality of labor forceQosRatio of employees with bachelor’s degree or above to the total number of employees in the enterprise
Financial leverageLeveCorporate government subsidies to operating income ratio (%)
Financing constraintsWW−0.091 × Cash flow/total assets—0.062 × cash dividend payment dummy variable + 0.021 × financial leverage—0.044 × firm size + 0.102 × industry average sales growth rate—0.035 × sales revenue growth rate
Market competitivenessECThe sum of the squares of the market shares of all new energy vehicle companies in the market
Shareholding concentrationOCProportion of shares held by the largest shareholder of the enterprise
Deduction of R&D expensesRdedln (R&D expenses × percentage deduction)
Tax incentivesTaxb(Amount of various types of tax rebates/ratio of the amount of various types of tax rebates to the total amount of tax payable) × 100%
Table 3. 2016–2023 technological innovation efficiency of new energy automobile industry (SBM-DEA model).
20162017201820192020202120222023Average
Technical efficiency0.76060.65600.59870.56850.54160.51380.49460.49240.5783
Pure technical efficiency0.78070.66770.60630.57470.54920.52070.50240.49790.5874
Scale efficiency0.97650.98390.98760.98900.98730.98700.98620.98850.9858
Table 4. 2016–2023 Technological innovation efficiency of new energy automobile industry (DEA-BBC model).
20162017201820192020202120222023Average
Technical efficiency0.91080.85070.83090.82700.82200.80810.79330.80250.8225
Pure technical efficiency0.91890.85960.84730.84670.84280.82690.81460.83590.8596
Scale efficiency0.99140.99000.98110.97740.97650.97820.97490.97310.9803
Table 5. 2016–2023 technological innovation efficiency of new energy automobile industry in different industrial chain links.
20162017201820192020202120222023Average
Upstream enterprise0.75820.66410.59720.56660.53930.50780.51040.49280.5796
Midstream enterprise0.78630.6580.61560.58150.55810.53640.50260.51360.5940
Downstream enterprise0.73730.64590.58330.55740.52740.49720.47080.47080.5613
Average value0.76060.65600.59870.56850.54160.51380.49460.49240.5783
Table 6. Dynamic efficiency of Malmquist–Luenberger index and its decomposition, 2016–2023.
YearECTCPECSEC
2016–20171.010.8961.0061.004
2017–20180.990.9270.9960.994
2018–20191.0380.9151.0361.002
2019–20201.0000.9641.0050.995
2020–20211.0050.9631.0021.003
2021–20220.9970.9681.0010.996
2022–20231.0021.0140.9991.004
Average value1.0060.9491.0061.000
Table 7. Descriptive statistics of variables.
VarNameMeanSDMinMedianMaxObs
IE0.5780.5620.1160.1821.1922176
Taxb0.1970.1200.20500.8412176
Rded54.68754.9314.4278.780101.162126
OC18.6918.5721.43413.00123.7482176
Qos21.6617.6816.10093.372176
Leve1.2481.0631.469−5.22038.9892176
WW−0.00200.044−1.86602176
EC0.2070.1620.130012176
Table 8. Regression results of influencing factors of technological innovation efficiency in new energy automobile industry.
VarName(1)(2)(3)(4)
SynthesisUpstreamMidstreamDownstream
Coefficientz-Valuep > |z|Coefficientz-Valuep > |z|Coefficientz-Valuep > |z|Coefficientz-Valuep > |z|
Taxb−0.0763 ***
(0.015)
−5.080.000−0.00213
(−0.17)
−0.070.947−0.0705 ***
(0.0176)
−4.000.000−0.200 ***
(0.0486)
−4.110.000
Rded0.00216 ***
(0.00022)
9.770.0000.0176 ***
(0.00046)
3.890.0000.00223 ***
(0.000266)
8.380.000−0.000145
(0.00074)
−0.200.845
OC0.128 ***
(0.0216)
5.910.0000.0859 **
(0.0456)
1.880.0600.119 ***
(0.0255)
4.660.0000.288 ***
(0.075)
3.840.000
Qos−0.00139 ***
(0.00238)
−5.840.000−0.00106 *
(0.000561)
−1.890.058−0.00126 **
(0.000327)
−3.870.000−0.00152 ***
(0.000488)
−3.110.002
Leve−0.00139
(0.00116)
−1.190.2330.00247
(0.00392)
0.630.528−0.00207
(0.0015)
−1.370.170−0.00130
(0.002)
−0.650.515
WW−0.0649 ***
(0.0056)
−11.600.000−0.0764 **
(0.0155)
−4.930.000−0.0586 ***
(0.00614)
−9.530.000−0.0651 ***
(0.016)
−4.080.000
EC−0.0739 ***
(0.00309)
−23.930.000−0.0716 ***
(0.00595)
−12.050.000−0.0977 ***
(0.00426)
−22.920.000−0.0404 ***
(0.00533)
−7.560.000
_cons1.799 ***
(0.0593)
30.320.0001.766 ***
(0.116)
15.250.0002.236 ***
(0.00824)
27.140.0001.301 ***
(0.0999)
13.030.000
sigma_u0.0877 ***
(0.0054)
16.240.0000.0731 ***
(0.0104)
7.020.0000.105 ***
(0.00711)
14.800.0000.0718 ***
(0.0123)
5.830.000
sigma_e0.0727 ***
(0.00126)
57.530.0000.0756 ***
(0.003)
25.180.0000.0670 ***
(0.00139)
48.370.0000.0779 ***
(0.0038)
20.520.000
N2127 400 1460 267
Note: ***, **, * indicate significant at the 1%, 5% and 10% statistical levels, respectively. Standard errors are in parentheses.
Disclaimer/Publisher’s Note: The statements, opinions and data contained in all publications are solely those of the individual author(s) and contributor(s) and not of MDPI and/or the editor(s). MDPI and/or the editor(s) disclaim responsibility for any injury to people or property resulting from any ideas, methods, instructions or products referred to in the content.

