
Alveolar–Arterial Gradient Is an Early Marker to Predict Severe Pneumonia in COVID-19 Patients

 ,
,  ,
,  , and
, and
Abstract
:1. Introduction
2. Materials and Methods
3. Results
4. Discussion
5. Conclusions
Author Contributions
Funding
Institutional Review Board Statement
Informed Consent Statement
Data Availability Statement
Conflicts of Interest
References
- WHO; The World Bank. Tracking Universal Health Coverage-2021 Global Monitoring Report, Geneva 2021. Available online: https://cdn.who.int/media/docs/default-source/world-health-data-platform/events/tracking-universal-health-coverage-2021-global-monitoring-report_uhc-day.pdf?sfvrsn=fd5c65c6_5&download=true (accessed on 15 April 2022).
- Yang, X.; Yu, Y.; Xu, J.; Shu, H.; Xia, J.; Liu, H.; Wu, Y.; Zhang, L.; Yu, Z.; Fang, M.; et al. Clinical course and outcomes of critically ill patients with SARS-CoV-2 pneumonia in Wuhan, China: A single-centered, retrospective, observational study. Lancet Respir. Med. 2020, 8, 475–481. [Google Scholar] [CrossRef] [Green Version]
- Prediletto, I.; D’Antoni, L.; Carbonara, P.; Daniele, F.; Dongilli, R.; Flore, R.; Pacilli, A.M.G.; Pisani, L.; Tomsa, C.; Vega, M.L.; et al. Standardizing PaO2 for PaCO2 in P/F ratio predicts in-hospital mortality in acute respiratory failure due to COVID-19: A pilot prospective study. Eur. J. Intern. Med. 2021, 92, 48–54. [Google Scholar] [CrossRef] [PubMed]
- Chu, D.K.; Kim, L.H.-Y.; Young, P.J.; Zamiri, N.; Almenawer, S.A.; Jaeschke, R.; Szczeklik, W.; Schünemann, H.J.; Neary, J.D.; Alhazzani, W. Mortality and morbidity in acutely ill adults treated with liberal versus conservative oxygen therapy (IOTA): A systematic review and meta-analysis. Lancet 2018, 391, 1693–1705. [Google Scholar] [CrossRef]
- ARDS Definition of Task Force; Ranieri, V.M.; Rubenfeld, G.D.; Thompson, B.T.; Ferguson, N.D.; Caldwell, E.; Fan, E.; Camporota, L.; Slutsky, A.S. Acute Respiratory Distress Syndrome: The Berlin Definition. JAMA 2012, 307, 2526–2533. [Google Scholar] [CrossRef] [PubMed]
- Zhou, F.; Yu, T.; Du, R.; Fan, G.; Liu, Y.; Liu, Z.; Xiang, J.; Wang, Y.; Song, B.; Gu, X.; et al. Clinical course and risk factors for mortality of adult inpatients with COVID-19 in Wuhan, China: A retrospective cohort study. Lancet 2020, 395, 1054–1062. [Google Scholar] [CrossRef]
- World Health Organization. Living Guidance for Clinical Management of COVID-19. Available online: https://www.who.int/publications/i/item/WHO-2019-nCoV-clinical-2021-22021 (accessed on 13 April 2022).
- National Institutes of Health. COVID-19 Treatment Guidelines Panel. Coronavirus Disease 2019 (COVID-19) Treatment Guidelines. Available online: https://www.covid19treatmentguidelines.nih.gov/ (accessed on 30 July 2021).
- Alhazzani, W.; Evans, L.; Alshamsi, F.; Møller, M.H.; Ostermann, M.; Prescott, H.C.; Arabi, Y.M.; Loeb, M.; Gong, M.N.; Fan, E.; et al. Surviving Sepsis Campaign Guidelines on the Management of Adults with Coronavirus Disease 2019 (COVID-19) in the ICU: First Update. Crit. Care Med. 2021, 49, e219–e234. [Google Scholar] [CrossRef]
- Damiani, E.; Adrario, E.; Girardis, M.; Romano, R.; Pelaia, P.; Singer, M.; Donati, A. Arterial hyperoxia and mortality in critically ill patients: A systematic review and meta-analysis. Crit. Care 2014, 18, 711. [Google Scholar] [CrossRef] [Green Version]
- Ni, Y.-N.; Wang, Y.-M.; Liang, B.-M.; Liang, Z.-A. The effect of hyperoxia on mortality in critically ill patients: A systematic review and meta analysis. BMC Pulm. Med. 2019, 19, 53. [Google Scholar] [CrossRef]
- Carlino, M.V.; Valenti, N.; Cesaro, F.; Costanzo, A.; Cristiano, G.; Guarino, M.; Sforza, A. Predictors of Intensive Care Unit admission in patients with coronavirus disease 2019 (COVID-19). Monaldi Arch. Chest Dis. 2020, 90. [Google Scholar] [CrossRef]
- Kamran, S.M.; Mirza, Z.; Moeed, H.A.; Naseem, A.; Hussain, M.; Fazal, I.; Saeed, F.; Alamgir, W.; Saleem, S.; Riaz, S. CALL Score and RAS Score as Predictive Models for Coronavirus Disease 2019. Cureus 2019, 12, e11368. [Google Scholar] [CrossRef]
- de Roos, M.P.; Kilsdonk, I.D.; Hekking, P.-P.W.; Peringa, J.; Dijkstra, N.G.; Kunst, P.W.A.; Bresser, P.; Reesink, H.J. Chest computed tomography and alveolar–arterial oxygen gradient as rapid tools to diagnose and triage mildly symptomatic COVID-19 pneumonia patients. ERJ Open Res. 2021, 7, 00737–2020. [Google Scholar] [CrossRef] [PubMed]
- Guan, W.; Ni, Z.; Hu, Y.; Liang, W.; Ou, C.; He, J.; Liu, L.; Shan, H.; Lei, C.; Hui, D.S.C.; et al. Clinical Characteristics of Coronavirus Disease 2019 in China. NEJM 2020, 382, 1708–1720. [Google Scholar] [CrossRef] [PubMed]
- Secco, G.; Salinaro, F.; Bellazzi, C.; La Salvia, M.; Delorenzo, M.; Zattera, C.; Barcella, B.; Resta, F.; Vezzoni, G.; Bonzano, M.; et al. Can Alveolar-Arterial Difference and Lung Ultrasound Help the Clinical Decision Making in Patients with COVID-19? Diagnostics 2021, 11, 761. [Google Scholar] [CrossRef] [PubMed]
- Farina, G.; Gianstefani, A.; Salvatore, V.; Anziati, M.; Baldassarri, F.; Beleffi, M.; Cannizzaro, A.M.; Casadei, E.; Fantini, J.; Tubertini, E.; et al. Alveolar-to-arterial oxygen gradient: Role in the management of COVID-19 infection mild population. ResearchSquare 2020. [Google Scholar] [CrossRef]
- Metlay, J.P.; Waterer, G.W.; Long, A.C.; Anzueto, A.; Brozek, J.; Crothers, K.; Cooley, L.A.; Dean, N.C.; Fine, M.J.; Flanders, S.A.; et al. Diagnosis and Treatment of Adults with Community-acquired Pneumonia. An Official Clinical Practice Guideline of the American Thoracic Society and Infectious Diseases Society of America. Am. J. Respir. Crit. Care Med. 2019, 200, e45–e67. [Google Scholar] [CrossRef]
- Prasad, K.; McLoughlin, C.; Stillman, M.; Poplau, S.; Goelz, E.; Taylor, S.; Nankivil, N.; Brown, R.; Linzer, M.; Cappelucci, K.; et al. Prevalence and correlates of stress and burnout among U.S. healthcare workers during the COVID-19 pandemic: A national cross-sectional survey study. eClinicalMedicine 2021, 35, 100879. [Google Scholar] [CrossRef]
- Huang, C.; Wang, Y.; Li, X.; Ren, L.; Zhao, J.; Hu, Y.; Zhang, L.; Fan, G.; Xu, J.; Gu, X.; et al. Clinical features of patients infected with 2019 novel coronavirus in Wuhan, China. Lancet 2020, 395, 497–506. [Google Scholar] [CrossRef] [Green Version]
- Li, K.; Wu, J.; Wu, F.; Guo, D.; Chen, L.; Fang, Z.; Li, C. The Clinical and Chest CT Features Associated with Severe and Critical COVID-19 Pneumonia. Investig. Radiol. 2020, 55, 327–331. [Google Scholar] [CrossRef]
- Tian, S.; Hu, N.; Lou, J.; Chen, K.; Kang, X.; Xiang, Z.; Chen, H.; Wang, D.; Liu, N.; Liu, D.; et al. Characteristics of COVID-19 infection in Beijing. J. Infect. 2020, 80, 401–406. [Google Scholar] [CrossRef] [Green Version]
- Ruan, Q.; Yang, K.; Wang, W.; Jiang, L.; Song, J. Clinical predictors of mortality due to COVID-19 based on an analysis of data of 150 patients from Wuhan, China. Intensive Care Med. 2020, 46, 846–848. [Google Scholar] [CrossRef] [Green Version]
- Wu, C.; Chen, X.; Cai, Y.; Xia, J.; Zhou, X.; Xu, S.; Huang, H.; Zhang, L.; Zhou, X.; Du, C.; et al. Risk Factors Associated with Acute Respiratory Distress Syndrome and Death in Patients with Coronavirus Disease 2019 Pneumonia in Wuhan, China. JAMA Intern. Med. 2020, 180, 934–943. [Google Scholar] [CrossRef] [PubMed] [Green Version]
- Wang, D.; Hu, B.; Hu, C.; Zhu, F.; Liu, X.; Zhang, J.; Wang, B.; Xiang, H.; Cheng, Z.; Xiong, Y.; et al. Clinical Characteristics of 138 Hospitalized Patients with 2019 Novel Coronavirus—Infected Pneumonia in Wuhan, China. JAMA 2020, 323, 1061–1069. [Google Scholar] [CrossRef] [PubMed]
- Ioannou, G.N.; Locke, E.; Green, P.; Berry, K.; O’Hare, A.M.; Shah, J.A.; Crothers, K.; Eastment, M.C.; Dominitz, J.A.; Fan, V.S. Risk factors for hospitalization, mechanical ventilation, or death among 10 131 US Veterans with SARS-CoV-2 Infection. JAMA Netw. Open 2020, 3, e2022310. [Google Scholar] [CrossRef] [PubMed]
- Tang, N.; Li, D.; Wang, X.; Sun, Z. Abnormal Coagulation parameters are associated with poor prognosis in patients with novel coronavirus pneumonia. J. Thromb. Haemost. 2020, 18, 844–847. [Google Scholar] [CrossRef] [PubMed] [Green Version]
- Rod, J.E.; Oviedo-Trespalacios, O.; Cortes-Ramirez, J. A brief-review of the risk factors for COVID-19 severity. Rev. Saúde Pública 2020, 54, 60. [Google Scholar] [CrossRef]
- Gao, Y.-D.; Ding, M.; Dong, X.; Zhang, J.-J.; Azkur, A.K.; Azkur, D.; Gan, H.; Sun, Y.-L.; Fu, W.; Li, W.; et al. Risk factors for severe and critically ill COVID-19 patients: A review. Allergy 2021, 76, 428–455. [Google Scholar] [CrossRef]
- Takahashi, T.; Ellingson, M.K.; Wong, P.; Israelow, B.; Lucas, C.; Klein, J.; Silva, J.; Mao, T.; Oh, J.E.; Tokuyama, M.; et al. Sex differences in immune responses that underlie COVID-19 disease outcomes. Nature 2020, 588, 315–320. [Google Scholar] [CrossRef]
- Camici, M.; Zuppi, P.; Lorenzini, P.; Scarnecchia, L.; Pinnetti, C.; Cicalini, S.; Nicastri, E.; Petrosillo, N.; Palmieri, F.; D’Offizi, G.; et al. Role of testosterone in SARS-CoV-2 infection: A key pathogenic factor and a biomarker for severe pneumonia. Int. J. Infect. Dis. 2021, 108, 244–251. [Google Scholar] [CrossRef]
- Singh, A.; Soni, K.D.; Singh, Y.; Aggarwal, R.; Venkateswaran, V.; Ashar, M.S.; Trikha, A. Alveolar Arterial Gradient and Respiratory Index in Predicting the Outcome of COVID-19 Patients; A Retrospective Cross-Sectional Study. Arch. Acad. Emerg. Med. 2022, 10, e28. [Google Scholar]

| IDSA Criteria for Severe CAP. One Major Criteria or Three or More Minor Criteria. |
|---|
| Minor criteria |
| Respiratory rate > 30 breaths/min PaO2/FIO2 ratio < 250 |
| Multilobar infiltrates |
| Confusion or disorientation |
| Uremia (blood urea nitrogen level >20 mg/dL) |
| Leukopenia (white blood cell count, 4.000 cells/μL due to infection alone |
| Thrombocytopenia (platelet count, 100.000/μL) |
| Hypothermia (core temperature, <36 °C) |
| Hypotension requiring aggressive fluid resuscitation |
| Major criteria |
| Septic shock with need for vasopressors |
| Respiratory failure requiring mechanical ventilation |
| Overall (n = 53) | Severe (n = 10) | Non Severe (n = 43) | p-Value | |
|---|---|---|---|---|
| Age in years (IQR 25–75) | 63 (49–75) | 66.5 (62.8–73.8) | 60 (47.5–74) | 0.294 |
| Male Sex | 30 (56.6%) | 9 (90%) | 21 (49%) | 0.031 |
| Caucasian | 51 (96.2%) | 9 (90%) | 42 (97.7%) | 0.254 |
| Comorbidity | ||||
| Hypertension | 35 (66%) | 7 (70%) | 28 (65.1%) | 0.719 |
| Cardiovascular Disease | 12 (22.6%) | 4 (40%) | 8 (18.6%) | 0.677 |
| COPD | 11 (20.8%) | 5 (50%) | 6 (14%) | 0.023 |
| CKD | 8 (15.1%) | 3 (20%) | 5 (14%) | 0.163 |
| Malignancy | 3 (5.7%) | 2 (20%) | 1 (2.3%) | 0.088 |
| Diabetes Mellitus (type II) | 6 (11.3%) | 1 (10%) | 5 (11.6%) | 1 |
| Signs and Symptom | ||||
| Fever | 43 (82.1%) | 8 (80%) | 35 (81.4%) | 1 |
| Dyspnea | 26 (49.1%) | 9 (90%) | 17 (39.5%) | 0.005 |
| Anosmia | 7 (13.2%) | 2 (20%) | 5 (11.6%) | 0.604 |
| Dysgeusia | 6 (11.3%) | 2 (20%) | 4 (9.3%) | 0.315 |
| Cough | 26 (49.1%) | 6 (60%) | 20 (46.5%) | 0.501 |
| Diarrhea | 4 (7.5%) | 0 (0%) | 4 (9.3%) | 1 |
| Arterial Blood Gas analysis, median (IQR) | ||||
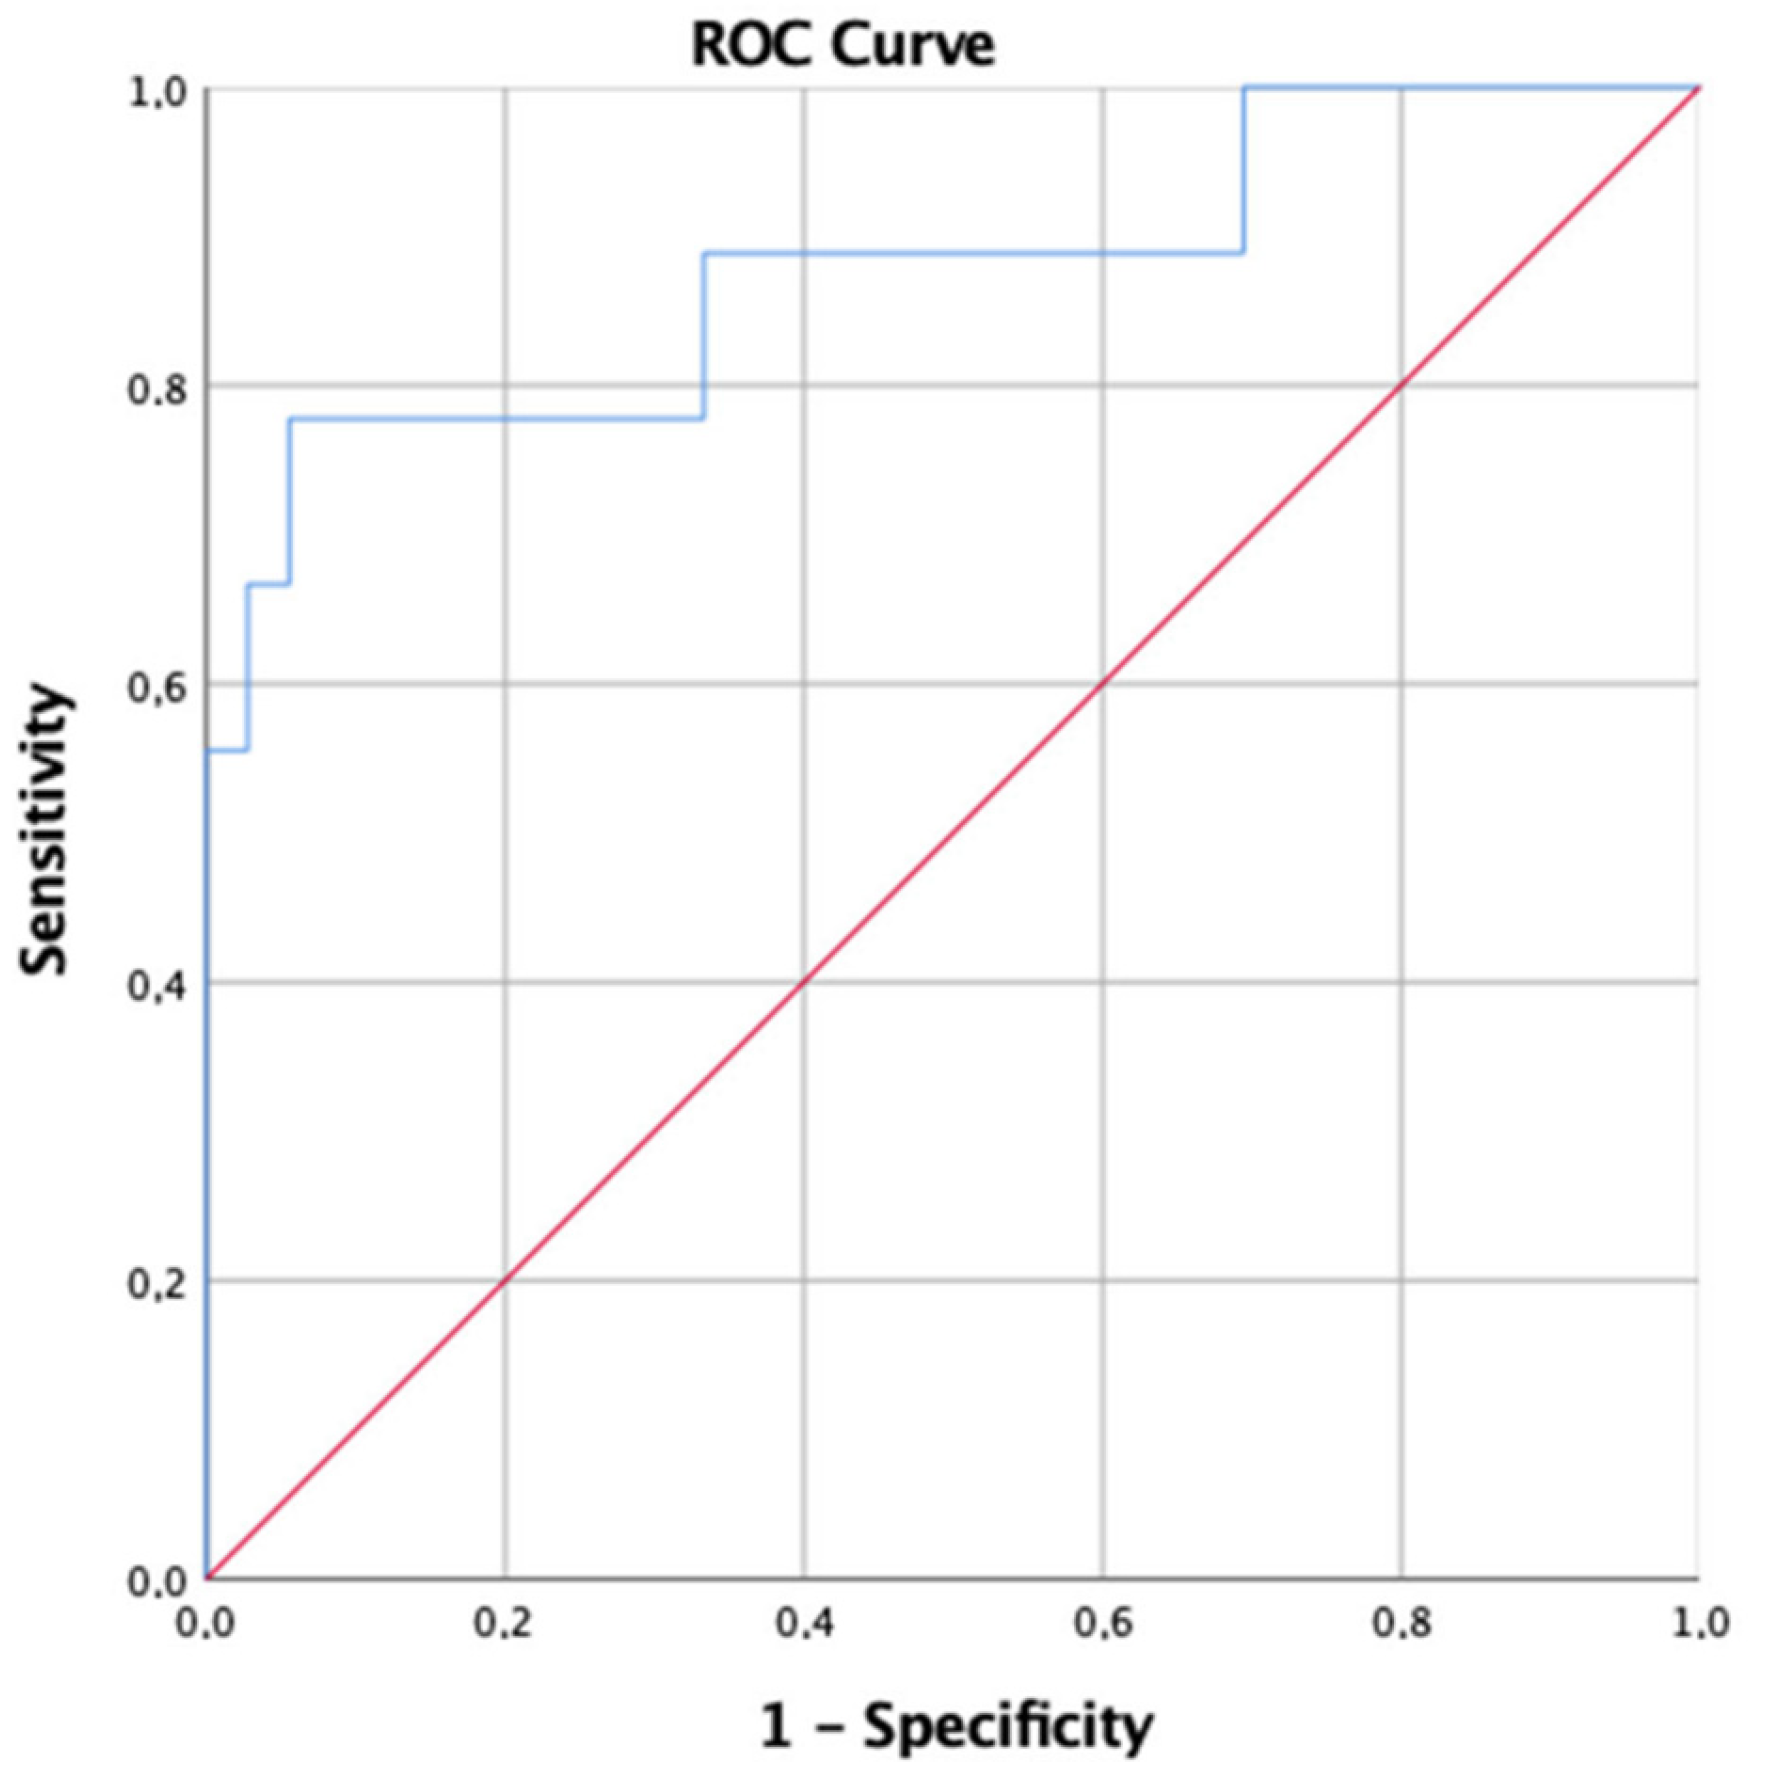
| PaO2/FiO2 (mmHg) | 379.5 (303.1–426.8) | 246 (104.7–376.7) | 390.5 (321.6–432.1) | 0.157 |
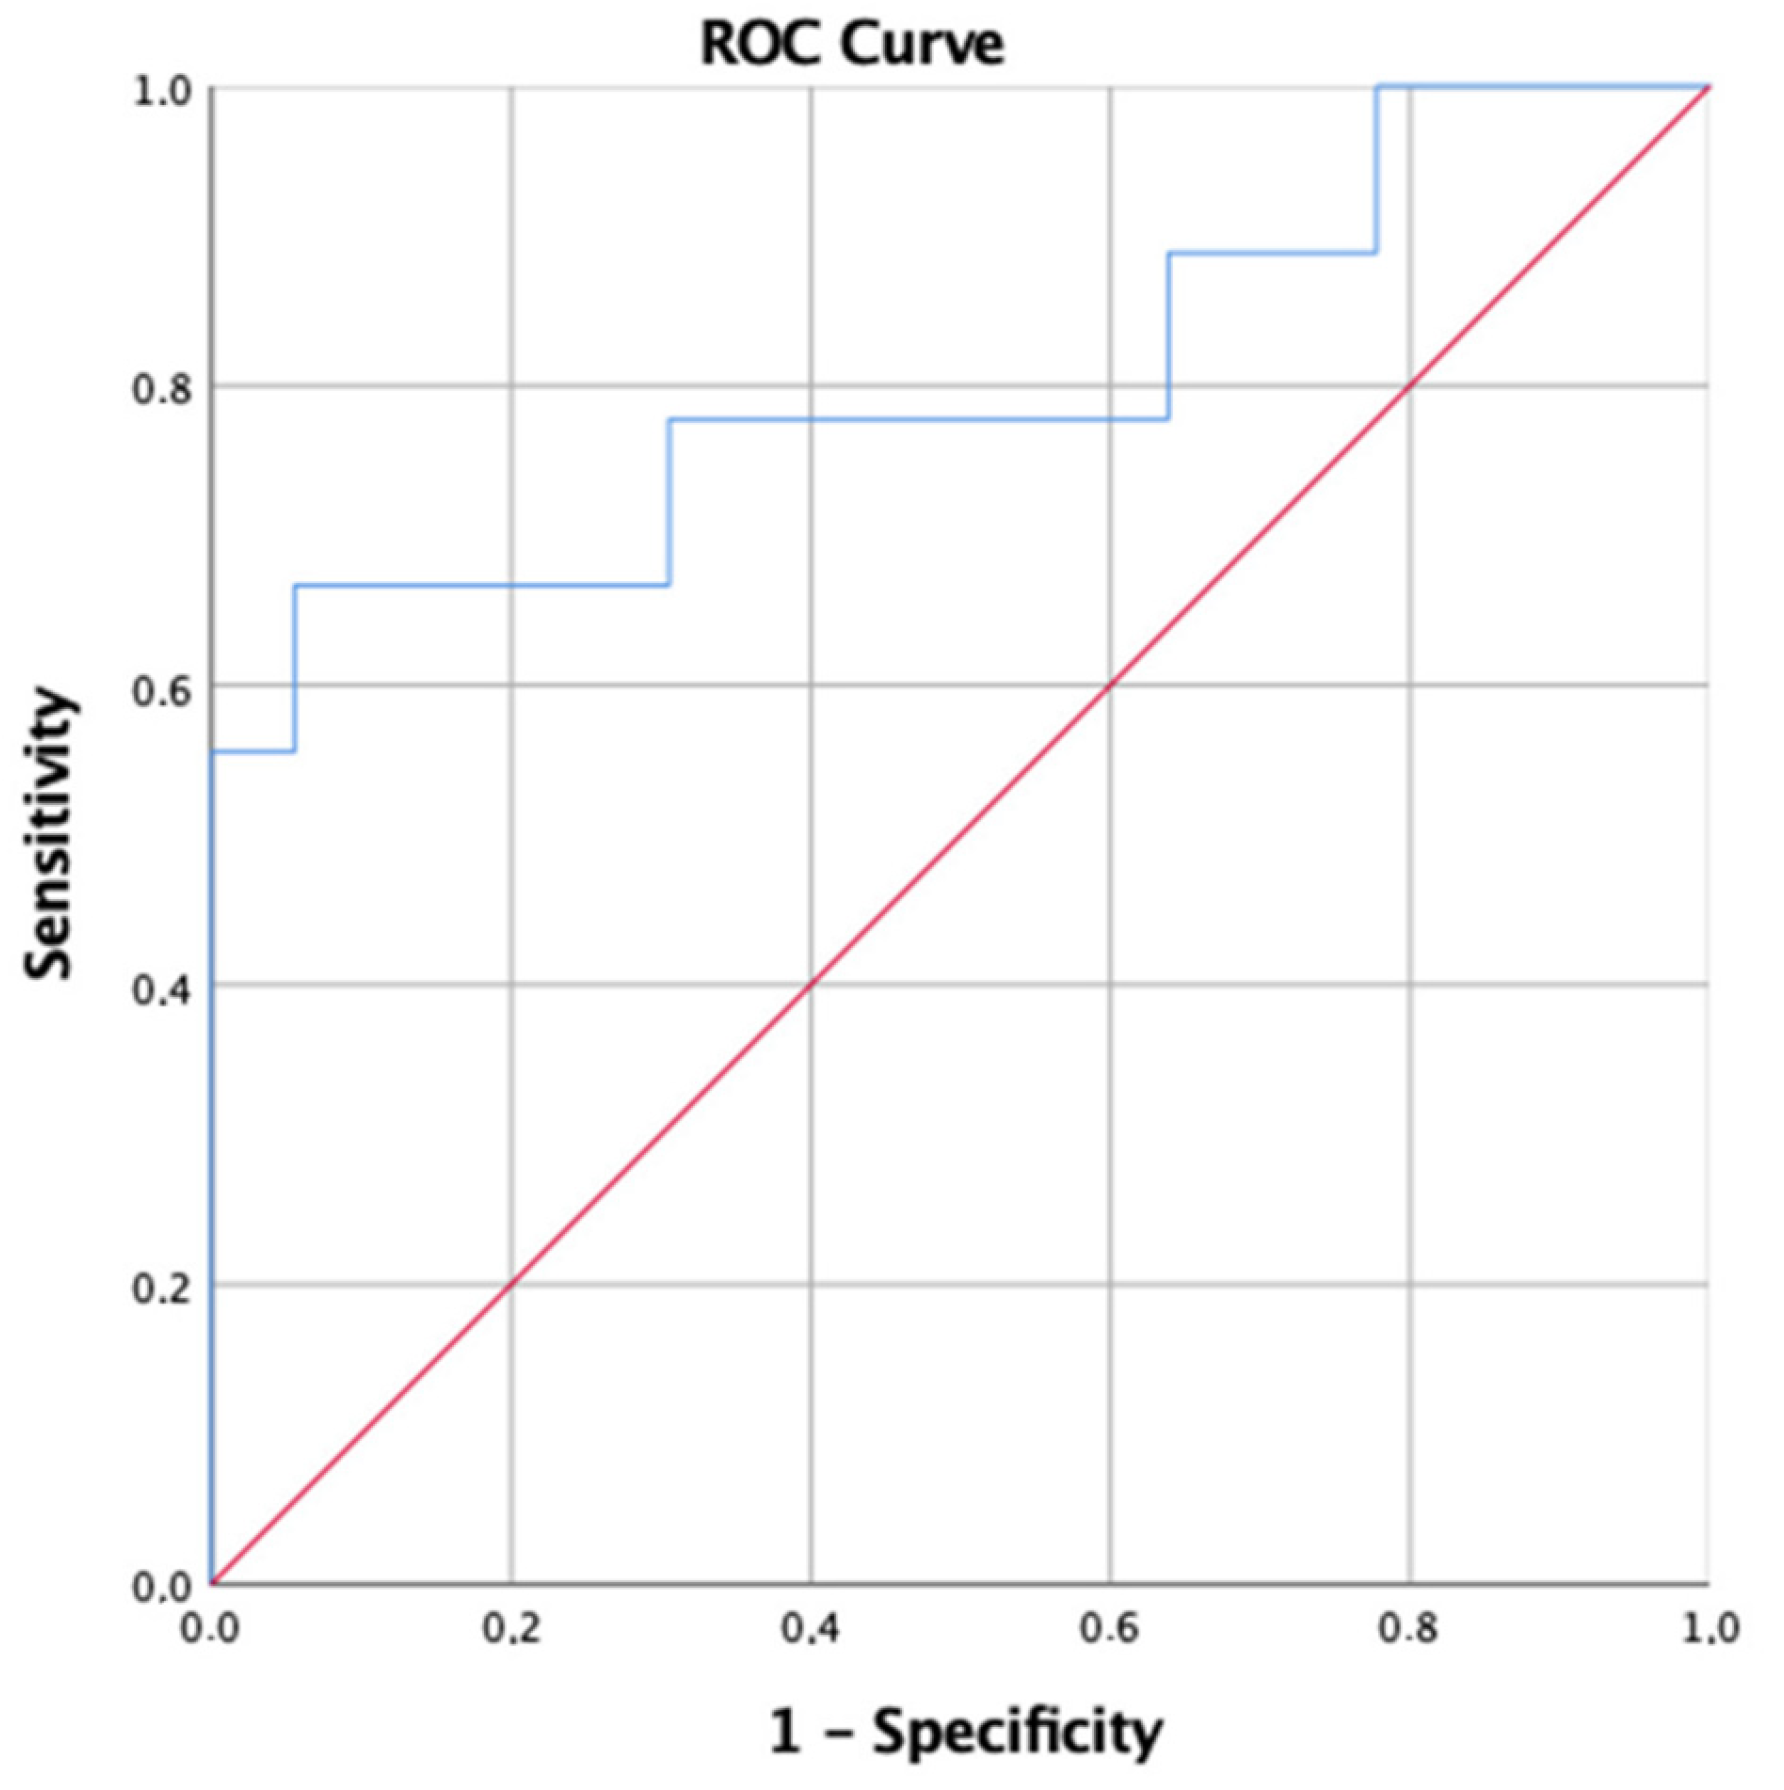
| D(A-a)O2 (mmHg) | 33.6 (15.5–54.1) | 97.9 (49.9–241.7) | 28.6 (12.3–40.2) | <0.001 |
| Outcome | ||||
| Death n (%) | 3 (5.7%) | 3 (30%) | 0 (0%) | 0.0051 |
| Overall (n = 53) | Severe (n = 10) | Non-Severe (n = 43) | p-Value | |
|---|---|---|---|---|
| WBC (cell/μL) | 6.7 (5.27–9.02) | 6.9 (4.97–10.14) | 6.5 (5.43–7.75) | 0.869 |
| Neutrophils | 4.2 (3.09–6.06) | 5.5 (2.48–9.26) | 4.02 (3.3–5.12) | 0.592 |
| Lymphocites | 1.25 (0.91–1.93) | 0.76 (0.25–1.68) | 1.27 (0.99–2.09) | 0.432 |
| Platelets (cell/μL) | 209 (165–251) | 171 (109–250) | 210 (184–251) | 1 |
| D-Dimer (ng/mL) | 748.5 (402.2–1266) | 499 (328–1200) | 779 (442.5–1188) | 0.689 |
| Creatinine (mg/dL) | 0.82 (0.74–0.95) | 0.88 (0.75–1.46) | 0.81 (0.68–0.9) | 0.213 |
| CPR (mg/L) | 2.78 (0.95–8.12) | 8.48 (0.9–12.8) | 2.39 (0.59–5.43) | 0.056 |
| LDH (UI/L) | 229 (183–325) | 261 (235–527) | 205 (167–321) | 0.112 |
| AST (UI/L) | 29 (16–48) | 42 (29–52) | 28 (16–37) | 0.071 |
| ALT (UI/L) | 28 (17–44) | 40 (19–79) | 25 (16–39) | 0.334 |
| pO2 | 80 (69.6–95.4) | 69 (54.5–87) | 82 (71–98.2) | 0.204 |
| pCO2 | 33 (31–35.65) | 32.1 (31–43) | 33 (30.85–35.23) | 0.625 |
Publisher’s Note: MDPI stays neutral with regard to jurisdictional claims in published maps and institutional affiliations. |
© 2022 by the authors. Licensee MDPI, Basel, Switzerland. This article is an open access article distributed under the terms and conditions of the Creative Commons Attribution (CC BY) license (https://creativecommons.org/licenses/by/4.0/).
Share and Cite
Pipitone, G.; Camici, M.; Granata, G.; Sanfilippo, A.; Di Lorenzo, F.; Buscemi, C.; Ficalora, A.; Spicola, D.; Imburgia, C.; Alongi, I.; et al. Alveolar–Arterial Gradient Is an Early Marker to Predict Severe Pneumonia in COVID-19 Patients. Infect. Dis. Rep. 2022, 14, 470-478. https://doi.org/10.3390/idr14030050
Pipitone G, Camici M, Granata G, Sanfilippo A, Di Lorenzo F, Buscemi C, Ficalora A, Spicola D, Imburgia C, Alongi I, et al. Alveolar–Arterial Gradient Is an Early Marker to Predict Severe Pneumonia in COVID-19 Patients. Infectious Disease Reports. 2022; 14(3):470-478. https://doi.org/10.3390/idr14030050
Chicago/Turabian StylePipitone, Giuseppe, Marta Camici, Guido Granata, Adriana Sanfilippo, Francesco Di Lorenzo, Calogero Buscemi, Antonio Ficalora, Daria Spicola, Claudia Imburgia, Ilenia Alongi, and et al. 2022. "Alveolar–Arterial Gradient Is an Early Marker to Predict Severe Pneumonia in COVID-19 Patients" Infectious Disease Reports 14, no. 3: 470-478. https://doi.org/10.3390/idr14030050