
Supportive Oligonucleotide Therapy (SOT) as a Potential Treatment for Viral Infections and Lyme Disease: Preliminary Results


Abstract
:1. Introduction
2. Materials and Methods
2.1. Samples
2.2. Strain Detection
2.3. SOT Production—Administration
2.4. SOT Questionnaire
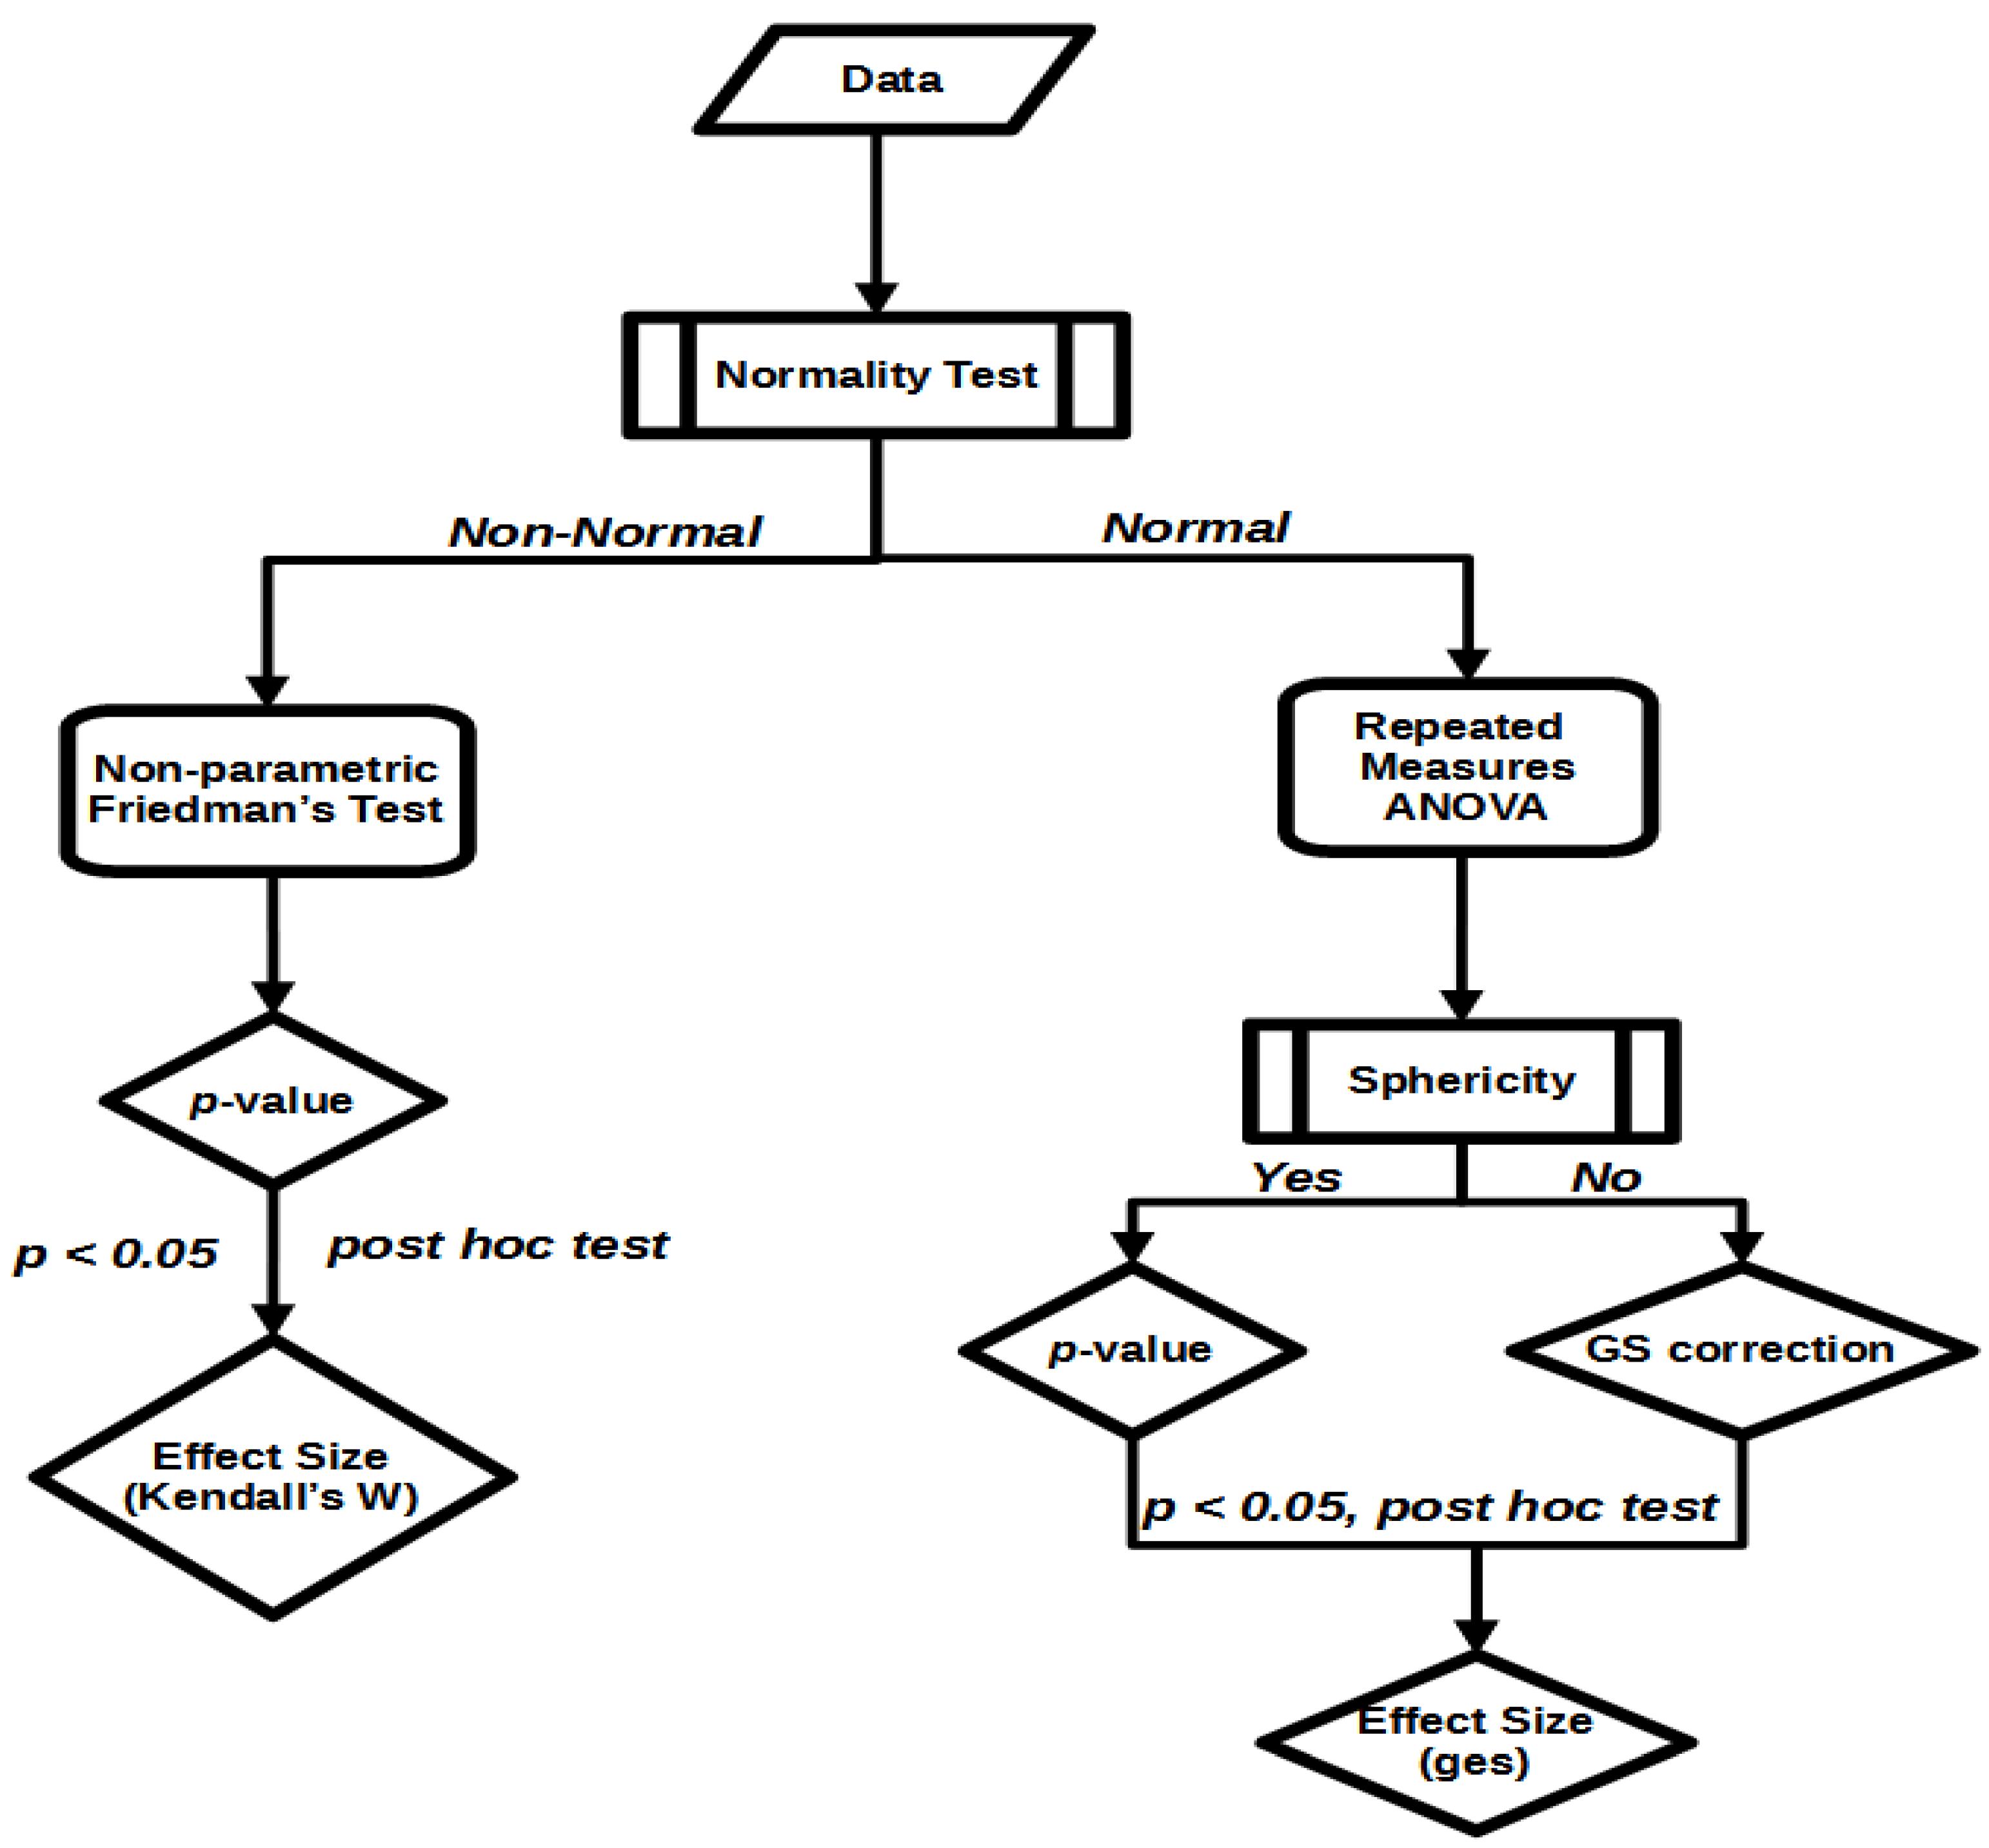
2.5. Statistical Methods
3. Results
3.1. Lyme Disease
3.2. Herpes Viruses (HSV)
3.3. Epstein–Barr Virus (EBV)
4. Discussion
5. Conclusions
Author Contributions
Funding
Institutional Review Board Statement
Informed Consent Statement
Data Availability Statement
Conflicts of Interest
References
- Tarn, W.Y.; Cheng, Y.; Ko, S.H.; Huang, L.M. Antisense oligonucleotide-based therapy of viral infections. Pharmaceutics 2021, 13, 2015. [Google Scholar] [CrossRef] [PubMed]
- Agrawal, N.; Dasaradhi, P.V.N.; Mohmmed, A.; Malhotra, P.; Bhatnagar, R.K.; Mukherjee, S.K. RNA Interference: Biology, Mechanism, and Applications. Microbiol. Mol. Biol. Rev. 2003, 67, 657–685. [Google Scholar] [CrossRef] [PubMed] [Green Version]
- Papasotiriou, I.; Beis, G.; Iliopoulos, A.C.; Apostolou, P. Supportive Oligonucleotide Therapy (SOT) as an Alternative Treatment Option in Cancer: A Preliminary Study. In Vivo 2022, 36, 898–906. [Google Scholar] [CrossRef]
- Arrighi, J.F.; Pion, M.; Wiznerowicz, M.; Geijtenbeek, T.B.; Garcia, E.; Abraham, S.; Leuba, F.; Dutoit, V.; Ducrey-Rundquist, O.; van Kooyk, Y.; et al. Lentivirus-Mediated RNA Interference of DC-SIGN Expression Inhibits Human Immunodeficiency Virus Transmission from Dendritic Cells to T Cells. J. Virol. 2004, 78, 10848–10855. [Google Scholar] [CrossRef] [PubMed] [Green Version]
- Carmona, S.; Ely, A.; Crowther, C.; Moolla, N.; Salazar, F.H.; Marion, P.L.; Ferry, N.; Weinberg, M.S.; Arbuthnot, P. Effective inhibition of HBV replication in vivo by anti-HBx short hairpin RNAs. Mol. Ther. 2006, 13, 411–421. [Google Scholar] [CrossRef] [PubMed]
- Barik, S.; Lu, P. Therapy of respiratory viral infections with intranasal siRNAs. Methods Mol. Biol. 2015, 1218, 251–262. [Google Scholar] [CrossRef] [PubMed]
- Hegarty, J.P.; Stewart, D.B. Advances in therapeutic bacterial antisense biotechnology. Appl. Microbiol. Biotechnol. 2018, 102, 1055–1065. [Google Scholar] [CrossRef]
- Karim, S.; Kenny, B.; Troiano, E.; Mather, T.N. RNAi-mediated gene silencing in tick synganglia: A proof of concept study. BMC Biotechnol. 2008, 8, 30. [Google Scholar] [CrossRef] [Green Version]
- Kenney, J.L.; Guinness, M.E.; Curiel, T.; Lacy, J. Antisense to the Epstein-Barr Virus (EBV)-Encoded Latent Membrane Protein 1 (LMP-1) Suppresses LMP-1 and Bcl-2 Expression and Promotes Apoptosis in EBV-Immortalized B Cells. Blood 1998, 92, 1721–1727. [Google Scholar] [CrossRef]
- Liu, M.Y.; Chen, J.Y.; Tsai, C.-H.A.; Hsu, T.-Y.; Yang, C.-S. Inhibition of the synthesis of proteins needed for Epstein-Barr virus replication by antisense RNA against the zta gene. J. Biomed. Sci. 1997, 4, 139–145. [Google Scholar] [CrossRef]
- Roth, G.; Curiel, T.; Lacy, J. Epstein-Barr viral nuclear antigen 1 antisense oligodeoxynucleotide inhibits proliferation of Epstein-Barr virus-immortalized B cells. Blood 1994, 84, 582–587. [Google Scholar] [CrossRef] [PubMed]
- Aljamali, M.N.; Sauer, J.R.; Essenberg, R.C. RNA Interference: Applicability in Tick Research. Exp. Appl. Acarol. 2002, 28, 89–96. [Google Scholar] [CrossRef]
- Feng, C.; Torimaru, K.; Lim, M.Y.T.; Chak, L.-L.; Tsuji, K.; Tanaka, T.; Lida, J.; Okamura, K. RNA-dependent RNA polymerases in the black-legged tick produce Argonaute-dependent small RNAs and regulate genes. bioRxiv 2021. [Google Scholar] [CrossRef]
- Zihlif, M.A.; Mahmoud, I.S.; Ghanim, M.T.; Zreikat, M.S.; Alrabadi, N.; Imraish, A.; Odeh, F.; Abbas, M.A.; Ismail, S.I. Thymoquinone efficiently inhibits the survival of EBV-infected B cells and alters EBV gene expression. Integr. Cancer Ther. 2013, 12, 257–263. [Google Scholar] [CrossRef] [PubMed]
- Janani, M.K.; Malathi, J.; Appaswamy, A.; Singha, N.R.; Madhavan, H.N. hospital-based pilot study on Epstein-Barr virus in suspected infectious mononucleosis pediatric patients in India. J. Infect. Dev. Ctries. 2015, 9, 1133–1138. [Google Scholar] [CrossRef] [Green Version]
- Richardson, A.K.; Currie, M.J.; Robinson, B.A.; Morrin, H.; Phung, Y.; Pearson, J.F.; Anderson, T.P.; Potter, J.D.; Walker, L.C. Cytomegalovirus and Epstein-Barr Virus in Breast Cancer. PLoS ONE 2015, 10, e0118989. [Google Scholar] [CrossRef] [Green Version]
- Nocton, J.J.; Dressler, F.; Rutledge, B.J.; Rys, P.N.; Persing, D.H.; Steere, A.C. Detection of Borrelia burgdorferi DNA by a polymerase chain reaction in synovial fluid from patients with Lyme arthritis. N. Engl. J. Med. 1994, 330, 229–234. [Google Scholar] [CrossRef]
- Lix, L.M.; Keselman, H.J. Analysis of variance: Repeated-measures designs. In The Reviewer’s Guide to Quantitative Methods in the Social Sciences, 2nd ed.; Hancock, G.R., Stapleton, L.M., Mueller, R.O., Eds.; Routledge/Taylor & Francis Group: New York, NY, USA, 2019; pp. 15–28. [Google Scholar]
- Schober, P.; Vetter, T.R. Repeated measures designs and analysis of longitudinal data: If at first you do not succeed-try, try again. Anesth. Analg. 2018, 127, 569–575. [Google Scholar] [CrossRef]
- Mishra, P.; Singh, U.; Pandey, C.; Mishra, P.; Pandey, G. Application of student’s t-test, analysis of variance, and covariance. Ann. Card. Anaesth. 2019, 22, 407–411. [Google Scholar] [CrossRef]
- Kassambara, A. Practical Statistics in R II. In Comparing Groups: Numerical Variables; Datanovia: Montpellier, France, 2019. [Google Scholar]
- Girden, E.R. ANOVA Repeated Measures; Newbury Park, Sage Publications, Inc.: Newbury Park, CA, USA, 1992. [Google Scholar]
- Shapiro, S.S.; Wilk, M.B. An Analysis of Variance Test for Normality (Complete Samples). Biometrika 1965, 52, 591–611. [Google Scholar] [CrossRef]
- Friedman, M. The Use of Ranks to Avoid the Assumption of Normality Implicit in the Analysis of Variance. J. Am. Stat. Assoc. 1937, 32, 675–701. [Google Scholar] [CrossRef]
- Friedman, M. A Comparison of Alternative Tests of Significance for the Problem of m Rankings. Ann. Math. Stat. 1940, 11, 86–92. [Google Scholar] [CrossRef]
- Marino, M.J. Chapter 3: Statistical Analysis in Preclinical Biomedical Research. Research in the Biomedical Sciences; Academic Press: Amsterdam, The Netherlands, 2018; pp. 107–144. ISBN 9780128047255. [Google Scholar] [CrossRef]
- Olejnik, S.; Li, J.; Supattathum, S.; Huberty, C.J. Multiple Testing and Statistical Power with Modified Bonferroni Procedures. J. Educ. Behav. Stat. 1997, 22, 389–406. [Google Scholar] [CrossRef]
- Lakens, D. Calculating and reporting effect sizes to facilitate cumulative science: A practical primer for t-tests and ANOVAs. Front. Psychol. 2013, 4, 863. [Google Scholar] [CrossRef] [PubMed] [Green Version]
- Tomczak, M.; Tomczak, E. The need to report effect size estimates revisited. An overview of some recommended measures of effect size Language and cognition. TRENDS Sport Sci. 2014, 1, 19–25. [Google Scholar]
- R Core Team. R: A Language and Environment for Statistical Computing; R Foundation for Statistical Computing: Vienna, Austria, 2020; Available online: http://www.R-project.org/ (accessed on 14 February 2019).
- Wickham, H.; Averick, M.; Bryan, J.; Chang, W.; D’Agostino McGowan, L.; François, R.; Grolemund, G.; Hayes, A.; Henry, L.; Hester, J.; et al. Welcome to the Tidyverse. J. Open Source Softw. 2019, 4, 1686. [Google Scholar] [CrossRef] [Green Version]
- Kassambara, A.; ggpubr: ‘ggplot2′ Based Publication Ready Plots. R Package Version 040. 2020. Available online: https://CRAN.R-project.org/package=ggpubr (accessed on 27 June 2020).
- Kassambara, A.; rstatix: Pipe-Friendly Framework for Basic Statistical Tests. R Packag Version 0.4.0. 2020. Available online: https://cran.microsoft.com/snapshot/2020-04-20/web/packages/rstatix/index.html (accessed on 13 February 2020).
- Bakeman, R. Recommended effect size statistics for repeated measures designs. Behav. Res. Methods 2005, 37, 379–384. [Google Scholar] [CrossRef]
- Epstein, M.A.; Achong, B.G.; Barr, Y.M. Virus particles in cultured lymphoblasts from Burkitt’s lymphoma. Lancet 1964, 283, 702–703. [Google Scholar] [CrossRef]
- Rezk, S.A.; Weiss, L.M. Epstein-Barr virus-associated lymphoproliferative disorders. Hum. Pathol. 2007, 38, 1293–1304. [Google Scholar] [CrossRef] [Green Version]
- Yin, H.; Qu, J.; Peng, Q.; Gan, R. Molecular mechanisms of EBV-driven cell cycle progression and oncogenesis. Med. Microbiol. Immunol. 2019, 208, 573–583. [Google Scholar] [CrossRef]
- Middeldorp, J.M.; Pegtel, D.M. Multiple roles of LMP1 in Epstein-Barr virus induced immune escape. Semin. Cancer Biol. 2008, 18, 388–396. [Google Scholar] [CrossRef] [PubMed]
- Masciarelli, S.; Mattioli, B.; Galletti, R.; Samoggia, P.; Chichiarelli, S.; Mearini, G.; Mattia, E. Antisense to Epstein Barr virus-encoded LMP1 does not affect the transcription of viral and cellular proliferation-related genes, but induces phenotypic effects on EBV-transformed B lymphocytes. Oncogene 2002, 21, 4166–4170. [Google Scholar] [CrossRef] [PubMed] [Green Version]
- Hong, M.; Murai, Y.; Kutsuna, T.; Takahashi, H.; Nomoto, K.; Cheng, C.M.; Ishizawa, S.; Zhao, Q.L.; Ogawa, R.; Harmon, B.V.; et al. Suppression of Epstein-Barr nuclear antigen 1 (EBNA1) by RNA interference inhibits proliferation of EBV-positive Burkitt’s lymphoma cells. J. Cancer Res. Clin. Oncol. 2006, 132, 1–8. [Google Scholar] [CrossRef]
- Mattia, E.; Chichiarelli, S.; Hickish, T.; Gaeta, A.; Mancini, C.; Cunningham, D.; van Renswoude, J. Inhibition of in vitro proliferation of Epstein Barr Virus infected B cells by an antisense oligodeoxynucleotide targeted against EBV latent membrane protein LMP1. Oncogene 1997, 15, 489–493. [Google Scholar] [CrossRef] [Green Version]
- Steiner, I.; Benninger, F. Update on herpes virus infections of the nervous system. Curr. Neurol. Neurosci. Rep. 2013, 13, 414. [Google Scholar] [CrossRef]
- Dingwell, K.S.; Brunetti, C.R.; Hendricks, R.L.; Tang, Q.; Tang, M.; Rainbow, A.J.; Johnson, D.C. Herpes simplex virus glycoproteins E and I facilitate cell-to-cell spread in vivo and across junctions of cultured cells. J. Virol. 1994, 68, 834–845. [Google Scholar] [CrossRef] [PubMed] [Green Version]
- Fatahzadeh, M.; Schwartz, R.A. Human herpes simplex virus infections: Epidemiology, pathogenesis, symptomatology, diagnosis, and management. J. Am. Acad Dermatol. 2007, 57, 737–763. [Google Scholar] [CrossRef] [PubMed]
- Kean, J.M.; Kipp, S.A.; Miller, P.S.; Kulka, M.; Aurelian, L. Inhibition of Herpes Simplex Virus Replication by Antisense Oligo-2′-O-methylribonucleoside Methylphosphonates. Biochemistry 1995, 34, 14617–14620. [Google Scholar] [CrossRef] [PubMed]
- Kalke, K.; Lehtinen, J.; Gnjatovic, J.; Lund, L.M.; Nyman, M.C.; Paavilainen, H.; Orpana, J.; Lasanen, T.; Frejborg, F.; Levanova, A.A.; et al. Herpes Simplex Virus Type 1 Clinical Isolates Respond to UL29-Targeted siRNA Swarm Treatment Independent of Their Acyclovir Sensitivity. Viruses 2020, 12, 1434. [Google Scholar] [CrossRef]
- Skar, G.L.; Simonsen, K.A. Lyme Disease; StatPearls Publishing: Treasure Island, FL, USA, 2022. Available online: https://www.ncbi.nlm.nih.gov/books/NBK431066/ (accessed on 6 May 2022).
- Cervantes, J.L. Lyme disease in Peru. A clinical and epidemiological review. Rev. Peru Med. Exp. Salud Publica 2018, 35, 292–296. [Google Scholar] [CrossRef]
- Kumar, D.; Embers, M.; Mather, T.N.; Karim, S. Is selenoprotein K required for Borrelia burgdorferi infection within the tick vector Ixodes scapularis? Parasites Vectors 2019, 12, 289. [Google Scholar] [CrossRef] [PubMed] [Green Version]
- De Smet, M.D.; Meenken, C.; van den Horn, G.J. Fomivirsen—A phosphorothioate oligonucleotide for the treatment of CMV retinitis. Ocul. Immunol. Inflamm 1999, 7, 189–198. [Google Scholar] [CrossRef] [PubMed]
- Rinaldi, C.; Wood, M.J.A. Antisense oligonucleotides: The next frontier for treatment of neurological disorders. Nat. Rev. Neurol. 2018, 14, 9–21. [Google Scholar] [CrossRef] [PubMed]
- Krieg, A.M.; Stein, C.A. Phosphorothioate Oligodeoxynucleotides: Antisense or Anti-Protein? Antisense Antisense Res. Dev. 1995, 5, 241. [Google Scholar] [CrossRef]
- Prakash, T.; Bhat, B. 2-Modified Oligonucleotides for Antisense Therapeutics. Curr. Top. Med. Chem. 2007, 7, 641–649. [Google Scholar] [CrossRef]
- Cirak, S.; Arechavala-Gomeza, V.; Guglieri, M.; Feng, L.; Torelli, S.; Anthony, K.; Abbs, S.; Garralda, M.E.; Bourke, J.; Wells, D.J.; et al. Exon skipping and dystrophin restoration in patients with Duchenne muscular dystrophy after systemic phosphorodiamidate morpholino oligomer treatment: An open-label, phase 2, dose-escalation study. Lancet 2011, 378, 595–605. [Google Scholar] [CrossRef] [Green Version]
- Betts, C.; Saleh, A.F.; Arzumanov, A.A.; Hammond, S.M.; Godfrey, C.; Coursindel, T.; Gait, M.J.; Wood, M.J. Pip6-PMO, A New Generation of Peptide-oligonucleotide Conjugates with Improved Cardiac Exon Skipping Activity for DMD Treatment. Mol. Ther. Nucleic Acids 2012, 1, e38. [Google Scholar] [CrossRef]


| Microorganism | Primer | Sequence (5′-3′) | Reference |
|---|---|---|---|
| Epstein–Barr Virus | EBNA-1 F | GAGCGGGGAGATAATGTACA | [14] |
| EBNA-1 R | TAAAAGATGGCCGGACAAGG | ||
| EBNA2-F | AGGGATGCCTGGACACAAGA | ||
| EBNA2-R | TTGTGACAGAGGTGACAAAA | ||
| VCA F | CGGTGTAACTACCCGCAATG | [15] | |
| VCA R | CGTGGTCGTGTTCCCTCA | ||
| EA F | AGGACCTACGCTGCCCTAGA | [16] | |
| EAR | AAAACATGCGGACCACCAGC | ||
| Herpes simplex virus 1 | gG1 F | TTGGTTCTTGTCGGTGTATCG | In house |
| gG1 R | GGCGTGGTAAGGCTGATG | ||
| Herpes simplex virus 2 | gG2 F | GACCCAAAGACGCACCCA | |
| gG2 R | CGCCCTCAAACTCCTCGG | ||
| Borrelia burgdorferi | OspA F | GTTTTGTAATTTCAACTGCTGACC | [17] |
| OspA R | GCCATTTGAGTCGTATTGTTGTACTG | ||
| OspB F | AACAAGATCAAACGGAACTACACT | In house | |
| OspB R | CCGACTACAAGACTTCCTTCAAG |
| Friedman Rank Test | ||||||
|---|---|---|---|---|---|---|
| Response | n | Friedman Chi-Squared Statistic | df | p | ||
| Ct | 28 | 36.35 | 2 | 1.28 × 10⁻⁸ | ||
| Wilcoxon Pairwise Comparisons | ||||||
| Response | statistic | p | p | p.signif | pairs | |
| Ct | 5 | 1.04 × 10⁻⁵ | 3.12 × 10⁻⁵ | **** | t0 | t1 |
| 19 | 2.29 × 10⁻⁶ | 6.87 × 10⁻⁶ | **** | t0 | t2 | |
| 39 | 0.0005 | 0.002 | ** | t1 | t2 | |
| Friedman Test Effect Size | ||||||
| Response | n | Kendall’s W | df | |||
| Ct | 28 | 0.65 | 2 | |||
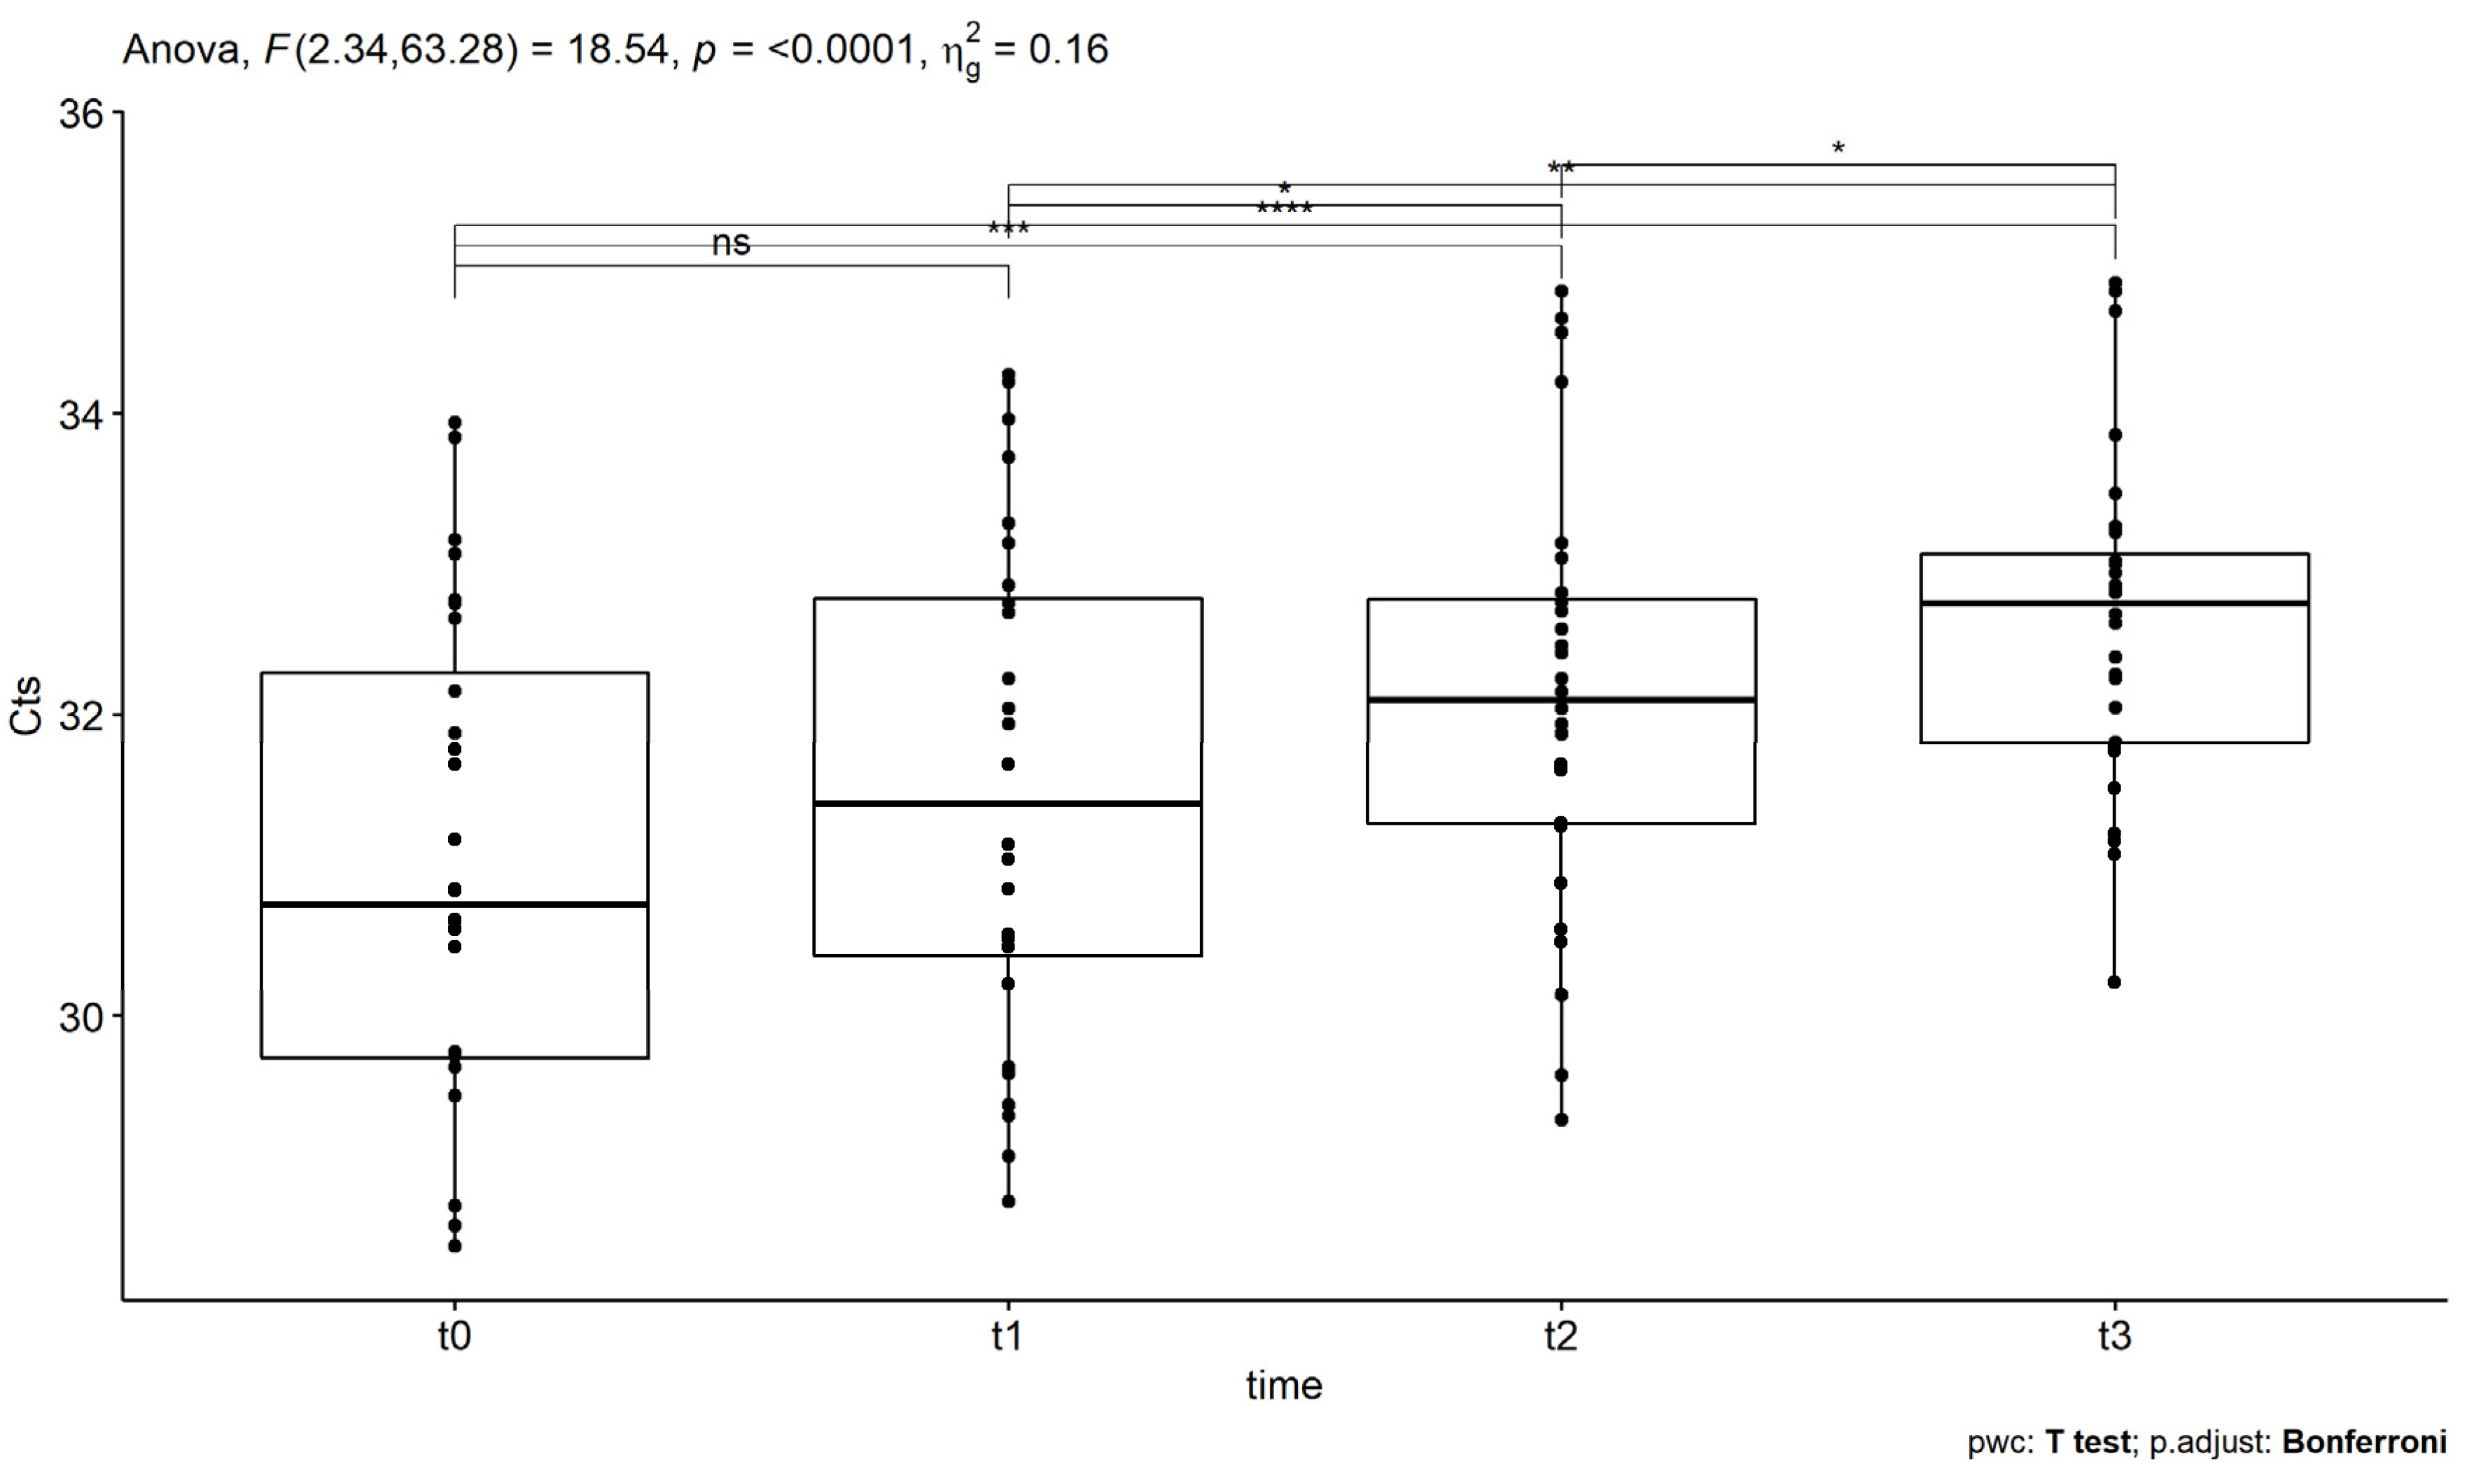
| Mauchly’s Test for Sphericity | |||||||
|---|---|---|---|---|---|---|---|
| Effect | Mauchly’s Statistic | p | p < 0.05 | ||||
| time | 0.58 | 0.016 | * | ||||
| One way repeated measures ANOVA | |||||||
| Effect | DFn | DFd | F | p | p < 0.05 | ges | |
| time | 2.34 | 63.28 | 18.54 | 1.11 × 10⁻⁷ | **** | 0.157 | |
| t-test pairwise comparisons | |||||||
| Response | t-statistic | df | p | p | p.signif | pairs | |
| Ct | −2.31 | 27 | 0.028 | 0.17 | ns | t0 | t1 |
| −4.38 | 27 | 0.0001 | 0.000948 | *** | t0 | t2 | |
| −6.10 | 27 | 1.6 × 10⁻⁶ | 9.6 × 10⁻⁶ | **** | t0 | t3 | |
| −2.89 | 27 | 0.007 | 0.045 | * | t1 | t2 | |
| −4.22 | 27 | 0.0002 | 0.001 | ** | t1 | t3 | |
| −3.16 | 27 | 0.004 | 0.023 | * | t2 | t3 | |
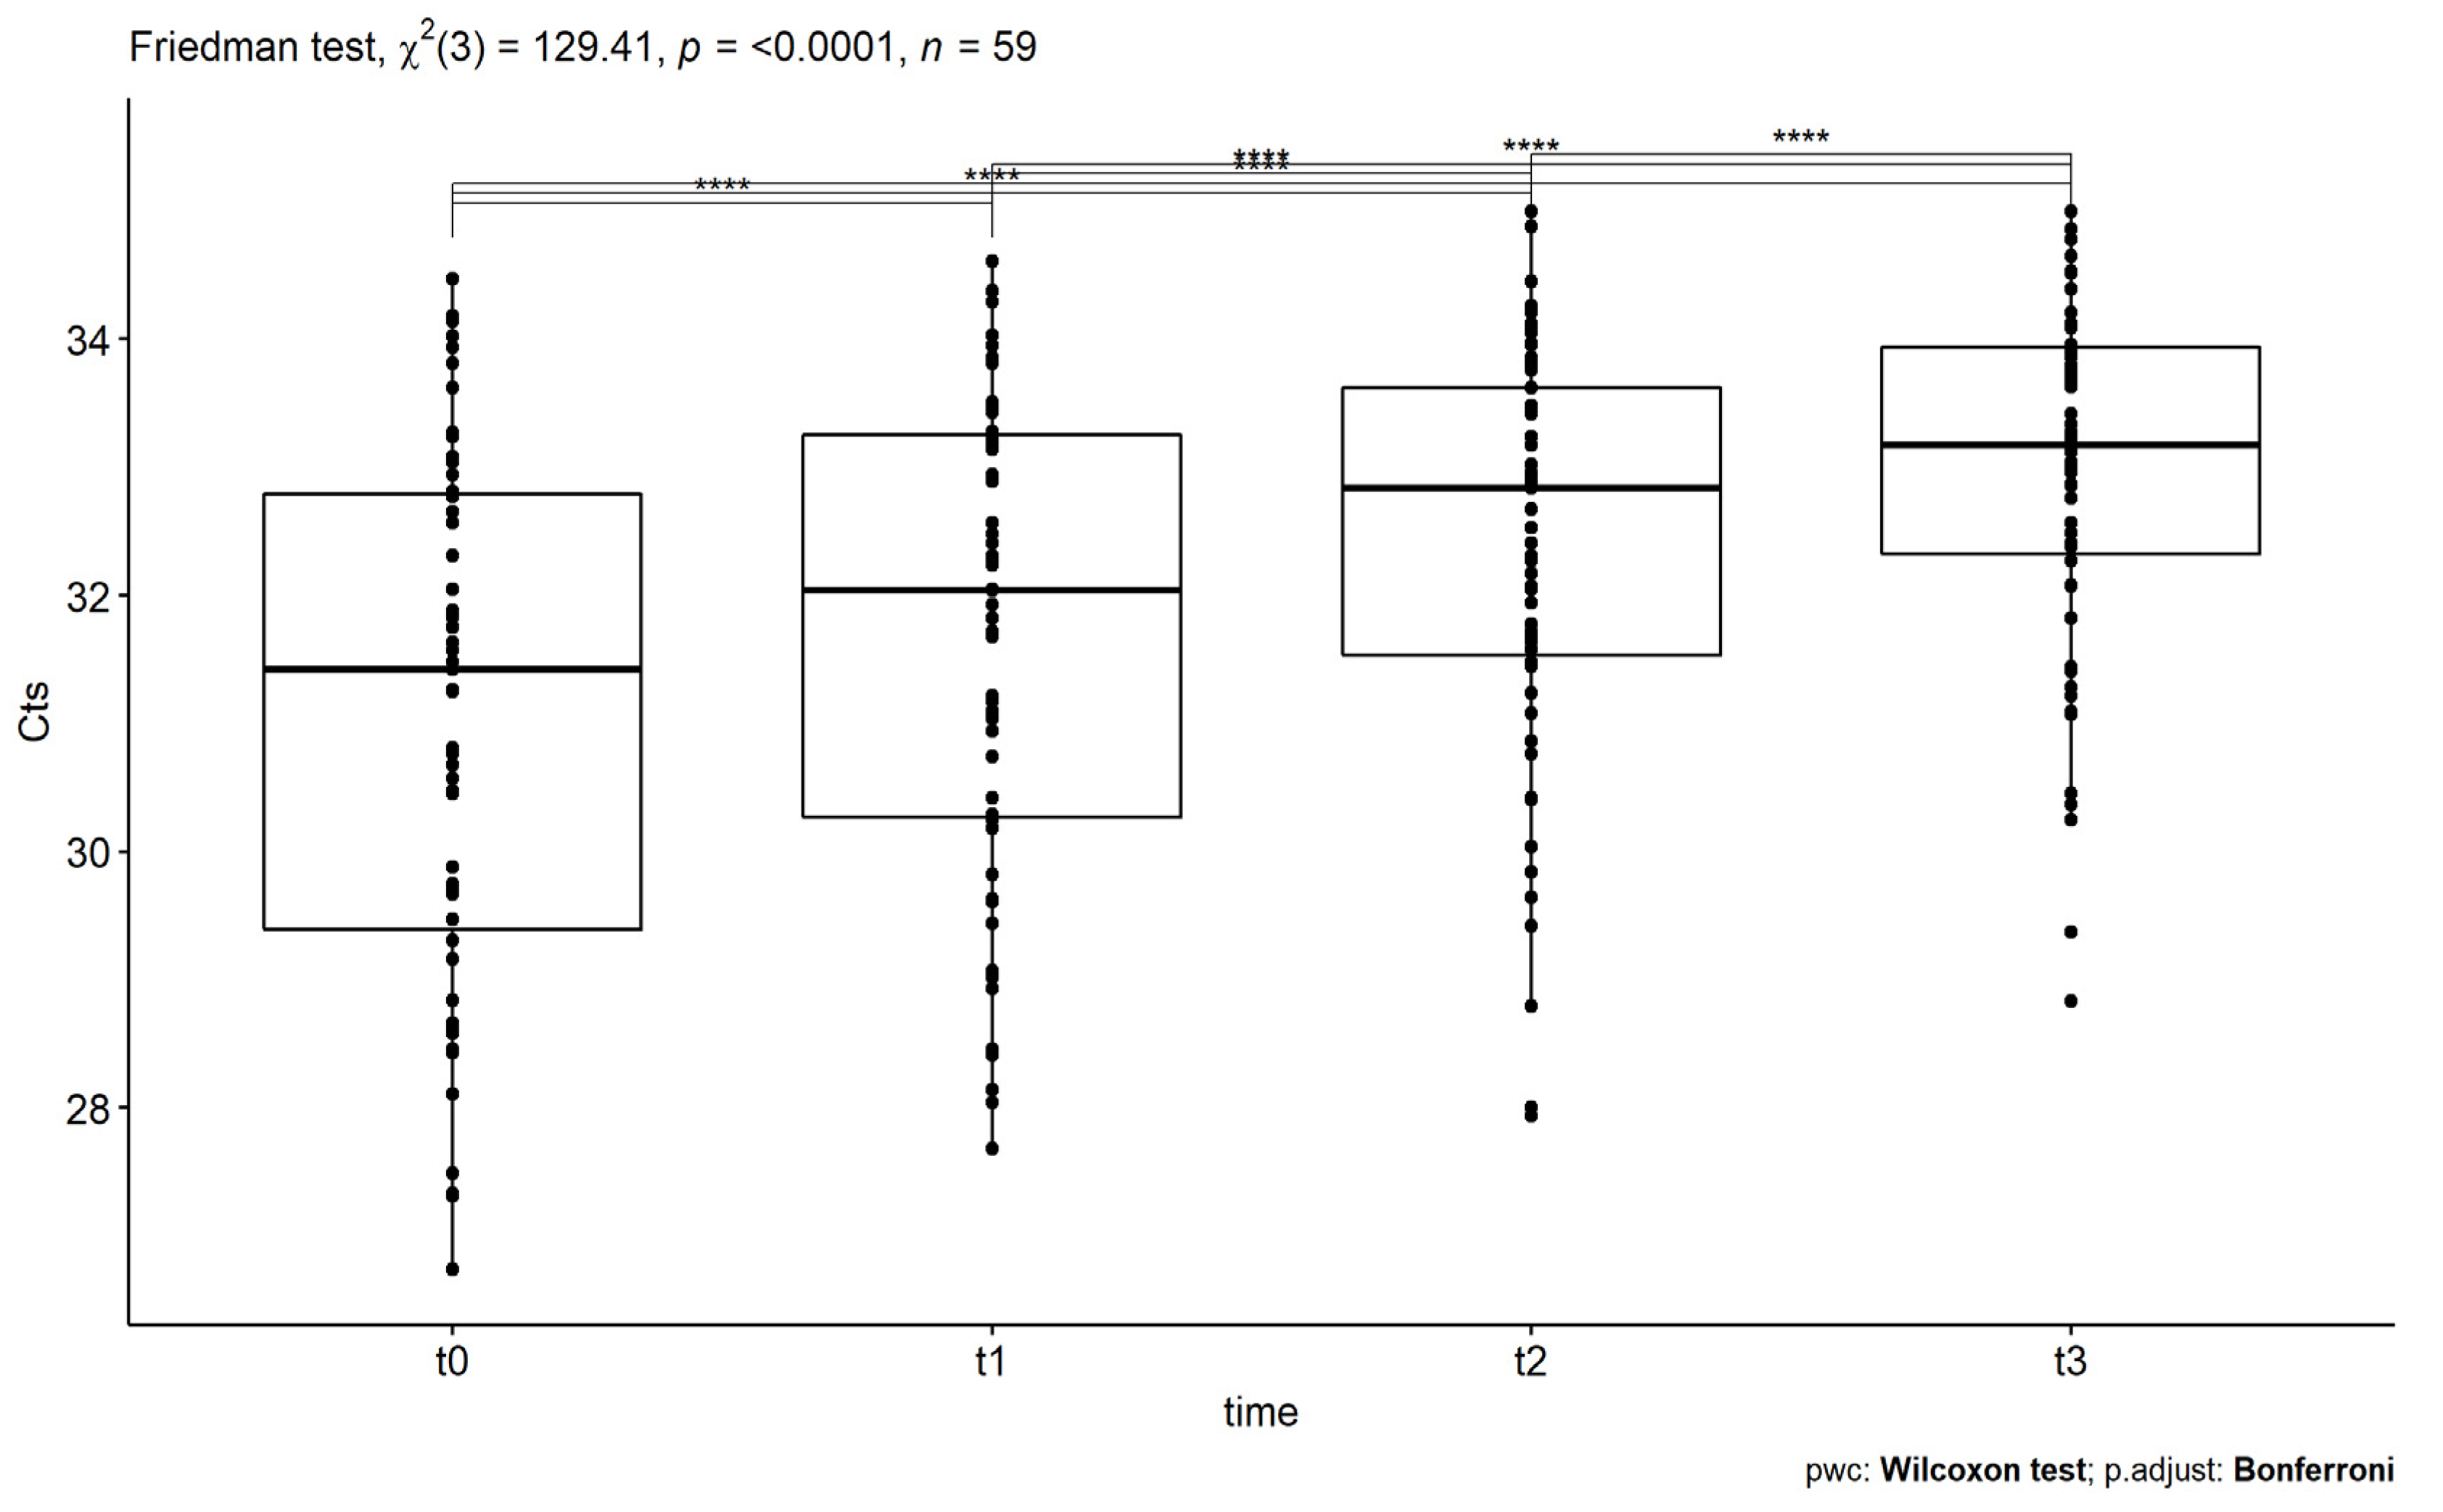
| Friedman Rank Test | ||||||
|---|---|---|---|---|---|---|
| Response | n | Friedman X2 Statistic | df | p | ||
| Ct | 59 | 129.41 | 3 | 7.25 × 10⁻²⁸ | ||
| Wilcoxon pairwise comparisons | ||||||
| Response | statistic | p | p | p.signif | pairs | |
| Ct | 125 | 9.87 × 10⁻⁹ | 5.92 × 10⁻⁸ | **** | t0 | t1 |
| 118.5 | 7.39 × 10⁻⁹ | 4.43 × 10⁻⁸ | **** | t0 | t2 | |
| 55 | 3.82 × 10⁻¹⁰ | 2.29 × 10⁻⁹ | **** | t0 | t3 | |
| 151 | 5.01 × 10⁻⁸ | 3.01 × 10⁻⁷ | **** | t1 | t2 | |
| 64 | 5.9 × 10⁻¹⁰ | 3.54 × 10⁻⁹ | **** | t1 | t3 | |
| 60 | 1.16 × 10⁻⁹ | 6.96 × 10⁻⁹ | **** | t2 | t3 | |
| Friedman Test Effect Size | ||||||
| Response | n | Kendall’s W | df | |||
| Ct | 59 | 0.73 | 3 | |||
Publisher’s Note: MDPI stays neutral with regard to jurisdictional claims in published maps and institutional affiliations. |
© 2022 by the authors. Licensee MDPI, Basel, Switzerland. This article is an open access article distributed under the terms and conditions of the Creative Commons Attribution (CC BY) license (https://creativecommons.org/licenses/by/4.0/).
Share and Cite
Apostolou, P.; Iliopoulos, A.; Beis, G.; Papasotiriou, I. Supportive Oligonucleotide Therapy (SOT) as a Potential Treatment for Viral Infections and Lyme Disease: Preliminary Results. Infect. Dis. Rep. 2022, 14, 824-836. https://doi.org/10.3390/idr14060084
Apostolou P, Iliopoulos A, Beis G, Papasotiriou I. Supportive Oligonucleotide Therapy (SOT) as a Potential Treatment for Viral Infections and Lyme Disease: Preliminary Results. Infectious Disease Reports. 2022; 14(6):824-836. https://doi.org/10.3390/idr14060084
Chicago/Turabian StyleApostolou, Panagiotis, Aggelos Iliopoulos, Georgios Beis, and Ioannis Papasotiriou. 2022. "Supportive Oligonucleotide Therapy (SOT) as a Potential Treatment for Viral Infections and Lyme Disease: Preliminary Results" Infectious Disease Reports 14, no. 6: 824-836. https://doi.org/10.3390/idr14060084
APA StyleApostolou, P., Iliopoulos, A., Beis, G., & Papasotiriou, I. (2022). Supportive Oligonucleotide Therapy (SOT) as a Potential Treatment for Viral Infections and Lyme Disease: Preliminary Results. Infectious Disease Reports, 14(6), 824-836. https://doi.org/10.3390/idr14060084