Article

The Mechanism of Bacterial Endotoxin Invasion Pathways in Porcine Reproductive and Respiratory Syndrome Virus-Positive Porcine Endometrial Epithelial Cells

1
College of Animal Veterinary Medicine, Northwest A&F University, Yangling, Xianyang 712100, China
2
Shandong Xinde Technology Co., Ltd., Jinan 250000, China
*
Author to whom correspondence should be addressed.
Microbiol. Res. 2024, 15(3), 1924-1938; https://doi.org/10.3390/microbiolres15030129
Submission received: 17 July 2024 / Revised: 23 August 2024 / Accepted: 13 September 2024 / Published: 18 September 2024

Abstract

:
Porcine reproductive and respiratory syndrome virus (PRRSV) causes abortions, stillbirths, and dummy pregnancies. Previous studies found that PRRSV can promote secondary bacterial infections and elevate bacterial endotoxin levels, further increasing the abortion rate in sows. However, the pathways by which bacterial endotoxins invade the bodies of PRRSV(+) sows and aggravate their clinical symptoms are unknown. In this study, we established a model of PRRSV and lipopolysaccharide (LPS) working together on porcine endometrial epithelial cells (PEECs). We speculate that PRRSV and LPS affect PEECs through viral protein interaction with cytokines and cytokine receptors, natural killer cell-mediated cytotoxicity, and regulation of actin cytoskeleton signaling pathways by analyzing seq-RNA. The PRRSV proteins act on inflammatory factors and their receptors to activate chemokines-5 (CCL5), chemokines-4 (CCL4), and chemokines-8 (CCL8) mRNA expression, causing severe inflammatory reactions. In addition, the elevation of MEK1/2 factors and the integrins acting on NK cells promote the upregulation of VAV1/Tiam1, RAC, and IRSp53, leading to increased expression of Arp2/3 and F-actin in PEECs in the PRRSV + LPS(+) groups. However, the highly expressed cell microfilaments and cytoskeleton disrupt the original network structure, causing changes in the original physiological function of the PEECs. In summary, the PRRSV protein interacts with cytokines and cytokine receptors of PEECs, thereby enhancing virus-mediated chemokine factors and their receptor activity, accelerating bacterial endotoxin entry into the body and the invasion of cells. They destroy the cytoskeletal structure of the cells and increase damage to uterine tissue.

1. Introduction

Porcine reproductive and respiratory syndrome virus (PRRSV) causes severe diseases in pigs, including reproductive failure in sows and gilts [1]. The pregnancy phase is characterized by a wide range of severe reproductive disorders in sows, including abortion, premature or late-term birth, stillbirth, fetal death, and weak-born piglets [2,3]. During pregnancy, the immune system is weakened. After infection with PRRSV, sows are more susceptible to other pathogens, making them more susceptible to secondary infections with other diseases [4]. PRRSV increased the incidence and severity of secondary infections with bacteria, e.g., Escherichia coli, Salmonella spp., Haemophilus parasuis, Pasteureua multocida, and Actinobacillus pleuropneumoniae [5,6]. The bacterial and PRRSV co-infected pigs had markedly enhanced severe clinical symptoms and huge economic losses. Experimental co-infection of PRRSV and E. coli can increase endotoxin levels in the body and aggravate the abortion rate in pregnant sows [7]. The main toxic components of endotoxins are lipopolysaccharides (LPS), which are the major components of the outer membrane of gram-negative bacteria [8]. Endotoxins in animal enclosures cause environmental pollution and affect the health of livestock [9]. However, the damage mechanism of co-infection with PRRSV and bacteria endotoxin effect in porcine endometrial epithelial cells remains unclear. In the present study, to investigate the bacteria involved in secondary infection during PRRS development, we analyzed the differences in signaling pathways of sows with pregnancy cycles by RNA-seq and studied the mechanism of abortion of porcine endometrial epithelial cells upon co-infection with PRRSV and endotoxin to provide a reference therapy for secondary infections in pigs with PRRS.

2. Methods

2.1. Porcine Endometrial Epithelial Cells (PEECs)

Porcine endometrial epithelial cells (PEECs; Bio-129501, ATCC, Suzhou, China) were seeded at a density of 2 × 10⁵ cells/cm2. The cells were grown in tissue culture flasks at 37 °C, in 5% CO2 and 90% relative humidity. The cell lines were cultured in DMEM (HYCLONE SH30022.01) containing glutamine without sodium pyruvate, supplemented with 10% fetal bovine serum (FBS; GIBCO 10099-141, Thermo Fisher, Waltham, MA, USA) and 1% penicillin–streptomycin–amphotericin B.

2.2. PRRSV Culture in PEECs

The NADC30 lysate of the PRRSV strain used in the experiment was generously donated by Dr. Chunyan Wu from the College of Animal Veterinary Medicine, Northwest A & F University. NADC30 is a type II PRRSV isolated in the United States in 2008. Therefore, these viruses are named NADC30 PRRSV in China.
The Monkey Embryonic Kidney Epithelial Cells-145 (MARC-145) (1 × 10⁴ cells/well) were seeded in a 96-well plate with 100 μL of DMEM medium, incubated at 37 °C with 5% CO2. The viral solution was diluted with serum-free DMEM to create eight gradients ranging from 10−1 to 10−8. When the cells grew to a monolayer, the culture medium was discarded, and the cells were washed twice with 37 °C-preheated PBS. The diluted virus solution was then added to the cells and continued to incubate at 37 °C for 1 h. Each dilution was repeated eight times. The old culture medium was discarded, and fresh DMEM (containing 3% FBS) was added and incubated for 3–5 days. The cytopathic effect was observed, and the tissue infectious dose 50 (TCID50) was calculated using the Karber method. The virus was cultured and propagated with MARC-145 cells. The viral titer was determined to be 106.625 TCID50/mL. The viral lysates were stored at −80 °C.

2.3. Cell and LPS and Virus Co-Culture

The PEECs were divided into four groups: control, PRRSV, LPS (Sigma, Escherichia coli O55:B5, 297-473-0), and PRRSV + LPS. For 2 h, the 1 × 10⁵ cells in the PRRSV and PRRSV-LPS groups were subjected to 500 μL of NADC30 lysate PRRSV (10−6.625 TCID50/mL), whereas the control and LPS (200 µg/mL) groups were treated with DMEM. Following a PBS wash, LPS was administered to both the PRRSV–LPS group and the LPS group at a final concentration of 200 μg/mL. For 12, 24, and 36 h, the four groups were incubated in a maintenance medium containing 3% serum. The cells were harvested for qRT-PCR, and the supernatant was collected for ELISA.

2.4. RNA-Seq

Total RNA was extracted from the PRRSV group, PRRSV + LPS group, LPS group, and control group cell samples at 36 h using an RNA extraction kit (TRNzol Universal Reagent, DP424, Beijing, China). The concentration, purity, and integrity of the RNA were assessed using a spectrophotometer (NanoDrop 2000, Thermo Fisher, Waltham, MA, USA). The 5× All-In-One RT MasterMix enzyme (with an additional genomic DNA removal step included) was used for reverse transcription of RNA into cDNA. PE150 mode sequencing was performed using the Illumina NovaSeq6000 sequencing platform. After filtering the raw data, the sequences were aligned to the swine genome, and differentially expressed genes were selected based on the criteria of |log2FC| ≥ 2 and p-value < 0.01.

2.5. Real-Time PCR

qPCR was performed to detect the expression of differentially expressed genes. Primer sequences were obtained from the PRRSV group, PRRSV + LPS group, LPS group, and control group cell samples at 36 h (Table 1). PCR amplification was performed using a Roche fluorescence quantitative PCR instrument (LightCycler 480II, Ebersberg, Germany) according to the manufacturer’s instructions (CWBIO, Beijing, China). Next, 1 μg of cDNA template was mixed with qPCR SYBR master mix in the presence of forward and reverse primers. The reaction program was set as follows: pre-denaturation at 95 °C for 10 min, denaturation at 95 °C for 10 s, annealing at 60 °C for 30 s, extension at 72 °C for 30 s, and a total of 40 cycles. Gene expression was normalized using the 2−ΔΔCT method with GAPDH as the internal standard. Each biological duplicate was controlled for using three technical replicates.

2.6. Immunofluorescence

The cytoskeletons of the control, PRRSV, LPS, and PRRSV + LPS groups at 12 h, 24 h, and 36 h were observed by immunofluorescence. The cells were fixed with 4% paraformaldehyde (200 μL) at 4 °C for 30 min and then washed three times with 0.01M PBS (500 μL). Subsequently, they were permeabilized with 0.25% Triton-X-100 (200 μL) at 4 °C for 15 min. After aspirating the residual liquid and washing three times with PBS, the specimens were blocked with 1% BSA (500 μL) at 37 °C for 1 h. The primary antibody was diluted 1:500, and 500 μL was added to each well, incubated overnight at 4 °C, and followed by three washes with PBS. The fluorescent secondary antibody was diluted 1:300 in 1% BSA, and 500 μL was added to each well, incubated in the dark at 37 °C for 1 h, then washed three times with PBS. The cell slides were covered with 200 μL of phalloidin and incubated for 60 min at room temperature. Subsequently, the cells were incubated with Goat Anti-Mouse IgG H&L (FITC) and PE/Cy5 Anti-ARP2/3 antibodies (bs-0296G-Cy5, Bioss Antibodies, Novi, MI, USA), diluted in secondary antibody dilution buffer, for 2 h at 37 °C in the dark, and then stained with DAPI for 5 min. The DAPI dye was diluted 1:300 in 1% BSA, and 500 μL was added to each well, incubated in the dark at 37 °C for 10 min, followed by three washes with PBS. Finally, an anti-fade reagent (20 μL) was dropped onto the surface of the samples for mounting.

2.7. Data Analysis

The statistical analyses were accomplished using GraphPad Prism 7, and the data are expressed as the mean ± SD. Statistical analyses, including one-way analysis of variance, were performed using the Statistical Package for Social Sciences (SPSS 15.0, Austin, TX, USA) software. * p < 0.05 for each group versus the control groups at the same time; ** p < 0.01 for each group versus the control groups at the same time.

3. Results

3.1. Cultivation and Identification of PRRSV in PEECs

To test whether PRRSV can survive and replicate in PEECs, the cell line was infected with the PRRSV strain NADC30. PEECs are spindle-shaped, polygonal, or tadpole-shaped, with round nuclei located in the center of the nucleus, clear contours, and arranged in a vortex-like pattern; The PEECs in the PRRSV group showed obvious lesions, such as wrinkling, clustering, and drawing. There was an increase in floating cells, and obvious plaques were visible (Figure 1A). Indirect immunofluorescence (IFA) showed that PEECs can be recognized by specific monoclonal antibodies against PRRSV, and infected cells exhibit specific fluorescence after inoculation with PRRSV (Figure 1B).

3.2. RNA-Seq Analysis of PEECs in PRRSV + LPS, LPS, and PRRSV Groups

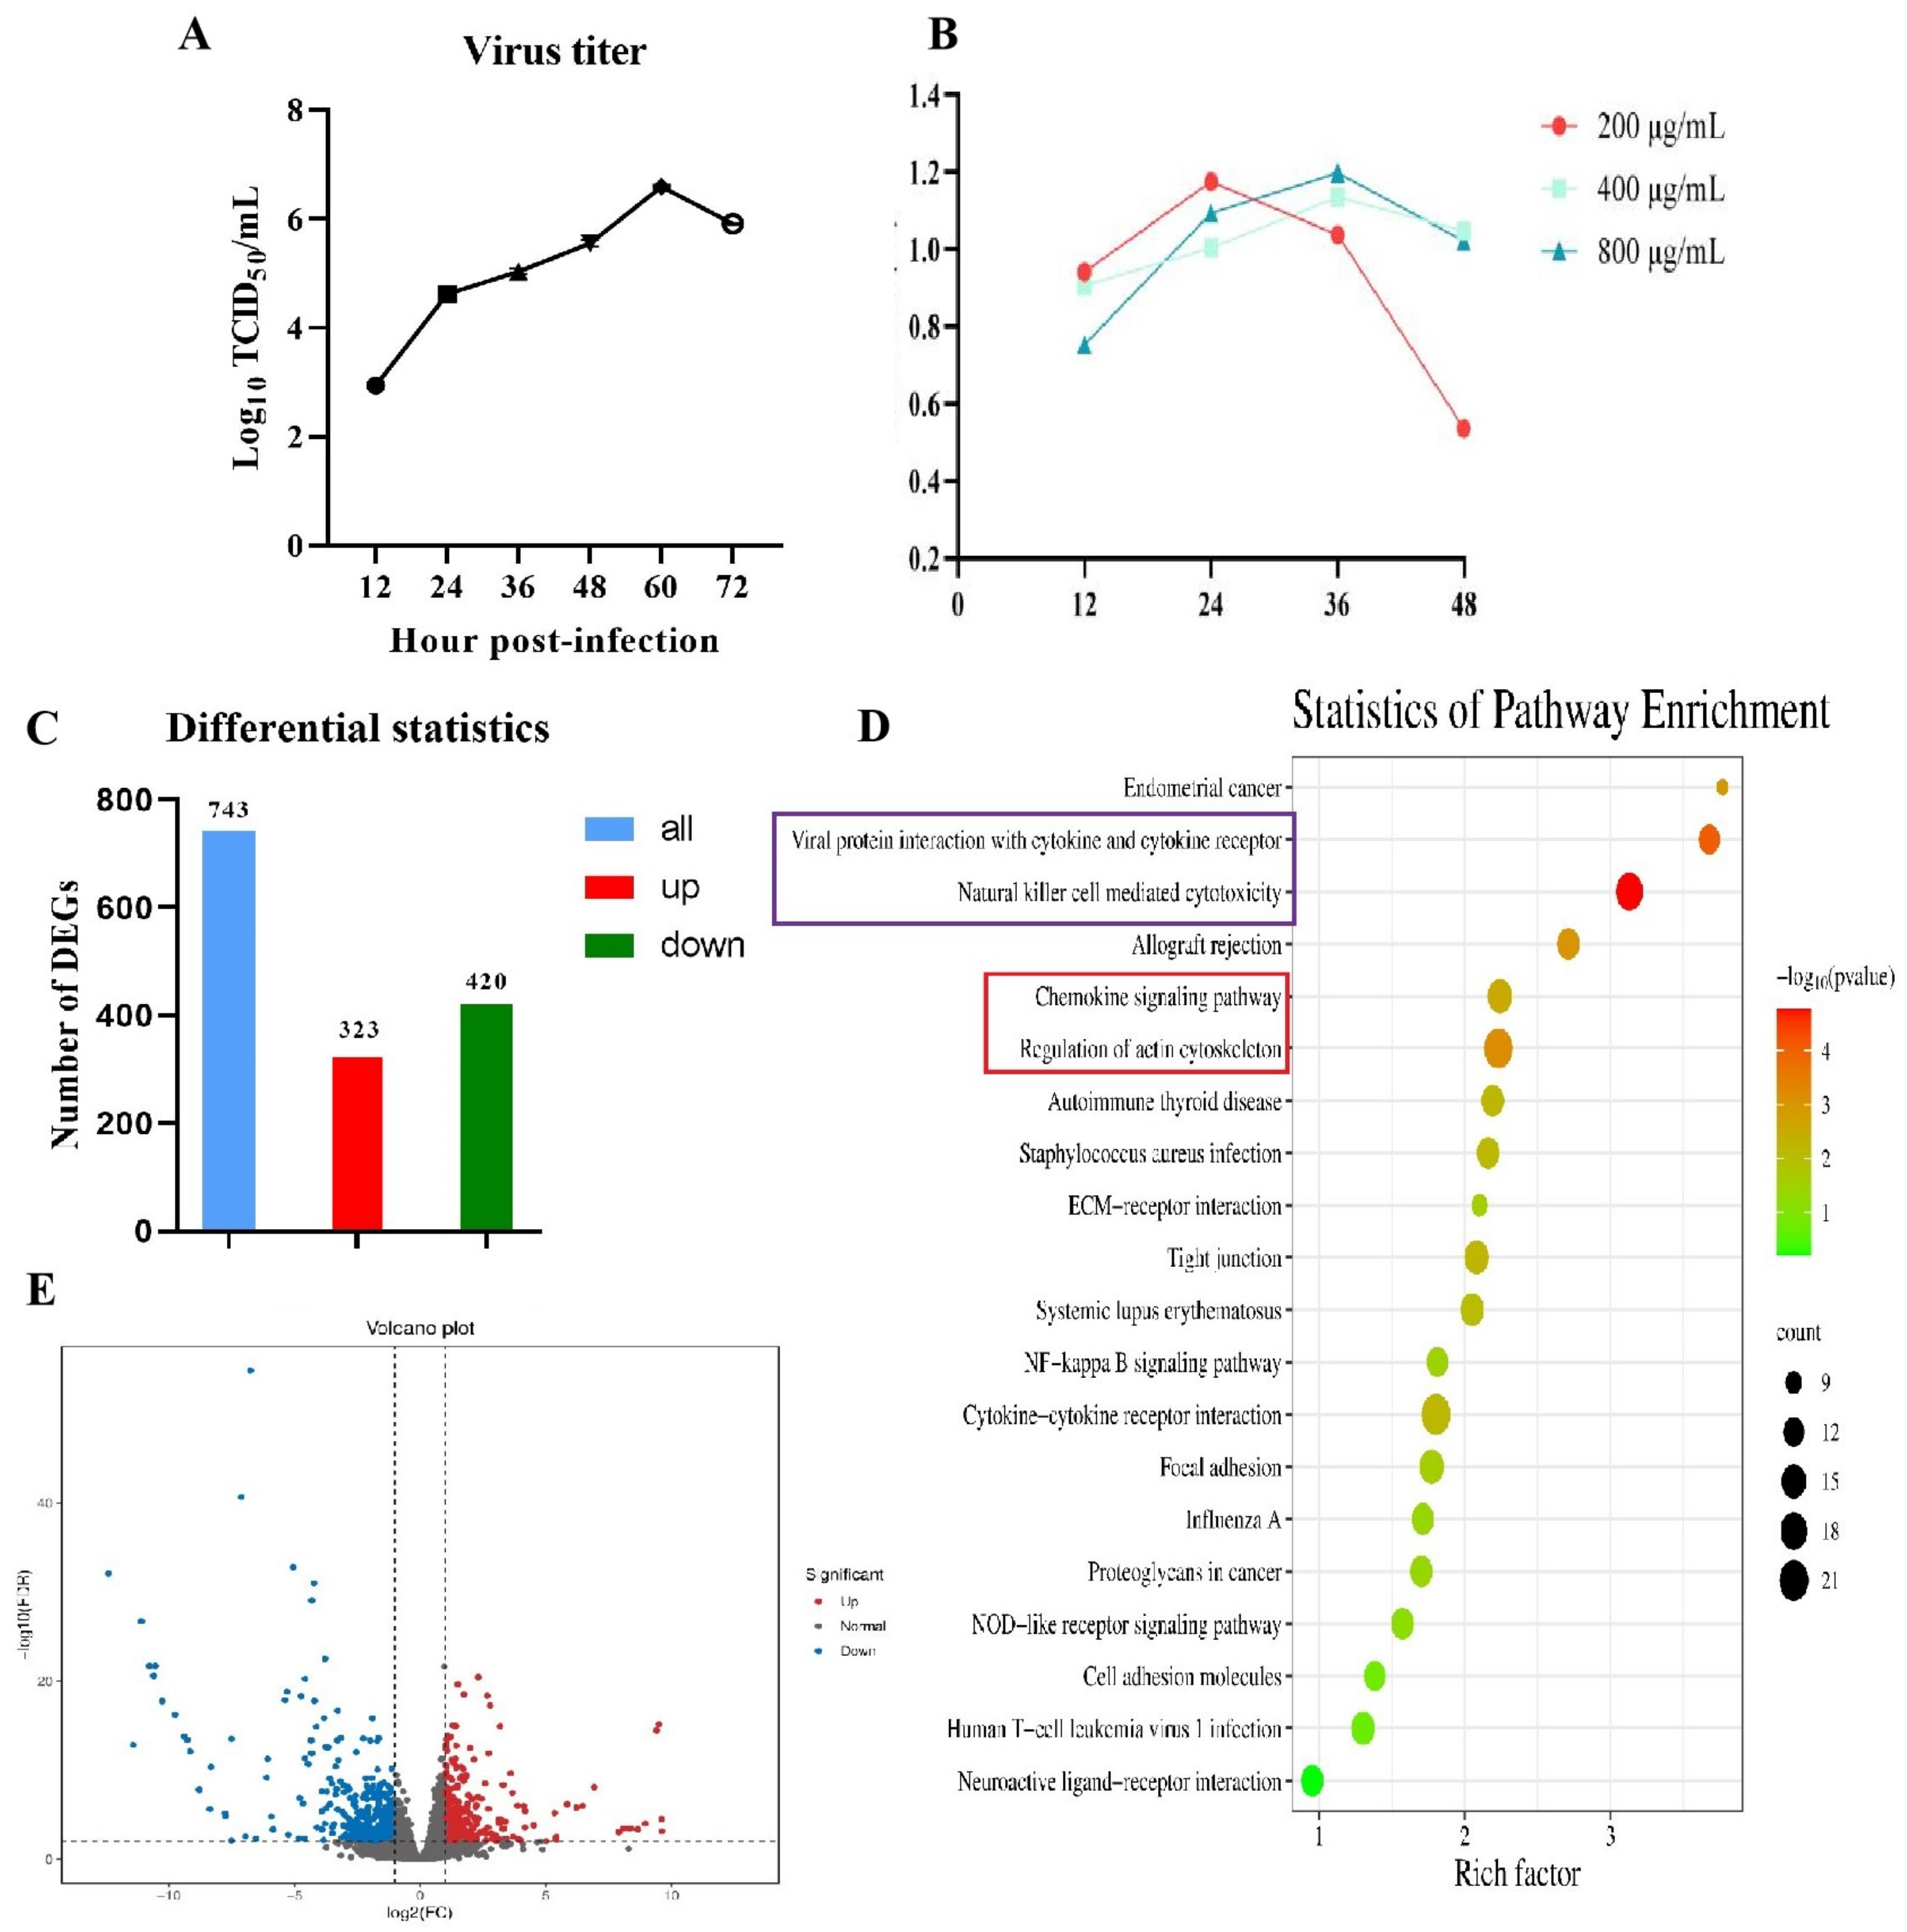
Infection of the porcine endometrial epithelial cells with the third generation of PRRSV strain was performed, and the cell supernatant was collected every 12 h to determine TCID50. The PRRSV strain had the highest virus titer in porcine endometrial epithelial cells at 60 h of infection, reaching 106.625 TCID50, and then began to decline (Figure 2A).
In order to investigate the LPS effect on porcine endometrial epithelial cells, four different concentrations of LPS (0, 200, 400, and 800 μg/mL) were selected in cells at 12, 24, 36, and 48 h (Figure 2B). LPS at concentrations of 200, 400, and 800 μg/mL inhibited cell proliferation at 12 h. In the LPS groups at 400 and 800 μg/mL, cell viability continuously increased with time (12–36 h), and cell proliferation was inhibited at 48 h. The cell viability was highest in the 200 μg/mL LPS group at 24 h, and decreased continuously at 36 and 48 h, with significant inhibition of cell proliferation at 48 h. Therefore, 200 μg/mL was chosen as the subsequent effective dose. Based on the above experimental data, we chose 12 h, 24 h, and 36 h to observe the subsequent experiments caused by PRRSV and LPS.
To identify changes in PRRSV(+) and PRRSV(+) + LPS group cells, we applied RNA-seq analysis to identify different genes between the PRRSV(+) + LPS, LPS, PRRSV(+), and PRRSV(−) groups. We identified 743 differentially expressed genes, of which 323 were upregulated and 420 were downregulated (Figure 2C,E). KEGG signaling pathway enrichment analysis of differentially expressed genes revealed that three signaling pathways, viral protein interaction with cytokines and cytokine receptors, natural killer cell-mediated cytotoxicity, the chemokine signaling pathway, and regulation of actin cytoskeleton were significantly enriched in the PRRSV(+), PRRSV(+) + LPS, LPS and PRRSV(−) groups (Figure 2D).

3.3. Infection of PRRSV and LPS in Porcine Uterine Epithelial Cells

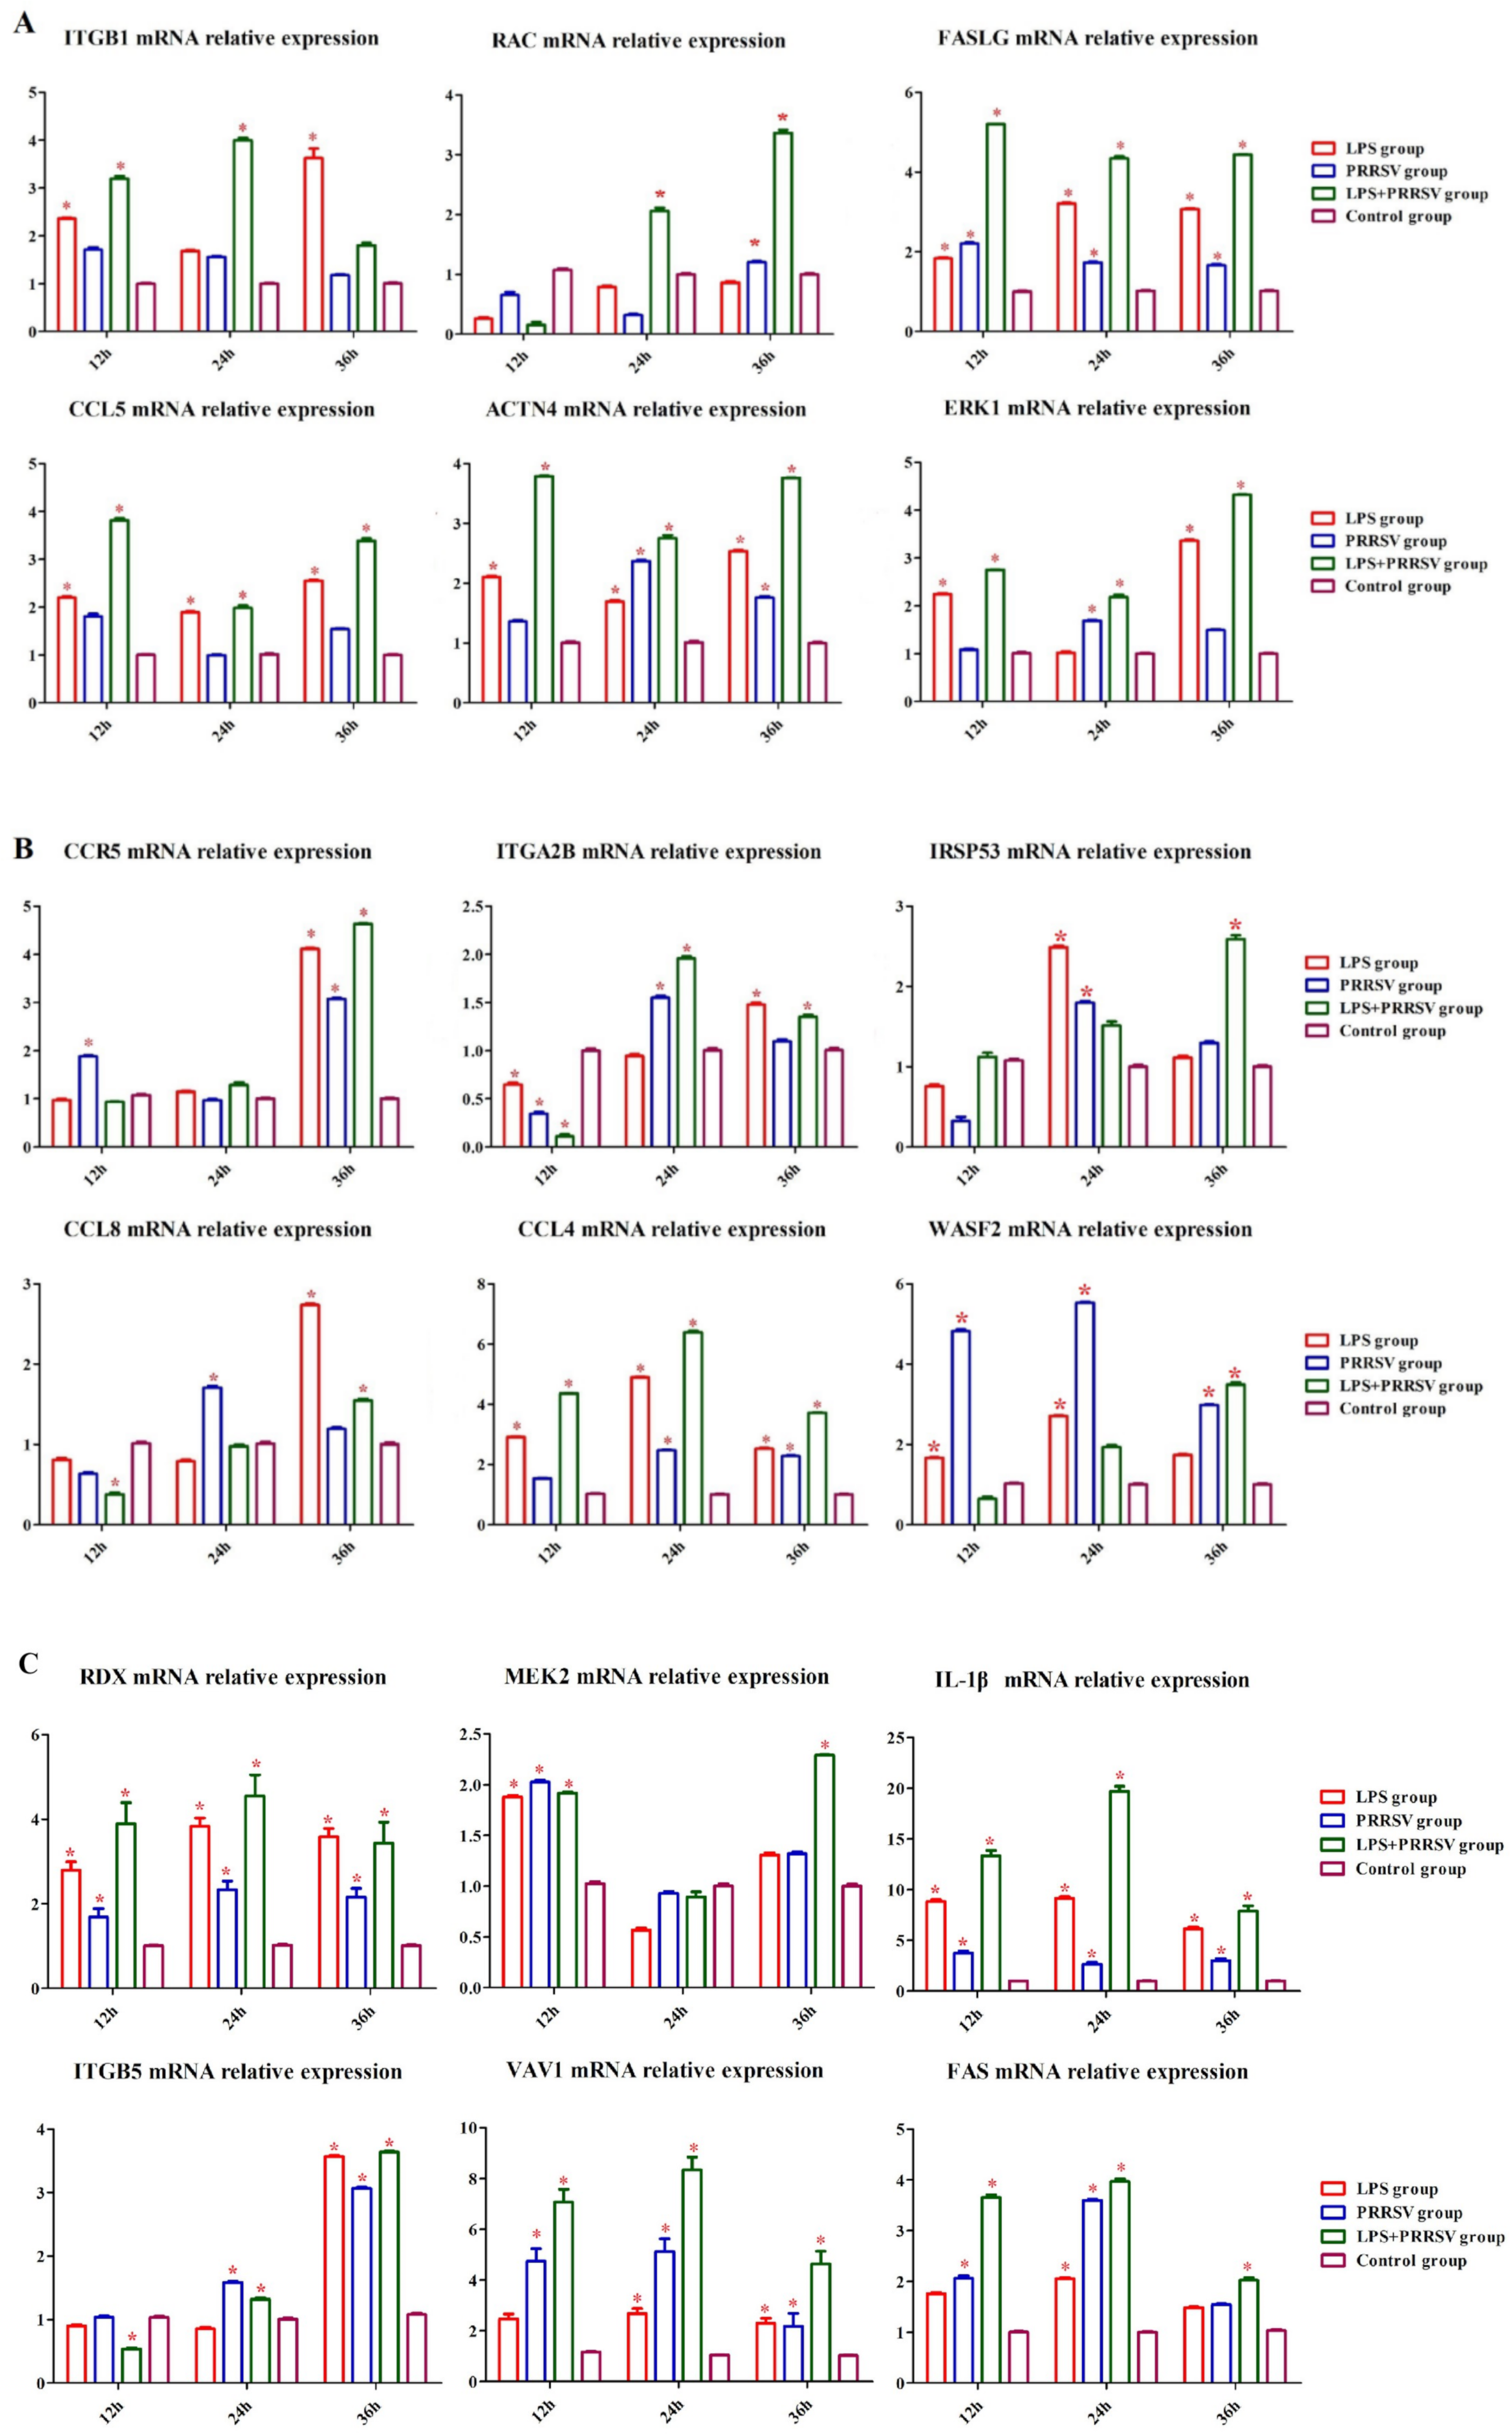
The porcine uterine epithelial cells were treated with LPS, PRRSV, and LPS + PRRSV 12, 24, and 36 h. The CCR5 mRNA expression was significantly upregulated in the LPS, PRRSV, and LPS + PRRSV groups compared with that in the control group at 36 h (p < 0.05). The ITGA2B mRNA expression was significantly downregulated in the LPS, PRRSV, and LPS + PRRSV groups compared with that in the control group at 12 h (p < 0.05). The ITGA2B mRNA expression was significantly upregulated in the PRRSV and LPS + PRRSV groups compared with that in the control group at 24 h (p < 0.05). IRSP53 mRNA expression was significantly upregulated in the PRRSV and LPS groups compared with that in the control group at 24 h (p < 0.05). IRSP53 mRNA expression was significantly upregulated in the PRRSV + LPS group compared with that in the control group at 36 h (p < 0.05). CCL8 mRNA expression in the LPS and PRRSV + LPS groups was higher than that in the control group at 36 h (p < 0.05). CCL4 mRNA expression in the PRRSV + LPS group was significantly increased compared with that in the control group at 12, 24, and 36 h (p < 0.05). WASF2 mRNA expression in the PRRSV group was significantly increased compared with that in the control group at 12, 24, and 36 h (p < 0.05; Figure 3).
The ITGB1 mRNA expression in the PRRSV group was significantly increased compared with that in the control group at 12 and 24 h (p < 0.05). The ITGB1 mRNA expression in the LPS group was significantly increased compared with that in the control group at 36 h (p < 0.05). The IL-1β and FASLG mRNA expression in the LPS, PRRSV, and PRRSV + LPS groups were significantly increased compared with that in the control group at 12, 24, and 36 h (p < 0.05). The CCL5 mRNA expression in the LPS and PRRSV + LPS groups was significantly increased compared with that in the control group at 12, 24, and 36 h (p < 0.05). The ACTN4 mRNA expression in the LPS, PRRSV, and PRRSV + LPS groups was significantly increased compared with that in the control group at 24 and 36 h (p < 0.05). The ERK1 mRNA expression in the LPS and PRRSV + LPS groups was significantly increased compared with that in the control group at 12 and 36 h (p < 0.05; Figure 3B).
The RDX mRNA expression in the LPS, PRRSV, and PRRSV + LPS groups was significantly increased compared with that in the control group at 12, 24, and 36 h (p < 0.05). The NF-κB mRNA expression was upregulated in the LPS, PRRSV, and PRRSV + LPS groups compared with that in the control group at 24 h. The NF-κB mRNA expression was upregulated in the LPS and PRRSV + LPS groups compared with that in the control group at 36 h (p < 0.05). The MEK2 mRNA expression was upregulated in the LPS and PRRSV + LPS groups compared with that in the control group at 12 h (p < 0.05). The PPBP mRNA expression in the PRRSV group was significantly increased compared with that in the control group at 12, 24, and 36 h (p < 0.05). The ITGB5 mRNA expression in the LPS, PRRSV, and PRRSV + LPS groups was significantly increased compared with that in the control group at 36 h (p < 0.05). The VAV1 mRNA expression in the LPS, PRRSV, and PRRSV + LPS groups was significantly increased compared with that in the control group at 24 and 36 (p < 0.05; Figure 3C).
The TAK1 mRNA expression in the LPS, PRRSV, and PRRSV + LPS groups was significantly decreased compared with that in the control group at 36 h (p < 0.05). The TNF-α mRNA expression in the LPS group was significantly increased compared with that in the control group at 36 h (p < 0.05). The TNF-α mRNA expression in the PRRSV + LPS group was significantly decreased compared with that in the control group at 36 h (p < 0.05). The MYD88 mRNA expression in the PRRSV and PRRSV + LPS groups was significantly increased compared with that in the control group at 24 h (p < 0.05). The MYD88 mRNA expression in the LPS, PRRSV, and PRRSV + LPS groups was significantly decreased compared with that in the control group at 36 h (p < 0.05). The RAC mRNA expression in the PRRSV and PRRSV + LPS groups was significantly decreased compared with that in the control group at 36 h (p < 0.05). The FAS mRNA expression in the PRRSV and PRRSV + LPS groups was significantly increased compared with that in the control group at 12 and 24 h (p < 0.05). The IKKA mRNA expression in the LPS and PRRSV groups was significantly decreased compared with that in the control group at 24 and 36 h (p < 0.05). The IKKA mRNA expression in the LPS + PRRSV group was significantly increased compared with that in the control group at 24 and 36 h (p < 0.05; Figure 3D).

3.4. The Effects of LPS and PRRSV on the Cytoskeletal Structure of PEECs

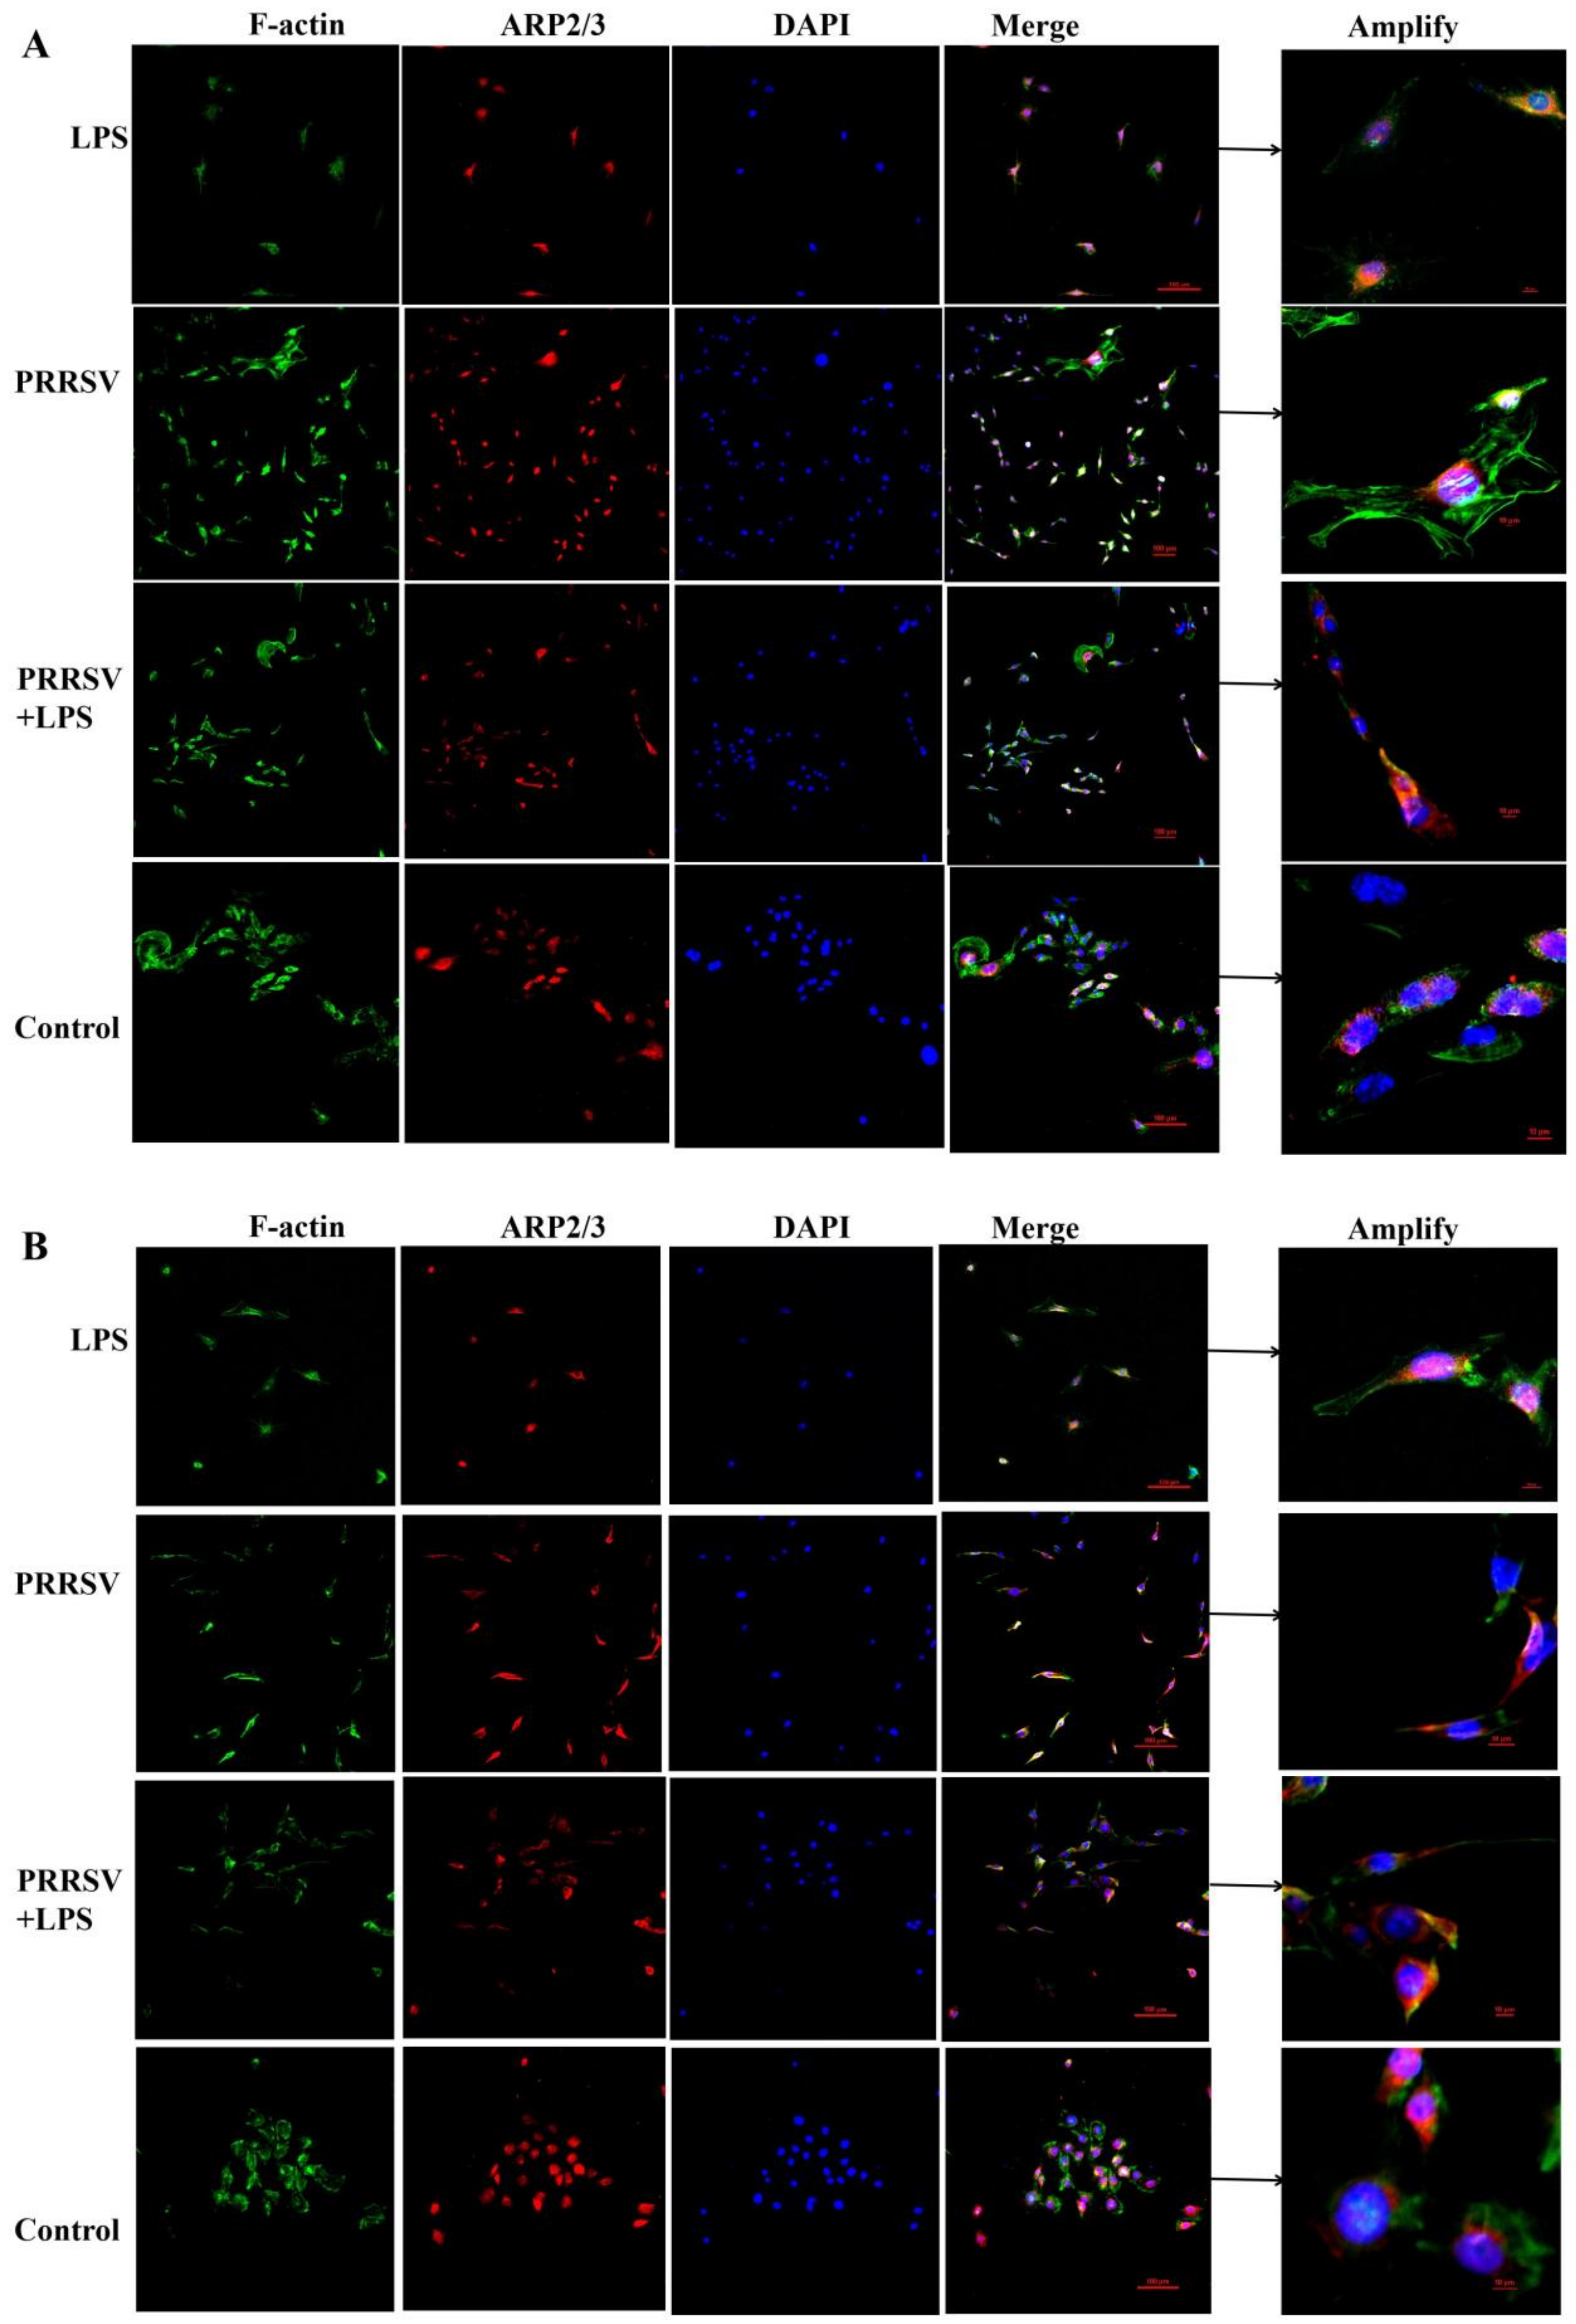
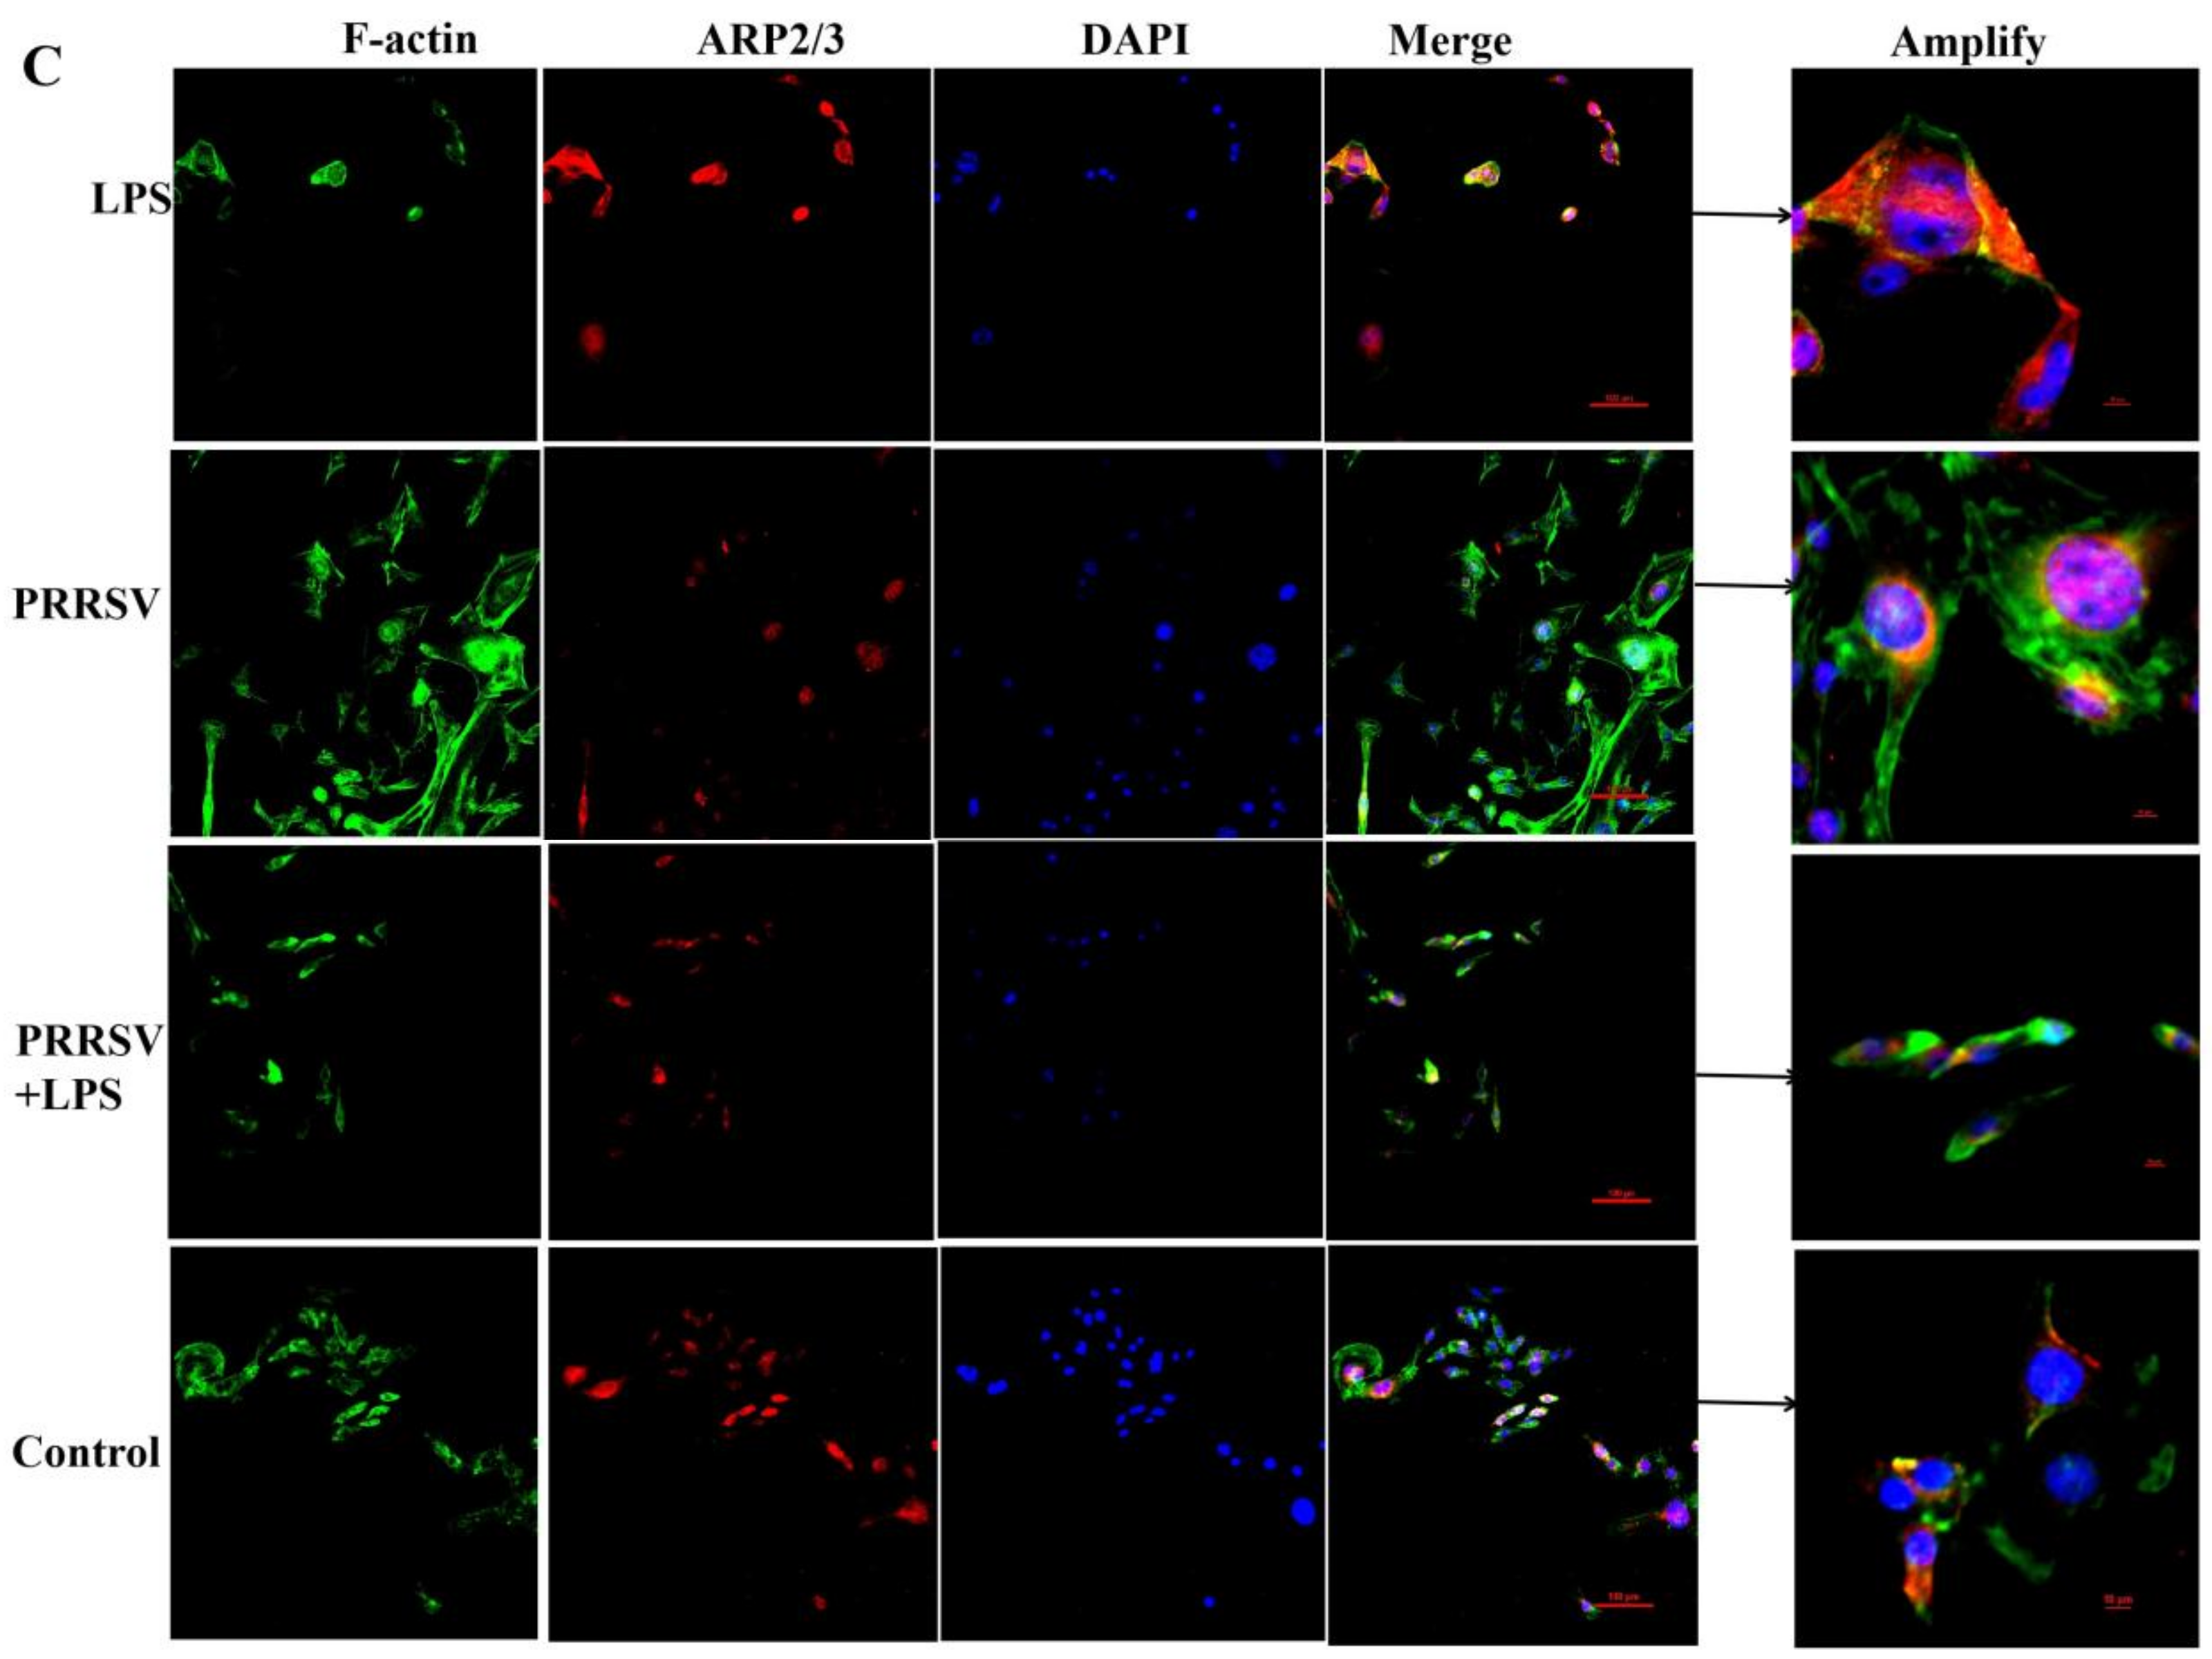
We investigated the cytoskeletons of the PEECs after the co-infection with PRRSV and endotoxins. The results show that the control group cells were small circles without pseudopodia extension, and a smooth cell surface, F-actin, and ARP2 protein were distributed around the nucleus of the cell at 12, 24, and 36 h.
After LPS treatment for 12 and 24 h, there was no change in the cell morphology and structure, but the number of cells significantly decreased compared to the control group. After the LPS treatment for 36 h, there was a change in the cell morphology and structure, and F-actin and ARP2 protein expression were increased compared with those in the control group.
After PRRSV treatment for 12 and 24 h, compared with the control group, the cell morphology became irregular in the PRRSV group. After the PRRSV treatment for 36 h, F-actin protein expression was significantly increased in the PRRSV group compared to the control group.
After PRRSV + LPS treatment for 12 and 24 h, the pseudopodia of the cells became longer, and the F-actin protein presented a filamentous structure, which led to a decrease in expression levels around the cells; the number of cells was significantly decreased in the PRRSV + LPS group.
After PRRSV + LPS treatment for 12 h, the morphology of the cells was disrupted, aggregation, cell shrinkage, and elongation. After PRRSV + LPS treatment for 24 h, the pseudopodia of the cells became longer, and the F-actin protein showed a filamentous structure and lower expression level around the cells; After PRRSV + LPS treatment for 36 h, F-actin protein expression was significantly increased in PRRSV group, and more irregular changes in cell morphology and structure occurred, compared with those in the control group cells (Figure 4).

3.5. The LPS Level in Porcine Uterine Epithelial Cells

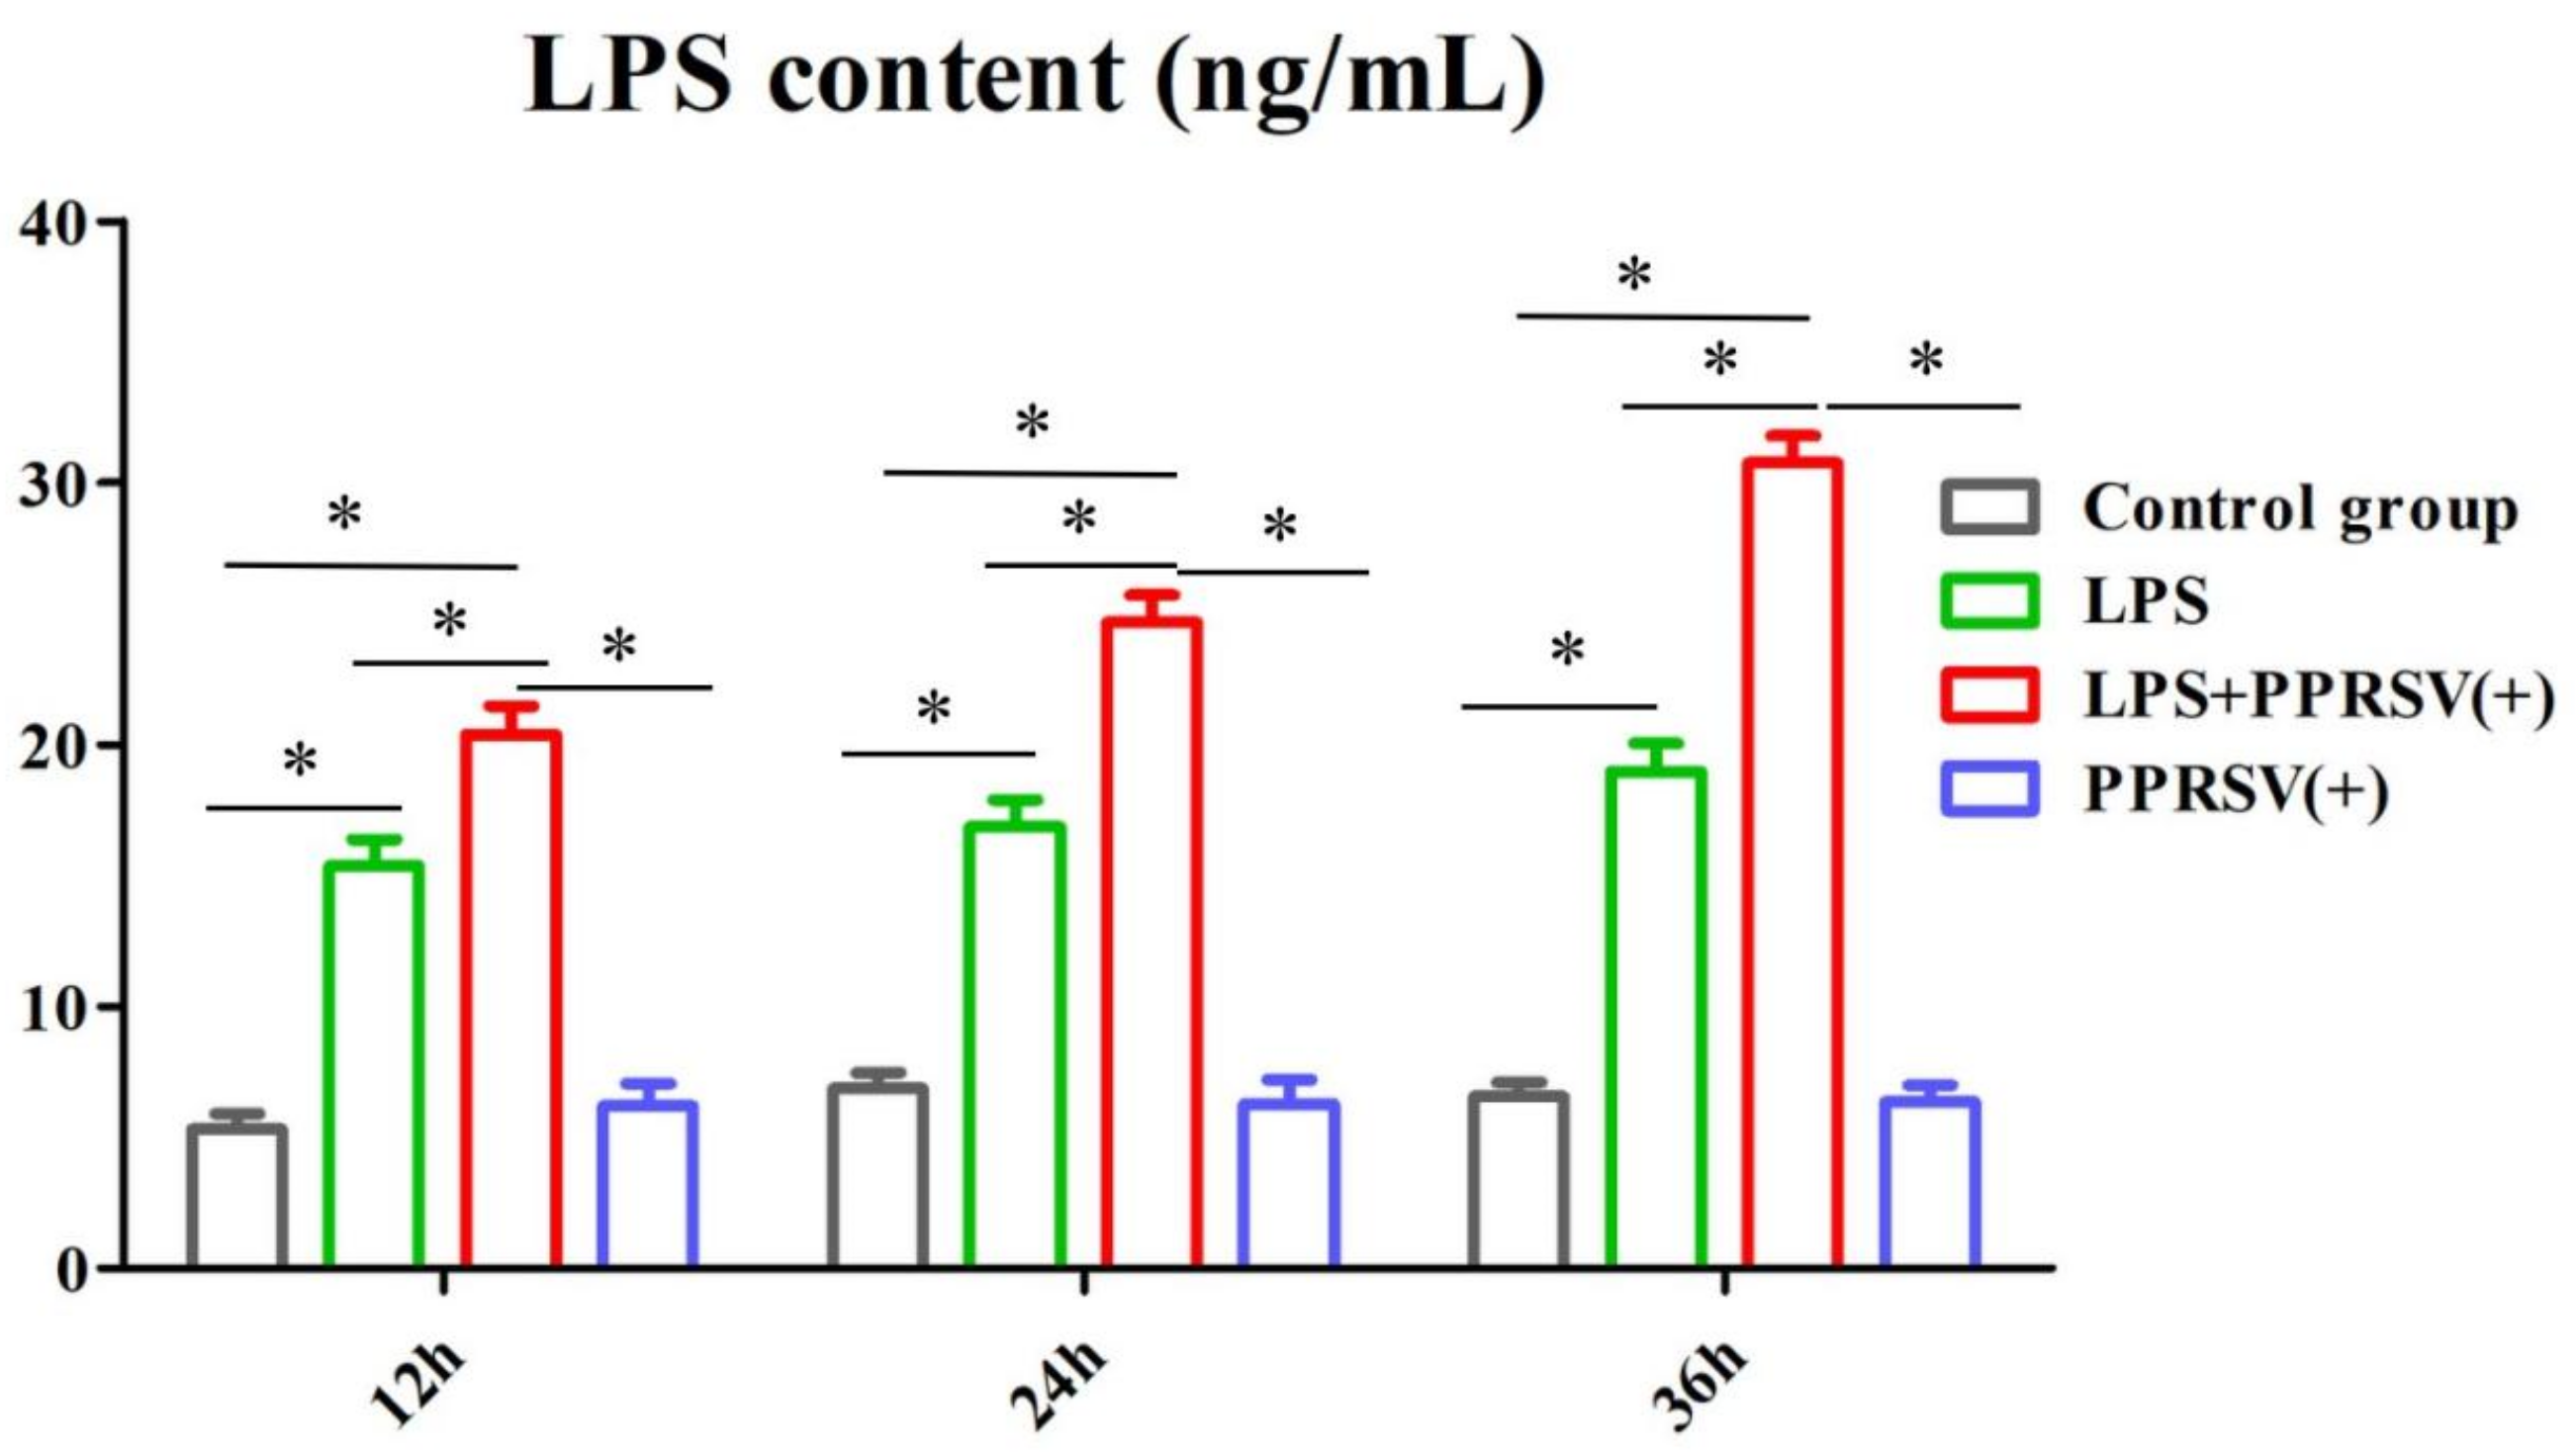
At 12 h, 24 h, and 36 h, the LPS content in the PRRSV(+) + LPS group was significantly increased compared to the LPS group (p < 0.05); the LPS content in the PRRSV(+) + LPS group at 36 h was higher than that at 24 h and higher than that at 12 h (p < 0.05) (Figure 5).

4. Discussion

PRRSV infection can cause abortion or stillbirth during pregnancy, seriously affecting the reproductive ability of sows [10]. PRRSV infections are often associated with secondary bacterial infections [11,12]. Bacterial endotoxins are toxic substances found in the cell walls of gram-negative bacteria. LPS is the main toxic substance in endotoxins released during the death and metabolism of gram-negative bacteria [13,14]. Endotoxins are more stable; therefore, they are widely distributed in a variety of environments [15].
We used RNA-seq analysis of the PEECs of the PRRSV + LPS, LPS, and PRRSV groups. The results showed that three significantly different signaling pathways were selected for viral protein interaction with cytokine and cytokine receptor, natural killer cell-mediated cytotoxicity, the chemokine signaling pathway, and regulation of actin cytoskeleton by KEGG analysis. Subsequently, we used qPCR to detect the key factors of the three significant signaling pathways, and the trend of their expression levels was consistent with the results of the RNA-seq analysis. We found that PRRSV could survive in PEECs that exhibit wrinkling, clustering, and drawing. This indicates that PRRSV can directly act on PEECs; however, the PRRSV mechanism to increase the content of bacterial toxins was unclear.
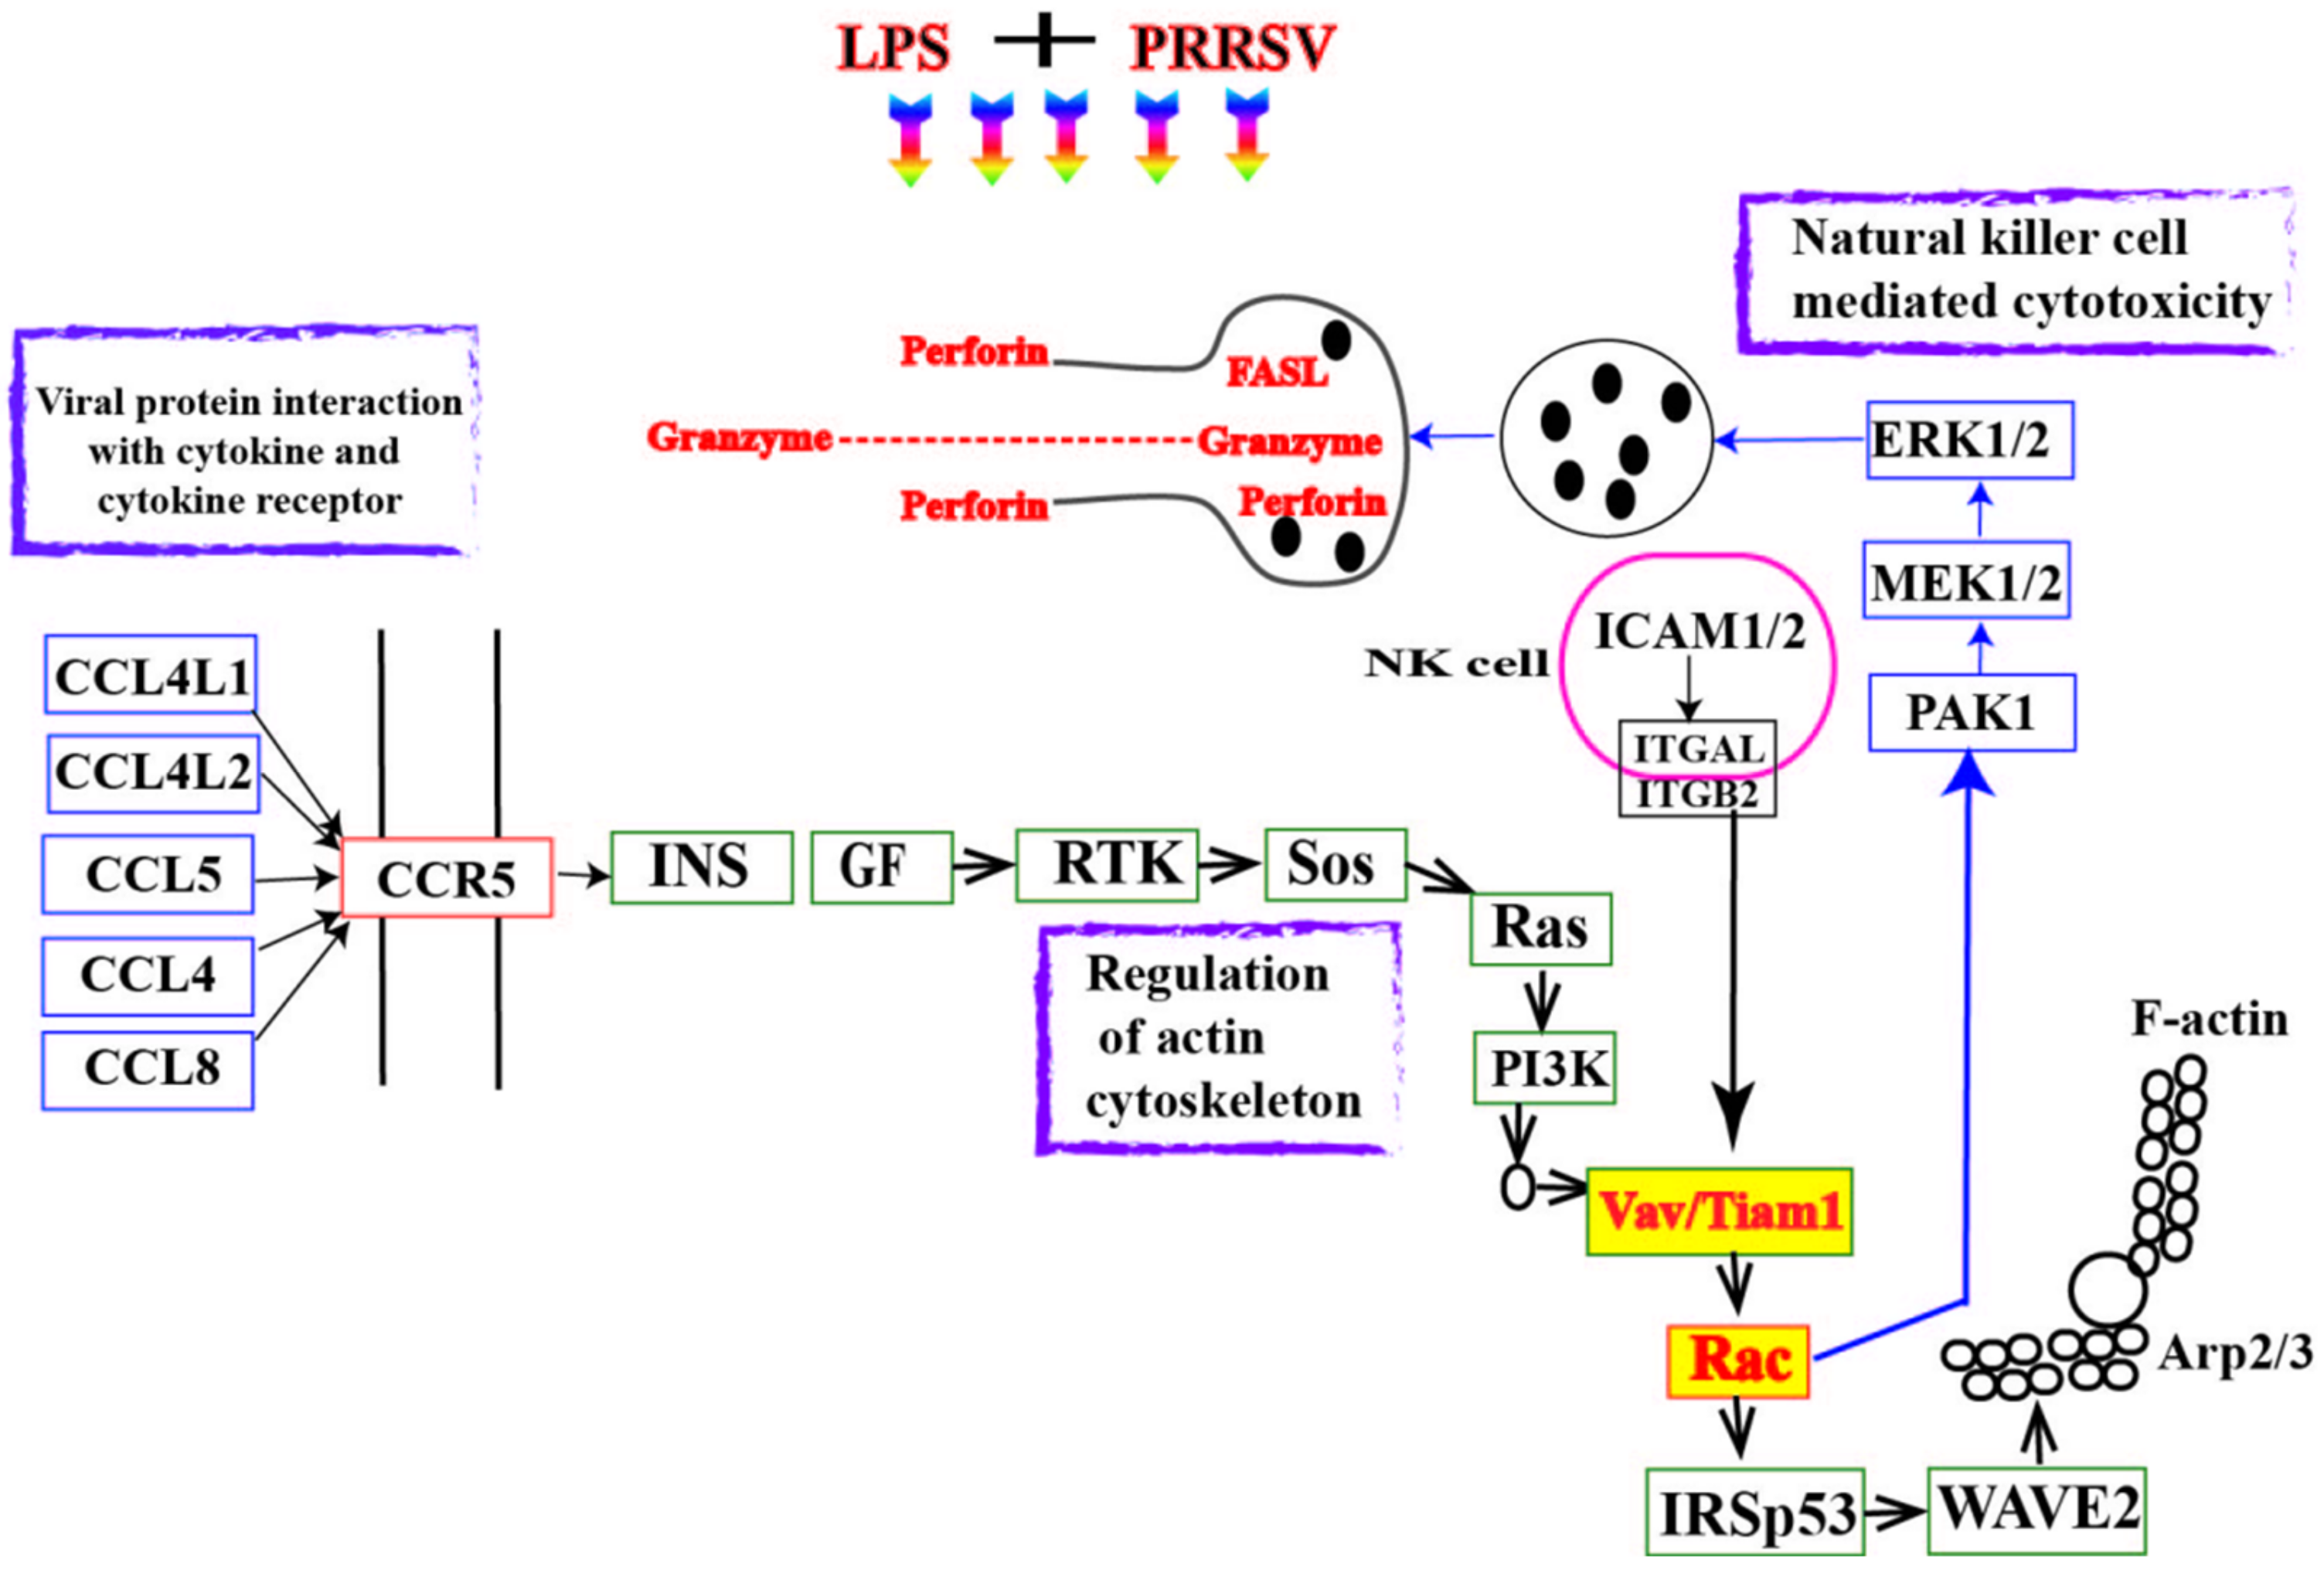
Figure 5 shows that nonspecific immune responses are initiated first, and NK cells directly kill PRRSV-infected cells. Simultaneously, they interact with various other immune cells in the body, regulating immune status and function. PRRSV infection enhances the activity of virus-mediated inflammatory factors and their receptors, leading to an increase in bacterial endotoxin levels [16,17]. After LPS, PRRSV, and LPS + PRRSV co-infection with PEECs, the expression levels of various chemokines (CCL4, CCL5, and CCL8) were significantly increased compared to those in the control group at 36 h. The expression levels of the main receptor, CCR5, were significantly higher than those in the control group, indicating that PRRSV and LPS can both cause an increase in chemokine expression and act synergistically [18]. Chemokines play an important role in the body, not only in regulating pregnancy and implantation, but also in the development, progression, and metastasis of various diseases [19]. They also stimulate NK cells and support their implantation during early pregnancy. CCL5 may serve as a key chemokine that regulates the maternal endometrial immune response and protects the fetal and placental environment from exogenous infections [20].
Integrins (ITGA and ITGB) are a type of cell surface receptors that act as “bridges”, which transduce extracellular signals into cells and form organisms with intracellular cytoskeletons [13]. They play important roles in various biological processes, including embryonic development, tissue repair, immune responses, and tumor occurrence and development [21]. This integration regulates the activity of downstream proteins, thereby affecting the biological behavior of cells. When cells were co-infected with PRRSV and LPS, the expression levels of ITGA2B, ITGB1, and ITGB5 significantly increased compared to those in the control group after 24 h. Downstream pathway-related factors, such as VAV1, MEK, and ERK, were also significantly increased, indicating that the downstream signaling pathway was activated [22]. The expression of FASLG and its receptor FAS was increased, and the expression of RAC, IRSP53, and WASF2 mRNA was significantly increased after 24 and 36 h in the PRRSV + LPS and PRRSV(+) groups. The cytoskeleton is a network structure within cells that is mainly composed of protein fibers consisting of three main components: microtubules, microfilaments, and intermediate fibers [23,24]. These structural elements maintain normal cell morphology and perform necessary functions, such as migration and cell division. Chemokine activation stimulates the expression of epidermal growth factors and their receptors, leading to changes in the expression of downstream factors [25]. The activation of RAC is involved in the regulation of cell polarity and processes, such as cell phagocytosis, cell migration, and cytoskeleton reorganization. PRRSV regulates vesicular transport through F-actin remodeling, and RAC is an important regulator of this process [26]. During viral entry, RAC acts as an effector to aggregate the F-actin cytoskeleton, providing the necessary mechanical forces for viral particle surfing, receptor aggregation, and virus-containing vesicle internalization, which regulate endotoxin entry into cells. RAC can also regulate WAVE through IRSP53, which binds to activated RAC and WAVE2 to guide F-actin nucleation. The Arp2/3 complex is indispensable for the assembly of F-actin, and its main function is to promote F-actin polymerization (Figure 6) [27,28].
The above results show that PRRSV can cause cellular F-actin aggregation, induce cytoskeleton recombination and pseudopodia formation, and cause microfilament cytoskeleton remodeling to promote bacterial endotoxin endocytosis, inflammatory reactions of cells, and destroy the integrity of the endometrial epithelial barrier. The co-infection of PRRSV and LPS causes an upregulated pro-inflammatory response, and the highly expressed cell microfilaments and cytoskeleton disrupt the original network structure, causing changes in the original physiological function of the PEECs. These results provide scientific research data on the clinical symptoms of abortion.

Author Contributions

C.W. and S.X.: writing—original draft, formal analysis and data collection; A.Y. and M.Z.: methodology, experiment, investigation. All authors have read and agreed to the published version of the manuscript.

Funding

This work was jointly supported and sponsored by the National Key R&D Program of China (2023YFD1801100) and Shaanxi Natural Science Foundation (2023-YBNY-123).

Institutional Review Board Statement

The animal study protocol was approved by the Institutional Review Board (or Ethics Committee) of Northwest A&F university of INSTITUTE (protocol code 2023-7-11 and 2024-5-12 of approval).

Informed Consent Statement

Not applicable.

Data Availability Statement

The original contributions presented in the study are included in the article, further inquiries can be directed to the corresponding author.

Conflicts of Interest

Author Siyi Xing is employed Shandong Xinde Technology Co., Ltd. The remaining authors declare that the research was conducted in the absence of any commercial or financial relationships that could be construed as a potential conflict of interest.

References

  1. Romeo, C.; Parisio, G.; Scali, F.; Tonni, M.; Santucci, G.; Maisano, A.M.; Barbieri, I.; Boniotti, M.B.; Stadejek, T.; Alborali, G.L. Complex interplay between PRRSV-1 genetic diversity, coinfections and antimicrobial use influences performance parameters in post-weaning pigs. Vet. Microbiol. 2023, 284, 109–130. [Google Scholar] [CrossRef]
  2. Callens, B.; Persoons, D.; Maes, D.; Laanen, M.; Postma, M.; Boyen, F.; Haesebrouck, F.; Butaye, P.; Catry, B.; Dewulf, J. Prophylactic and metaphylactic antimicrobial use in Belgian fattening pig herds. Prev. Vet. Med. 2012, 106, 53–62. [Google Scholar] [CrossRef]
  3. Wills, R.W.; Gray, J.T.; Fedorka-Cray, P.J.; Yoon, K.J.; Ladely, S.; Zimmerman, J.J. Synergism between porcine reproductive and respiratory syndrome virus (PRRSV) and Salmonella choleraesuis in swine. Vet. Microbiol. 2000, 71, 177–192. [Google Scholar] [CrossRef]
  4. Zhao, G.; Zhang, L.; Li, C.; Zhao, J.; Liu, N.; Li, Y.; Wang, J.; Liu, L. Identification of enterobacteria in viscera of pigs afflicted with porcine reproductive and respiratory syndrome and other viral co-infections. Microb. Pathog. 2020, 147, 104–123. [Google Scholar] [CrossRef]
  5. Li, Y.; Li, X.; Gong, S.; Ao, Y.; Zhu, L.; Xu, Z. Etiology analysis of the bacterial secondary infection of PRRSV in Sichuan Province from 2013 to 2016. Acta Agric. Zhejiang 2017, 9, 1437–1444. [Google Scholar]
  6. Liu, X.; Guo, C.; Huang, Y.; Zhang, X.; Chen, Y. Inhibition of porcine reproductive and respiratory syndrome virus by Cecropin D in vitro. Infect. Genet. Evol. 2015, 34, 7–16. [Google Scholar] [CrossRef]
  7. Deaton, M.K.; Spear, A.; Faaberg, K.S.; Pegan, S.D. The vOTU domain of highlypathogenic porcine reproductive and respiratory syndrome virus displays a differential substrate preference. Virology 2014, 21, 454–455. [Google Scholar]
  8. Liu, X.; Xu, Z.; Zhu, L.; Liao, S.; Guo, W. Transcriptome analysis of porcine thymus following porcine cytomegalovirus infection. PLoS ONE 2014, 9, e113921. [Google Scholar] [CrossRef]
  9. Fablet, C.; Marois, C.; Dorenlor, V.; Eono, F.; Eveno, E.; Jolly, J.P.; Le Devendec, L.; Kobisch, M.; Madec, F.; Rose, N. Bacterial pathogens associated with lung lesions in slaughter pigs from 125 herds. Res. Vet. Sci. 2012, 93, 627–630. [Google Scholar] [CrossRef]
  10. Bordet, E.; Maisonnasse, P.; Renson, P.; Bouguyon, E.; Crisci, E.; Tiret, M.; Descamps, D.; Bernelin-Cottet, C.; Urien, C.; Lefèvre, F.; et al. Porcine alveolar macrophage-like cells are pro-infammatory pulmonary intravascular macrophages that produce large titers of porcine reproductive and respiratory syndrome virus. Sci. Rep. 2018, 8, 101–172. [Google Scholar] [CrossRef]
  11. Van Gucht, S.; Van Reeth, K.; Pensaert, M. Interaction between Porcine Reproductive-Respiratory Syndrome Virus and Bacterial Endotoxin in the Lungs of Pigs: Potentiation of Cytokine Production and Respiratory Disease. J. Clin. Microbiol. 2003, 8, 960–966. [Google Scholar] [CrossRef]
  12. Brockmeier, S.L.; Palmer, M.V.; Bolin, S.R. Effects of intranasal inoculation of porcine reproductive and respiratory syndrome virus, Bordetella bronchiseptica, or a combination of both organisms in pigs. Am. J. Vet. Res. 2000, 61, 892–899. [Google Scholar] [CrossRef]
  13. Labarque, G.; Van Reeth, K.; Van Gucht, S.; Nauwynck, H.; Pensaert, M. Porcine reproductive-respiratory syndrome virus (PRRSV) infection predisposes pigs for respiratory signs upon exposure to bacterial lipopolysaccharide. Vet. Microbiol. 2002, 88, 1–12. [Google Scholar] [CrossRef]
  14. Murtaugh, M.P.; Baarsch, M.J.; Zhou, Y.; Scamurra, R.W.; Lin, G. Inflammatory cytokines in animal health and disease. Vet. Immunol. Immunopathol. 1996, 54, 45–55. [Google Scholar] [CrossRef]
  15. Van Gucht, S.; Labarque, G.; Van Reeth, K. he combination of PRRS virus and bacterial endotoxin as a model for multifactorial respiratory disease in pigs. Vet. Immunol. Immunopathol. 2004, 102, 165–178. [Google Scholar] [CrossRef]
  16. Van Reeth, K.; Nauwynck, H.J.; Pensaert, M.B. Broncho-alveolar interferon-a, tumor necrosis factor-a, interleukin-1 and inflammation during acute influenza in pigs: A possible model for humans? J. Infect. Dis. 1998, 177, 1076–1079. [Google Scholar] [CrossRef]
  17. Qiao, S.; Feng, L.; Bao, D.; Guo, J.; Wan, B.; Xiao, Z.; Zhang, G. Porcine reproductive and respiratory syndrome virus and bacterial endotoxin act in synergy to amplify the inflammatory response of infected macrophages. Vet. Microbiol. 2011, 149, 213–220. [Google Scholar] [CrossRef]
  18. Chen, C.; Cui, S.; Zhang, C.; Li, J.; Wang, J. Development and validation of reverse transcription loop-mediated isothermal amplification for detection of PRRSV. Virus Genes 2010, 40, 76–83. [Google Scholar] [CrossRef]
  19. Labarque, G.; Van Gucht, S.; Van Reeth, K.; Nauwynck, H.; Pensaert, M. Respiratory tract protection upon challenge of pigs vaccinated with attenuated porcine reproductive and respiratory syndrome virus vaccines. Vet. Microbiol. 2003, 95, 187–197. [Google Scholar] [CrossRef]
  20. Forsberg, R.; Storgaard, T.; Nielsen, H.S.; Oleksiewicz, M.B.; Cordioli, P.; Sala, G.; Hein, J.; Bøtner, A. The genetic diversity of European type PRRSV is similar to that of the North American type but is geographically skewed within Europe. Virology 2002, 299, 38–47. [Google Scholar] [CrossRef]
  21. Almeida, M.N.; Zhang, M.; Zimmerman, J.J.; Holtkamp, D.J.; Linhares, D.C.L. Finding PRRSV in sow herds: Family oral fluids vs. serum samples from due-to-wean pigs. Prev. Vet. Med. 2021, 193, 105–117. [Google Scholar] [CrossRef]
  22. Biernacka, K.; Karbowiak, P.; Wrobel, P.; Charęza, T.; Czopowicz, M.; Balka, G.; Goodell, C.; Rauh, R.; Stadejek, T. Detection of porcine reproductive and respiratory syndrome virus (PRRSV) and influenza a virus (IAV) in oral fluid of pigs. Res. Vet. Sci. 2016, 109, 74–80. [Google Scholar] [CrossRef]
  23. Decorte, I.; Van Breedam, W.; Van der Stede, Y.; Nauwynck, H.J.; De Regge, N.; Cay, A.B. Detection of total and PRRSV-specific antibodies in oral fluids collected with different rope types from PRRSV-vaccinated and experimentally infected pigs. BMC Vet. Res. 2014, 10, 134–145. [Google Scholar] [CrossRef]
  24. Henao-Diaz, A.; Gim’enez-Lirola, L.; Baum, D.H.; Zimmerman, J. Guidelines for oral fluid-based surveillance of viral pathogens in swine. Porc. Health Manag. 2020, 6, 12–21. [Google Scholar] [CrossRef]
  25. Ramirez, A.; Wang, C.; Prickett, J.R.; Pogranichniy, R.; Yoon, K.J.; Main, R.; Johnson, J.K.; Rademacher, C.; Hoogland, M.; Hoffmann, P.; et al. Efficient surveillance of pig populations using oral fluids. Prev. Vet. Med. 2012, 104, 292–300. [Google Scholar] [CrossRef]
  26. Torremorell, M.; Moore, C.; Christianson, W. Establishment of a herd negative for porcine reproductive and respiratory syndrome virus (PRRSV) from PRRSV-positive sources. J. Swine Health Prod. 2002, 10, 153–160. [Google Scholar] [CrossRef]
  27. Ge, S.Q.; Li, J.M.; Fan, X.X.; Liu, F.X.; Li, L.; Wang, Q.H.; Ren, W.J.; Bao, J.Y.; Liu, C.J.; Wang, H. Molecular Characterization of African Swine Fever Virus, China. Emerg. Infect. Dis. 2018, 24, 2131–2133. [Google Scholar] [CrossRef]
  28. Michel, O.; Nagy, A.; Schroeven, M.; Duchateau, J.; Neve, J.; Fondu, P.; Sergysels, R. Dose-response relationship to inhaled endotoxin in normal subjects. Am. J. Respir. Crit. Care Med. 1997, 156, 1157–1164. [Google Scholar] [CrossRef]
Figure 1. (A), The cytopathic effect induced by PRRSV on PEECs (100×); the scale is 50 μm; (B), PRRSV on PEECs by IFA (100×); the scale is 100 μm.
Microbiolres 15 00129 g001
Figure 2. (A) Growth curve of PEECs infected with PRRSV strain; (B) Effects of lipopolysaccharide on the viability of PEECs; (C) Statistics of pathway enrichment; (D,E) KEGG signaling pathway enrichment analysis of differentially expressed genes found that the three signaling pathways, viral protein interaction with cytokine and cytokine receptor, natural killer cell-mediated cytotoxicity, regulation of actin cytoskeleton were significantly enriched in the PRRSV(+), PRRSV(+) + LPS, LPS and PRRSV(−) groups.
Microbiolres 15 00129 g002
Figure 3. Changes in mRNA expression levels of key factors in PRRSV + LPS, PRRSV, LPS, and control groups of PEECs. (A) The TTGB1, RAC, FASLG, CCL5, ACTN4, ERK1 mRNA expression change in 12 h, 24 h and 36 h of LPS group, PRRSV(+) group, PRRSV(+) + LPS group and control group; (B) The CCR5, ITGA2B, IRSP53, CCL8, CCL4 and WASF2 mRNA expression change in 12 h, 24 h and 36 h of LPS group, PRRSV(+) group, PRRSV(+) + LPS group and control group; (C) The RDX, MEK2, IL-1β, ITGB5, VAV1 and FAS mRNA expression change in 12 h, 24 h and 36 h of LPS group, PRRSV(+) group, PRRSV(+) + LPS group and control group; (D) The TAK1, TNF-α, MyD88, and IKKA mRNA expression change in 12 h, 24 h and 36 h of LPS group, PRRSV(+) group, PRRSV(+) + LPS group and control group; * p < 0.05 for PRRSV + LPS group, PRRSV group, LPS group versus control group at the same time.
Microbiolres 15 00129 g003aMicrobiolres 15 00129 g003b
Figure 4. The cytoskeleton of F-actin protein: (FITC-conjugated phalloidin staining, green color), ARP2 protein (Alexa Fluor 647 staining, red color), and nucleus (DAPI staining, blue color) expressed and distributed in porcine uterine epithelial cells after treatment with LPS, PRRSV, and PRRSV + LPS for 12 h (A), 24 h (B), and 36 h (C) (×200).
Microbiolres 15 00129 g004aMicrobiolres 15 00129 g004b
Figure 5. The LPS content in the PRRSV + LPS, PRRSV, LPS, and control groups of PEECs at 12 h, 24 h, and 36 h. * p < 0.05 for the PRRSV, LPS, and control groups versus the PRRSV + LPS group at the same time.
Microbiolres 15 00129 g005
Figure 6. The interrelationships between the four signaling pathways (viral protein interaction with cytokine and cytokine receptor, natural killer cell-mediated cytotoxicity, chemokine signaling pathway, and regulation of actin cytoskeleton).
Microbiolres 15 00129 g006
Table 1. The primer sequences.
ItemGenBank Accession No.Nucleotide Sequence of Primers (5′–3′)Size, bp
ACTN1NM_001243061.1F: CGACCACTTGGCAGAGAAGT
R: TTGCGGATGAGGGCTTTGAT
132
ITGB1NM_213968.1F: TACGTTGAAATTCAAGCGGGC
R: TCTGTTCCAAGGCTTTTCAC
111
ITGB5JF748726.1F: GACTGTCTGCTTATCCACCC
R: CCATTCTTGACCAGGTTTGT
110
FASLGNM_213806.F: CTCAAGATCCATCCCTCTGG
R: TCATCTTTCCCTCCATCAGC
227
RDXNM_001009576.1F: AATTGTGGCTAGGCGTTGATG
R: ATGGTGTCAGGCTTCCTTCTT
256
CCL4NM_213779.1F: GAAGCTTCCTCGCAACTTCG
R: TTTGGTCTGGAATACCACGG
82
ITGA2BNM_213998.1F: ACGCTTGGTTCAACGTCTCT
R: CGCTTGAAGAAGCCACACTTC
205
FASNM_213839.1F: AGACGGACACGGTTAAGAGT
R: GAGGCAGTGATTGTGACATTG
216
CCL5NM_001129946.2F: CACACCCTGCTGTTTTTCC
R: CCATTTCTTCTCTGGGTTGG
151
CCL8FJ156752.1F: CTGCTTCGGTCTGGTCAATG
R: CTGGCTGTTGGTGATTCTTGT
73
CCR5NM_001001618.1F: CCAGGCAGAGGCTCCAGAT
R: CACAAGCCGACAGAGATTTCC
78
PPBPNM_213862.2F: TGCCATTGTCACTGCTCCT
R: GATGAATGCCAGAGACGGTATT
123
METNM_001038008.1F: GAAGCCAAGGGTTAGCACAG
R: GAGAGTTCTTTTGCAGAGCAGA
244
VCLNM_213934.1F: CAGACCTGCTCCTCACCTTC
R: TGCTGCCTCTCGTCAATCAT
181
Myd88EU056737.1F: CTGCTTCGGTCTGGTCAATG
R: CTGGCTGTTGGTGATTCTTGT
167
Tak1KU504629.1F: TTCCTCCTCCTCTTCGTCTTC
R: CTCCTCTTCCAACAACCTCCT
116
IkkaNM_001005150.1F: GTGTCGCTCTTGTTGAAGTGT
R: CTCTCCTCATCCTCGCTCTC
167
Erk2NM_001198922.1F: CACCTACTGCTTACCATTGCTT
R: GATTGAGAAGGATGCGGATGAG
226
FN1XM_003133642.5F: CTACTATTACTGGTCTGGAA
R: CACTCTTCTGATTGTTCTT
75
Vav1NM_001267833.1F: CCGAGAATGCCACTGCTAAC
R: CGGCGATGTGTCTTATCCTTC
226
Rac1NM_001243585.1F: TCCCAACACTCCCATCATCC
R: GGCACTTCCTCTTCCTCTTCT
254
MEK2NM_001244550.1F: AGGCTGCTTCTAAGGCTTCC
R: TACCAGGCTCACTGCTCTTG
156
COL1A1XM_021067153.1F: AGCCCTGGTGAAAATGGAGC
R: CACCCTTAGCACCAACAGCA
190
GAPDHNM_001206359.1F: GGAGAACGGGAAGCTTGTCA
R: GGTTCACGCCCATCACAAAC
224
Disclaimer/Publisher’s Note: The statements, opinions and data contained in all publications are solely those of the individual author(s) and contributor(s) and not of MDPI and/or the editor(s). MDPI and/or the editor(s) disclaim responsibility for any injury to people or property resulting from any ideas, methods, instructions or products referred to in the content.