

The Mechanism of Bacterial Endotoxin Invasion Pathways in Porcine Reproductive and Respiratory Syndrome Virus-Positive Porcine Endometrial Epithelial Cells

Abstract
:1. Introduction
2. Methods
2.1. Porcine Endometrial Epithelial Cells (PEECs)
2.2. PRRSV Culture in PEECs
2.3. Cell and LPS and Virus Co-Culture
2.4. RNA-Seq
2.5. Real-Time PCR
2.6. Immunofluorescence
2.7. Data Analysis
3. Results
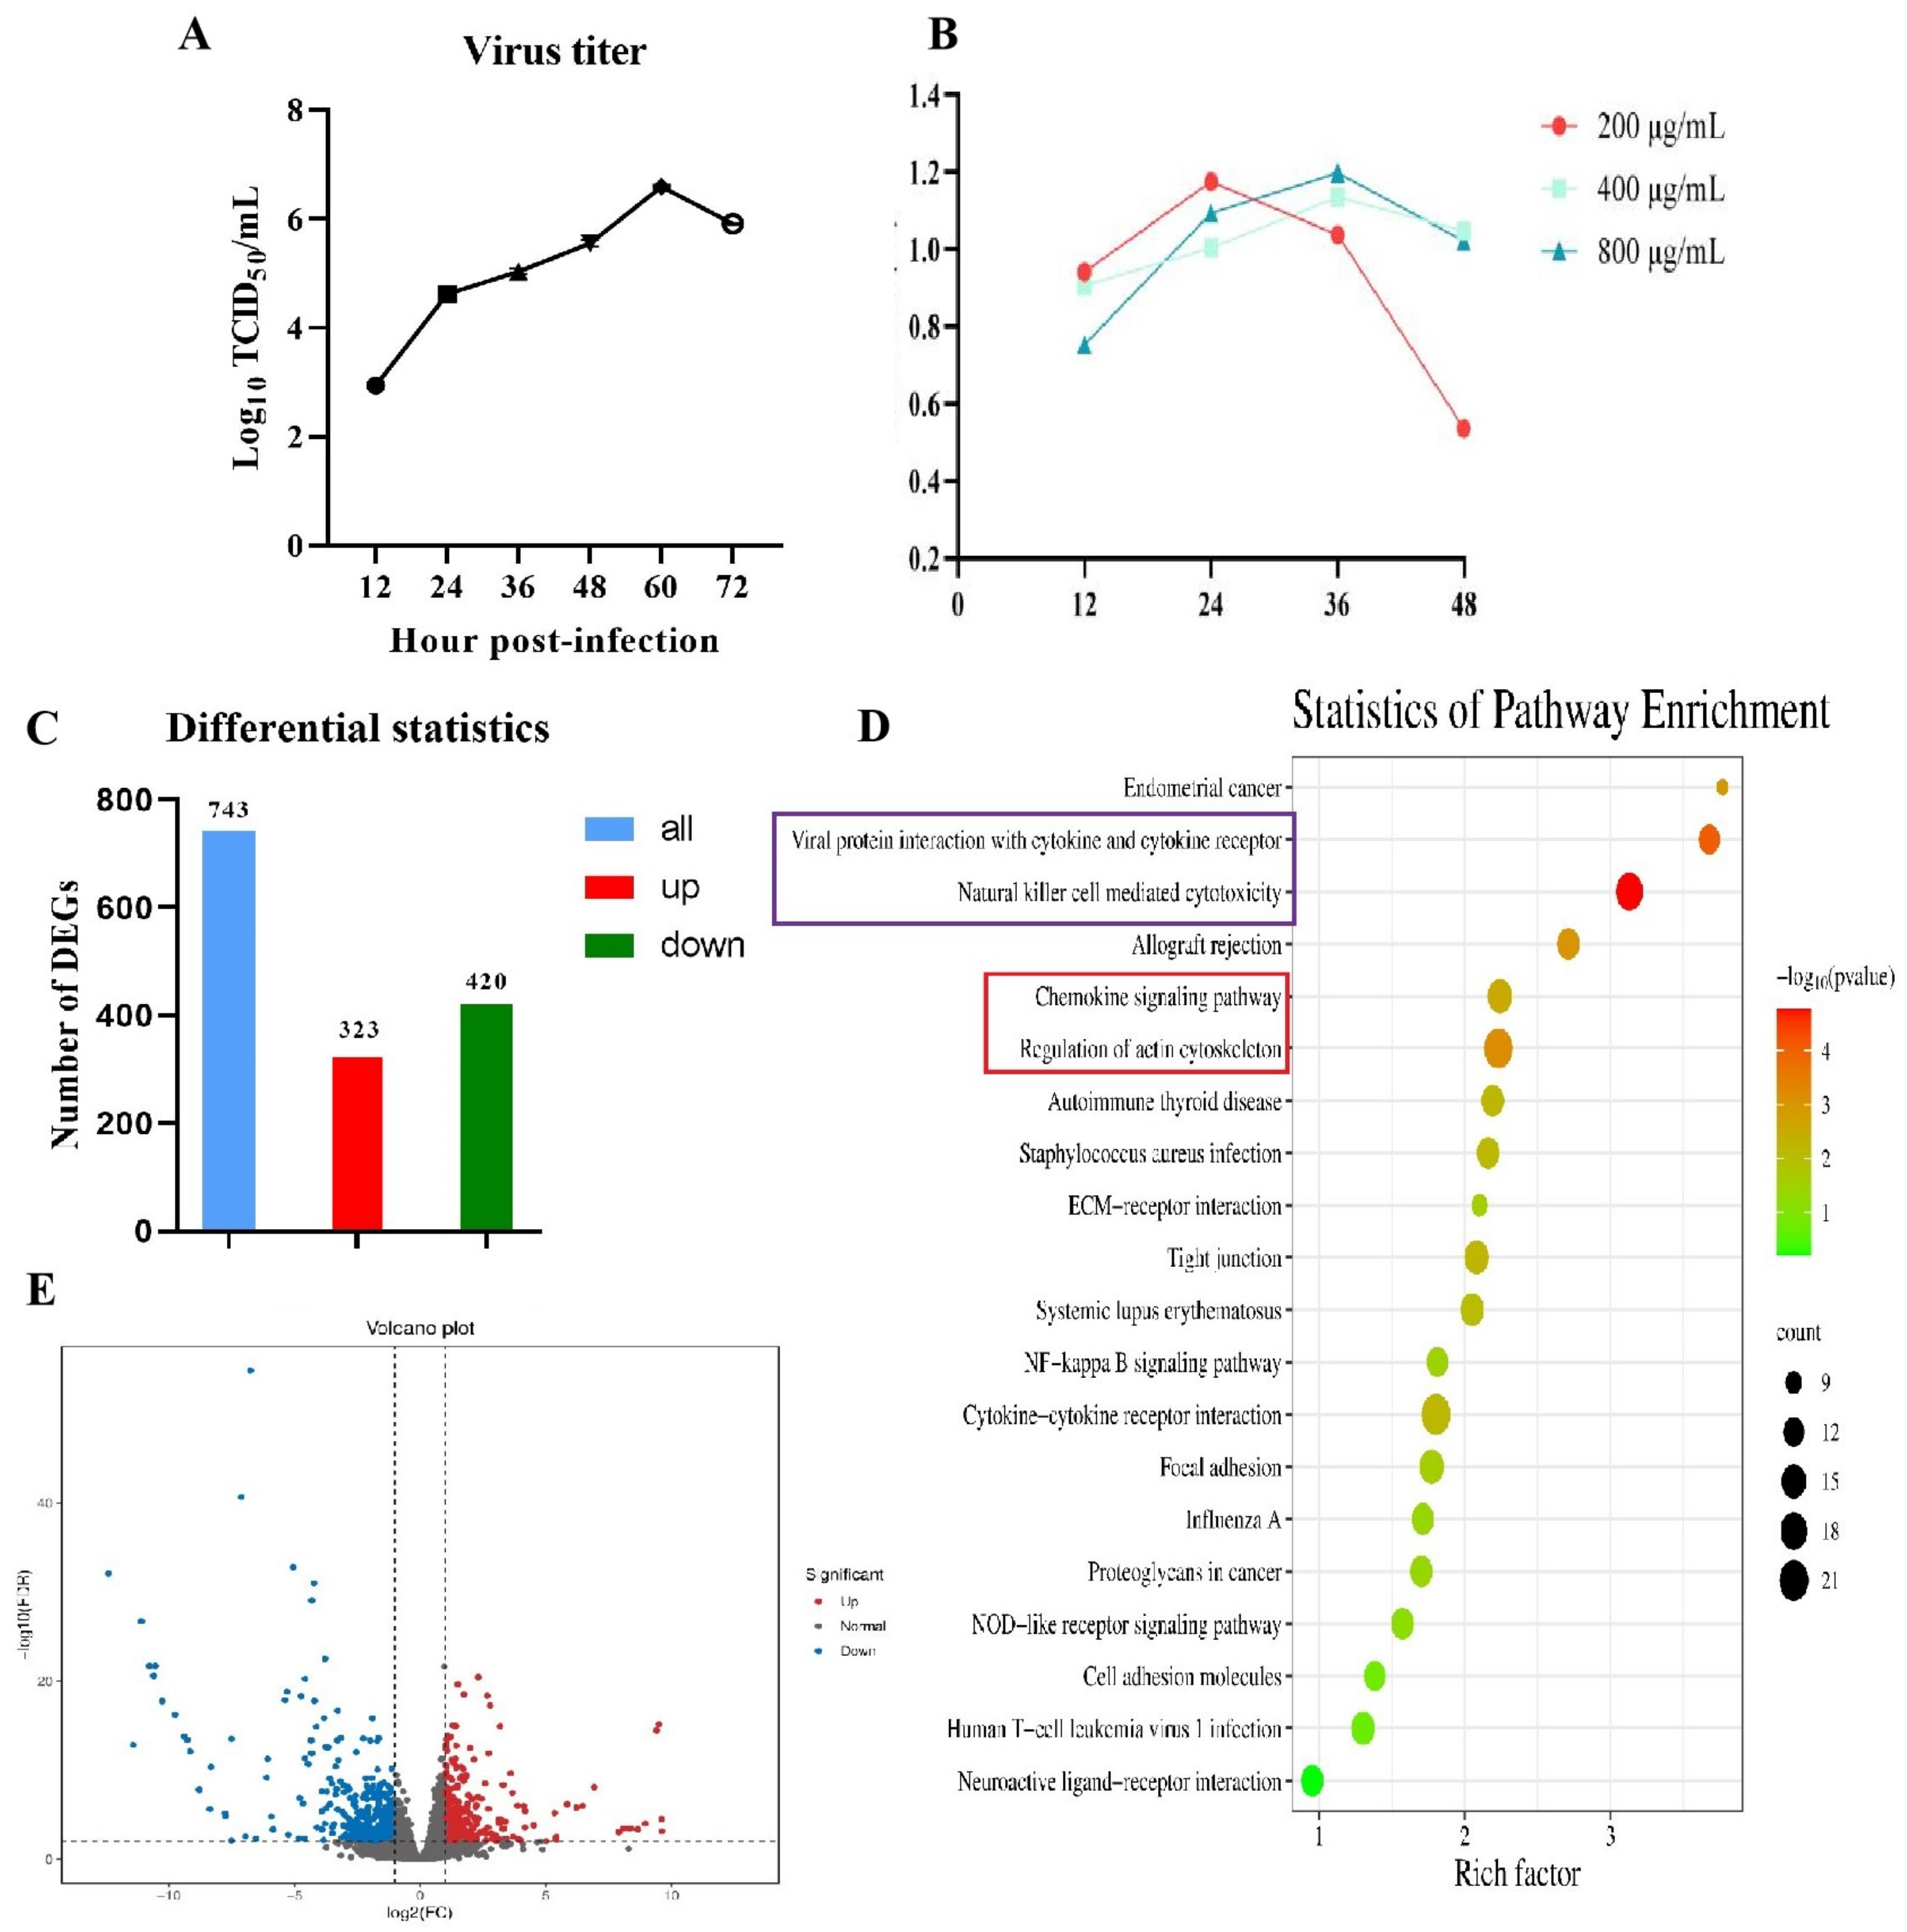
3.1. Cultivation and Identification of PRRSV in PEECs
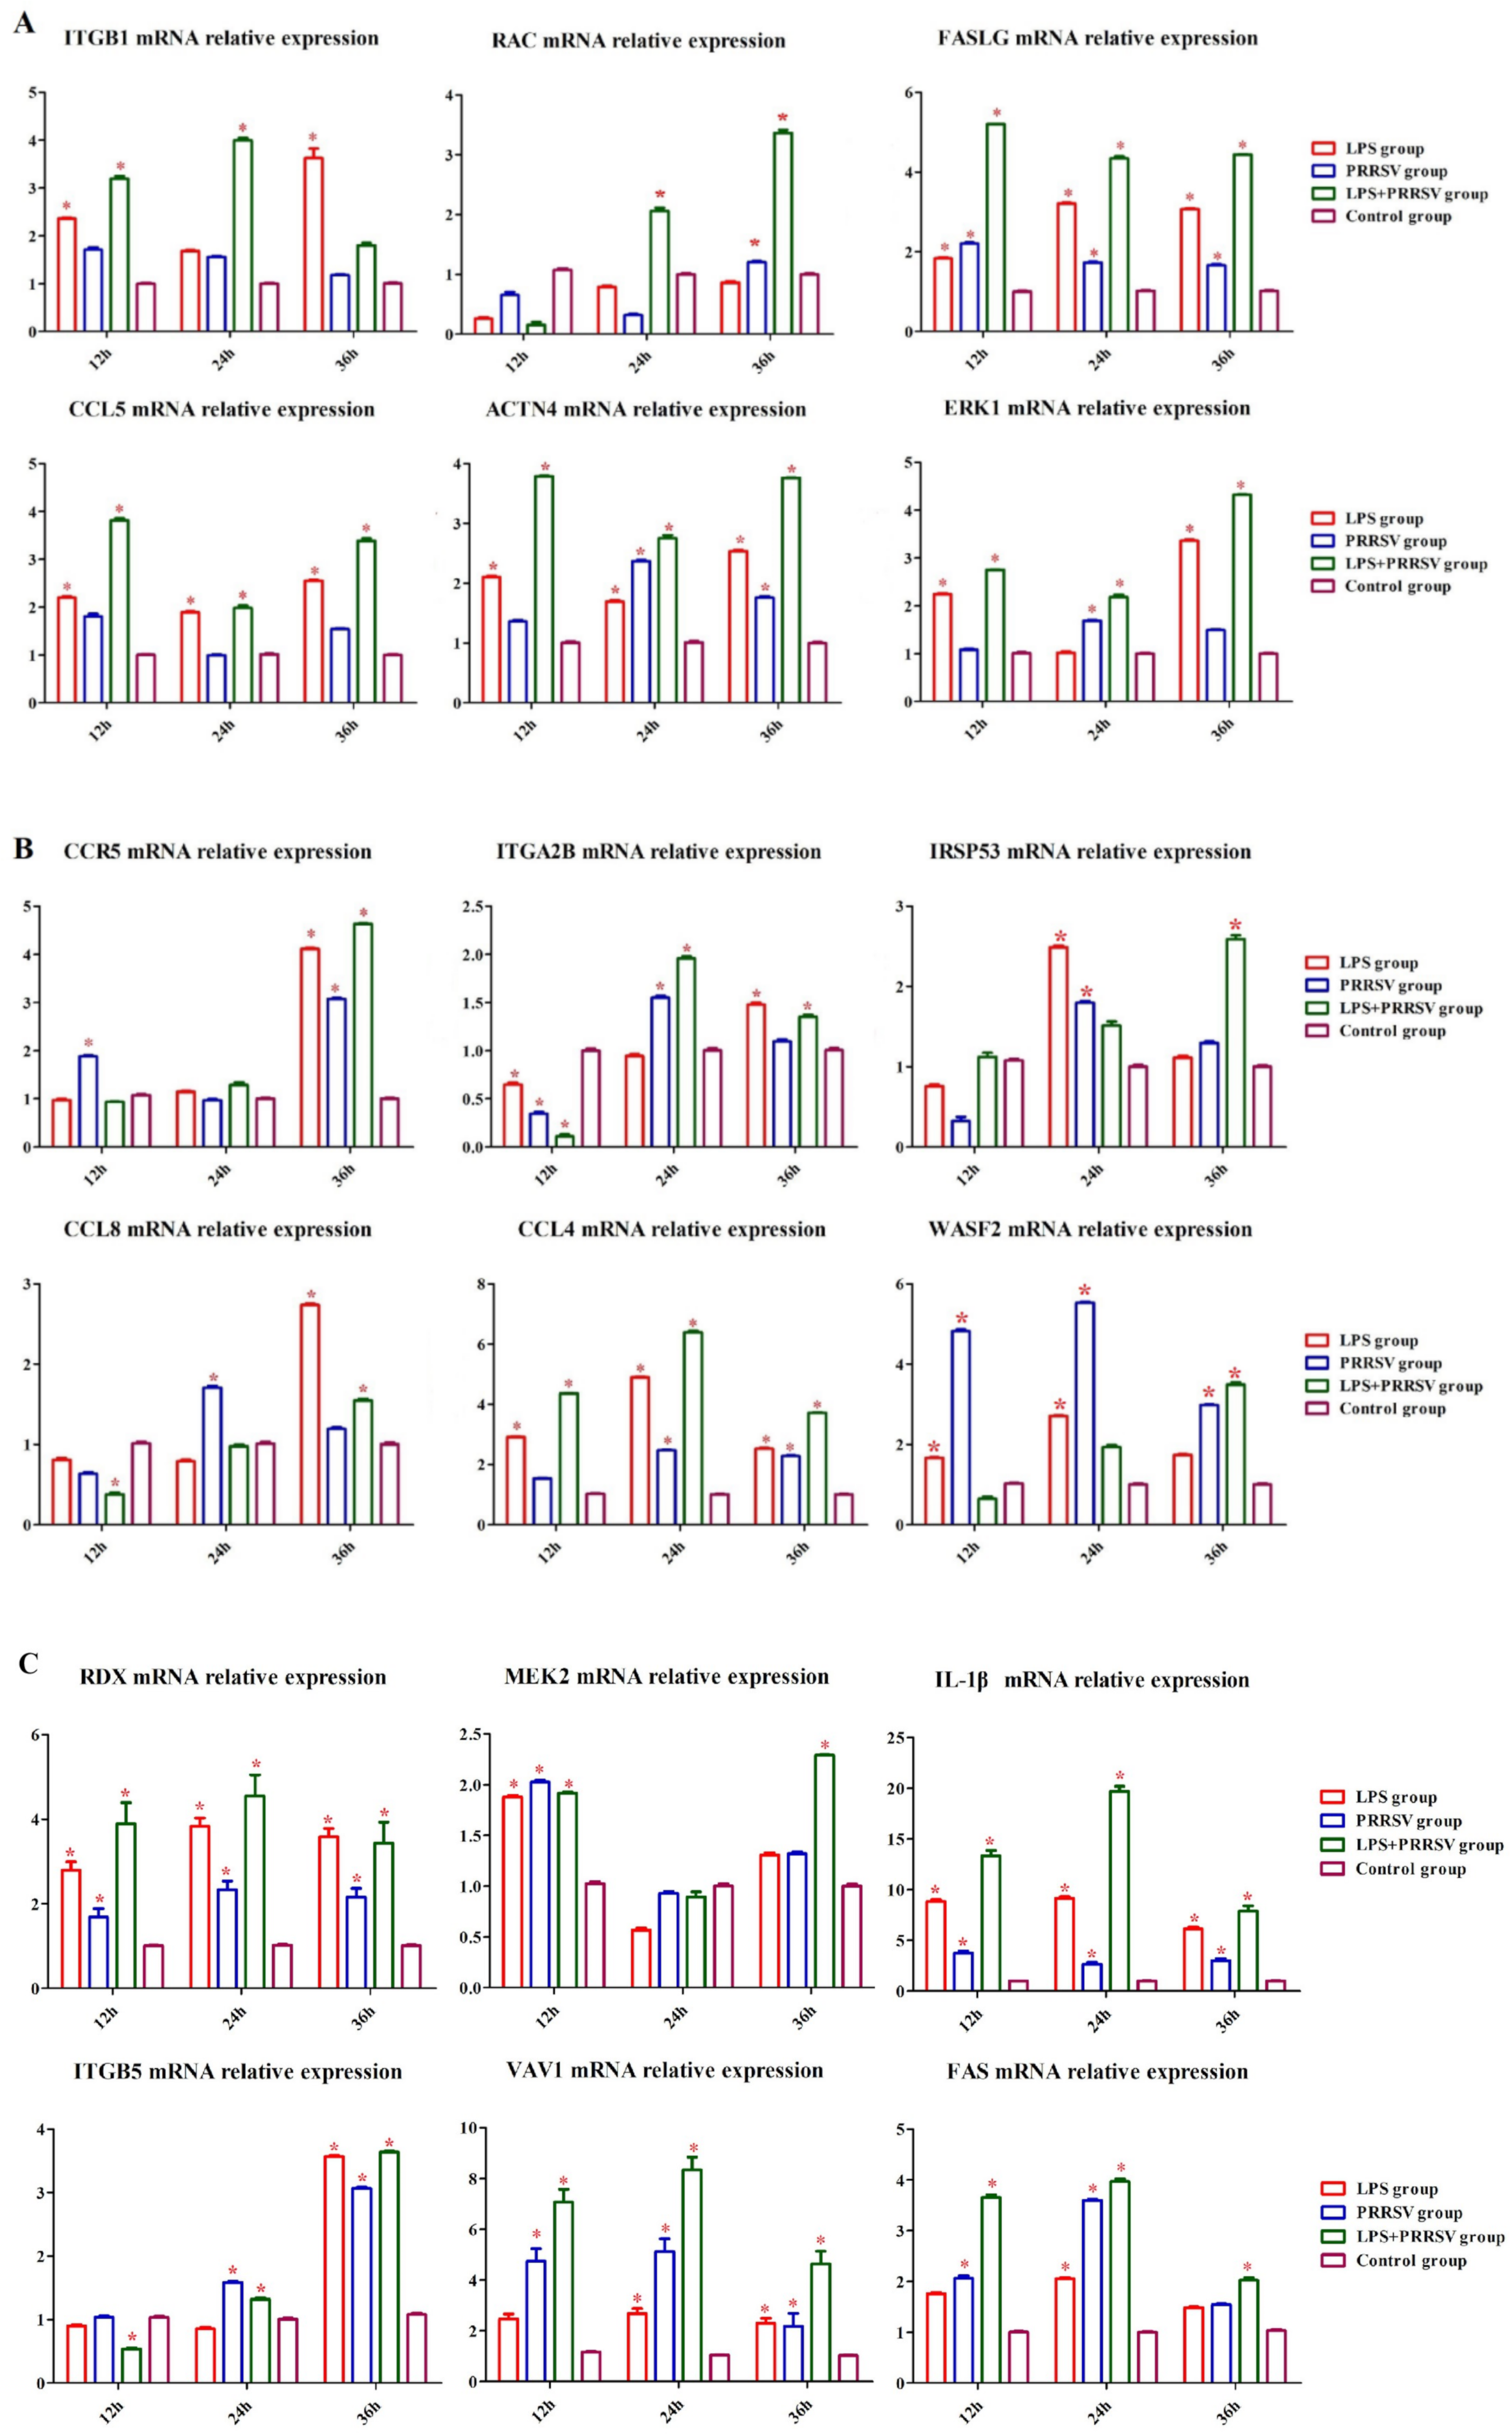
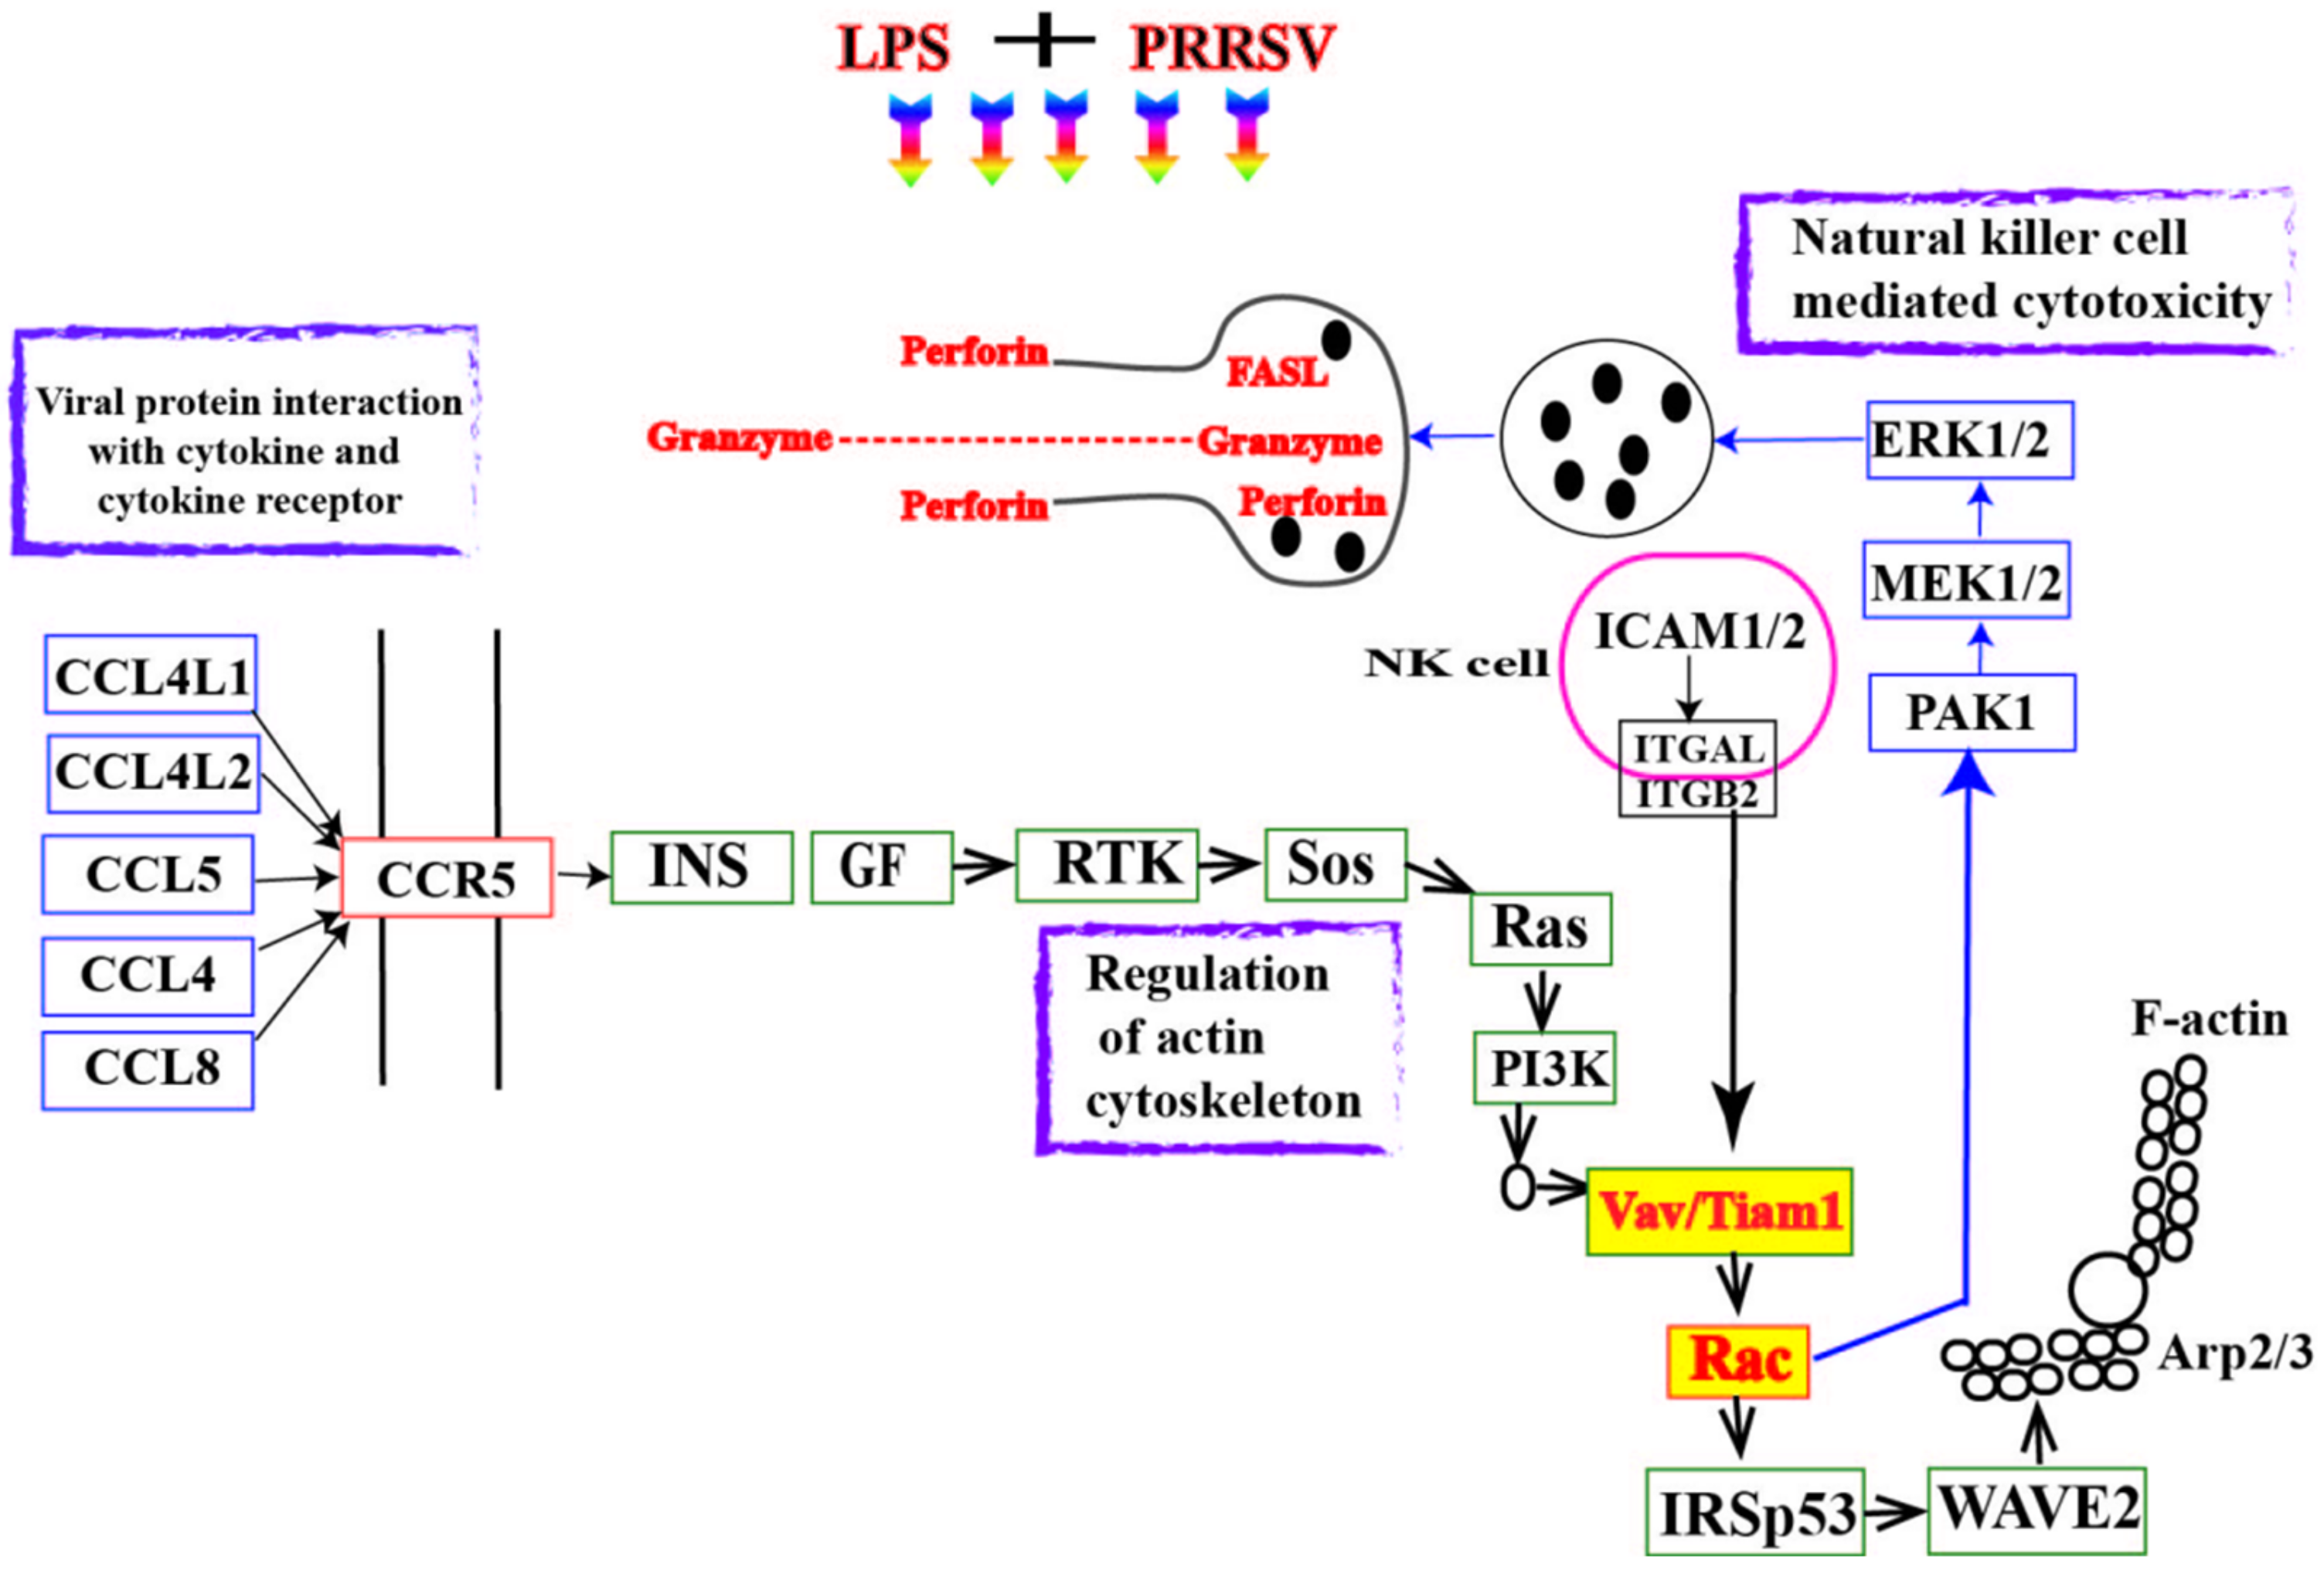
3.2. RNA-Seq Analysis of PEECs in PRRSV + LPS, LPS, and PRRSV Groups
3.3. Infection of PRRSV and LPS in Porcine Uterine Epithelial Cells
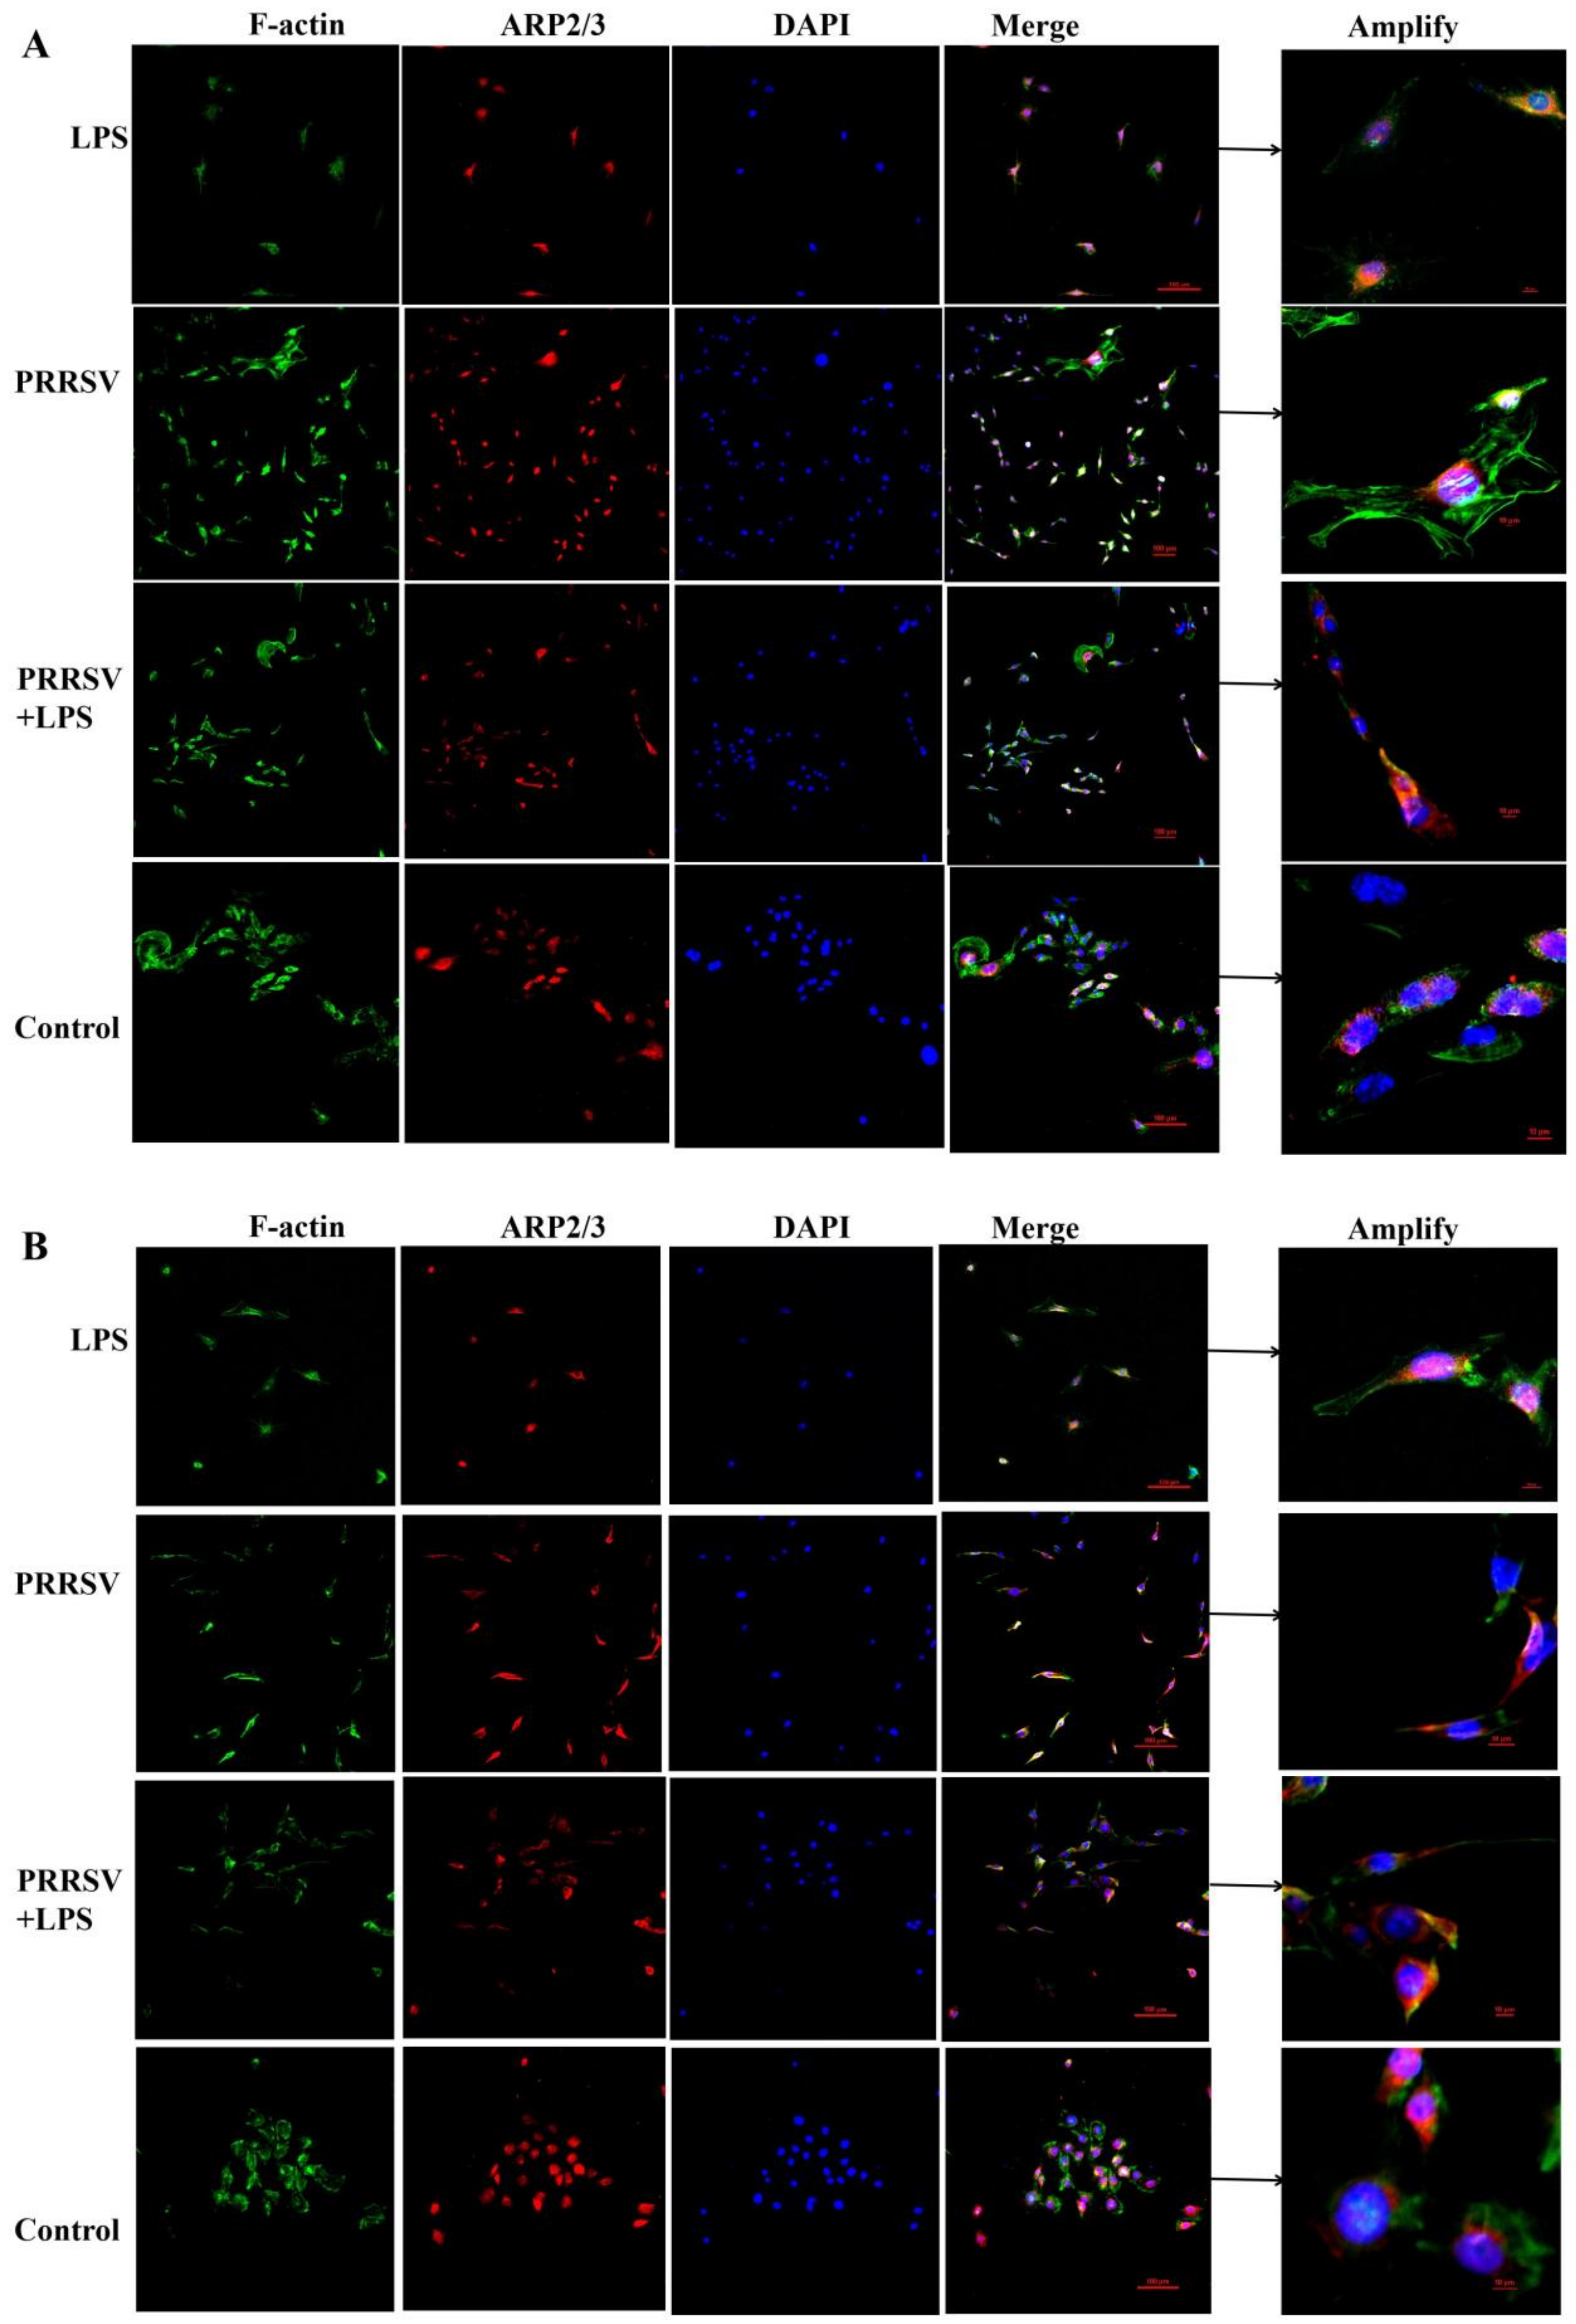
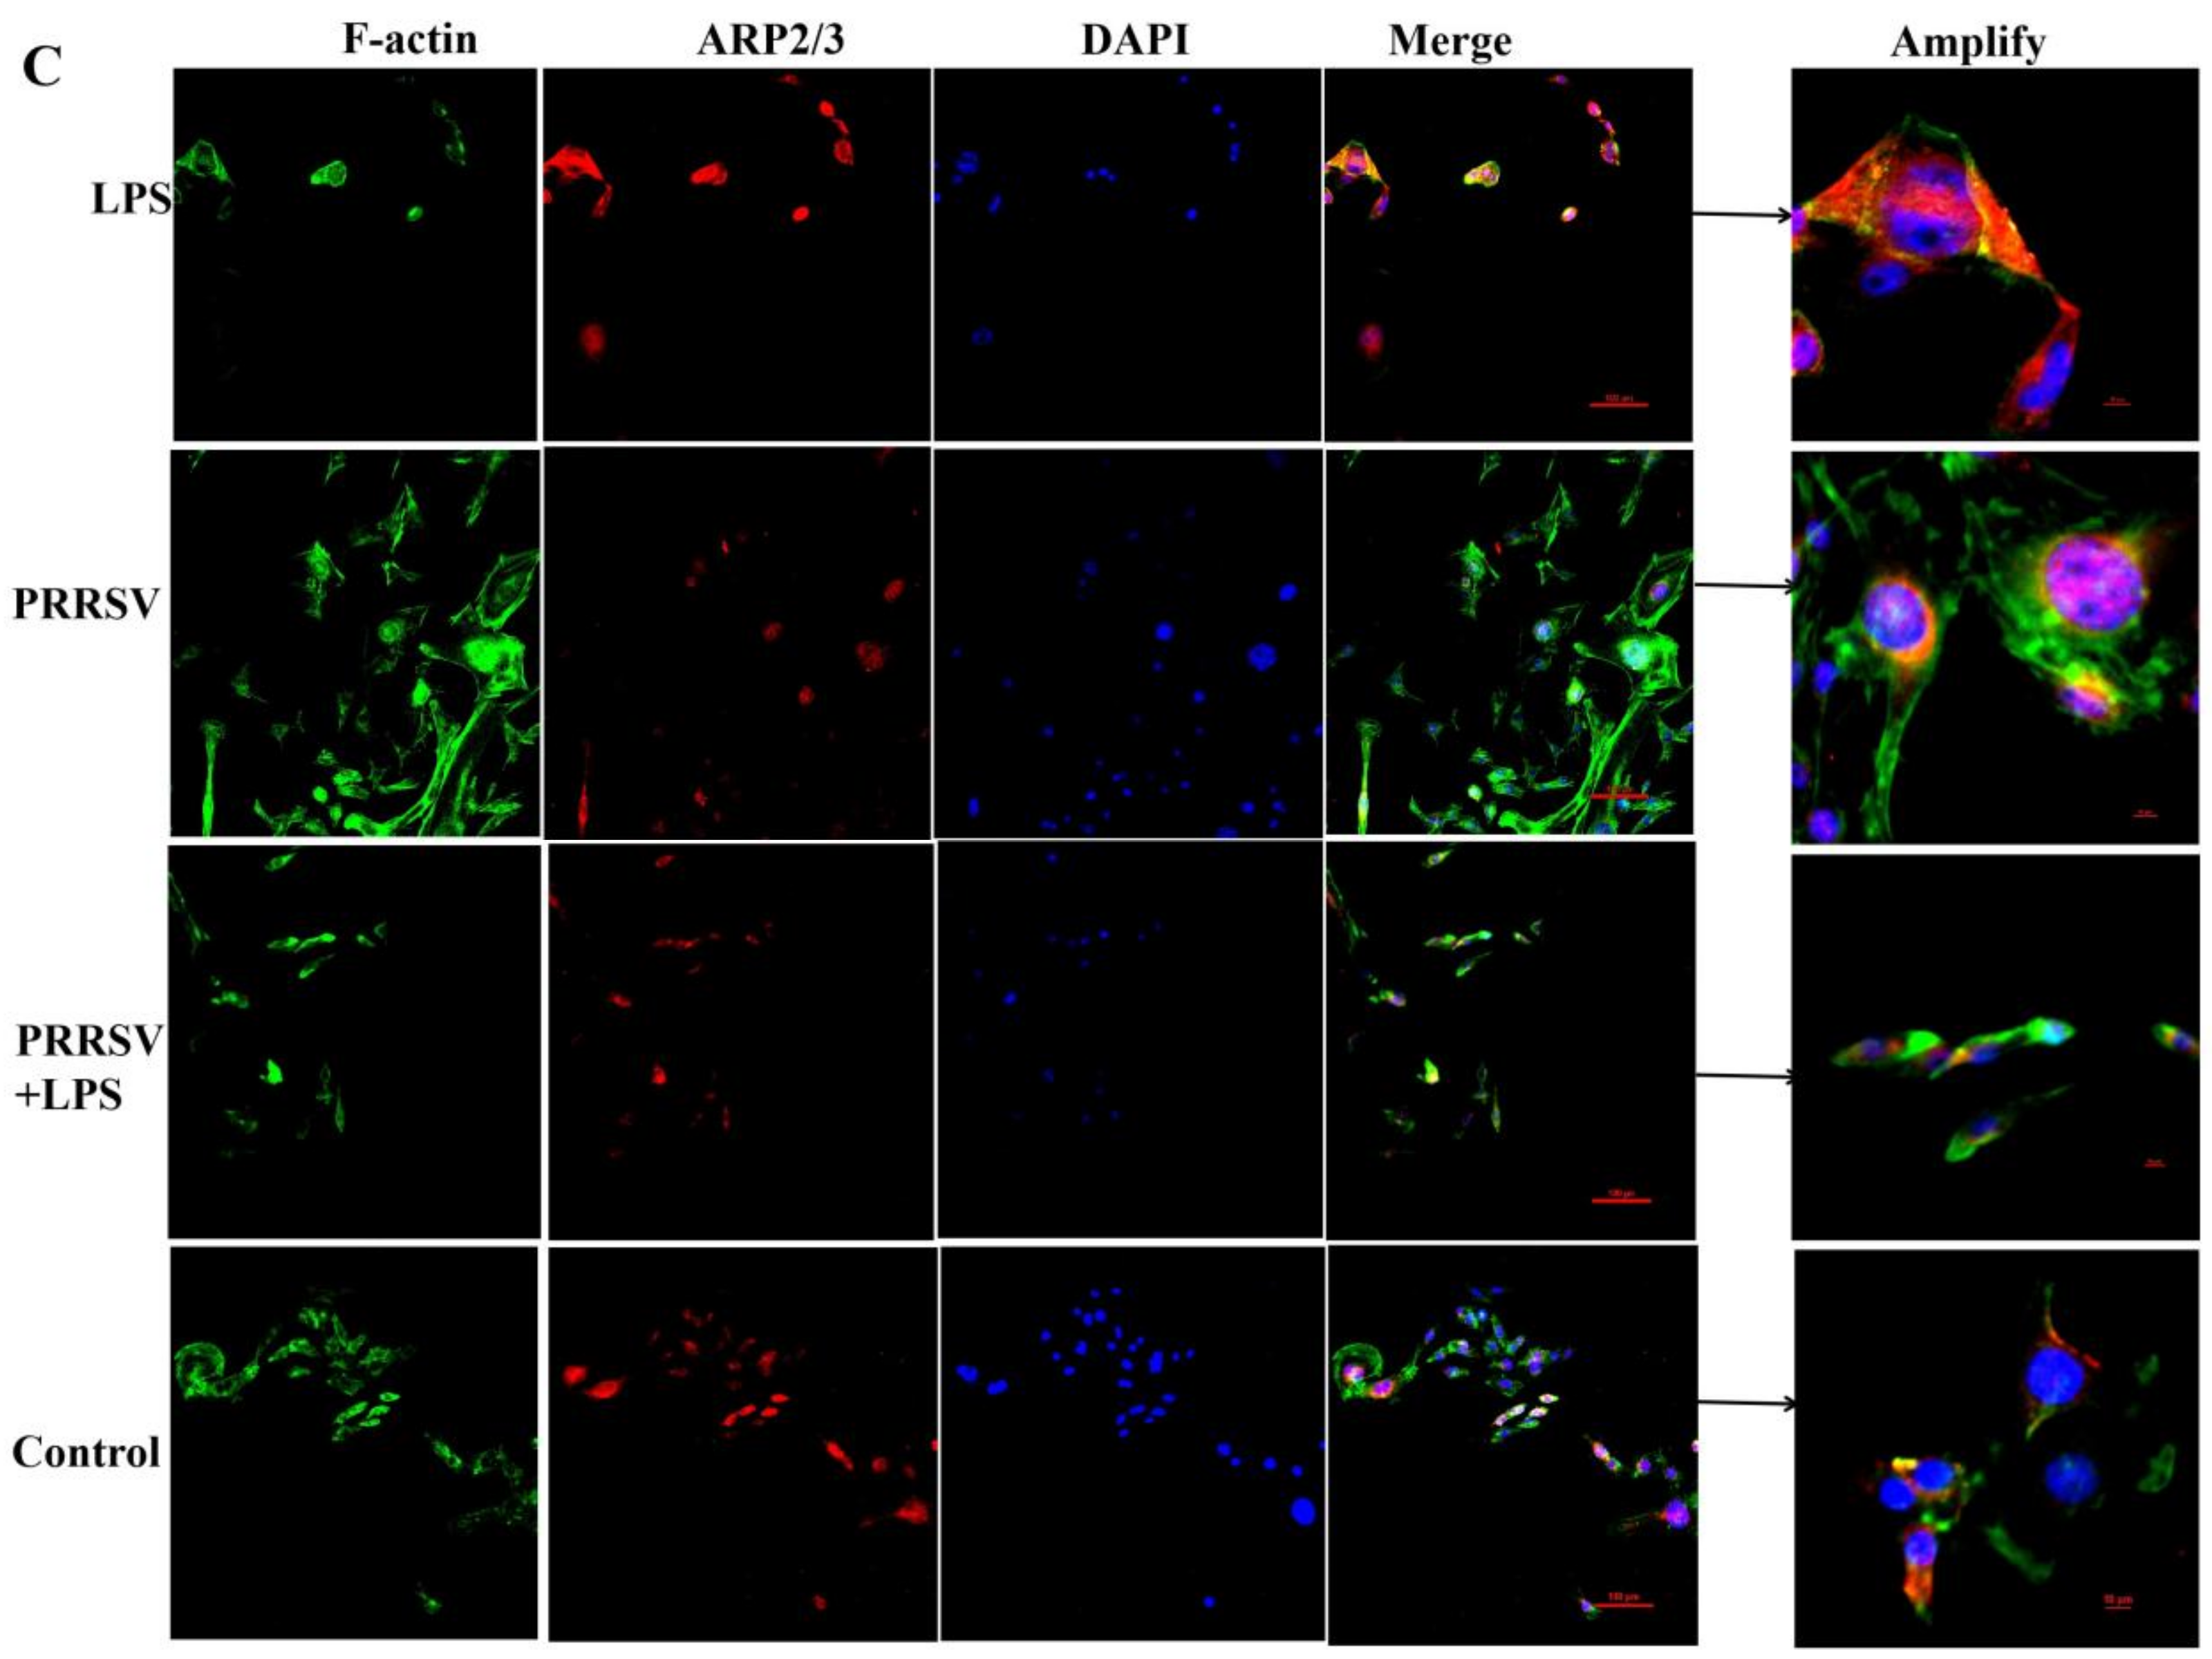
3.4. The Effects of LPS and PRRSV on the Cytoskeletal Structure of PEECs
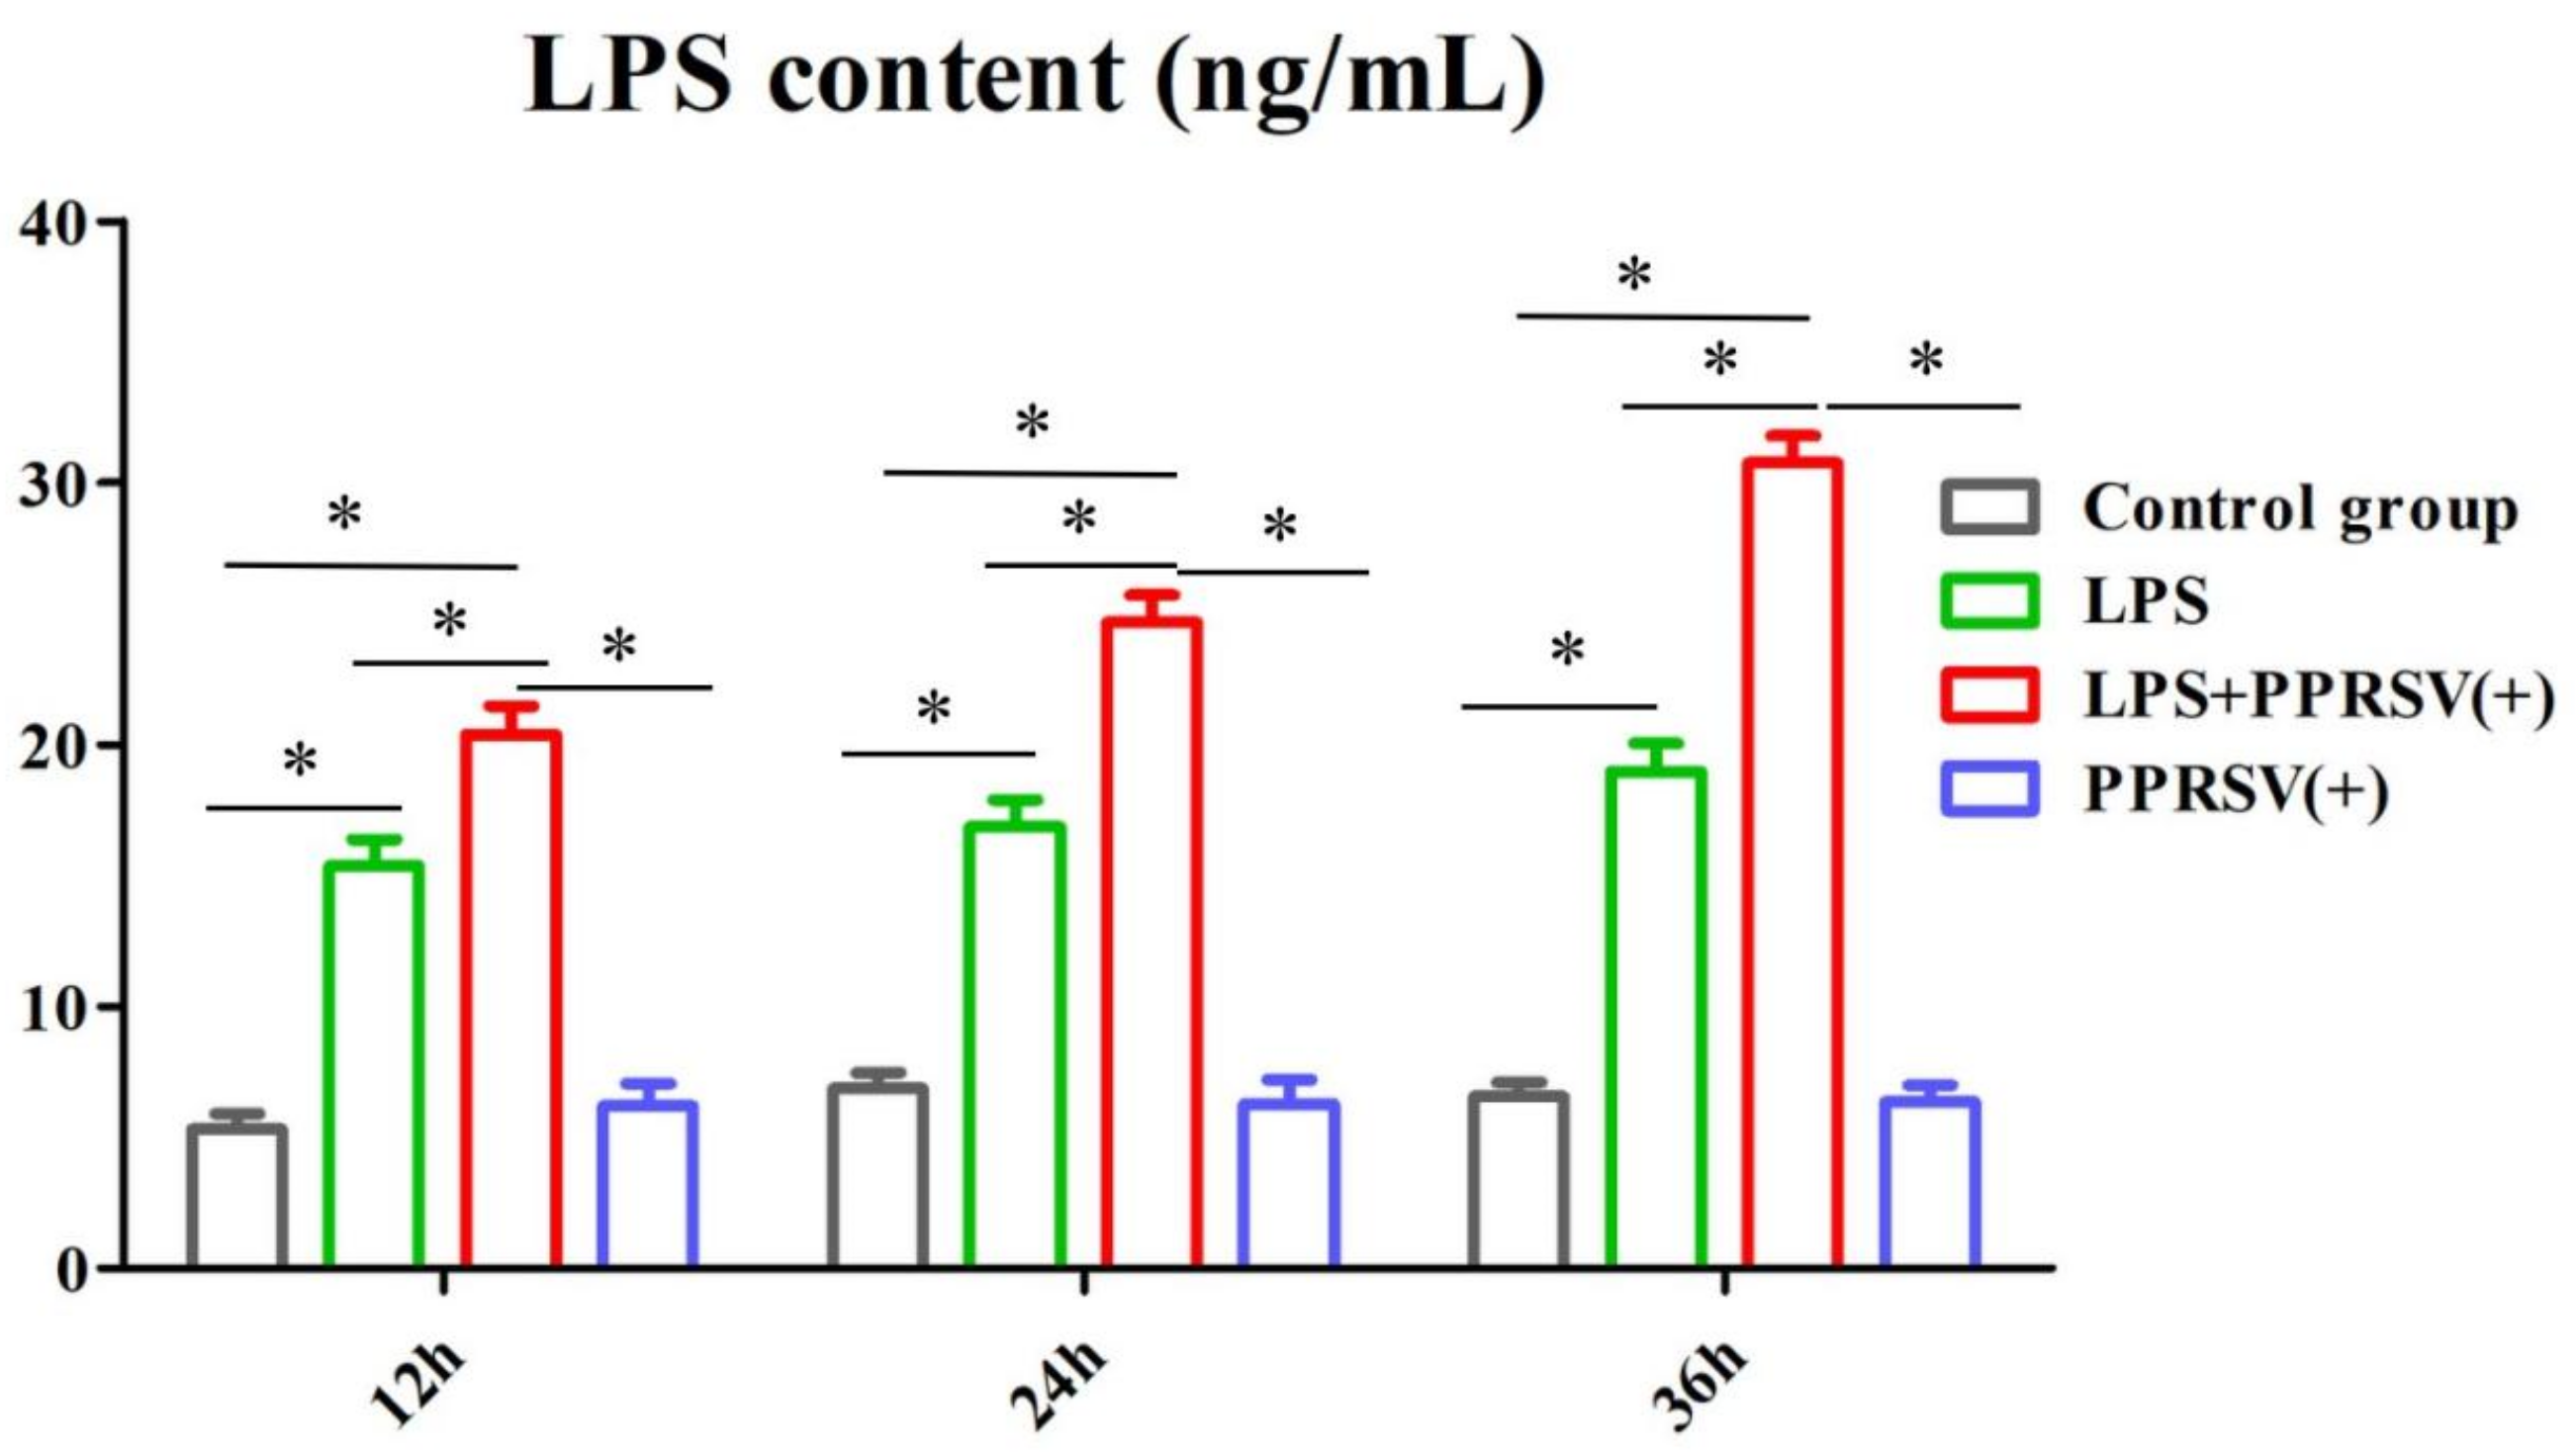
3.5. The LPS Level in Porcine Uterine Epithelial Cells
4. Discussion
Author Contributions
Funding
Institutional Review Board Statement
Informed Consent Statement
Data Availability Statement
Conflicts of Interest
References
- Romeo, C.; Parisio, G.; Scali, F.; Tonni, M.; Santucci, G.; Maisano, A.M.; Barbieri, I.; Boniotti, M.B.; Stadejek, T.; Alborali, G.L. Complex interplay between PRRSV-1 genetic diversity, coinfections and antimicrobial use influences performance parameters in post-weaning pigs. Vet. Microbiol. 2023, 284, 109–130. [Google Scholar] [CrossRef]
- Callens, B.; Persoons, D.; Maes, D.; Laanen, M.; Postma, M.; Boyen, F.; Haesebrouck, F.; Butaye, P.; Catry, B.; Dewulf, J. Prophylactic and metaphylactic antimicrobial use in Belgian fattening pig herds. Prev. Vet. Med. 2012, 106, 53–62. [Google Scholar] [CrossRef]
- Wills, R.W.; Gray, J.T.; Fedorka-Cray, P.J.; Yoon, K.J.; Ladely, S.; Zimmerman, J.J. Synergism between porcine reproductive and respiratory syndrome virus (PRRSV) and Salmonella choleraesuis in swine. Vet. Microbiol. 2000, 71, 177–192. [Google Scholar] [CrossRef]
- Zhao, G.; Zhang, L.; Li, C.; Zhao, J.; Liu, N.; Li, Y.; Wang, J.; Liu, L. Identification of enterobacteria in viscera of pigs afflicted with porcine reproductive and respiratory syndrome and other viral co-infections. Microb. Pathog. 2020, 147, 104–123. [Google Scholar] [CrossRef]
- Li, Y.; Li, X.; Gong, S.; Ao, Y.; Zhu, L.; Xu, Z. Etiology analysis of the bacterial secondary infection of PRRSV in Sichuan Province from 2013 to 2016. Acta Agric. Zhejiang 2017, 9, 1437–1444. [Google Scholar]
- Liu, X.; Guo, C.; Huang, Y.; Zhang, X.; Chen, Y. Inhibition of porcine reproductive and respiratory syndrome virus by Cecropin D in vitro. Infect. Genet. Evol. 2015, 34, 7–16. [Google Scholar] [CrossRef]
- Deaton, M.K.; Spear, A.; Faaberg, K.S.; Pegan, S.D. The vOTU domain of highlypathogenic porcine reproductive and respiratory syndrome virus displays a differential substrate preference. Virology 2014, 21, 454–455. [Google Scholar]
- Liu, X.; Xu, Z.; Zhu, L.; Liao, S.; Guo, W. Transcriptome analysis of porcine thymus following porcine cytomegalovirus infection. PLoS ONE 2014, 9, e113921. [Google Scholar] [CrossRef]
- Fablet, C.; Marois, C.; Dorenlor, V.; Eono, F.; Eveno, E.; Jolly, J.P.; Le Devendec, L.; Kobisch, M.; Madec, F.; Rose, N. Bacterial pathogens associated with lung lesions in slaughter pigs from 125 herds. Res. Vet. Sci. 2012, 93, 627–630. [Google Scholar] [CrossRef]
- Bordet, E.; Maisonnasse, P.; Renson, P.; Bouguyon, E.; Crisci, E.; Tiret, M.; Descamps, D.; Bernelin-Cottet, C.; Urien, C.; Lefèvre, F.; et al. Porcine alveolar macrophage-like cells are pro-infammatory pulmonary intravascular macrophages that produce large titers of porcine reproductive and respiratory syndrome virus. Sci. Rep. 2018, 8, 101–172. [Google Scholar] [CrossRef]
- Van Gucht, S.; Van Reeth, K.; Pensaert, M. Interaction between Porcine Reproductive-Respiratory Syndrome Virus and Bacterial Endotoxin in the Lungs of Pigs: Potentiation of Cytokine Production and Respiratory Disease. J. Clin. Microbiol. 2003, 8, 960–966. [Google Scholar] [CrossRef]
- Brockmeier, S.L.; Palmer, M.V.; Bolin, S.R. Effects of intranasal inoculation of porcine reproductive and respiratory syndrome virus, Bordetella bronchiseptica, or a combination of both organisms in pigs. Am. J. Vet. Res. 2000, 61, 892–899. [Google Scholar] [CrossRef]
- Labarque, G.; Van Reeth, K.; Van Gucht, S.; Nauwynck, H.; Pensaert, M. Porcine reproductive-respiratory syndrome virus (PRRSV) infection predisposes pigs for respiratory signs upon exposure to bacterial lipopolysaccharide. Vet. Microbiol. 2002, 88, 1–12. [Google Scholar] [CrossRef]
- Murtaugh, M.P.; Baarsch, M.J.; Zhou, Y.; Scamurra, R.W.; Lin, G. Inflammatory cytokines in animal health and disease. Vet. Immunol. Immunopathol. 1996, 54, 45–55. [Google Scholar] [CrossRef]
- Van Gucht, S.; Labarque, G.; Van Reeth, K. he combination of PRRS virus and bacterial endotoxin as a model for multifactorial respiratory disease in pigs. Vet. Immunol. Immunopathol. 2004, 102, 165–178. [Google Scholar] [CrossRef]
- Van Reeth, K.; Nauwynck, H.J.; Pensaert, M.B. Broncho-alveolar interferon-a, tumor necrosis factor-a, interleukin-1 and inflammation during acute influenza in pigs: A possible model for humans? J. Infect. Dis. 1998, 177, 1076–1079. [Google Scholar] [CrossRef]
- Qiao, S.; Feng, L.; Bao, D.; Guo, J.; Wan, B.; Xiao, Z.; Zhang, G. Porcine reproductive and respiratory syndrome virus and bacterial endotoxin act in synergy to amplify the inflammatory response of infected macrophages. Vet. Microbiol. 2011, 149, 213–220. [Google Scholar] [CrossRef]
- Chen, C.; Cui, S.; Zhang, C.; Li, J.; Wang, J. Development and validation of reverse transcription loop-mediated isothermal amplification for detection of PRRSV. Virus Genes 2010, 40, 76–83. [Google Scholar] [CrossRef]
- Labarque, G.; Van Gucht, S.; Van Reeth, K.; Nauwynck, H.; Pensaert, M. Respiratory tract protection upon challenge of pigs vaccinated with attenuated porcine reproductive and respiratory syndrome virus vaccines. Vet. Microbiol. 2003, 95, 187–197. [Google Scholar] [CrossRef]
- Forsberg, R.; Storgaard, T.; Nielsen, H.S.; Oleksiewicz, M.B.; Cordioli, P.; Sala, G.; Hein, J.; Bøtner, A. The genetic diversity of European type PRRSV is similar to that of the North American type but is geographically skewed within Europe. Virology 2002, 299, 38–47. [Google Scholar] [CrossRef]
- Almeida, M.N.; Zhang, M.; Zimmerman, J.J.; Holtkamp, D.J.; Linhares, D.C.L. Finding PRRSV in sow herds: Family oral fluids vs. serum samples from due-to-wean pigs. Prev. Vet. Med. 2021, 193, 105–117. [Google Scholar] [CrossRef]
- Biernacka, K.; Karbowiak, P.; Wrobel, P.; Charęza, T.; Czopowicz, M.; Balka, G.; Goodell, C.; Rauh, R.; Stadejek, T. Detection of porcine reproductive and respiratory syndrome virus (PRRSV) and influenza a virus (IAV) in oral fluid of pigs. Res. Vet. Sci. 2016, 109, 74–80. [Google Scholar] [CrossRef]
- Decorte, I.; Van Breedam, W.; Van der Stede, Y.; Nauwynck, H.J.; De Regge, N.; Cay, A.B. Detection of total and PRRSV-specific antibodies in oral fluids collected with different rope types from PRRSV-vaccinated and experimentally infected pigs. BMC Vet. Res. 2014, 10, 134–145. [Google Scholar] [CrossRef]
- Henao-Diaz, A.; Gim’enez-Lirola, L.; Baum, D.H.; Zimmerman, J. Guidelines for oral fluid-based surveillance of viral pathogens in swine. Porc. Health Manag. 2020, 6, 12–21. [Google Scholar] [CrossRef]
- Ramirez, A.; Wang, C.; Prickett, J.R.; Pogranichniy, R.; Yoon, K.J.; Main, R.; Johnson, J.K.; Rademacher, C.; Hoogland, M.; Hoffmann, P.; et al. Efficient surveillance of pig populations using oral fluids. Prev. Vet. Med. 2012, 104, 292–300. [Google Scholar] [CrossRef]
- Torremorell, M.; Moore, C.; Christianson, W. Establishment of a herd negative for porcine reproductive and respiratory syndrome virus (PRRSV) from PRRSV-positive sources. J. Swine Health Prod. 2002, 10, 153–160. [Google Scholar] [CrossRef]
- Ge, S.Q.; Li, J.M.; Fan, X.X.; Liu, F.X.; Li, L.; Wang, Q.H.; Ren, W.J.; Bao, J.Y.; Liu, C.J.; Wang, H. Molecular Characterization of African Swine Fever Virus, China. Emerg. Infect. Dis. 2018, 24, 2131–2133. [Google Scholar] [CrossRef]
- Michel, O.; Nagy, A.; Schroeven, M.; Duchateau, J.; Neve, J.; Fondu, P.; Sergysels, R. Dose-response relationship to inhaled endotoxin in normal subjects. Am. J. Respir. Crit. Care Med. 1997, 156, 1157–1164. [Google Scholar] [CrossRef]


| Item | GenBank Accession No. | Nucleotide Sequence of Primers (5′–3′) | Size, bp |
|---|---|---|---|
| ACTN1 | NM_001243061.1 | F: CGACCACTTGGCAGAGAAGT R: TTGCGGATGAGGGCTTTGAT | 132 |
| ITGB1 | NM_213968.1 | F: TACGTTGAAATTCAAGCGGGC R: TCTGTTCCAAGGCTTTTCAC | 111 |
| ITGB5 | JF748726.1 | F: GACTGTCTGCTTATCCACCC R: CCATTCTTGACCAGGTTTGT | 110 |
| FASLG | NM_213806. | F: CTCAAGATCCATCCCTCTGG R: TCATCTTTCCCTCCATCAGC | 227 |
| RDX | NM_001009576.1 | F: AATTGTGGCTAGGCGTTGATG R: ATGGTGTCAGGCTTCCTTCTT | 256 |
| CCL4 | NM_213779.1 | F: GAAGCTTCCTCGCAACTTCG R: TTTGGTCTGGAATACCACGG | 82 |
| ITGA2B | NM_213998.1 | F: ACGCTTGGTTCAACGTCTCT R: CGCTTGAAGAAGCCACACTTC | 205 |
| FAS | NM_213839.1 | F: AGACGGACACGGTTAAGAGT R: GAGGCAGTGATTGTGACATTG | 216 |
| CCL5 | NM_001129946.2 | F: CACACCCTGCTGTTTTTCC R: CCATTTCTTCTCTGGGTTGG | 151 |
| CCL8 | FJ156752.1 | F: CTGCTTCGGTCTGGTCAATG R: CTGGCTGTTGGTGATTCTTGT | 73 |
| CCR5 | NM_001001618.1 | F: CCAGGCAGAGGCTCCAGAT R: CACAAGCCGACAGAGATTTCC | 78 |
| PPBP | NM_213862.2 | F: TGCCATTGTCACTGCTCCT R: GATGAATGCCAGAGACGGTATT | 123 |
| MET | NM_001038008.1 | F: GAAGCCAAGGGTTAGCACAG R: GAGAGTTCTTTTGCAGAGCAGA | 244 |
| VCL | NM_213934.1 | F: CAGACCTGCTCCTCACCTTC R: TGCTGCCTCTCGTCAATCAT | 181 |
| Myd88 | EU056737.1 | F: CTGCTTCGGTCTGGTCAATG R: CTGGCTGTTGGTGATTCTTGT | 167 |
| Tak1 | KU504629.1 | F: TTCCTCCTCCTCTTCGTCTTC R: CTCCTCTTCCAACAACCTCCT | 116 |
| Ikka | NM_001005150.1 | F: GTGTCGCTCTTGTTGAAGTGT R: CTCTCCTCATCCTCGCTCTC | 167 |
| Erk2 | NM_001198922.1 | F: CACCTACTGCTTACCATTGCTT R: GATTGAGAAGGATGCGGATGAG | 226 |
| FN1 | XM_003133642.5 | F: CTACTATTACTGGTCTGGAA R: CACTCTTCTGATTGTTCTT | 75 |
| Vav1 | NM_001267833.1 | F: CCGAGAATGCCACTGCTAAC R: CGGCGATGTGTCTTATCCTTC | 226 |
| Rac1 | NM_001243585.1 | F: TCCCAACACTCCCATCATCC R: GGCACTTCCTCTTCCTCTTCT | 254 |
| MEK2 | NM_001244550.1 | F: AGGCTGCTTCTAAGGCTTCC R: TACCAGGCTCACTGCTCTTG | 156 |
| COL1A1 | XM_021067153.1 | F: AGCCCTGGTGAAAATGGAGC R: CACCCTTAGCACCAACAGCA | 190 |
| GAPDH | NM_001206359.1 | F: GGAGAACGGGAAGCTTGTCA R: GGTTCACGCCCATCACAAAC | 224 |
Disclaimer/Publisher’s Note: The statements, opinions and data contained in all publications are solely those of the individual author(s) and contributor(s) and not of MDPI and/or the editor(s). MDPI and/or the editor(s) disclaim responsibility for any injury to people or property resulting from any ideas, methods, instructions or products referred to in the content. |
© 2024 by the authors. Licensee MDPI, Basel, Switzerland. This article is an open access article distributed under the terms and conditions of the Creative Commons Attribution (CC BY) license (https://creativecommons.org/licenses/by/4.0/).
Share and Cite
Xing, S.; Yu, A.; Zhang, M.; Wu, C. The Mechanism of Bacterial Endotoxin Invasion Pathways in Porcine Reproductive and Respiratory Syndrome Virus-Positive Porcine Endometrial Epithelial Cells. Microbiol. Res. 2024, 15, 1924-1938. https://doi.org/10.3390/microbiolres15030129
Xing S, Yu A, Zhang M, Wu C. The Mechanism of Bacterial Endotoxin Invasion Pathways in Porcine Reproductive and Respiratory Syndrome Virus-Positive Porcine Endometrial Epithelial Cells. Microbiology Research. 2024; 15(3):1924-1938. https://doi.org/10.3390/microbiolres15030129
Chicago/Turabian StyleXing, Siyi, Aohang Yu, Mengran Zhang, and Chenchen Wu. 2024. "The Mechanism of Bacterial Endotoxin Invasion Pathways in Porcine Reproductive and Respiratory Syndrome Virus-Positive Porcine Endometrial Epithelial Cells" Microbiology Research 15, no. 3: 1924-1938. https://doi.org/10.3390/microbiolres15030129
APA StyleXing, S., Yu, A., Zhang, M., & Wu, C. (2024). The Mechanism of Bacterial Endotoxin Invasion Pathways in Porcine Reproductive and Respiratory Syndrome Virus-Positive Porcine Endometrial Epithelial Cells. Microbiology Research, 15(3), 1924-1938. https://doi.org/10.3390/microbiolres15030129