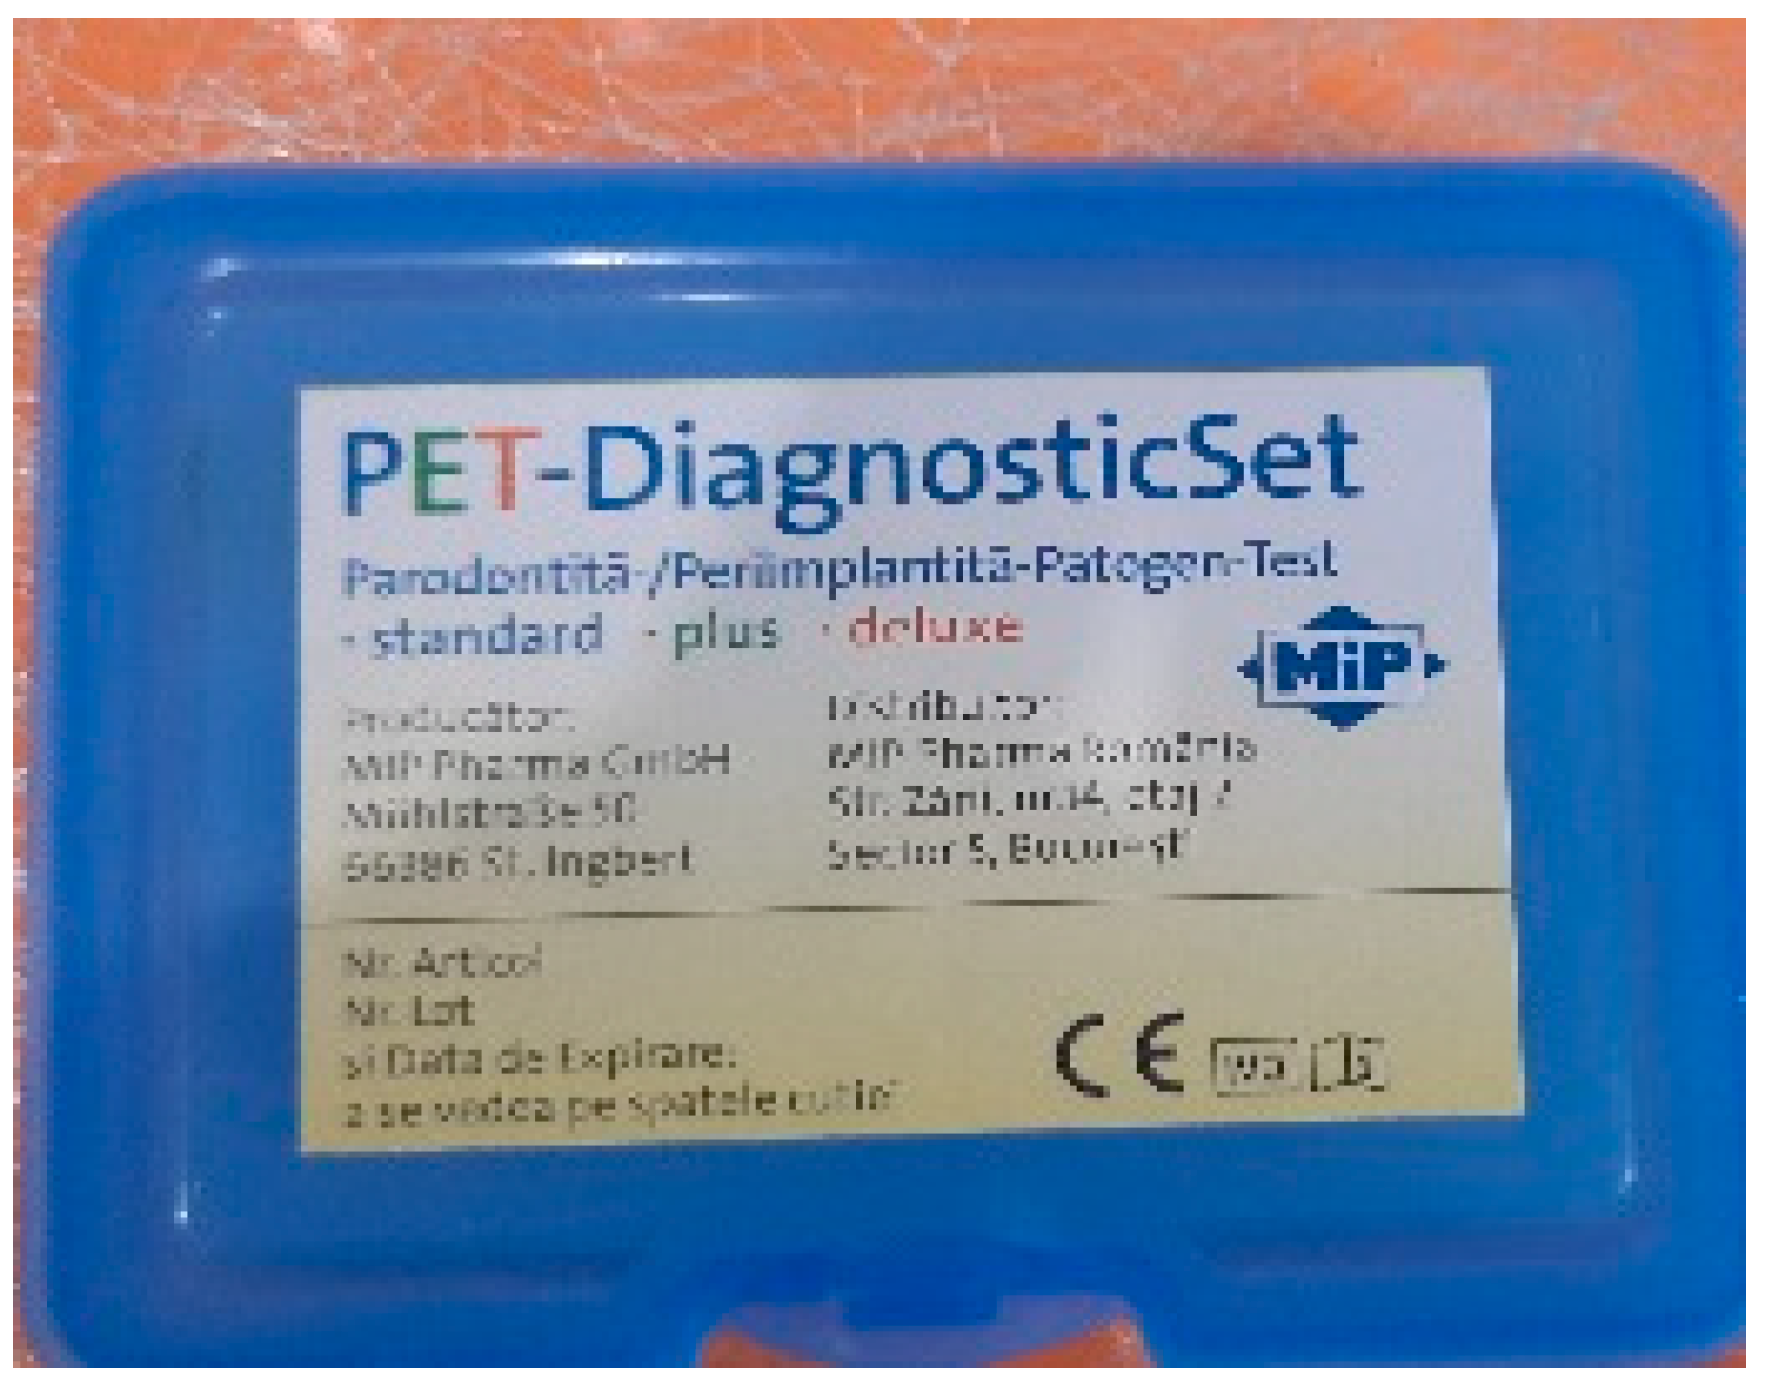
Figure 1.
Materials and tools needed for clinical examination.
Figure 1.
Materials and tools needed for clinical examination.
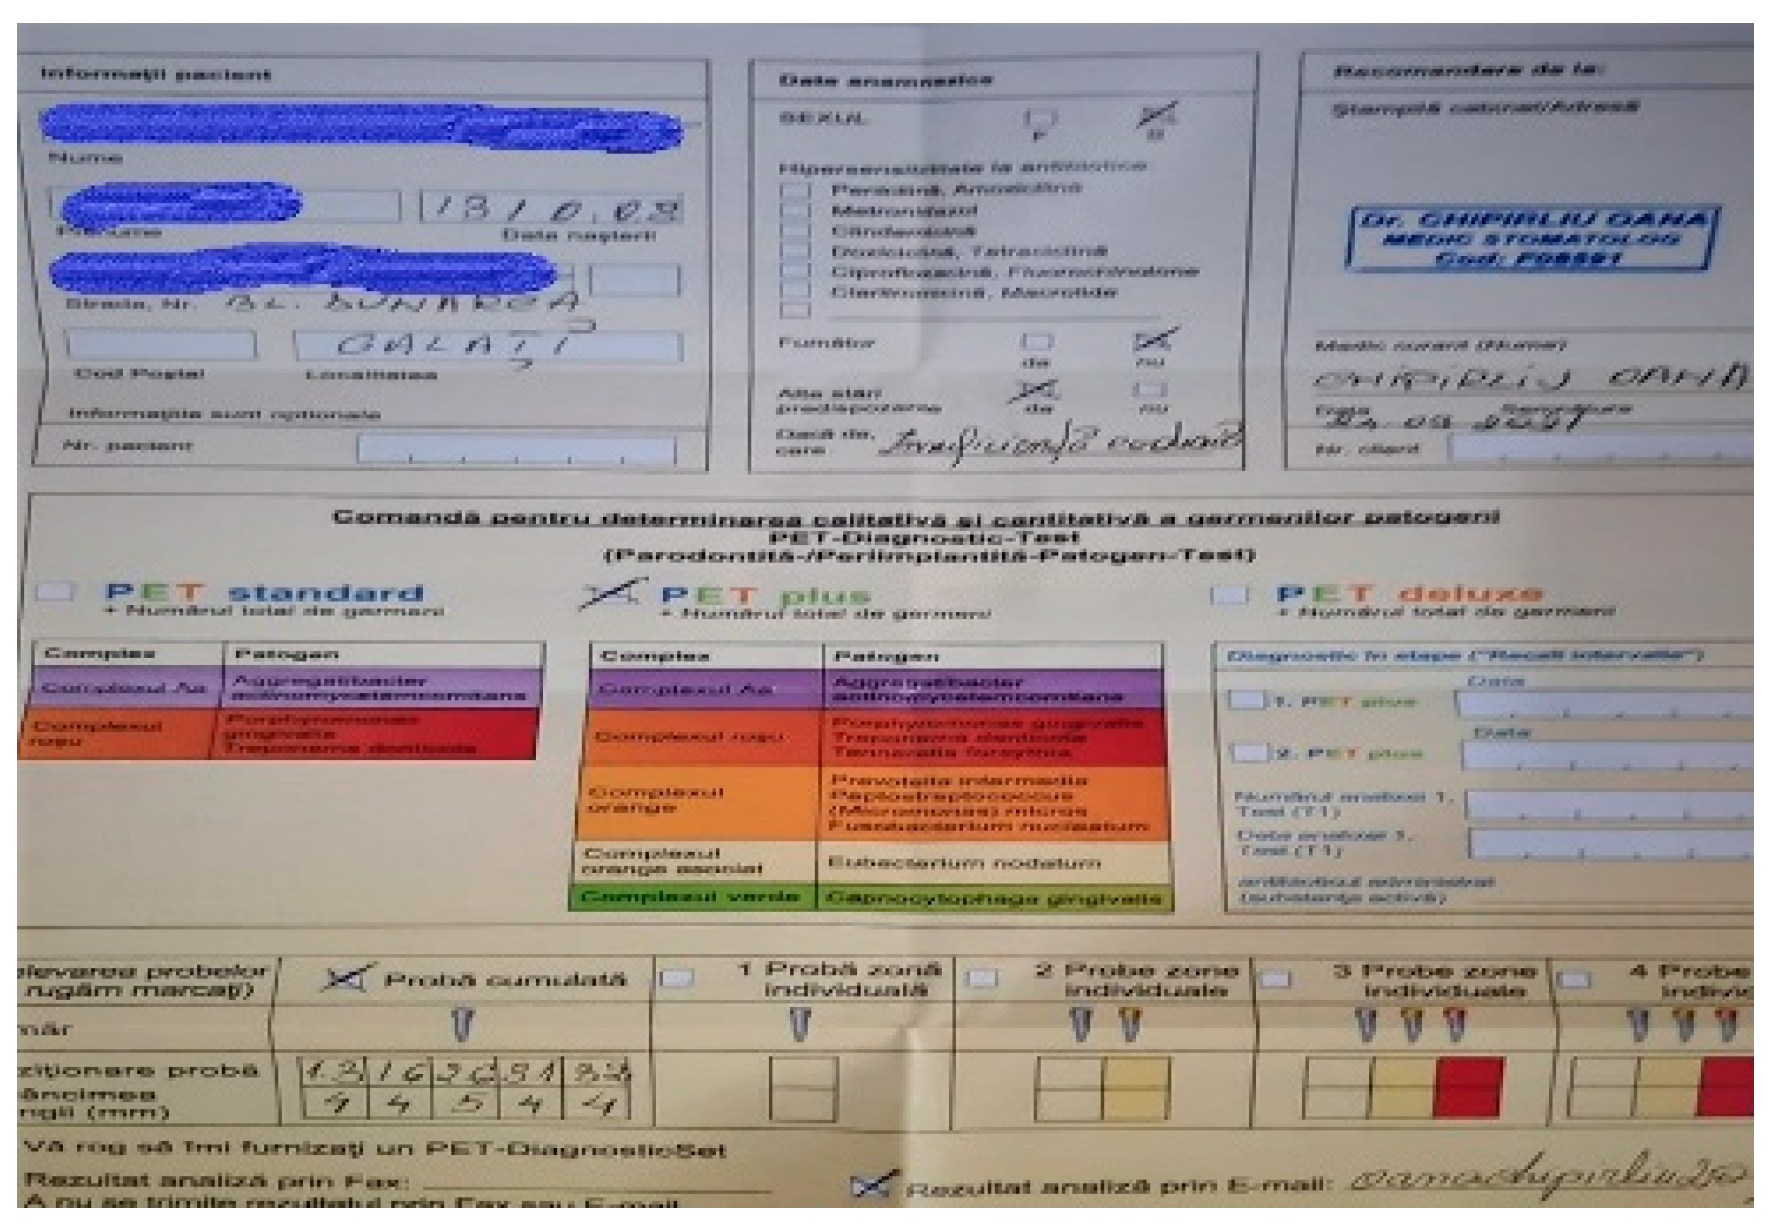
Figure 3.
Order form completed with patient data.
Figure 3.
Order form completed with patient data.
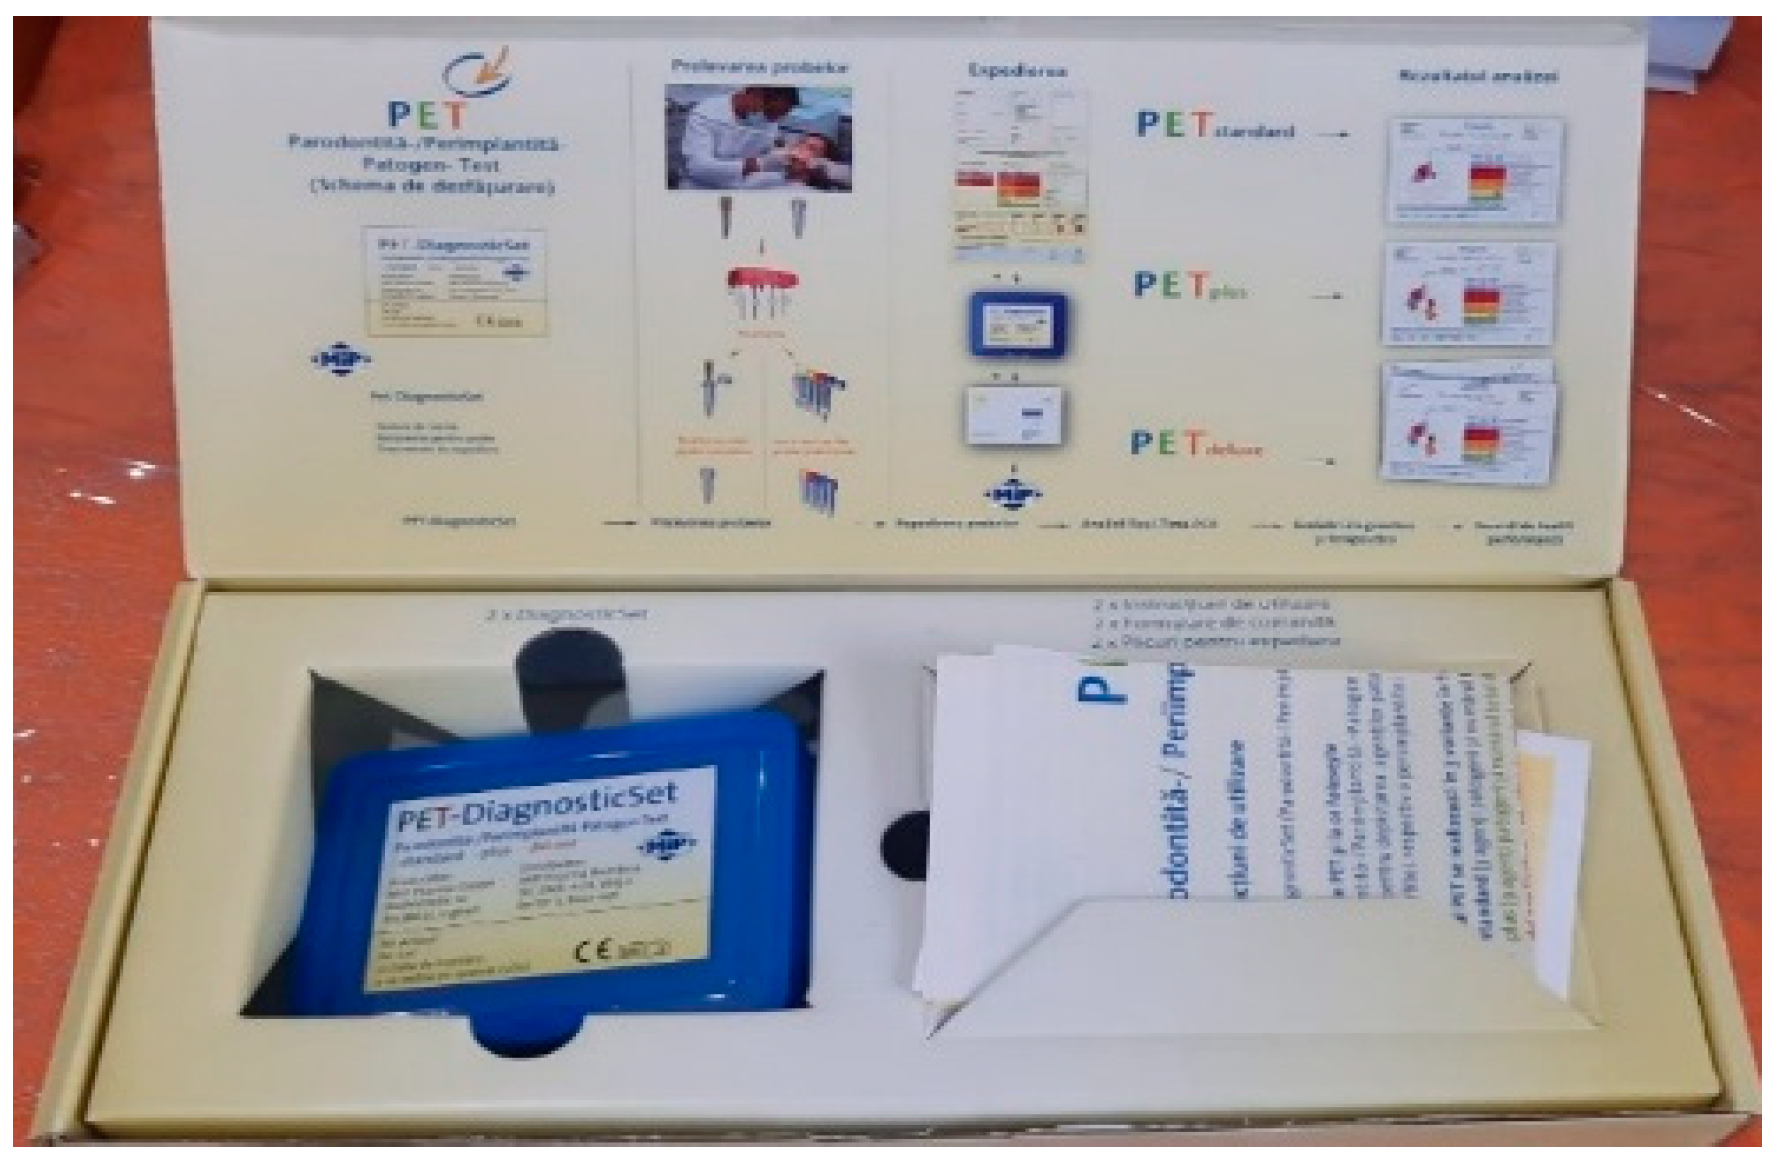
Figure 4.
The transport box and the form to fill in for analyses.
Figure 4.
The transport box and the form to fill in for analyses.
Figure 5.
Envelope required for sending the test.
Figure 5.
Envelope required for sending the test.
Figure 6.
Harvesting at the level of sextant 6, site 4.6. Patient: 14 years old, female, with localized gingivitis, medium, group A.
Figure 6.
Harvesting at the level of sextant 6, site 4.6. Patient: 14 years old, female, with localized gingivitis, medium, group A.
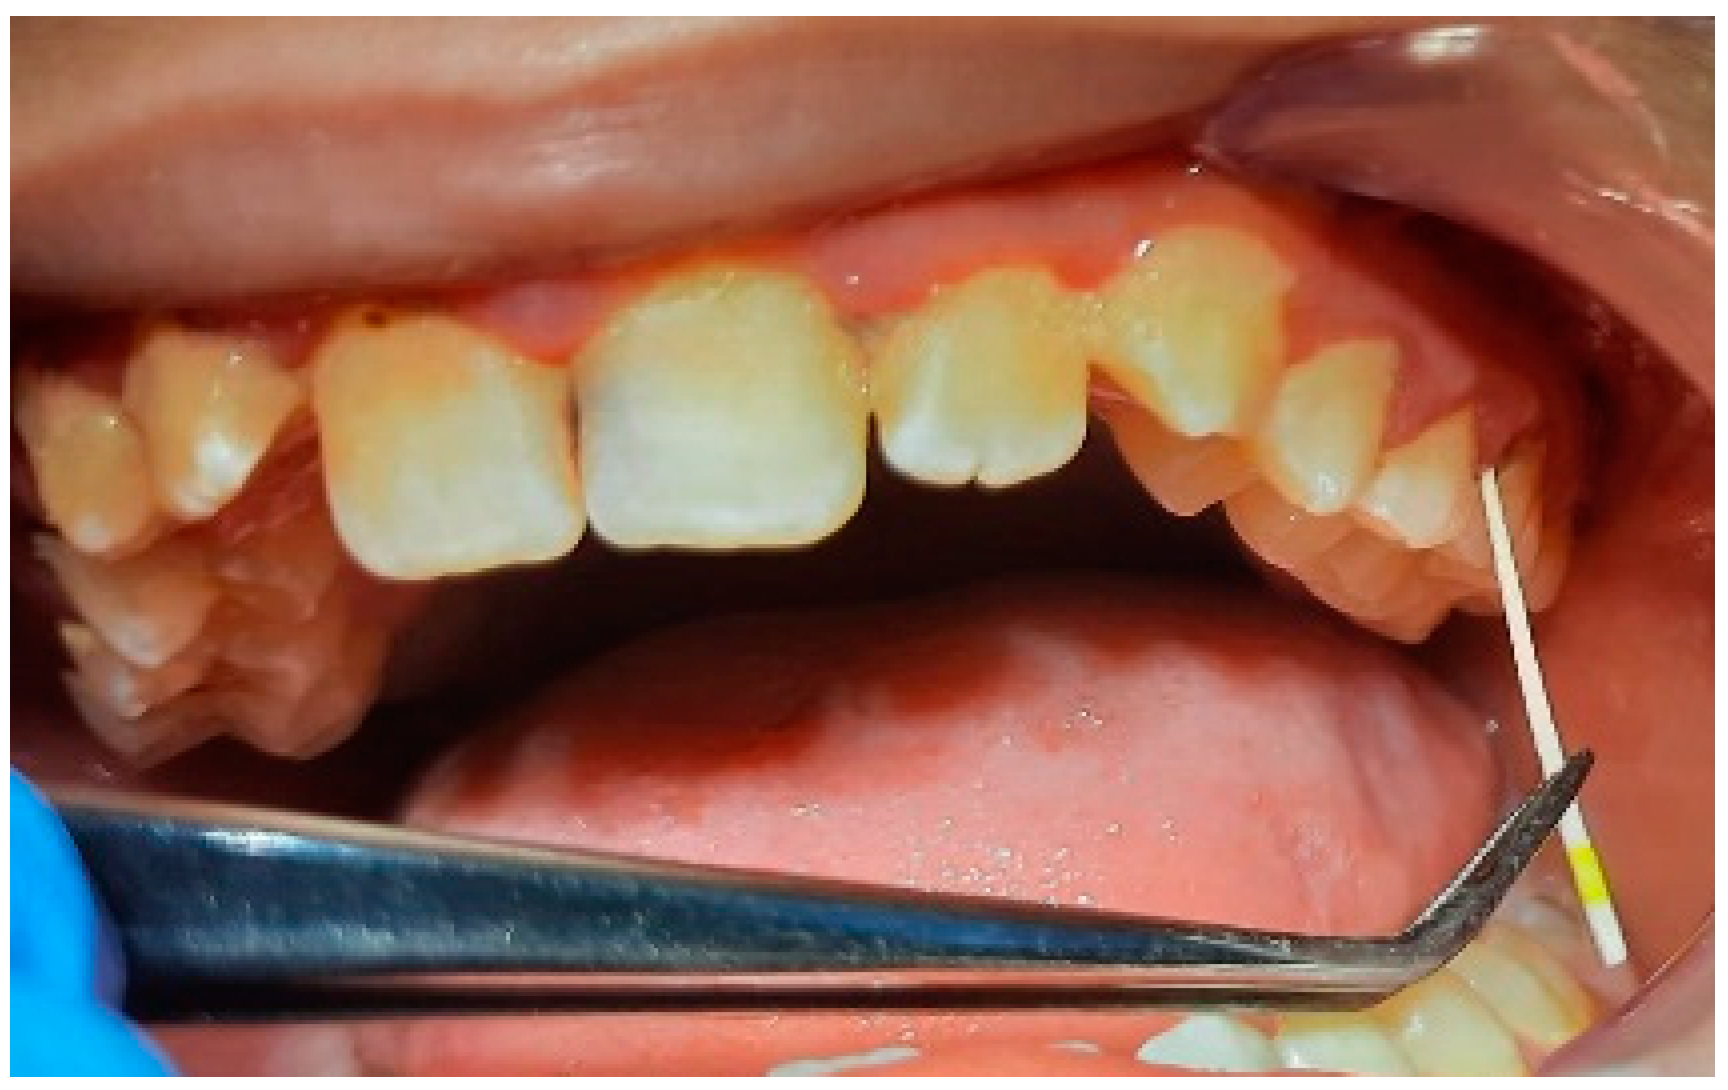
Figure 7.
Collection at sextant level 3, site 2.6. Patient: 10 years old with generalized, severe gingivitis, group A.
Figure 7.
Collection at sextant level 3, site 2.6. Patient: 10 years old with generalized, severe gingivitis, group A.
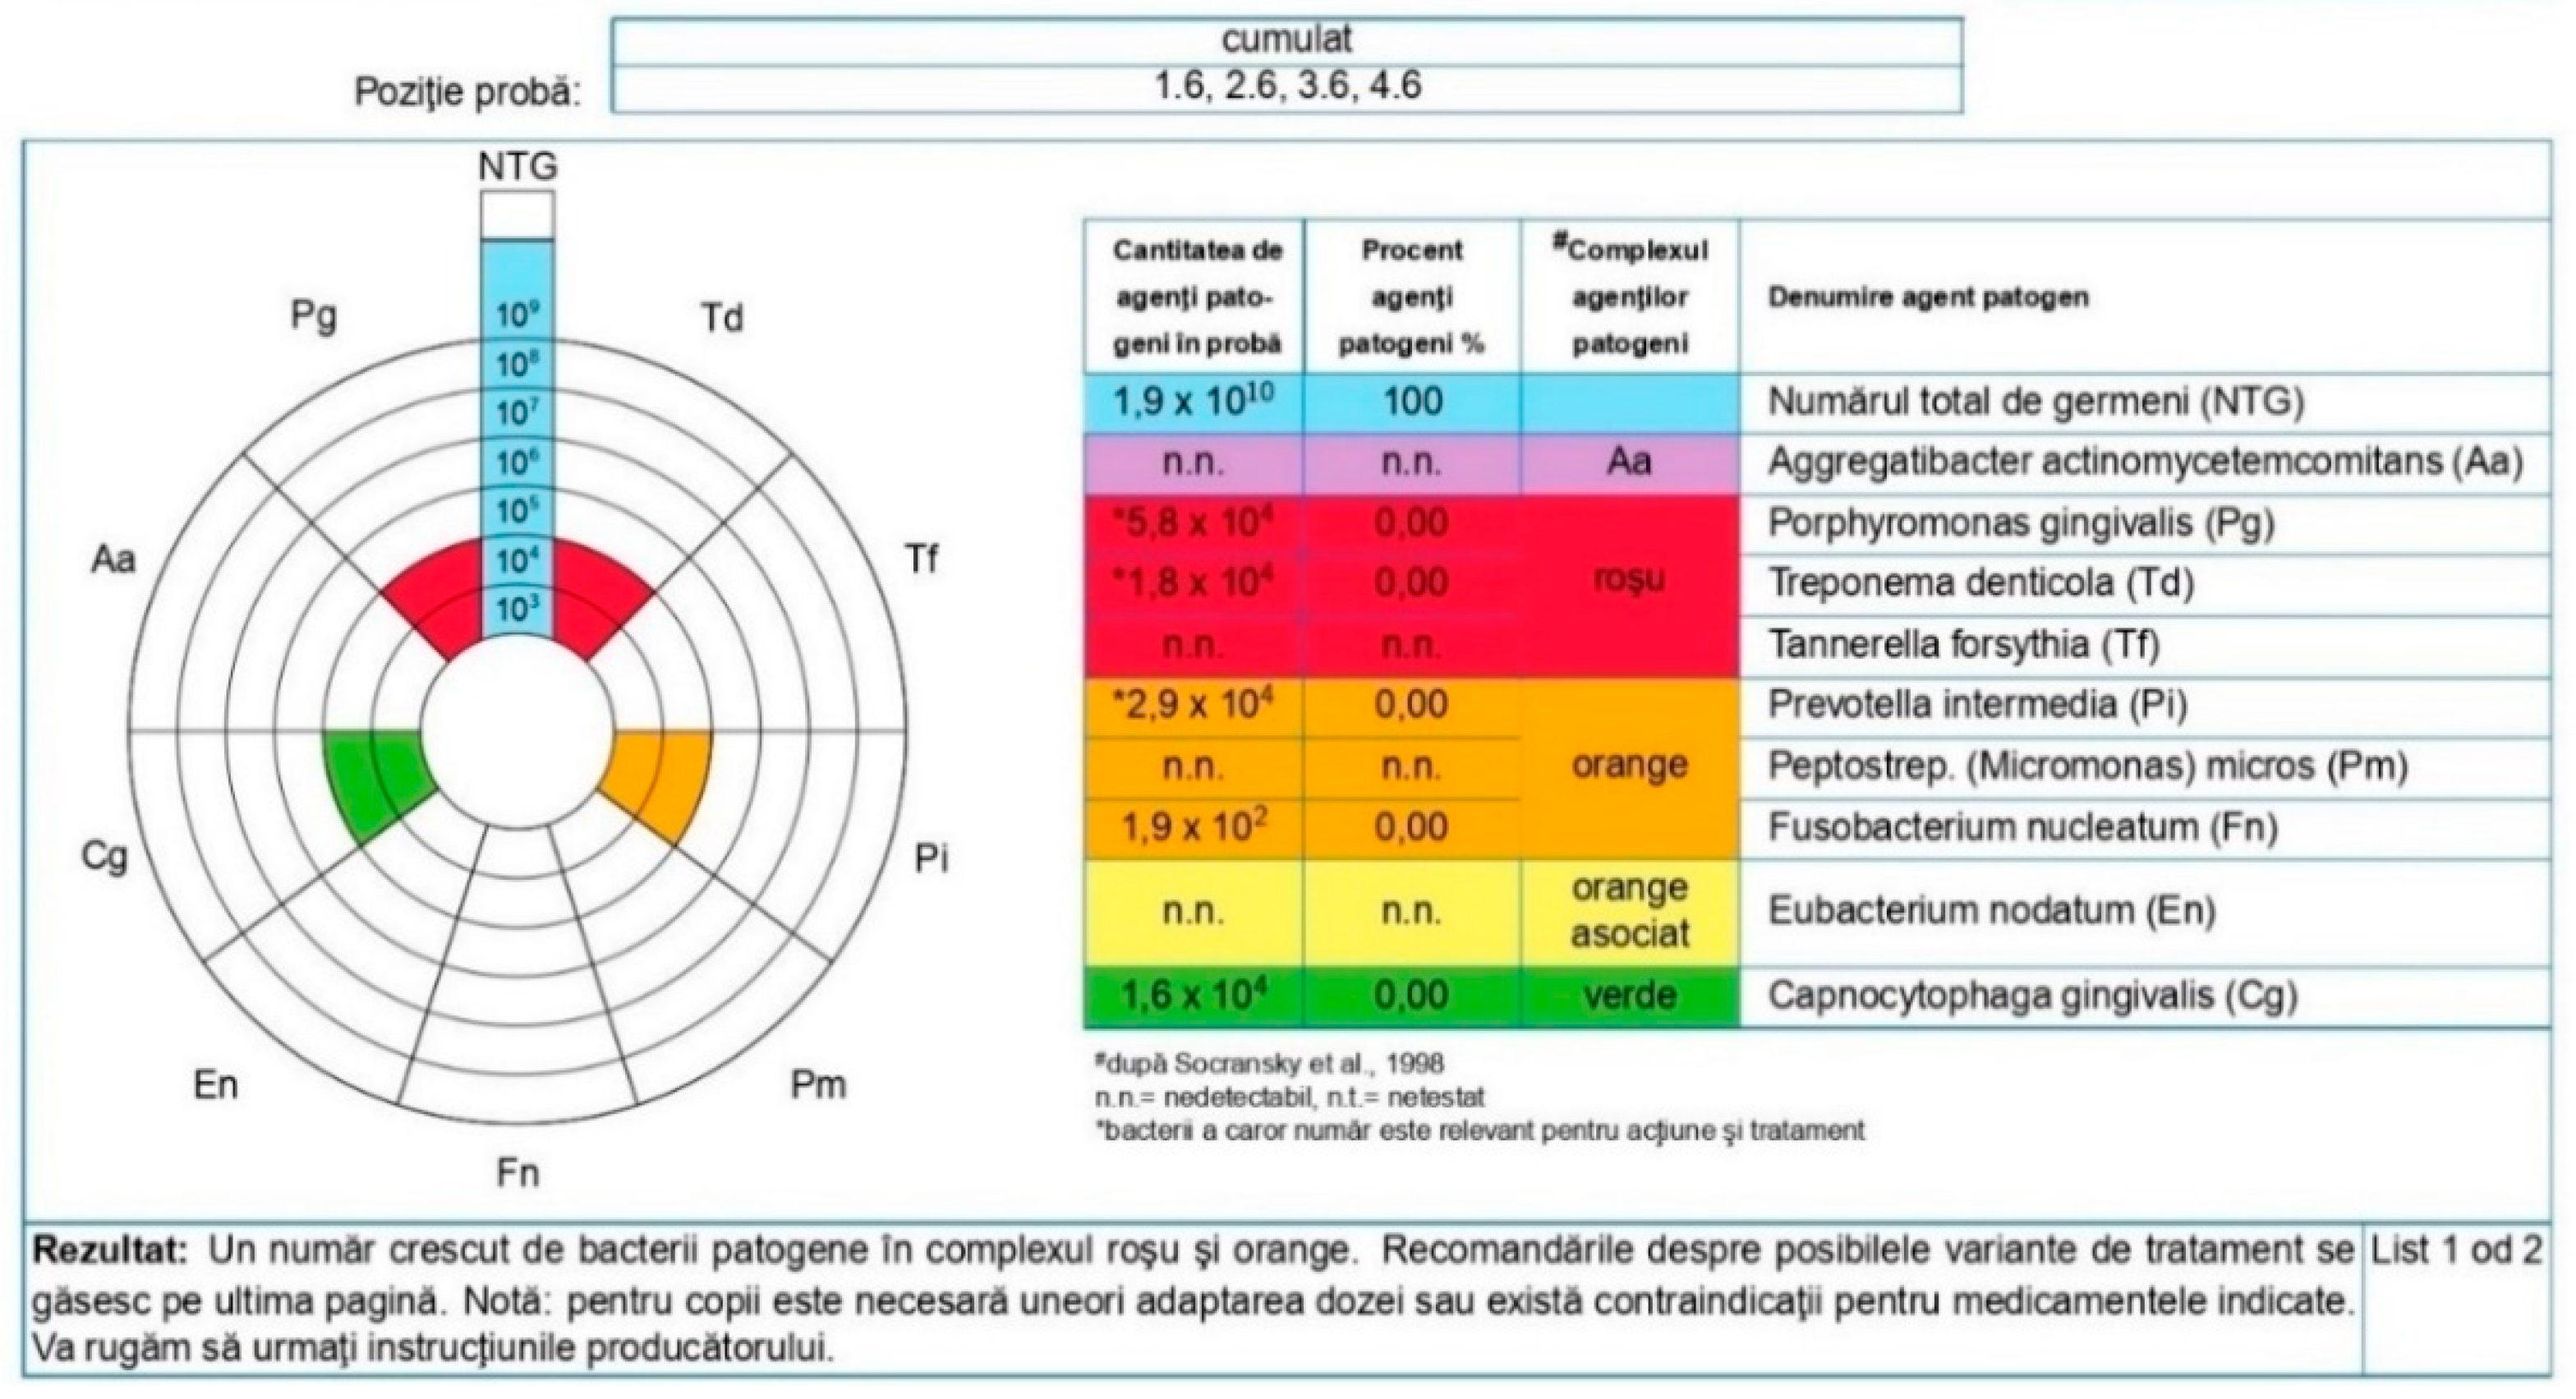
Figure 8.
Group A patient. Generalized biofilm-induced gingivitis in medium form. Aged 14 years, female sex, essential hypertension, microbiological results, and initial consultation.
Figure 8.
Group A patient. Generalized biofilm-induced gingivitis in medium form. Aged 14 years, female sex, essential hypertension, microbiological results, and initial consultation.
Figure 9.
Group A patient’s periodontal health. Aged 14 years, female sex, essential hypertension, and microbiological results 3 months after treatment.
Figure 9.
Group A patient’s periodontal health. Aged 14 years, female sex, essential hypertension, and microbiological results 3 months after treatment.
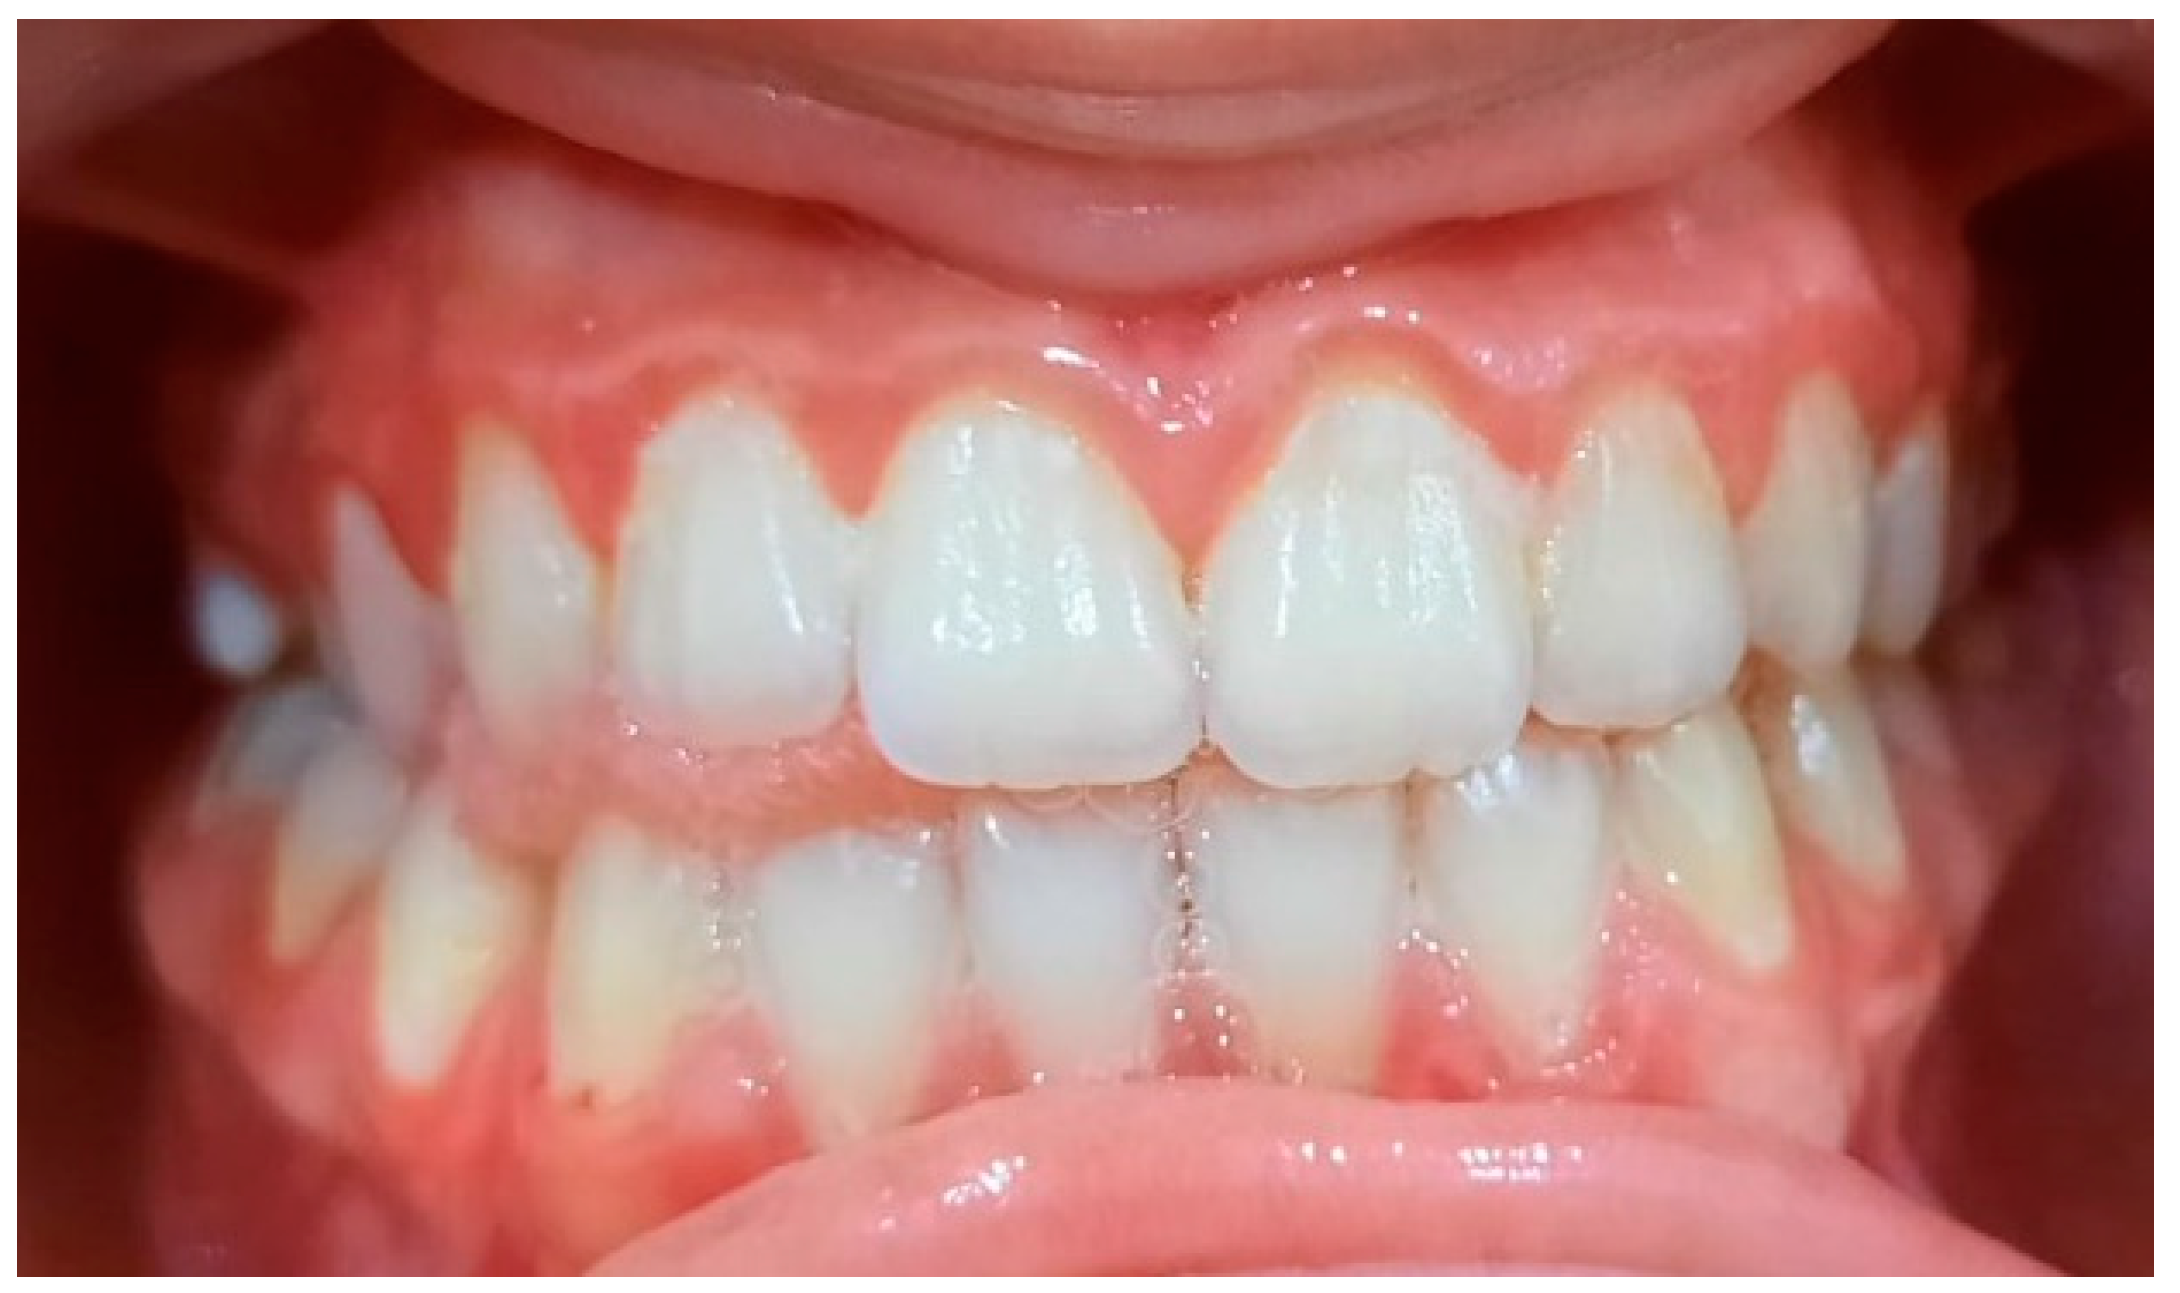
Figure 10.
Biofilm-induced gingivitis, medium form, generalized. Female, 14 years old, group A.
Figure 10.
Biofilm-induced gingivitis, medium form, generalized. Female, 14 years old, group A.
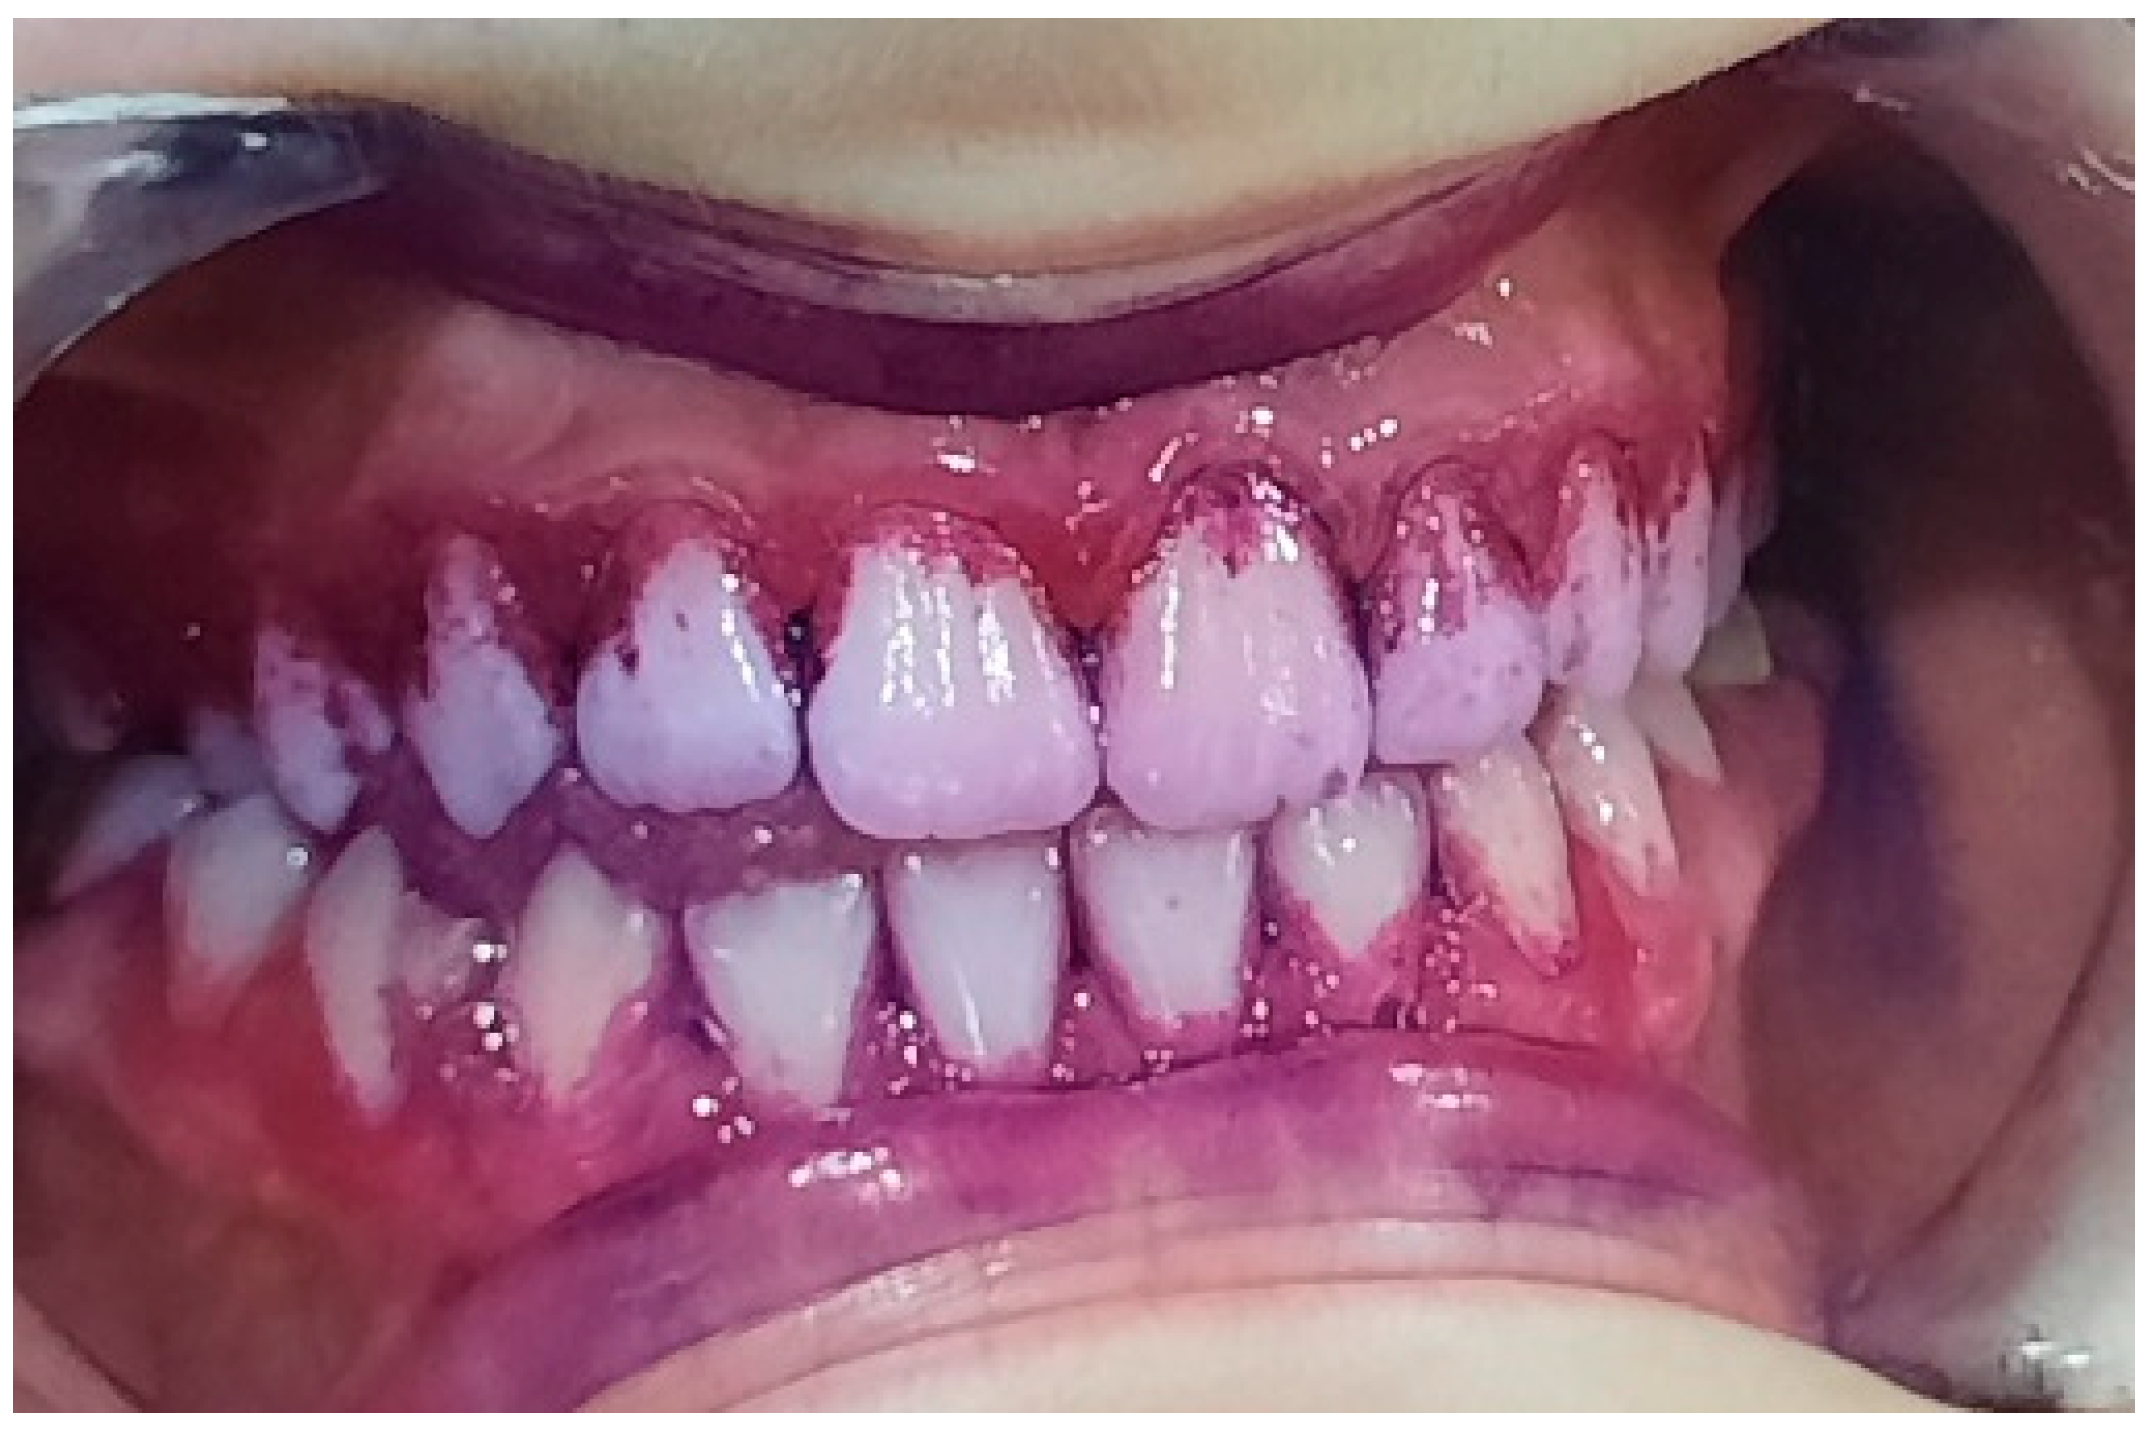
Figure 11.
Bacterial plaque staining. IP = 72%, GI = 2. Poor oral hygiene.
Figure 11.
Bacterial plaque staining. IP = 72%, GI = 2. Poor oral hygiene.
Figure 12.
Collection of samples for PET tests (1.6).
Figure 12.
Collection of samples for PET tests (1.6).
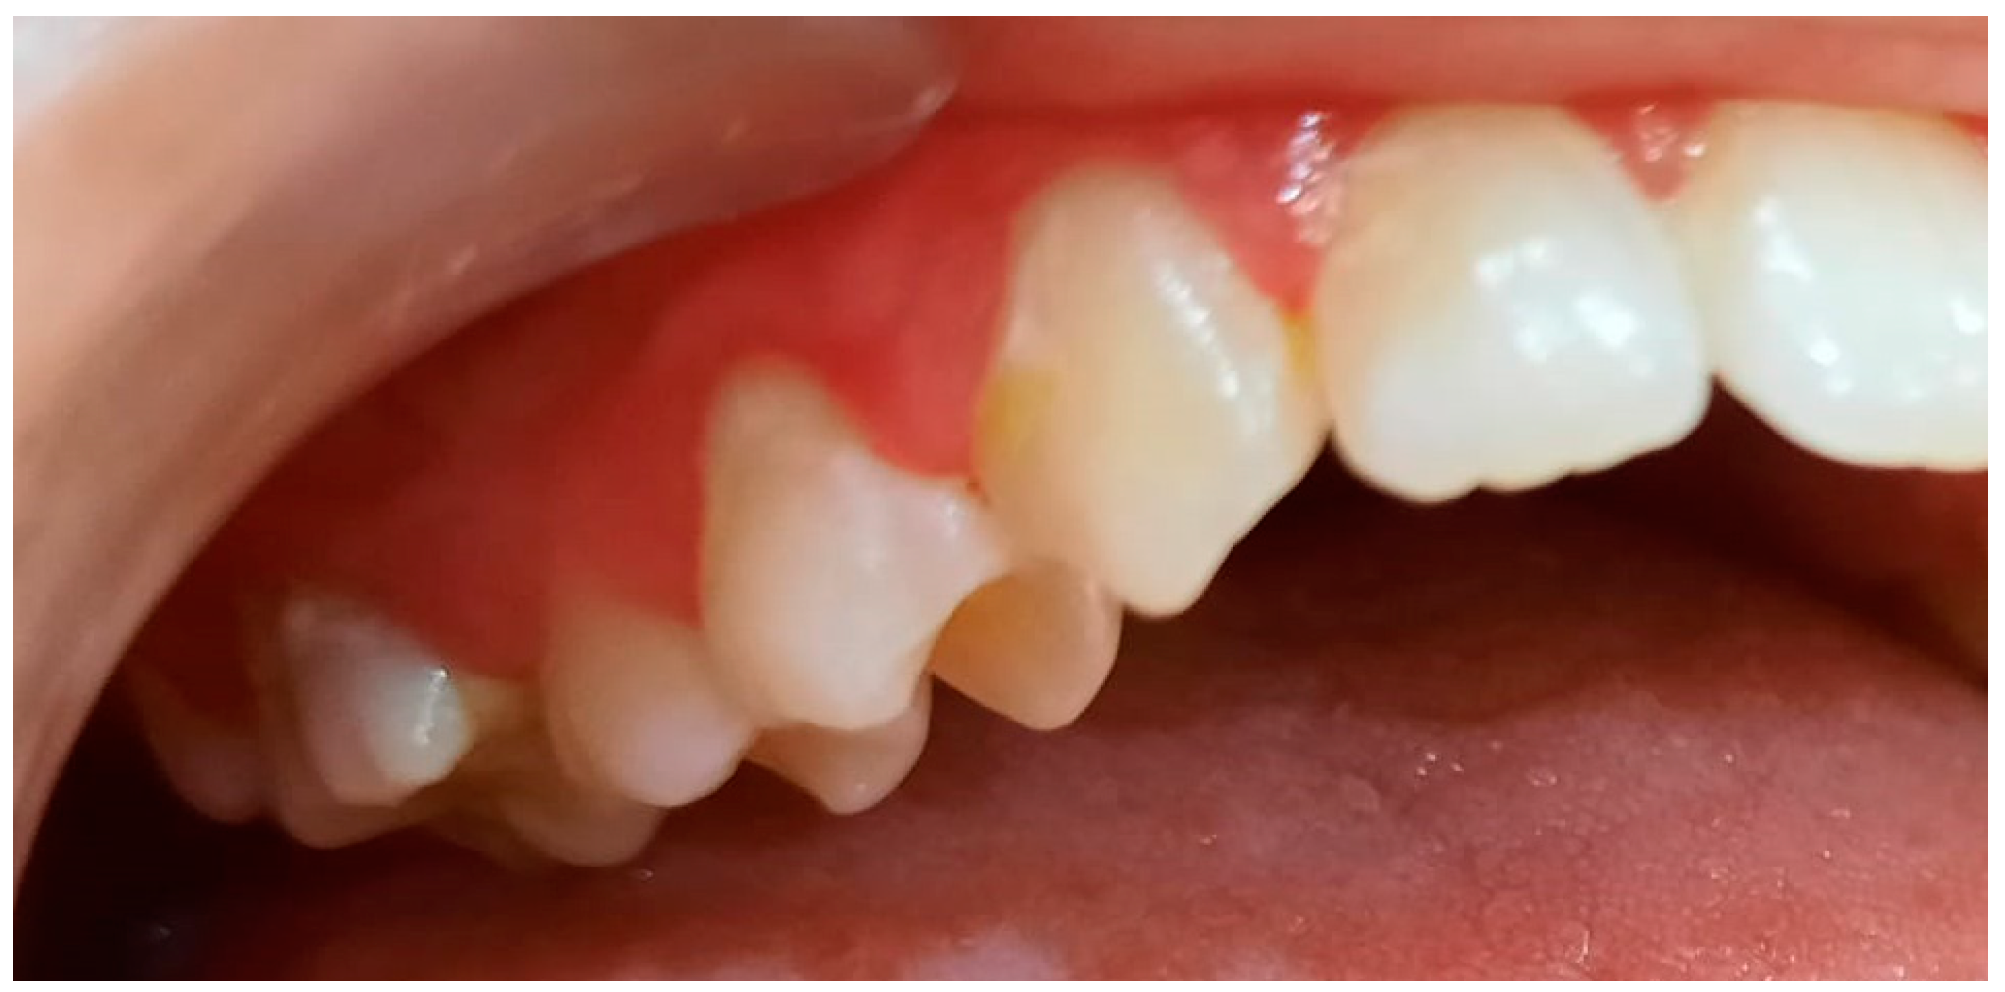
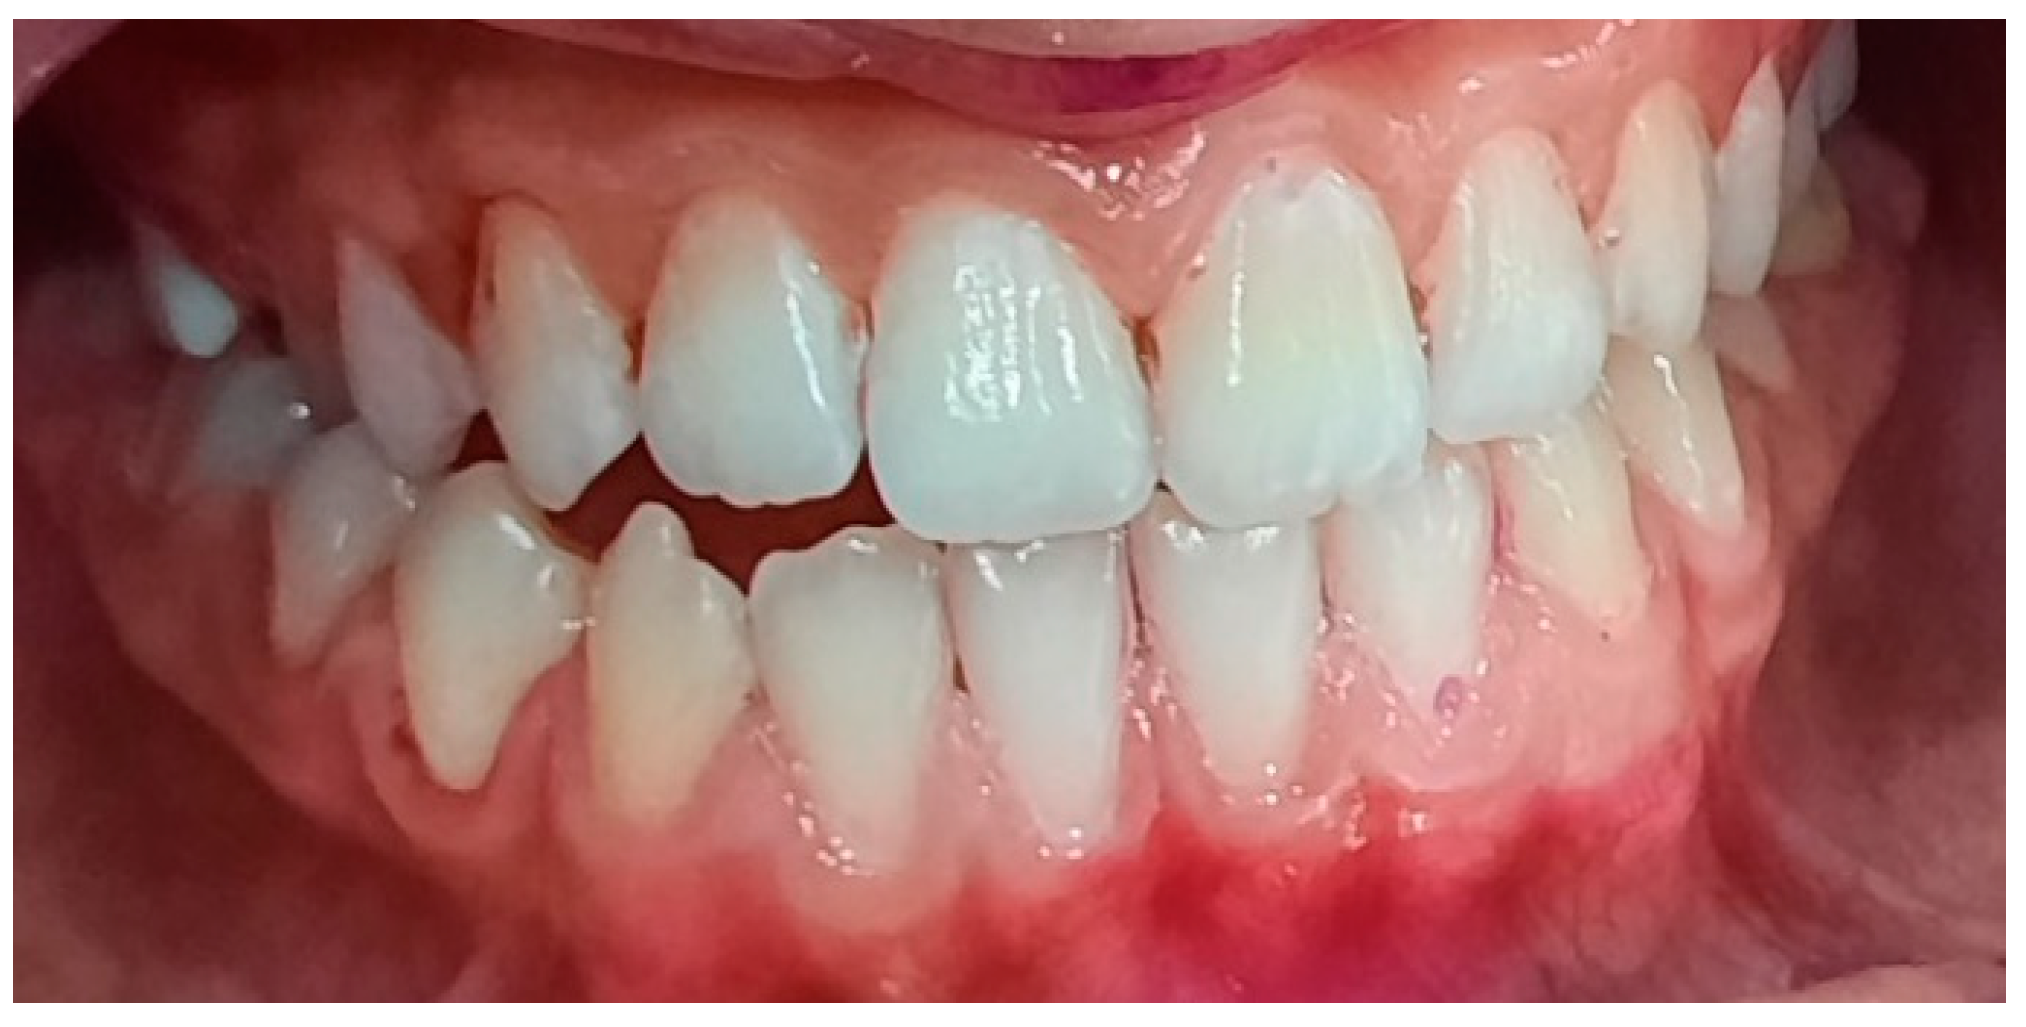
Figure 13.
Inflammation of interdental papillae, dental malpositions, and bacterial plaque deposits.
Figure 13.
Inflammation of interdental papillae, dental malpositions, and bacterial plaque deposits.
Figure 14.
Appearance after professional sanitization.
Figure 14.
Appearance after professional sanitization.
Figure 15.
Periodontal record of patient with biofilm-induced gingivitis, medium form, generalized. Female, 14 years, group C. Initial consultation IP = 72%, ISG = 72%, maxilla. (the points in blue are the presence of bacterial plaque on the tooth, the points in red are the bleeding on the probe).
Figure 15.
Periodontal record of patient with biofilm-induced gingivitis, medium form, generalized. Female, 14 years, group C. Initial consultation IP = 72%, ISG = 72%, maxilla. (the points in blue are the presence of bacterial plaque on the tooth, the points in red are the bleeding on the probe).
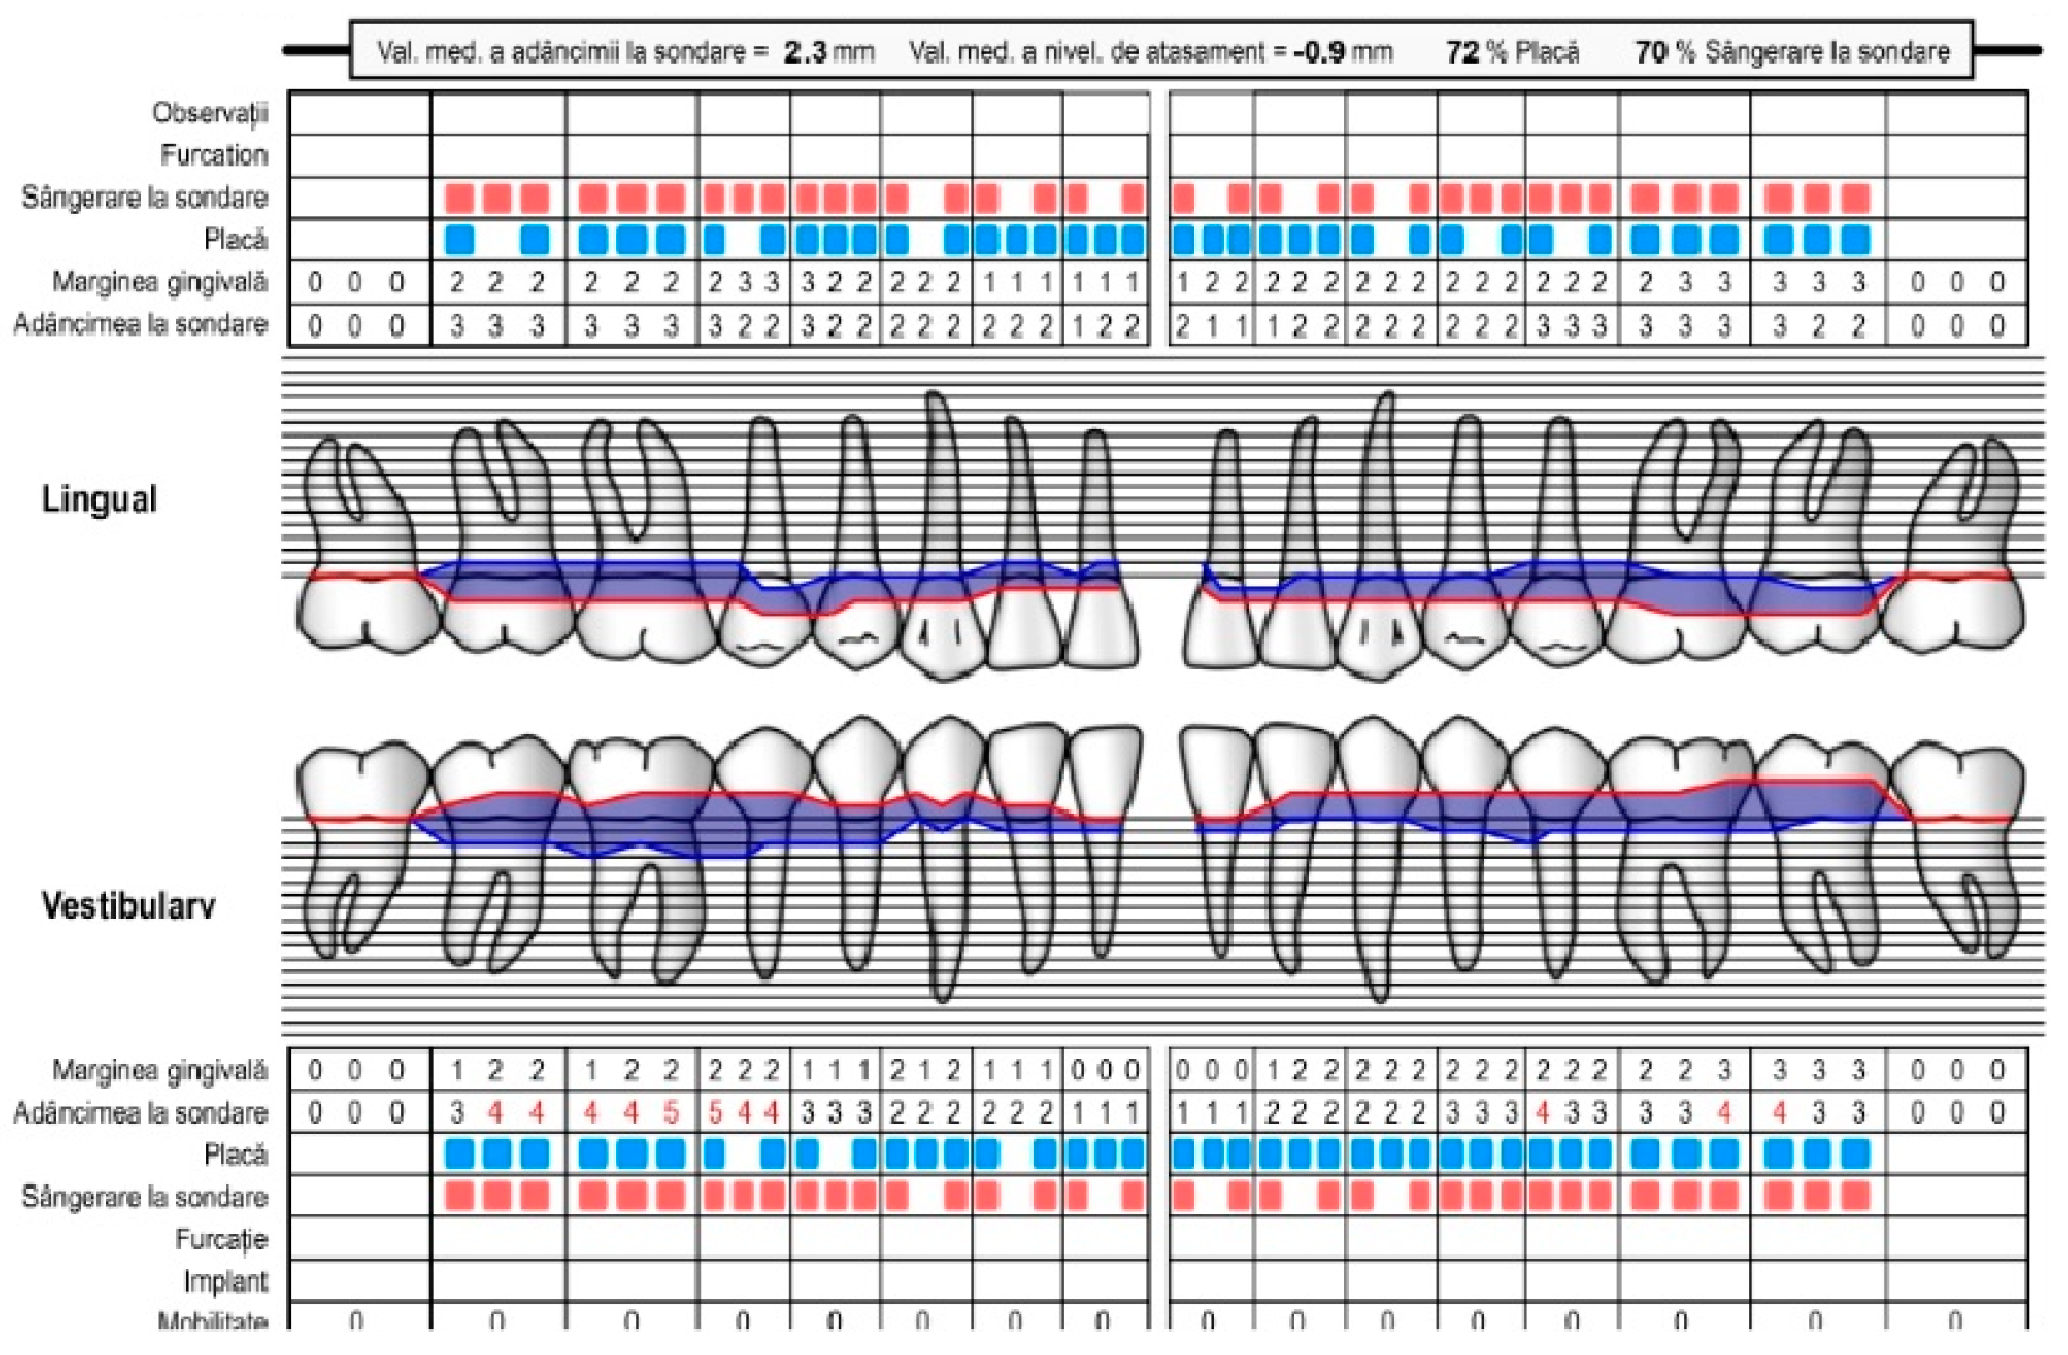
Figure 16.
Periodontal record of patient with biofilm-induced gingivitis, medium form, generalized. Female, 14 years, group C. Initial consultation IP = 72%, ISG = 72%, mandible. (the points in blue are the presence of bacterial plaque on the tooth, the points in red are the bleeding on the probe).
Figure 16.
Periodontal record of patient with biofilm-induced gingivitis, medium form, generalized. Female, 14 years, group C. Initial consultation IP = 72%, ISG = 72%, mandible. (the points in blue are the presence of bacterial plaque on the tooth, the points in red are the bleeding on the probe).
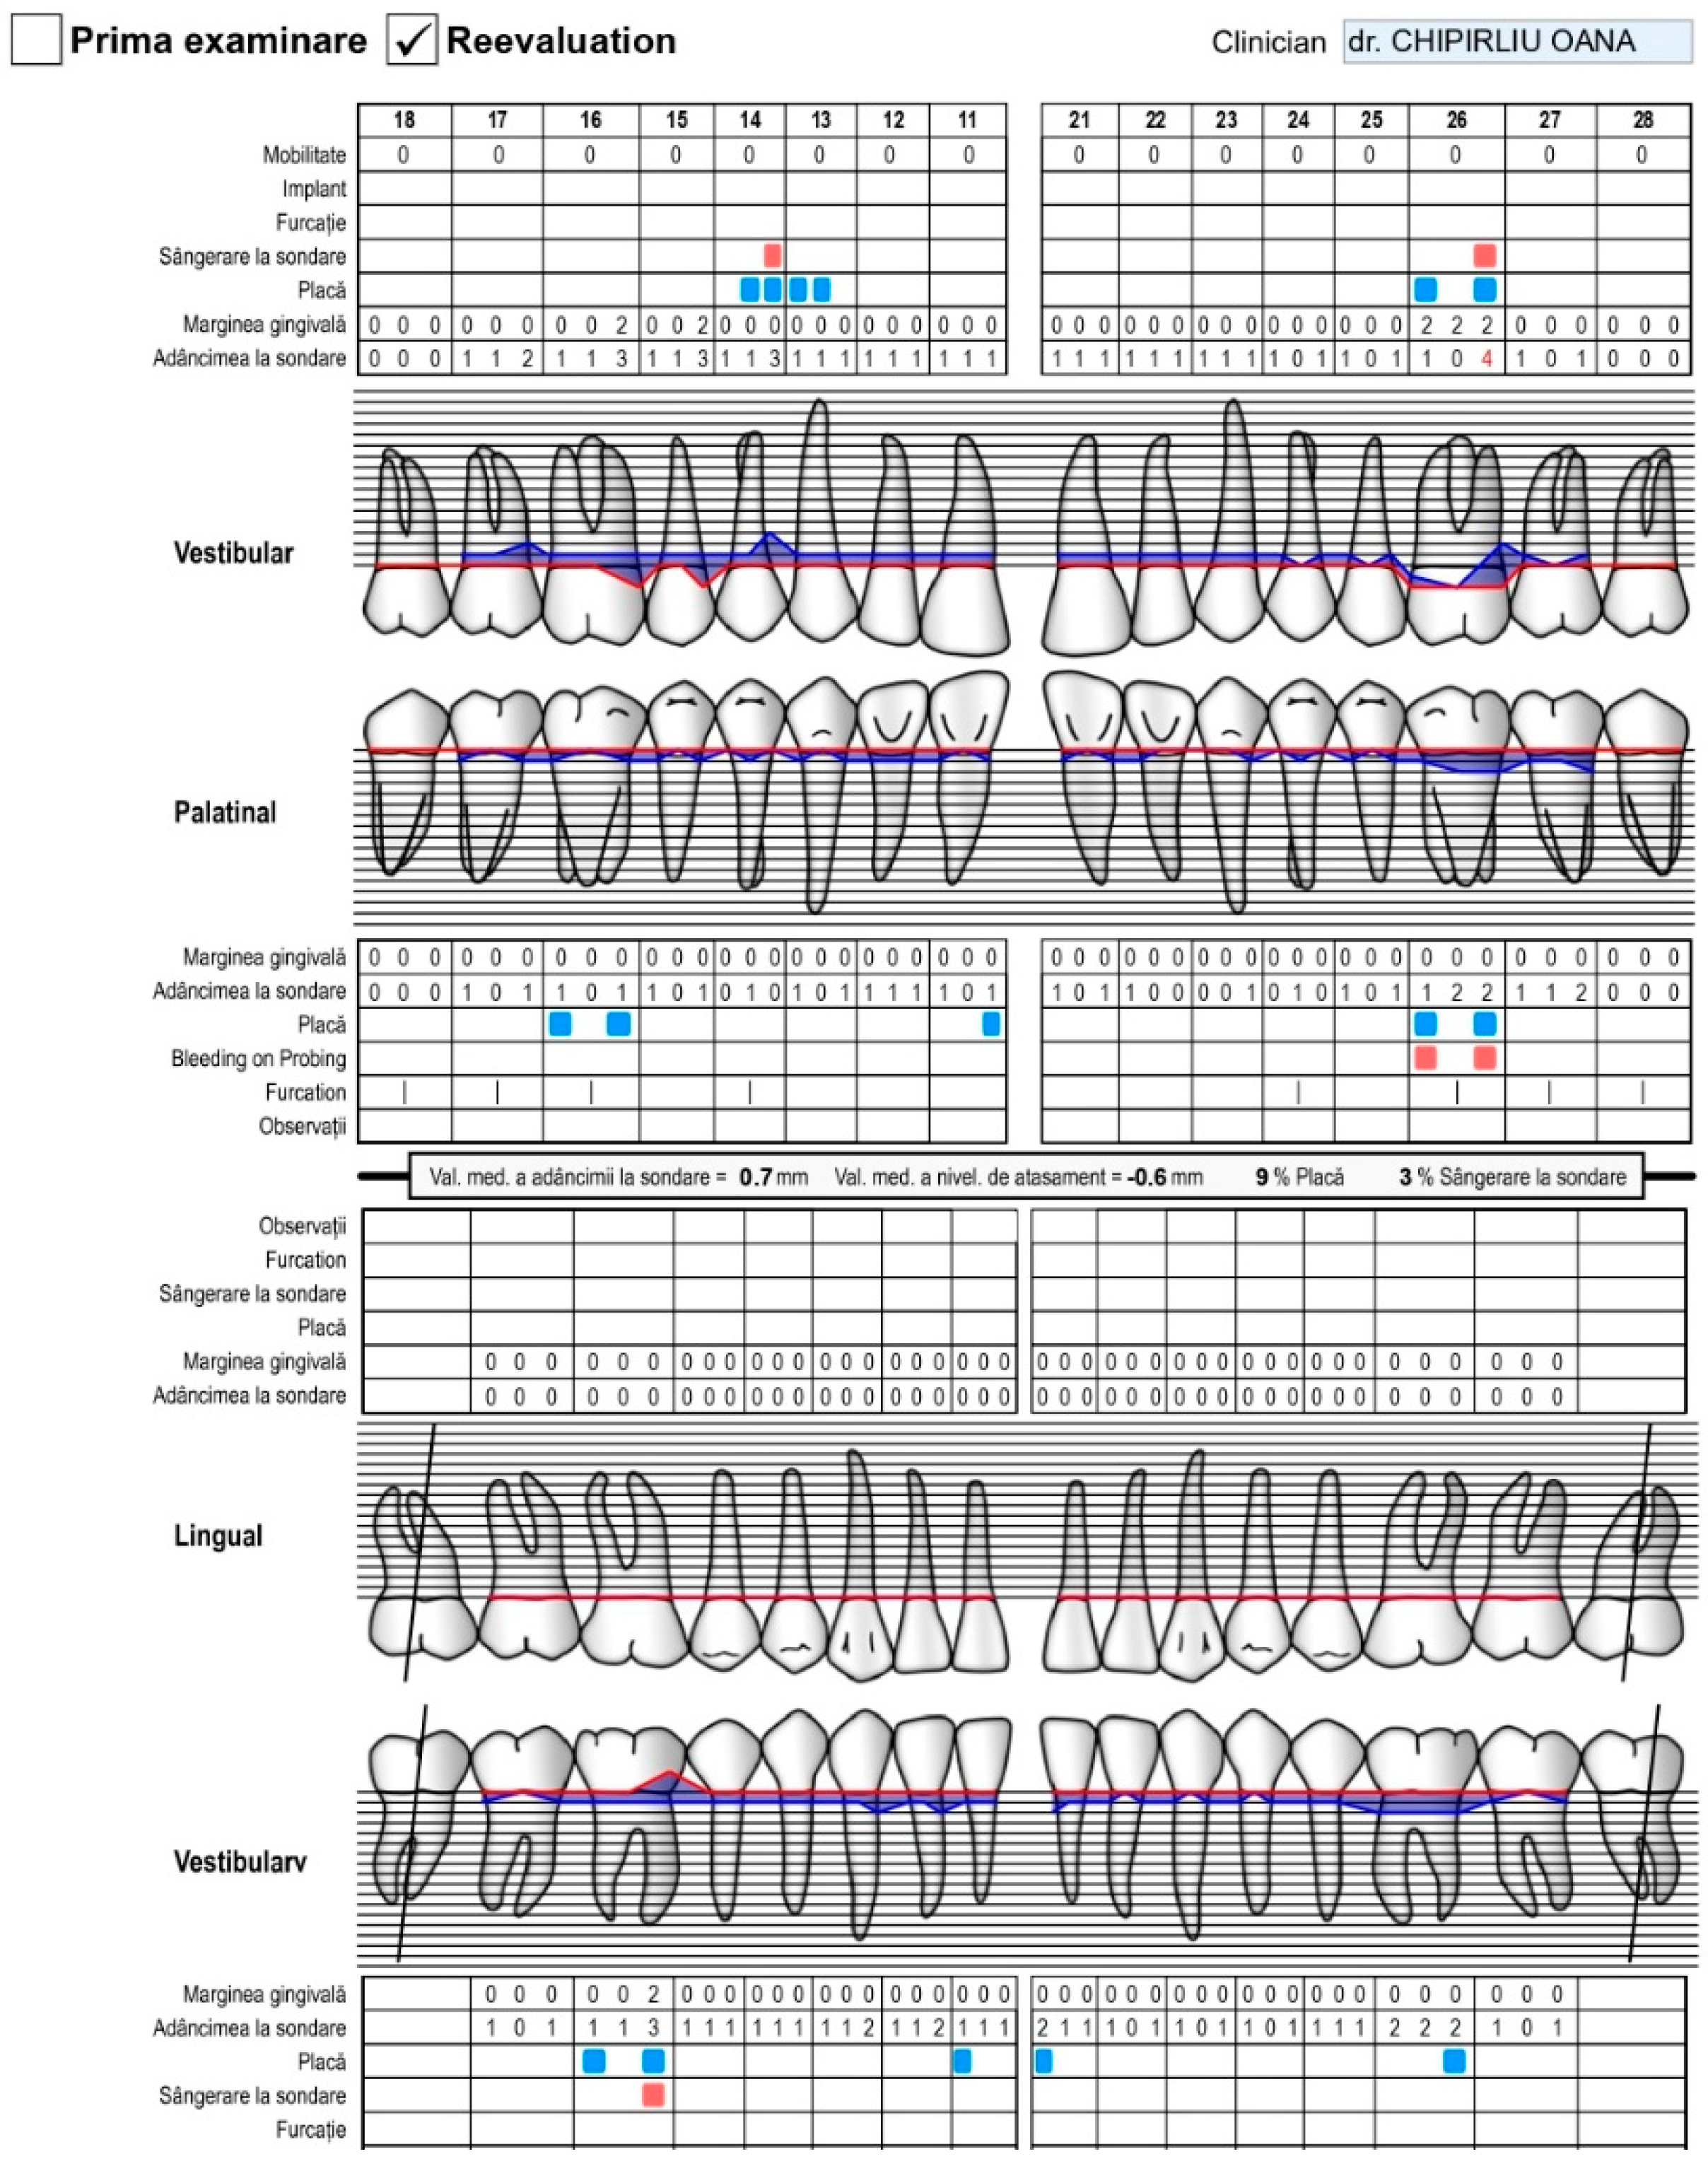
Figure 17.
Periodontal patient record. Diagnosis of periodontal disease. Female, 14 years old, group C. Consultation after 3 months. IP = 9%, IS = 3%. Favorable response to the applied treatment and much better hygiene (maxilla and mandible) (the points in blue are the presence of bacterial plaque on the tooth, the points in red are the bleeding on the probe).
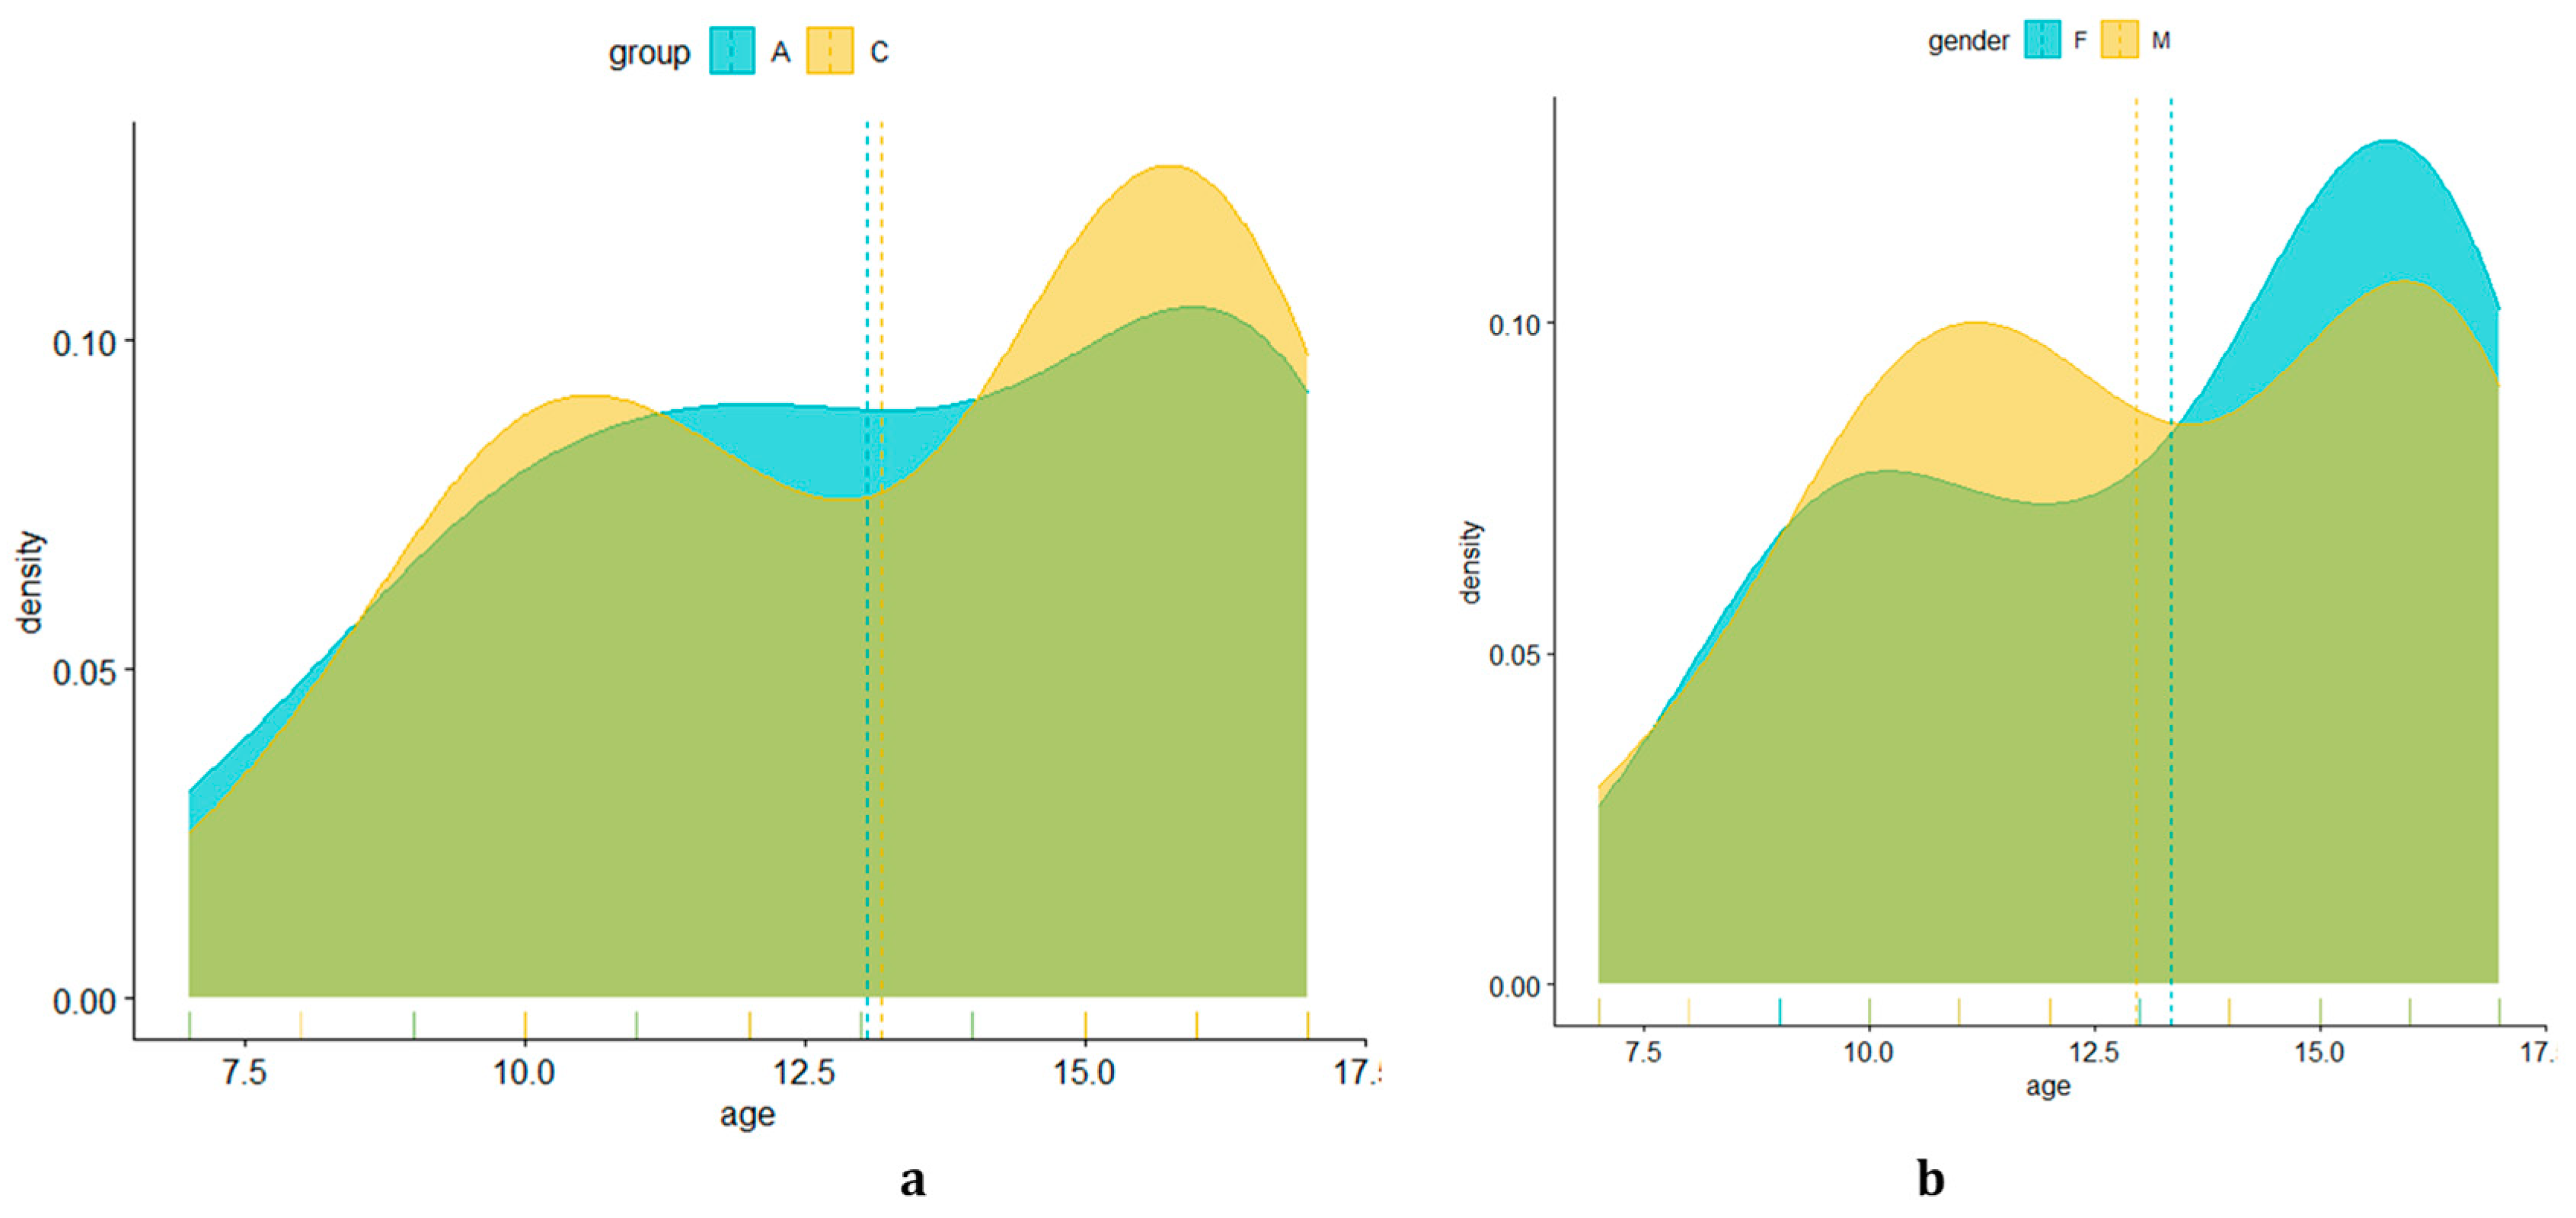
Figure 18.
Probability density, estimated based on age of subjects in the two groups (a) and by gender (b).
Figure 18.
Probability density, estimated based on age of subjects in the two groups (a) and by gender (b).
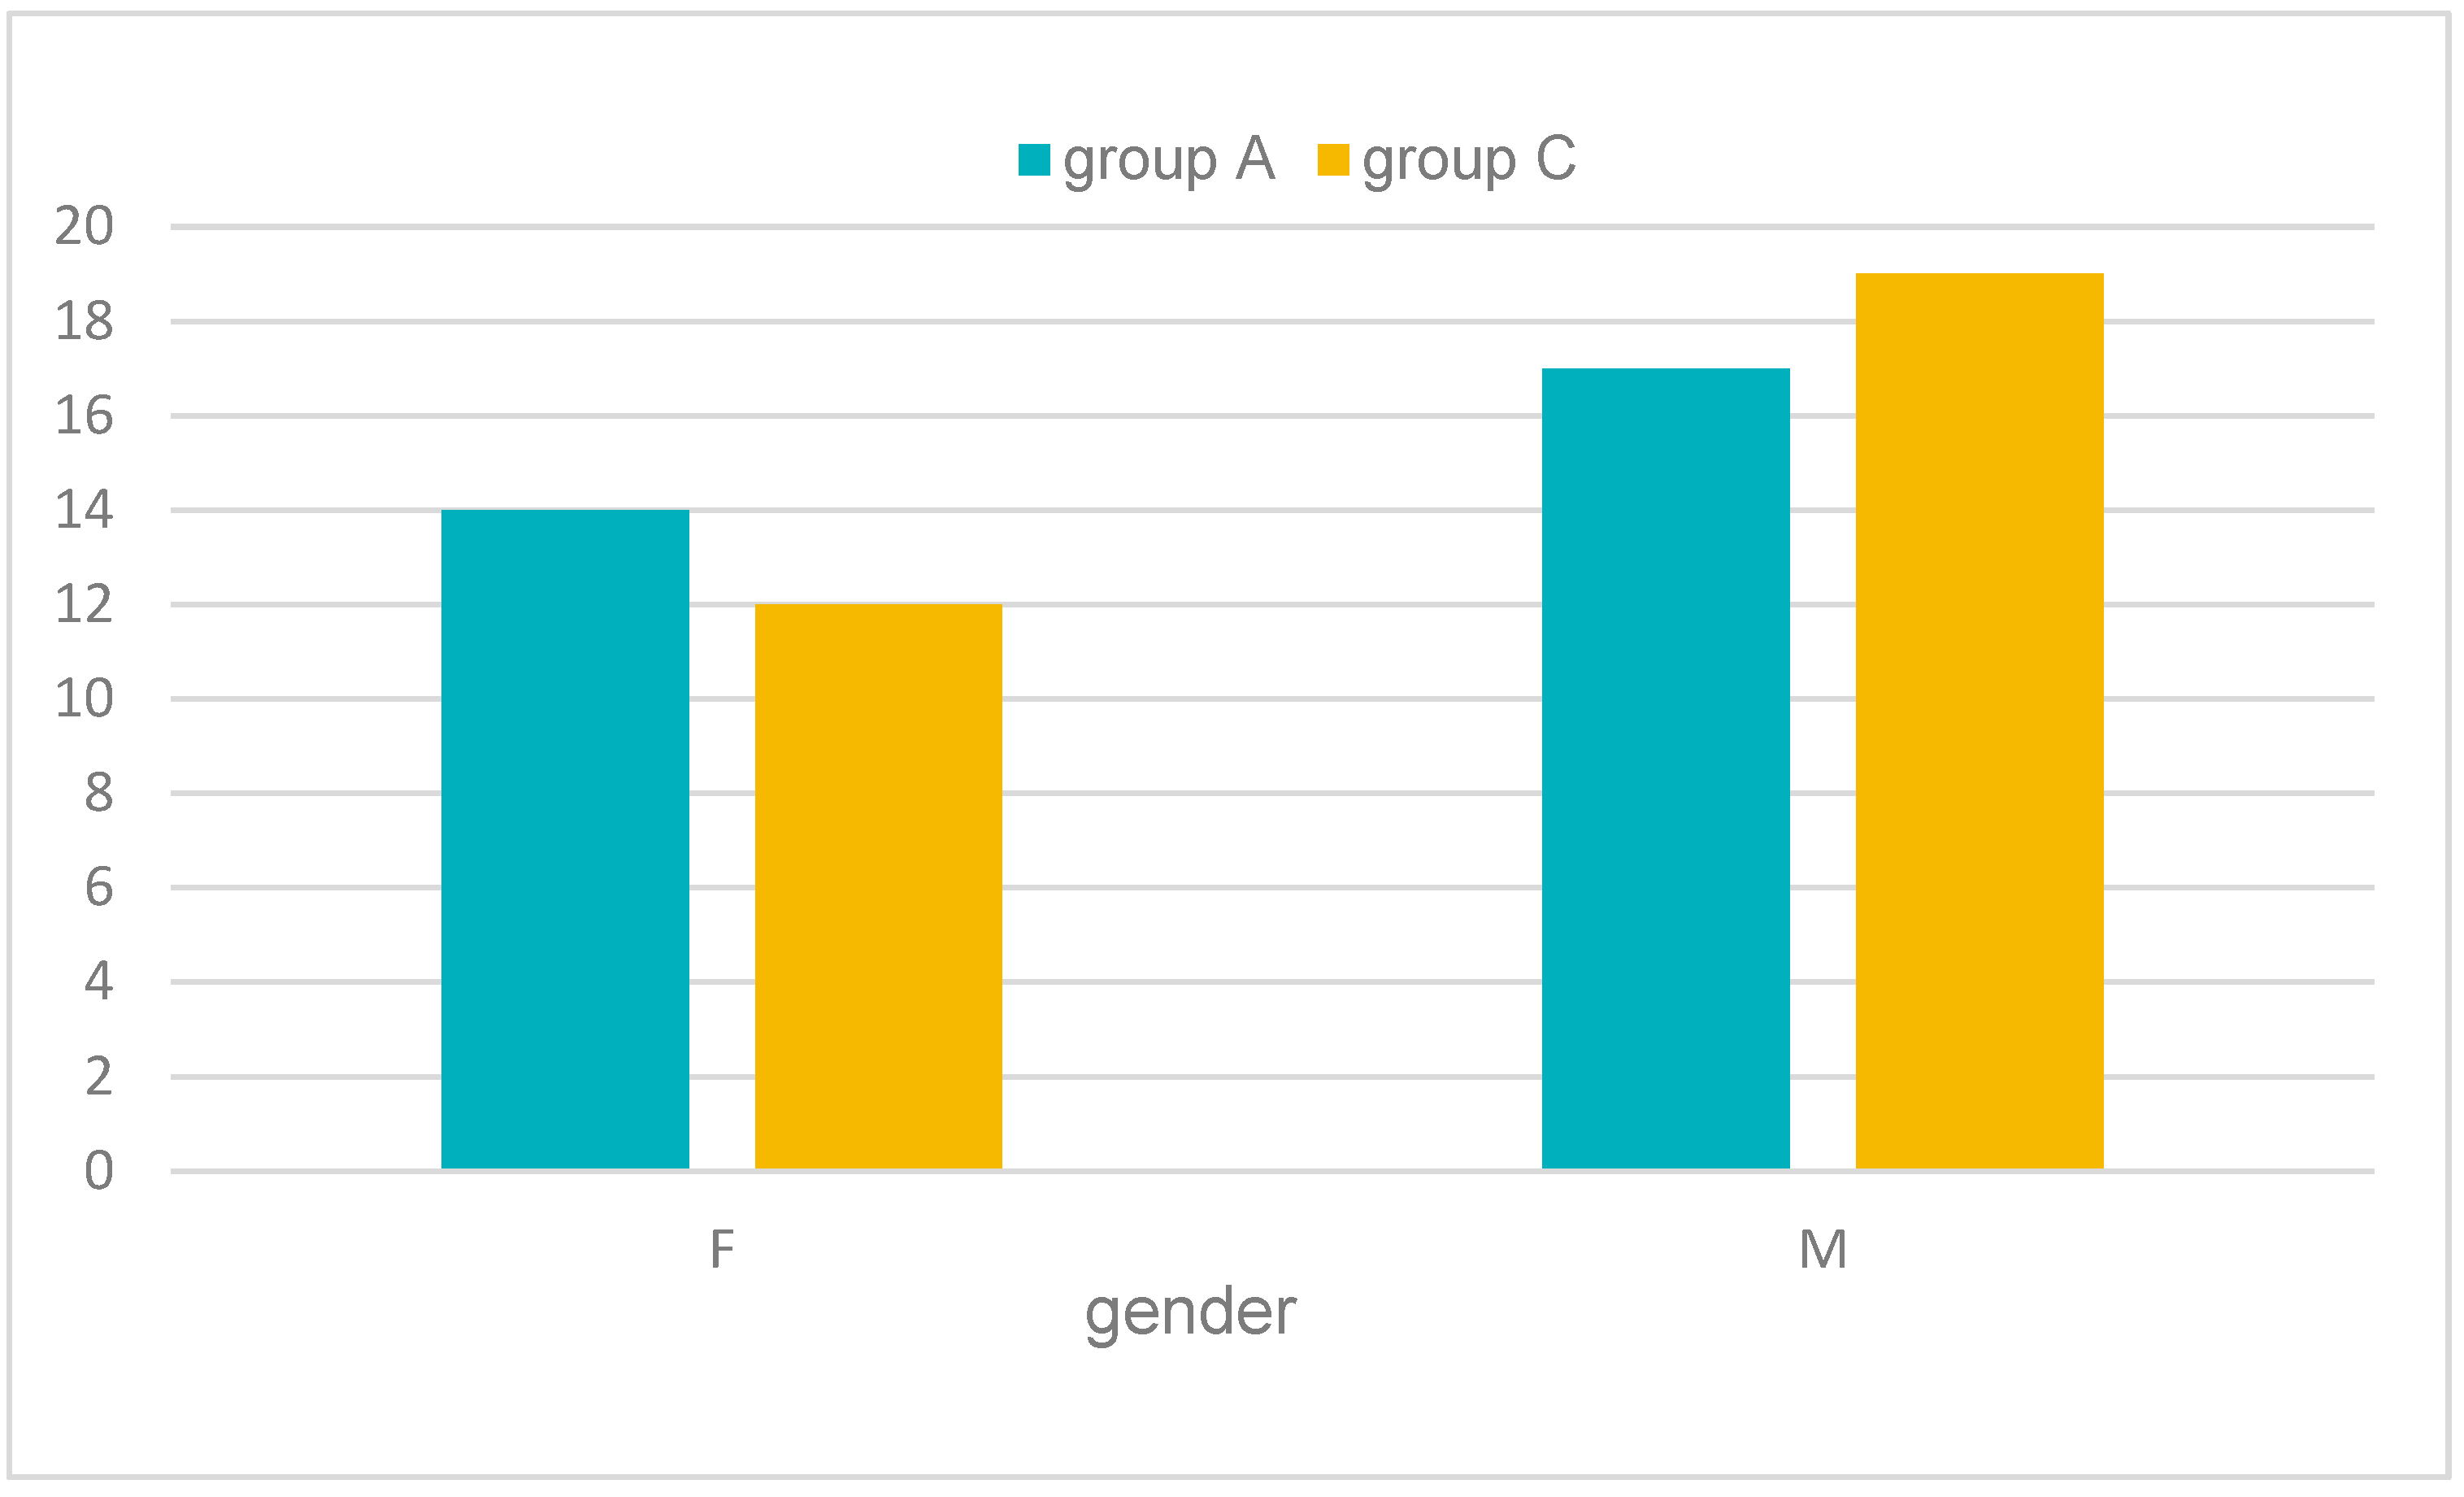
Figure 19.
Number of subjects in each batch by gender. Group A = subjects with cardiovascular disease. Group C = subjects without cardiovascular disease.
Figure 19.
Number of subjects in each batch by gender. Group A = subjects with cardiovascular disease. Group C = subjects without cardiovascular disease.
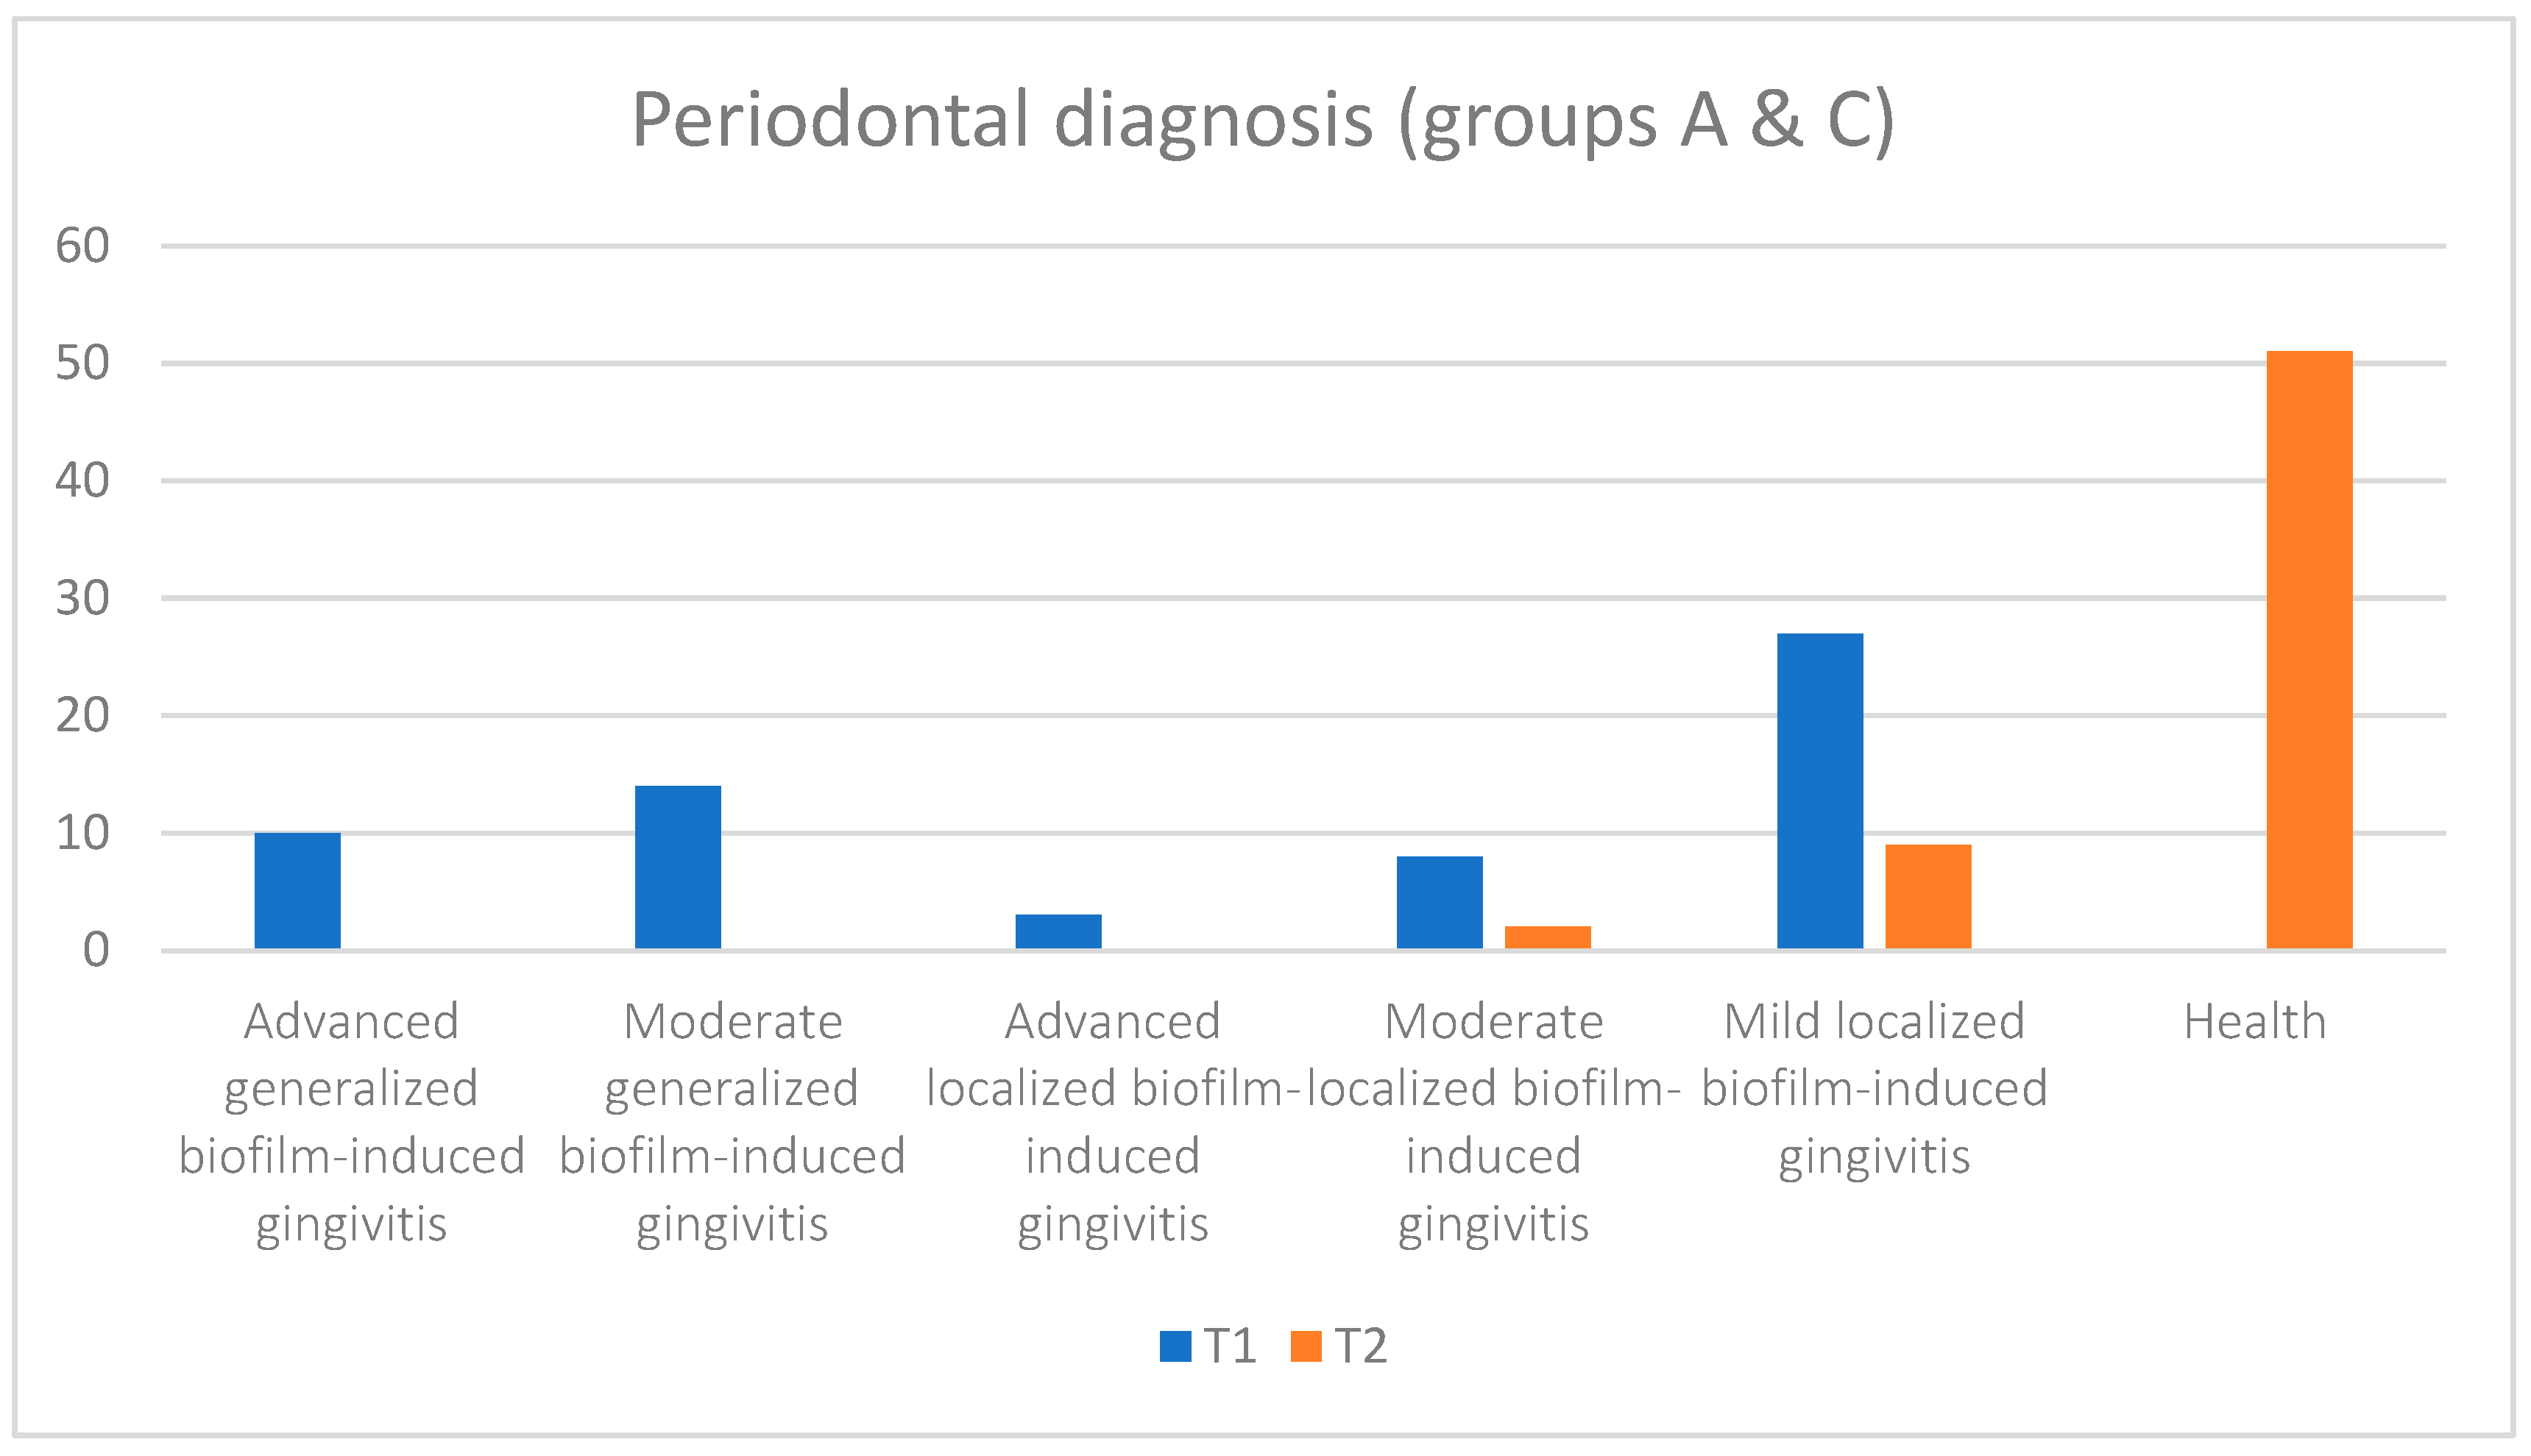
Figure 20.
Periodontal diagnosis for subjects from both groups A (subjects with cardiovascular disease) and C (subjects without cardiovascular disease) at initial (T1 = initial consultation) and final (T2 = three months after treatment) times.
Figure 20.
Periodontal diagnosis for subjects from both groups A (subjects with cardiovascular disease) and C (subjects without cardiovascular disease) at initial (T1 = initial consultation) and final (T2 = three months after treatment) times.
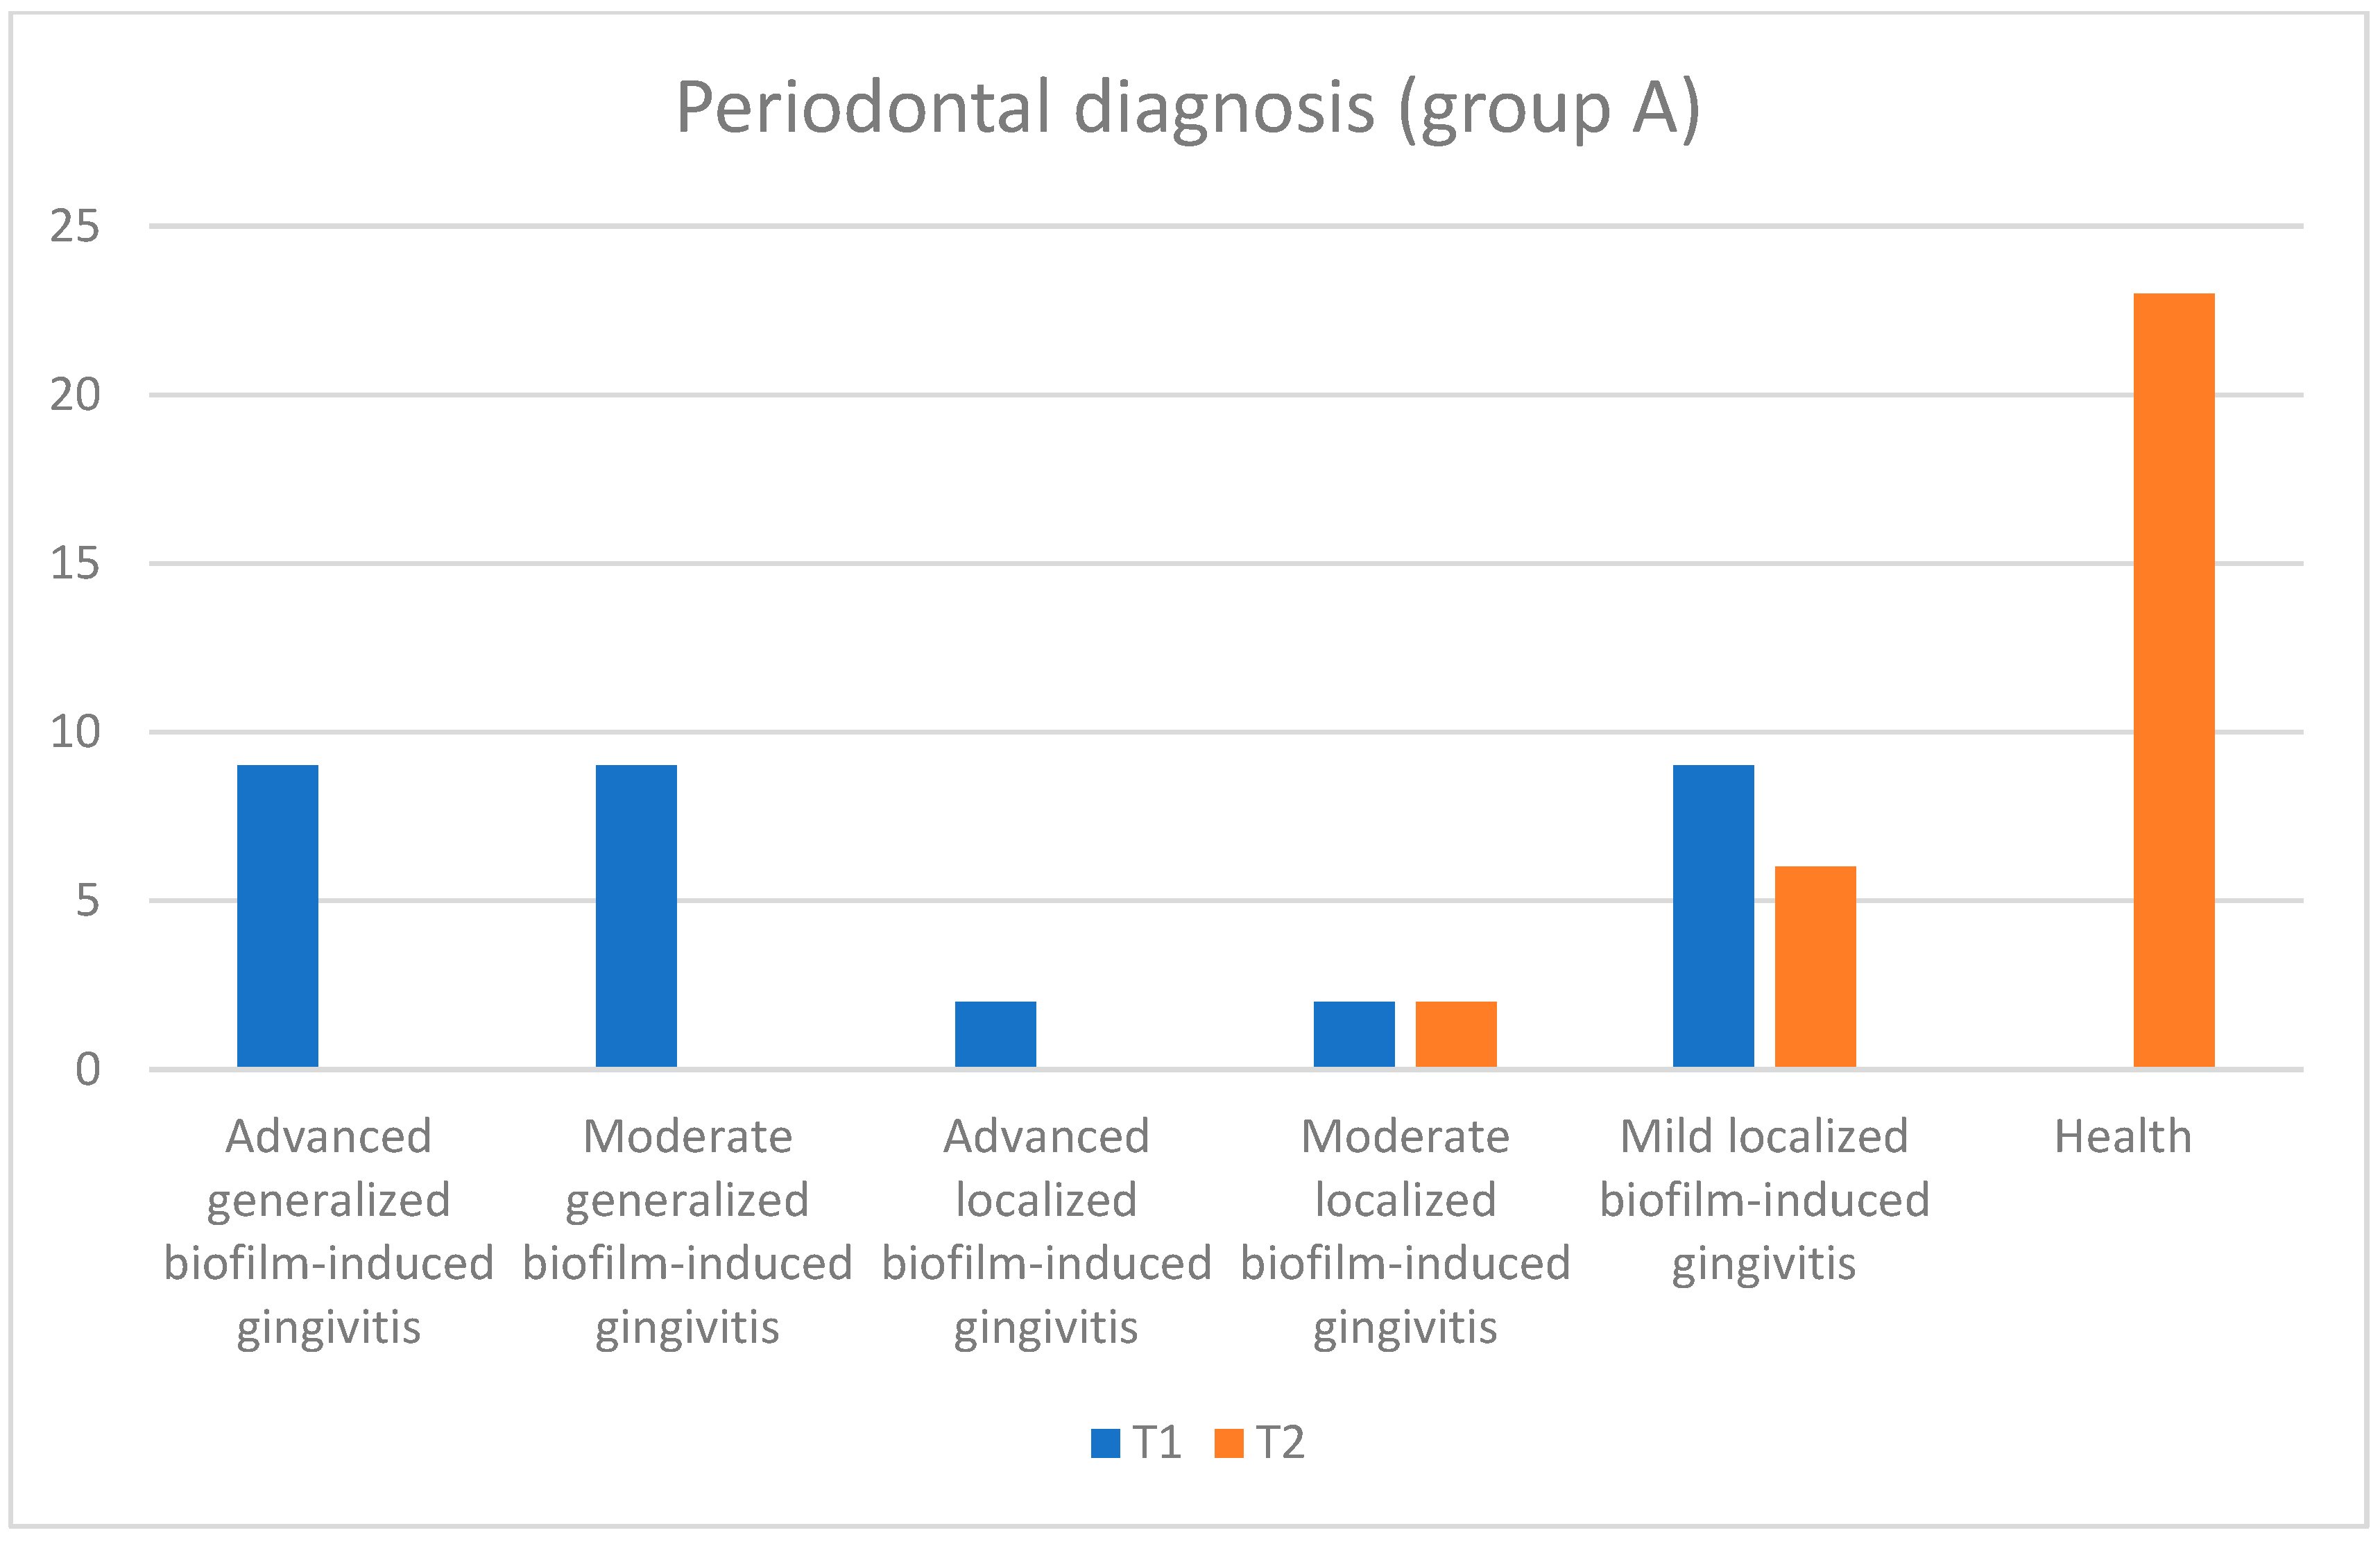
Figure 21.
Periodontal diagnosis for subjects in group A (subjects with cardiovascular diseases) at the initial (T1 = initial consultation) and final (T2 = three months after treatment) moments.
Figure 21.
Periodontal diagnosis for subjects in group A (subjects with cardiovascular diseases) at the initial (T1 = initial consultation) and final (T2 = three months after treatment) moments.
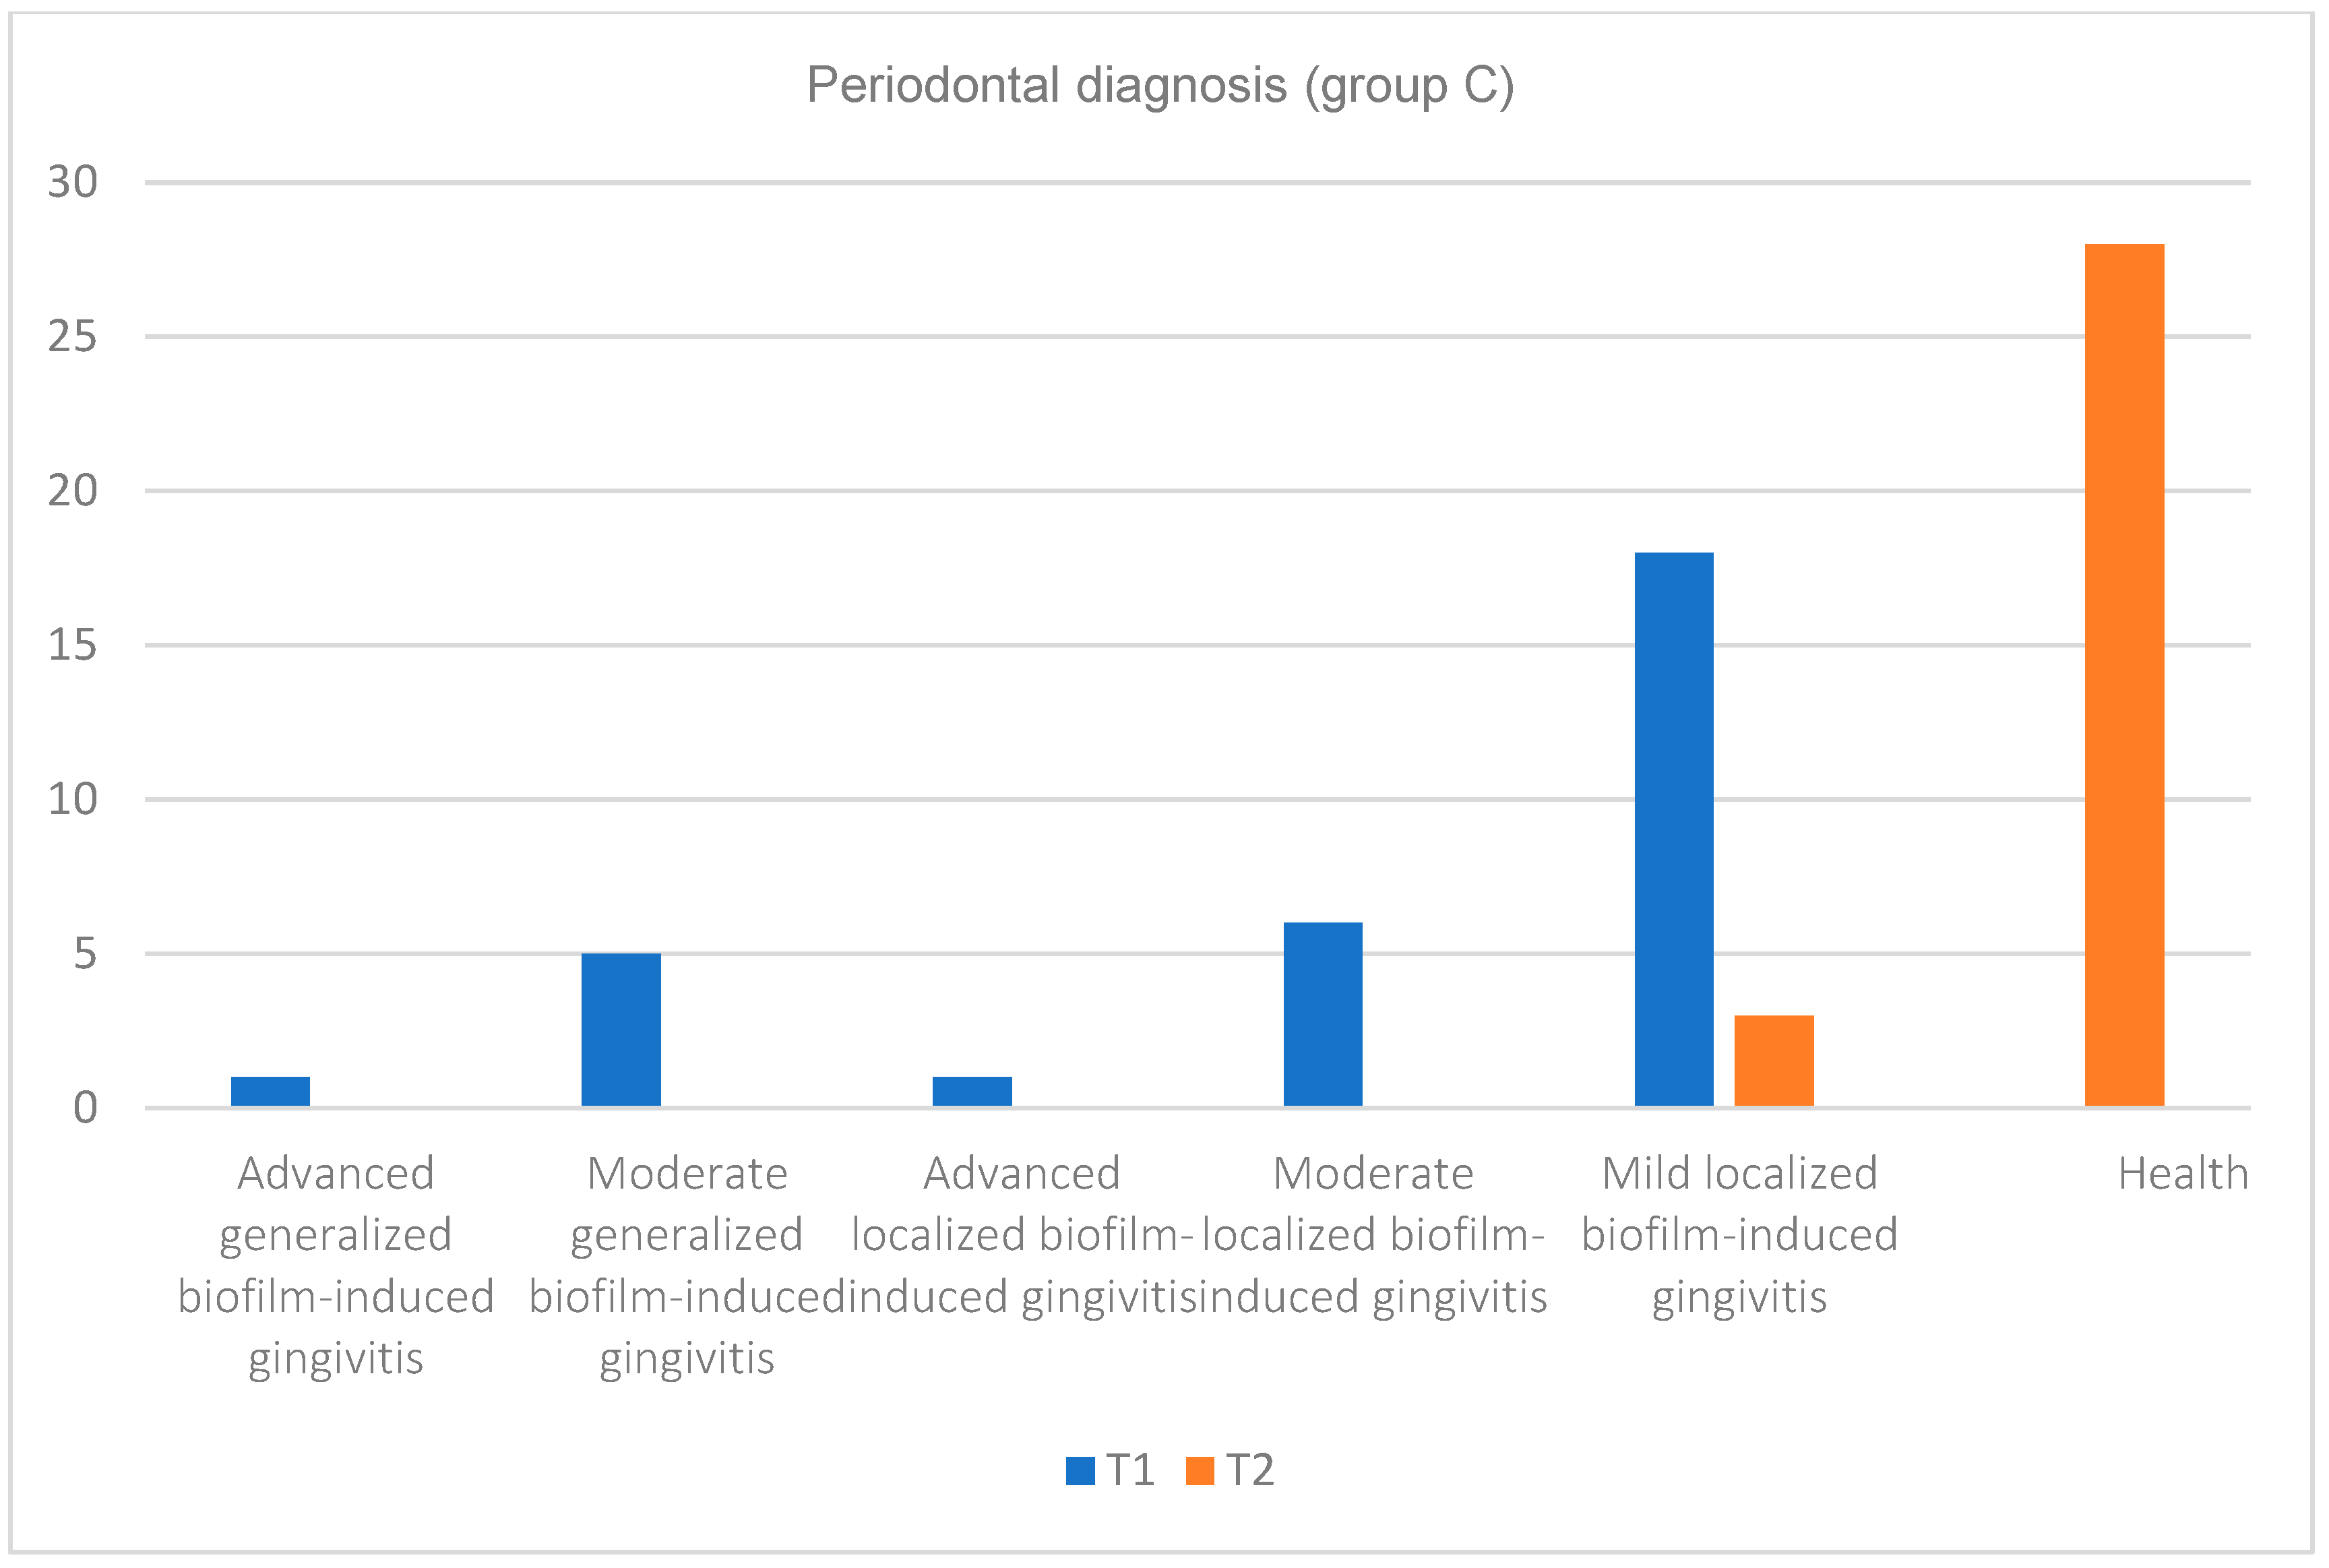
Figure 22.
Periodontal diagnosis for subjects in group C (subjects without cardiovascular disease) at the initial (T1 = initial consultation) and final (T2 = three months after treatment) moments.
Figure 22.
Periodontal diagnosis for subjects in group C (subjects without cardiovascular disease) at the initial (T1 = initial consultation) and final (T2 = three months after treatment) moments.
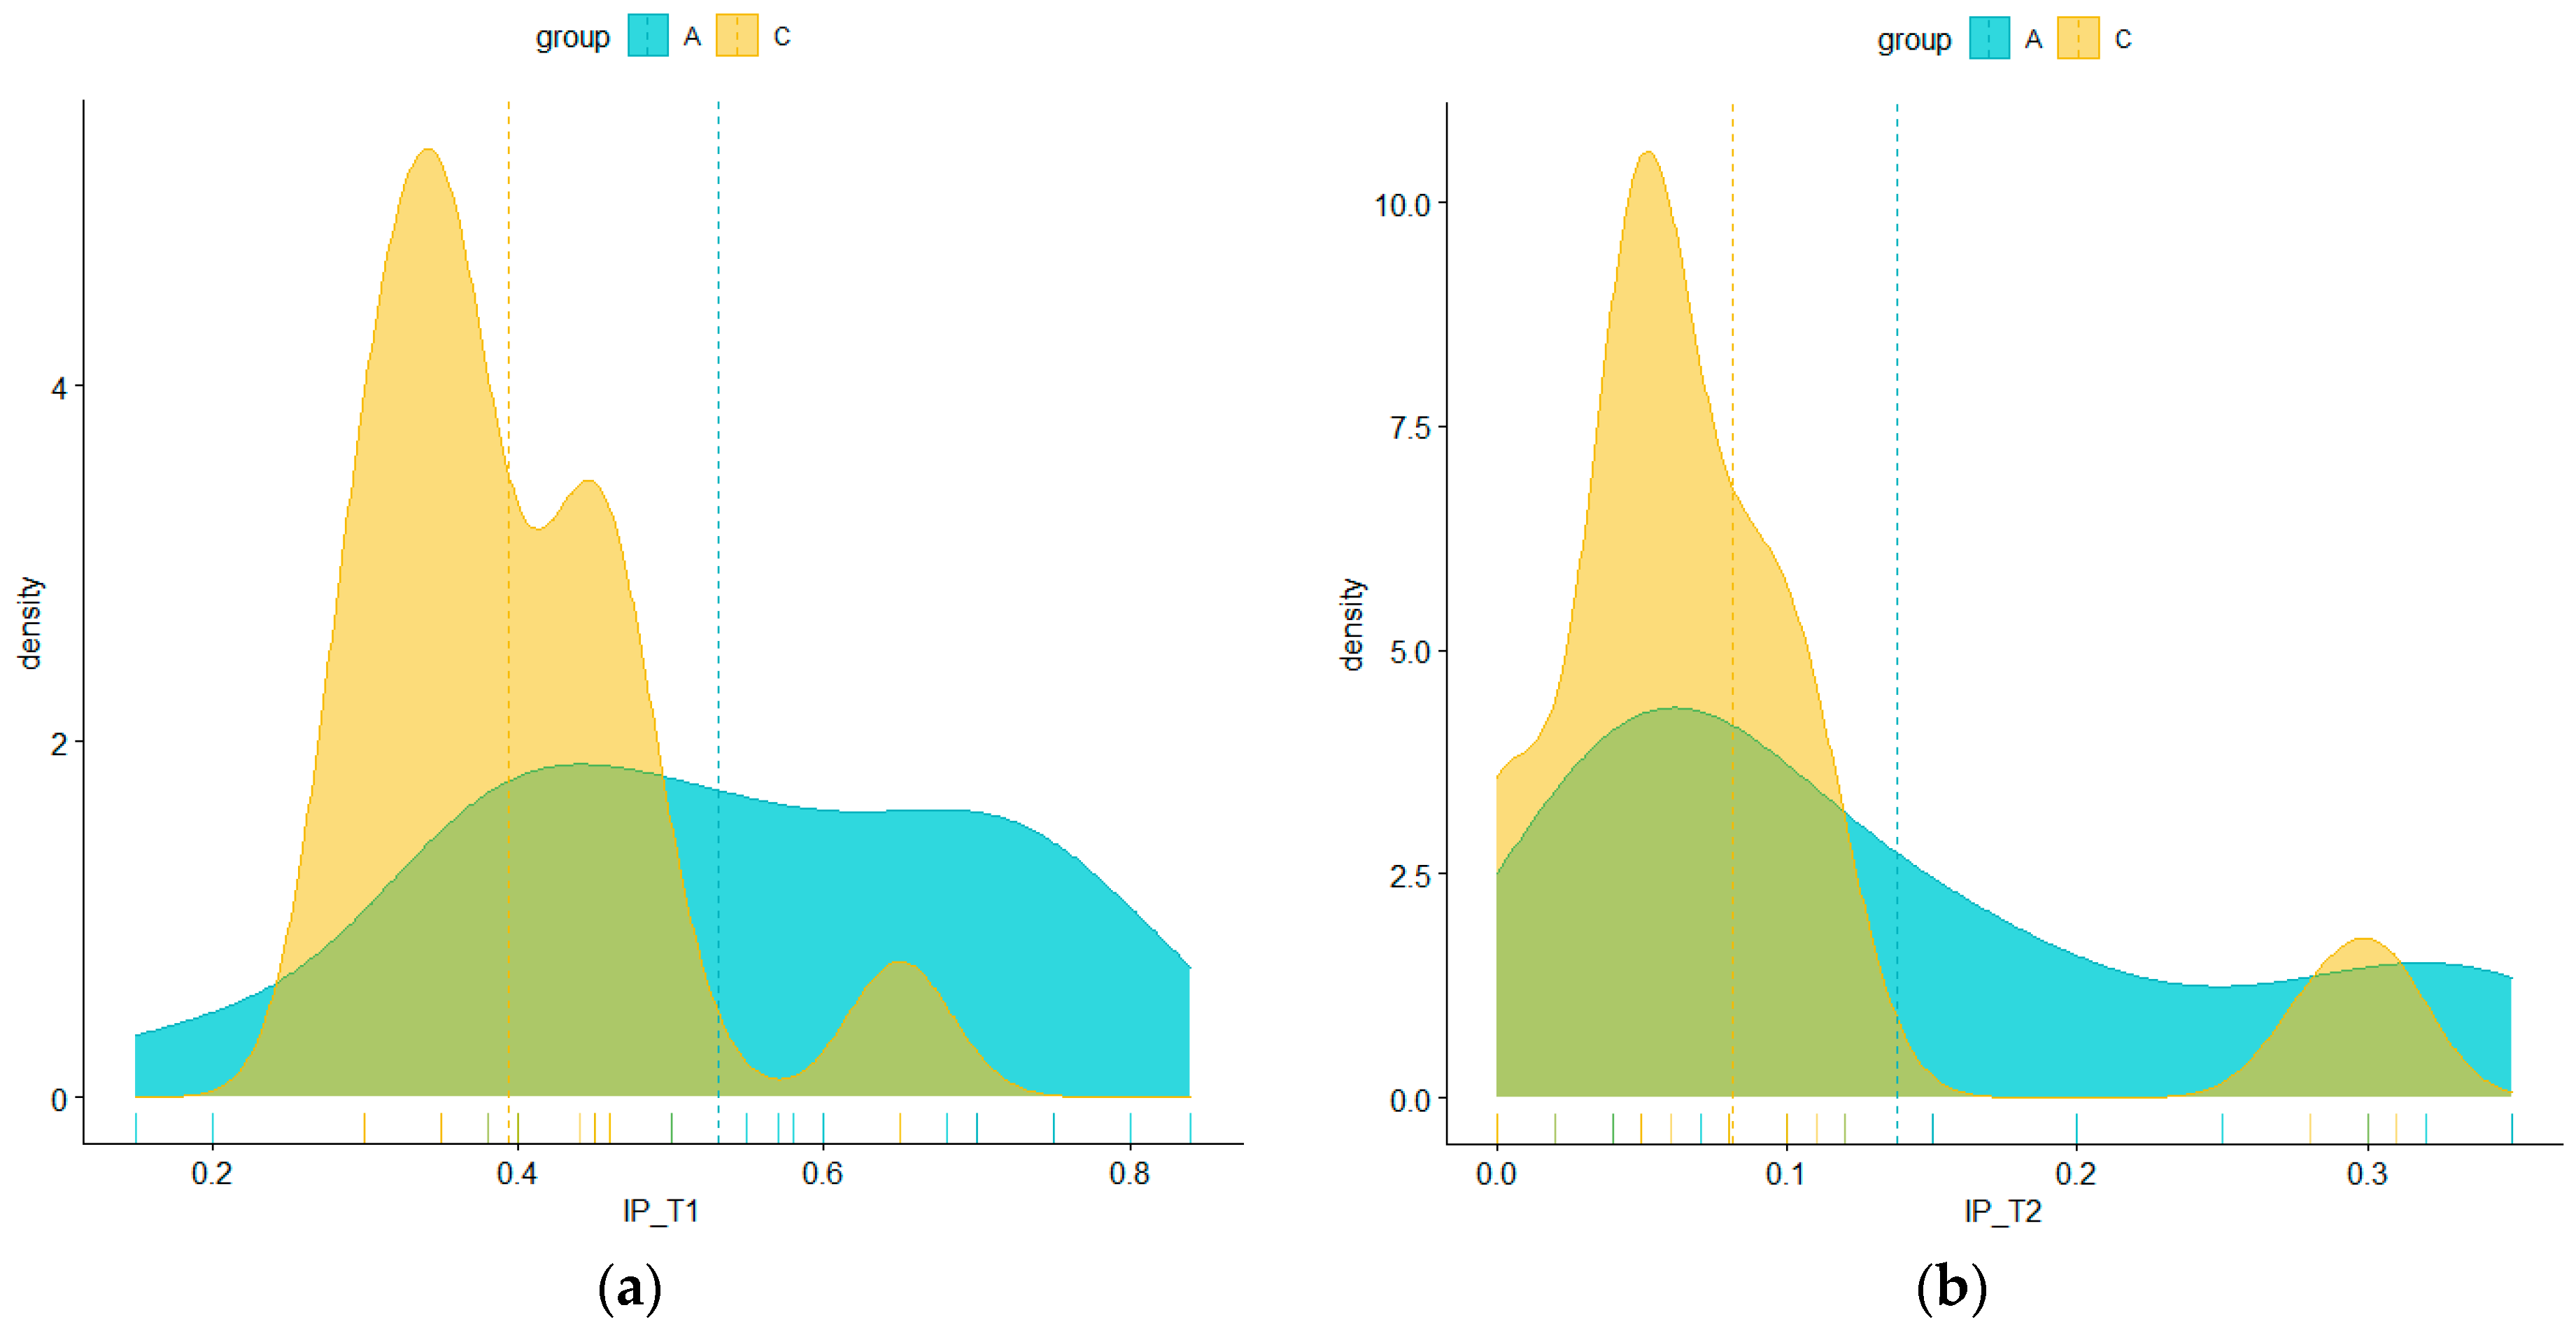
Figure 23.
Probability density estimated based on IP values in the two batches at T1 (initial consultation) (a) and T2 (three months after treatment) (b).
Figure 23.
Probability density estimated based on IP values in the two batches at T1 (initial consultation) (a) and T2 (three months after treatment) (b).
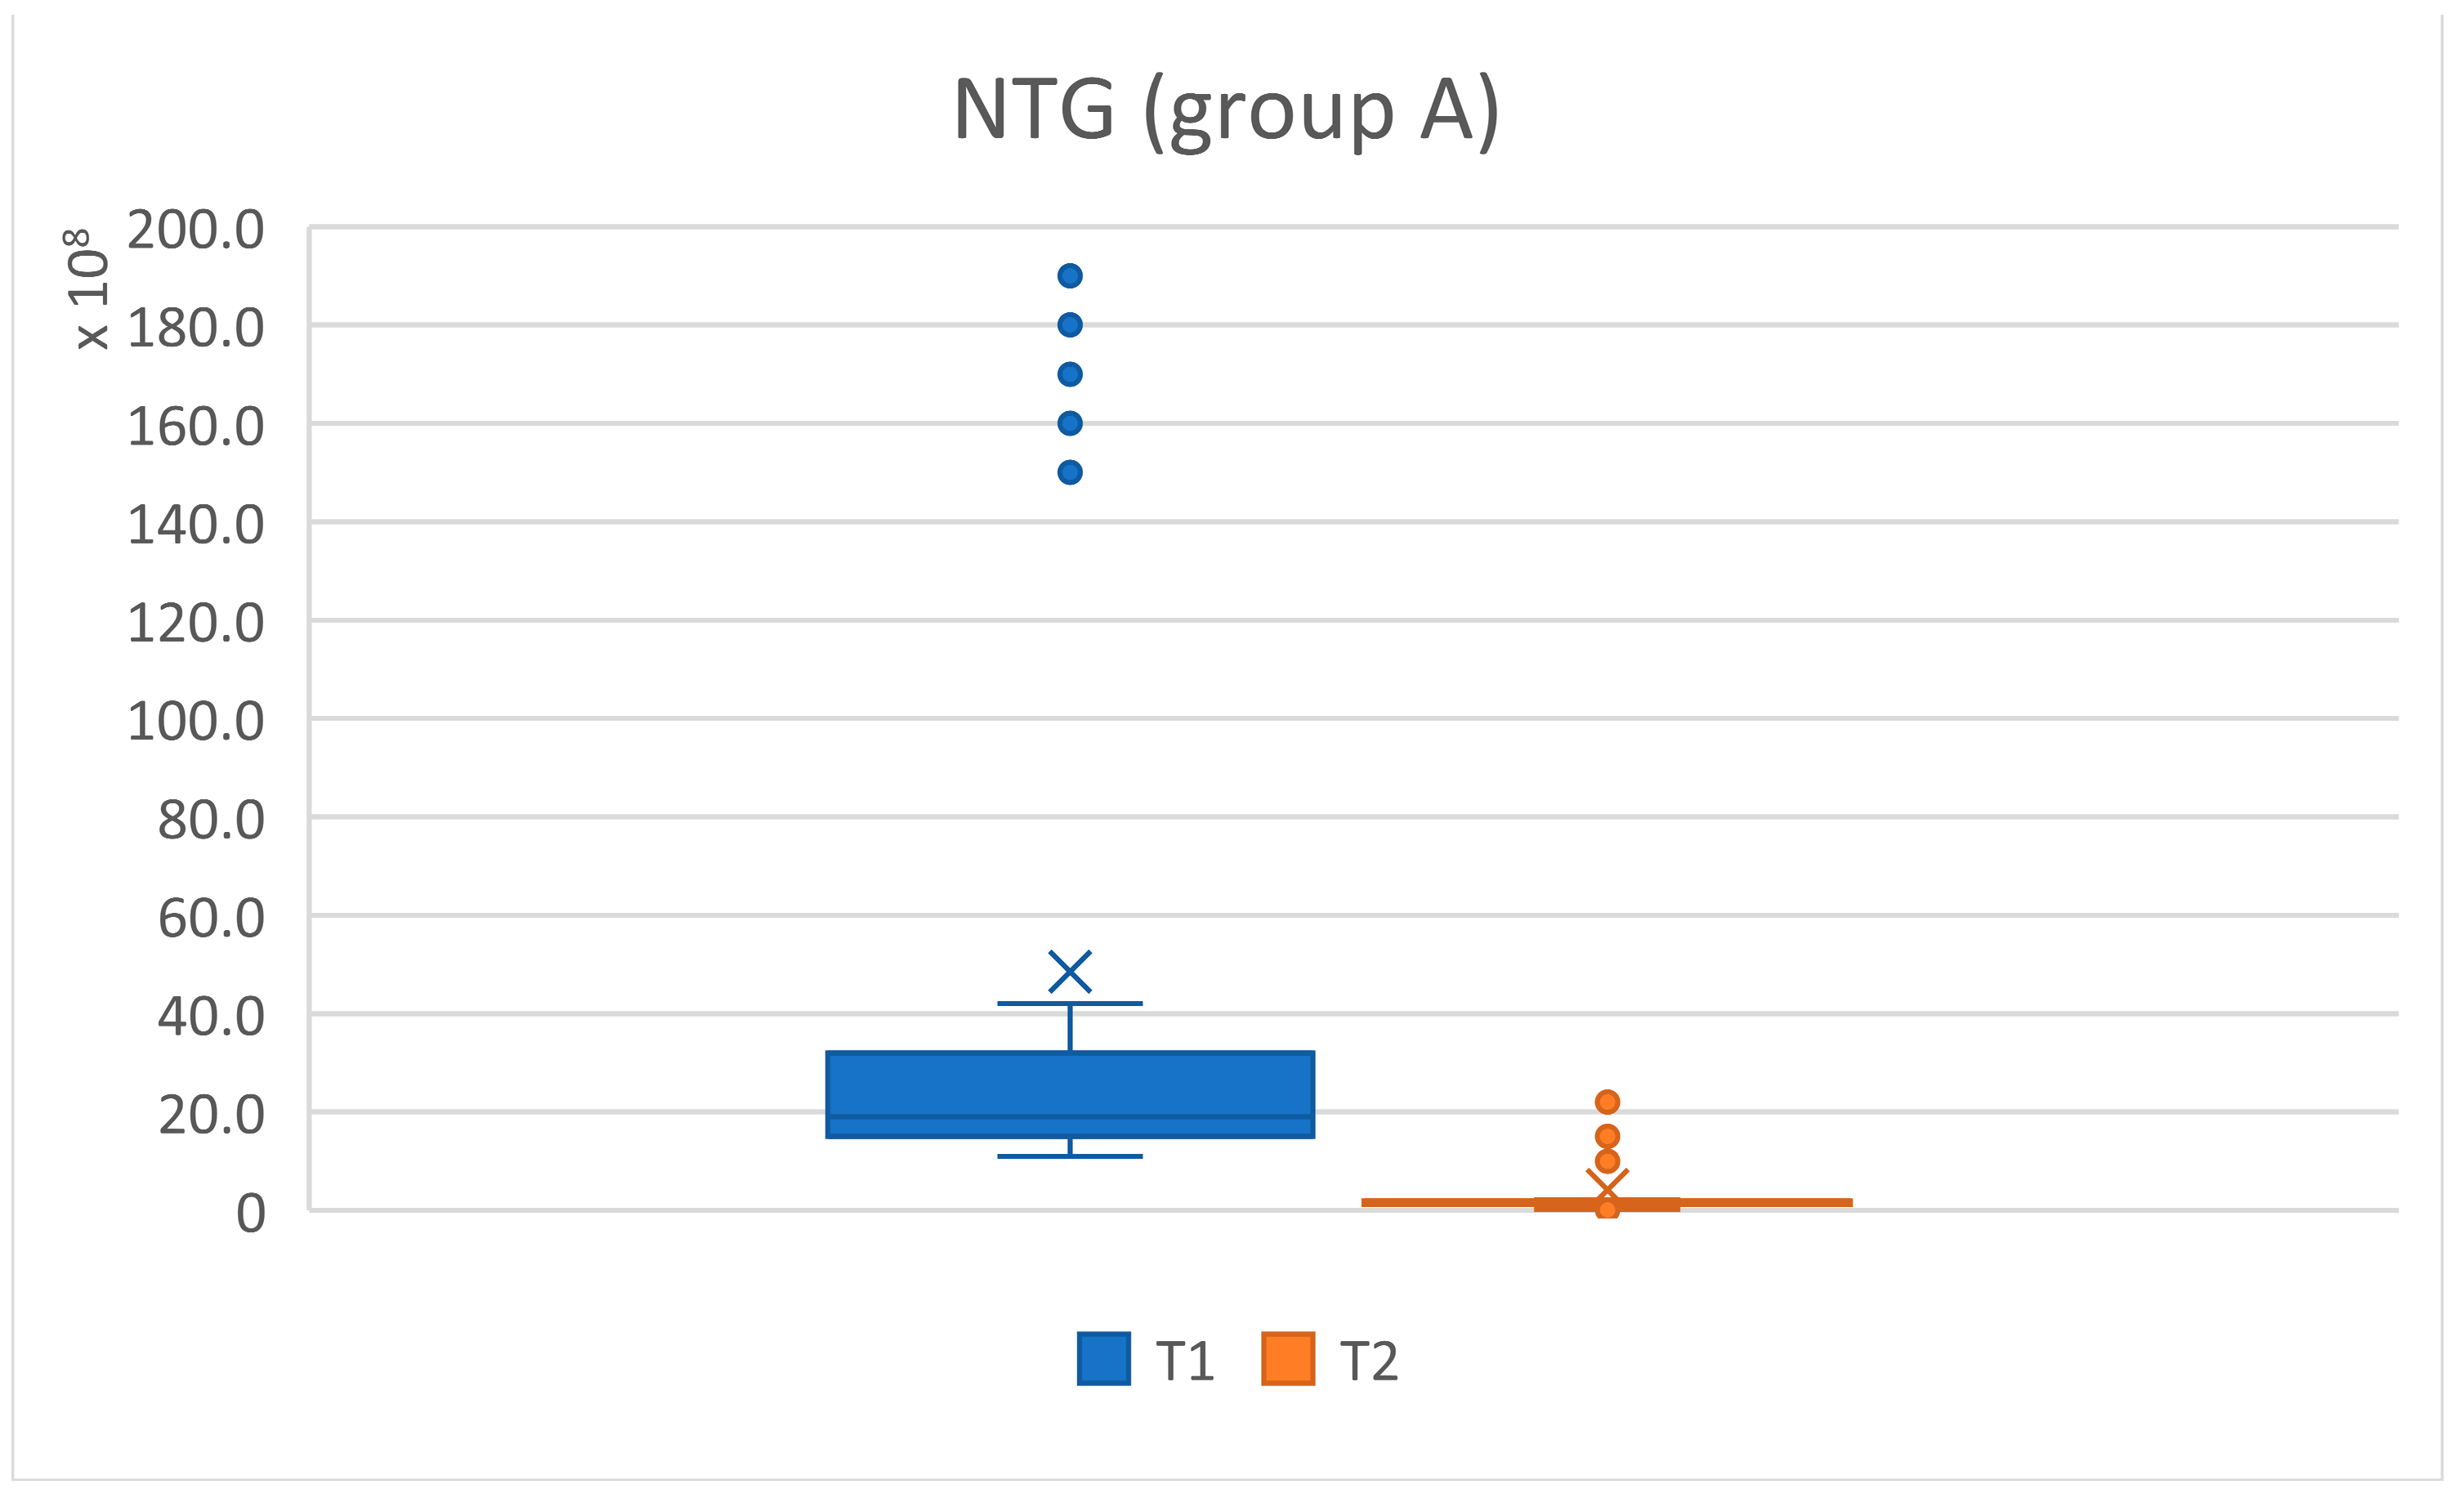
Figure 24.
NTG values for patient group A (subjects with cardiovascular diseases) at initial (T1 = initial consultation) and final (T2 = three months after treatment) times.
Figure 24.
NTG values for patient group A (subjects with cardiovascular diseases) at initial (T1 = initial consultation) and final (T2 = three months after treatment) times.
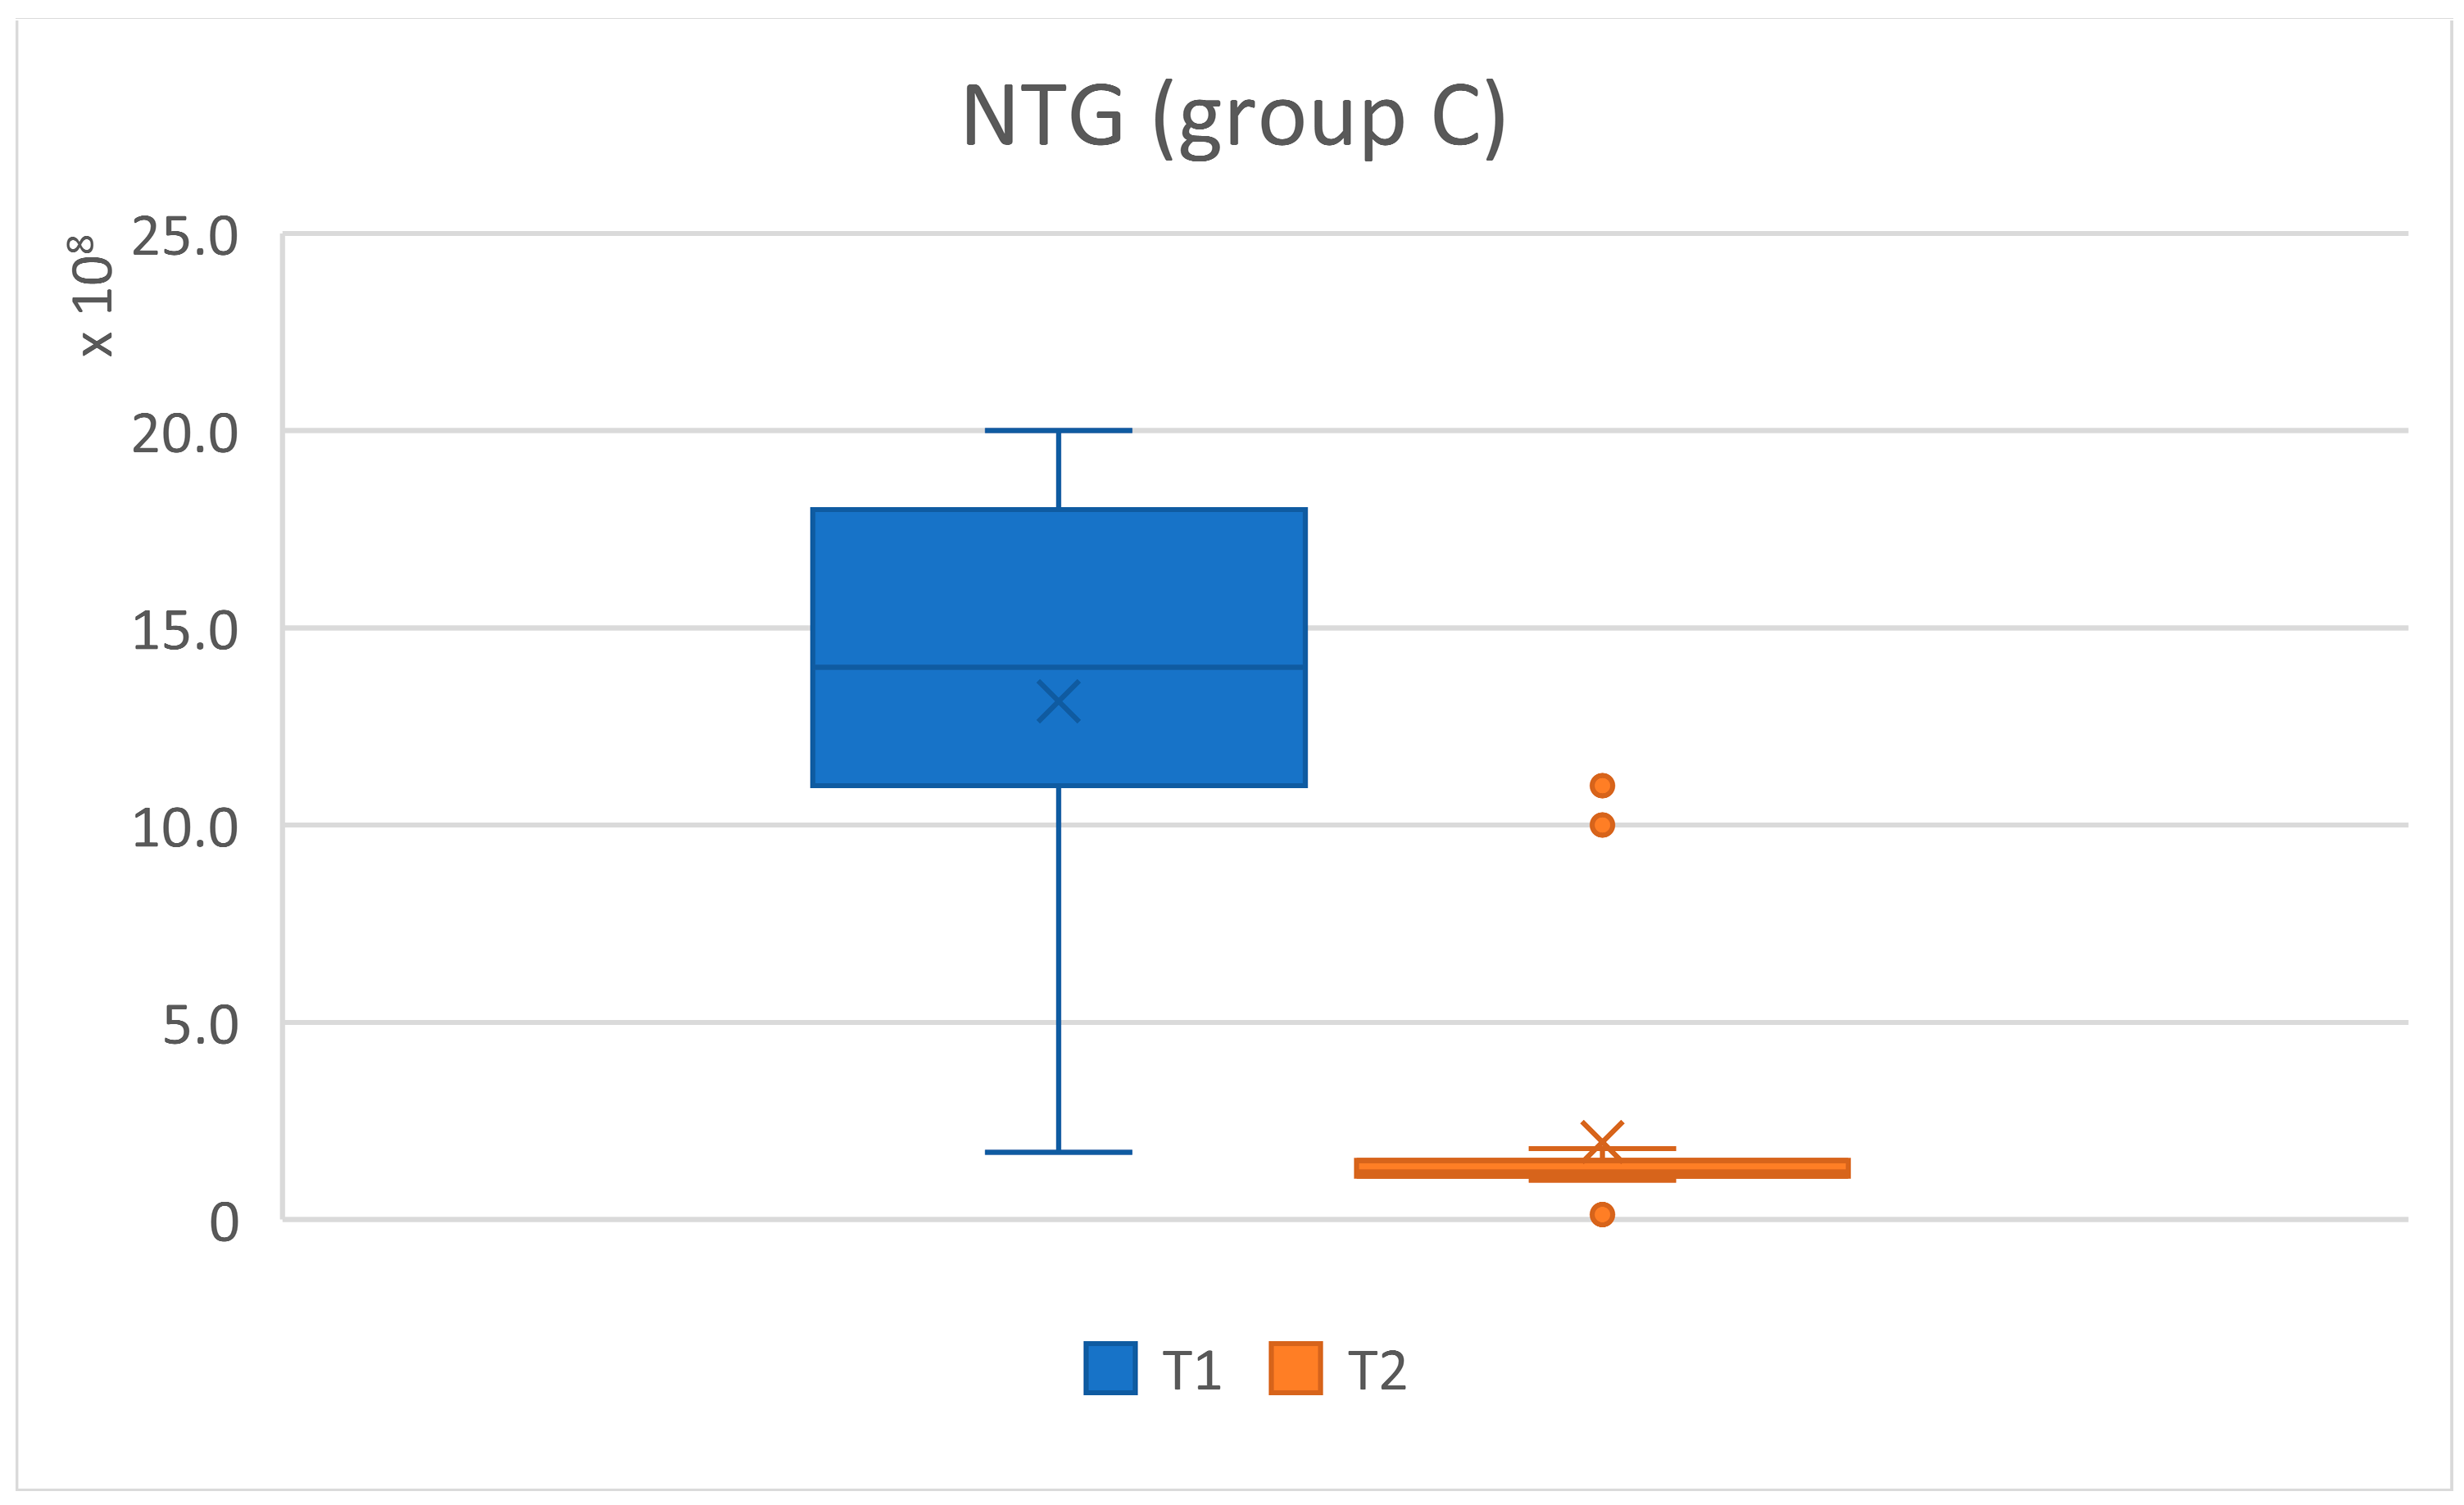
Figure 25.
NTG values for patient group C (subjects without cardiovascular disease) at initial (T1 = initial consultation) and final (T2 = three months after treatment) times.
Figure 25.
NTG values for patient group C (subjects without cardiovascular disease) at initial (T1 = initial consultation) and final (T2 = three months after treatment) times.
Figure 26.
NTG values for groups A (subjects with cardiovascular disease) and C (subjects without cardiovascular disease) at the initial (T1 = initial consultation) and final (T2 = three months after treatment) times.
Figure 26.
NTG values for groups A (subjects with cardiovascular disease) and C (subjects without cardiovascular disease) at the initial (T1 = initial consultation) and final (T2 = three months after treatment) times.
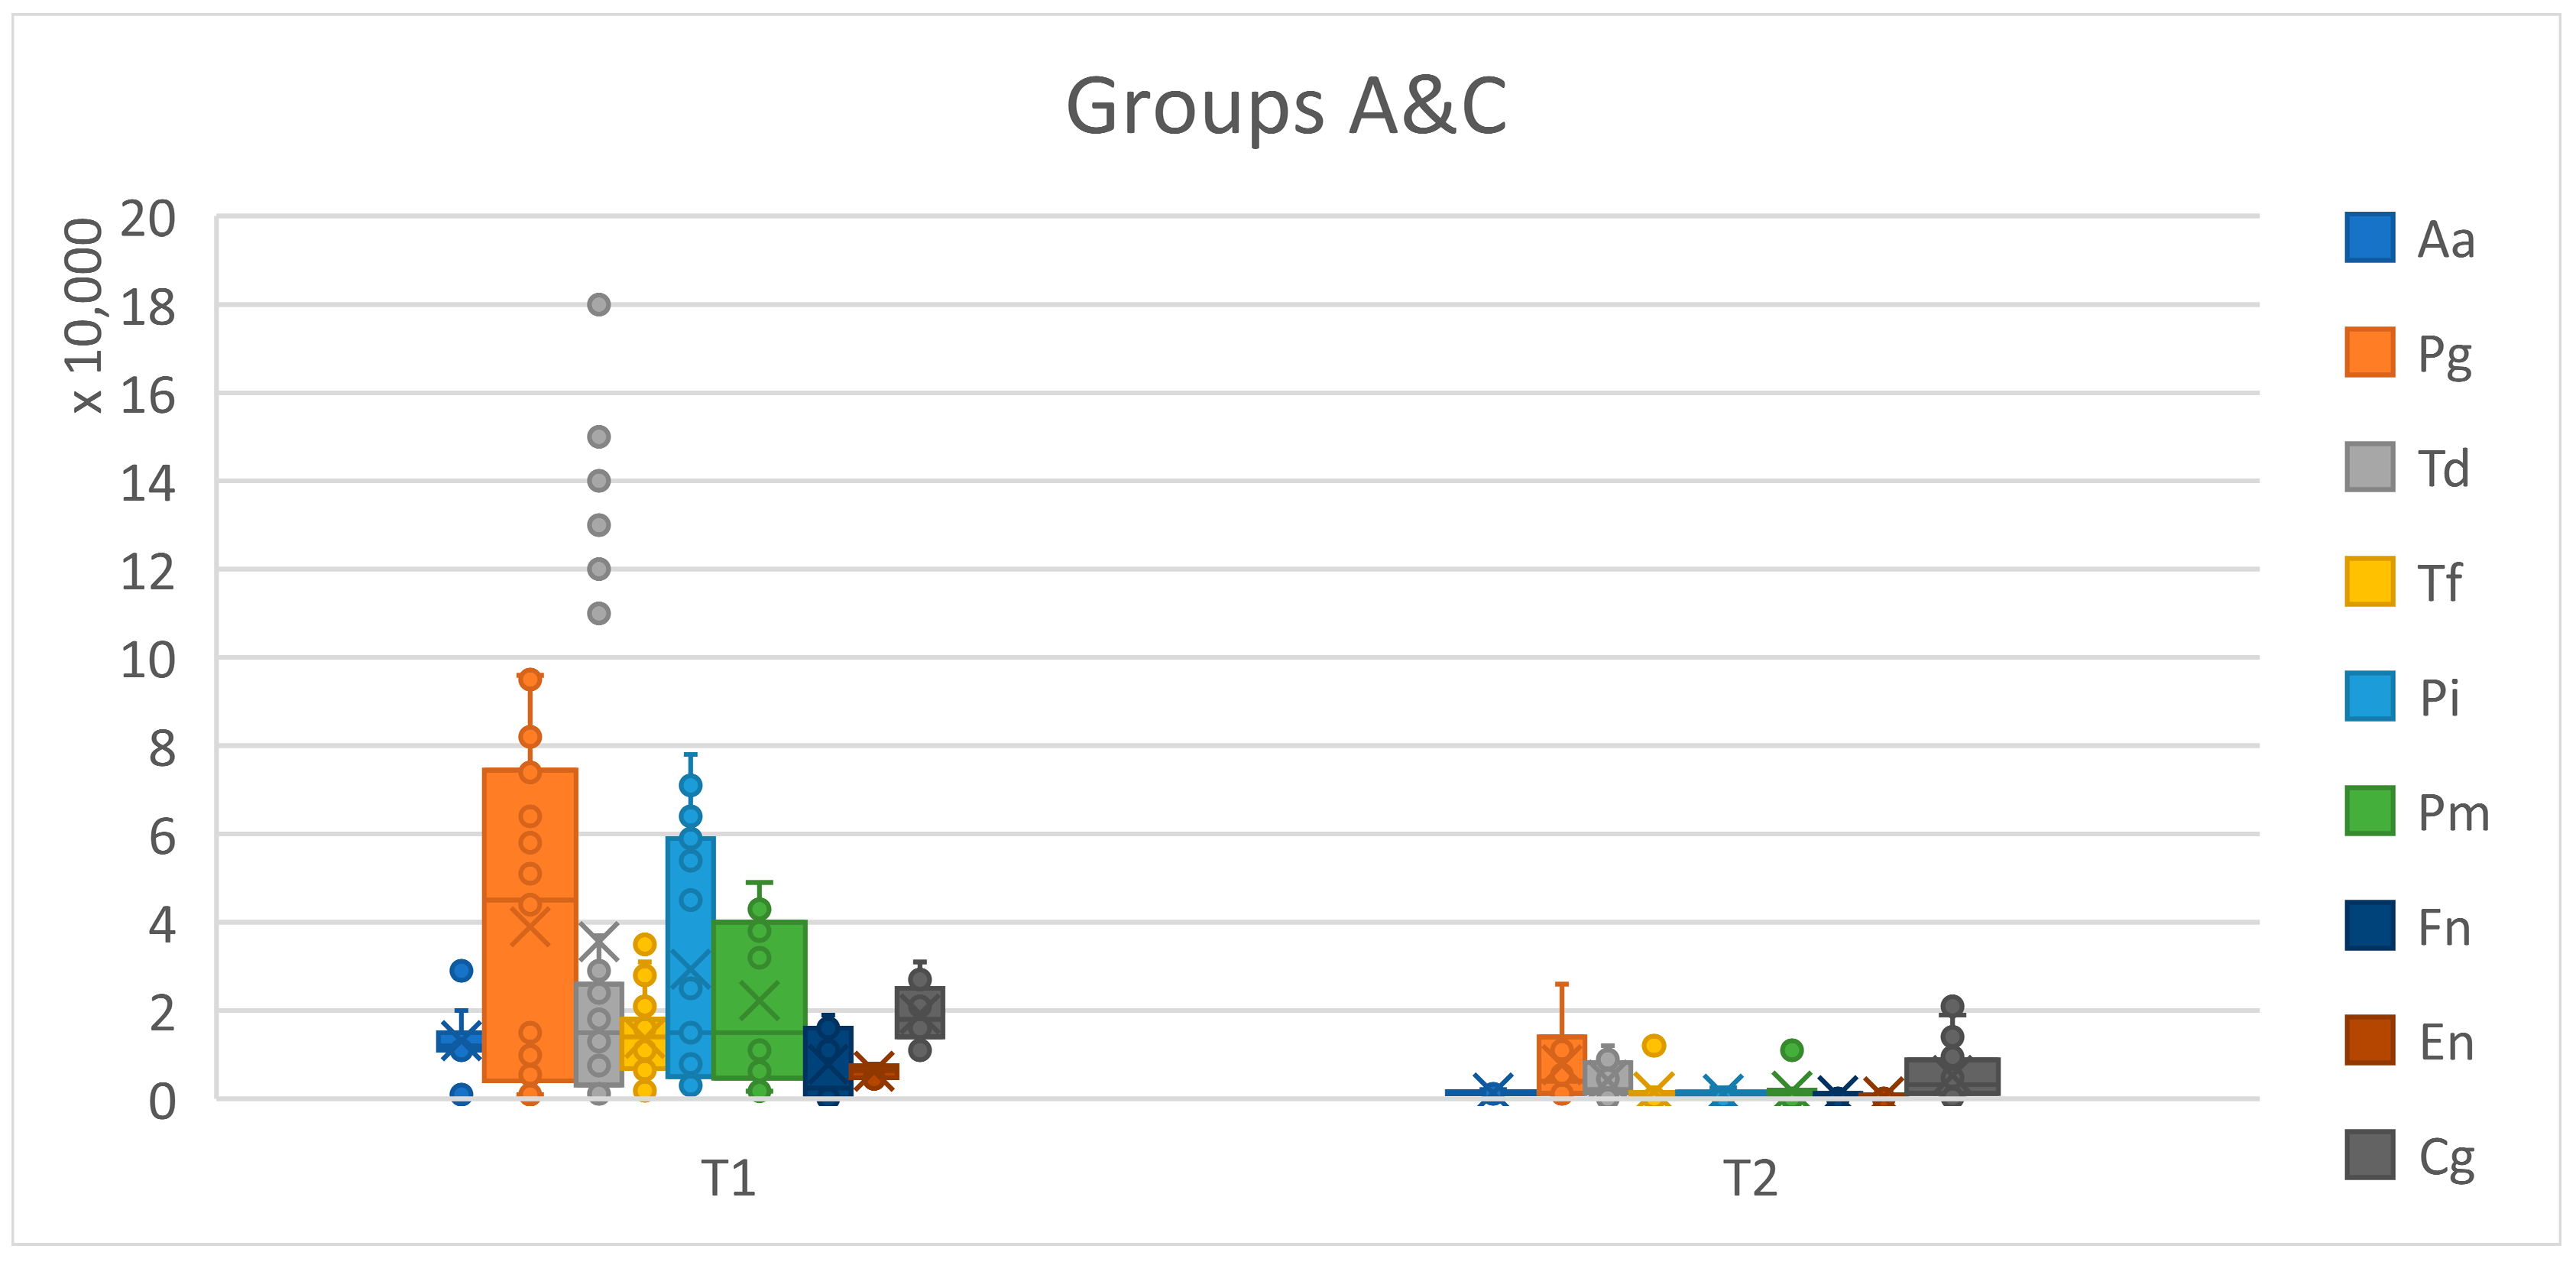
Figure 27.
Graphical representation showing the presence of periodontal pathogens at T1 and T2 (T1 = initial consultation; T2 = three months after treatment).
Figure 27.
Graphical representation showing the presence of periodontal pathogens at T1 and T2 (T1 = initial consultation; T2 = three months after treatment).
Table 1.
Summary of main statistical values for age of subjects.
Table 1.
Summary of main statistical values for age of subjects.
| | | Age |
|---|
| Groups | N | Min | 1st Qu. | Median | Mean | 3rd Qu. | Max |
|---|
| all | 62 | 7 | 10 | 13.5 | 13.13 | 16 | 17 |
| group A | 31 | 7 | 10.5 | 13 | 13.06 | 16 | 17 |
| group C | 31 | 7 | 10 | 14 | 13.19 | 16 | 17 |
Table 2.
Genders of subjects in each group.
Table 2.
Genders of subjects in each group.
| | | Gender |
|---|
| Groups | N | F | M |
|---|
| all | 62 | 26 | 41.94% | 36 | 58.06% |
| group A | 31 | 14 | 45.16% | 17 | 54.84% |
| group C | 31 | 12 | 38.71% | 19 | 61.29% |
Table 3.
Periodontal diagnosis at the initial (T1 = initial consultation) and final (T2 = three months after treatment) times.
Table 3.
Periodontal diagnosis at the initial (T1 = initial consultation) and final (T2 = three months after treatment) times.
| | | Periodontal Diagnosis | |
|---|
| | | Advanced Generalized Biofilm-Induced Gingivitis | Moderate Generalized Biofilm-Induced Gingivitis | Advanced Localized Biofilm-Induced Gingivitis | Moderate Localized Biofilm-Induced Gingivitis | Mild Localized Biofilm-Induced Gingivitis | Health |
|---|
| Groups | N | T1 | T2 | T1 | T2 | T1 | T2 | T1 | T2 | T1 | T2 | T1 | T2 |
|---|
| all | 62 | 10 | 0 | 14 | 0 | 3 | 0 | 8 | 2 | 27 | 9 | 0 | 51 |
| group A | 31 | 9 | 0 | 9 | 0 | 2 | 0 | 2 | 2 | 9 | 6 | 0 | 23 |
| group C | 31 | 1 | 0 | 5 | 0 | 1 | 0 | 6 | 0 | 18 | 3 | 0 | 28 |
Table 4.
Gingival index values per group.
Table 4.
Gingival index values per group.
| | | Gingival Index |
|---|
| | | Gums with Normal Appearance
(Cod 0) | Gums with Mild Inflammation
(Cod 1) | Gums with Moderate Inflammation
(Cod 2) | Gums with Advanced Inflammation
(Cod 3) |
|---|
| Groups | N | T1 | T2 | T1 | T2 | T1 | T2 | T1 | T2 |
|---|
| all | 62 | 0 | 51 | 26 | 9 | 23 | 2 | 13 | 0 |
| group A | 31 | 0 | 23 | 9 | 6 | 11 | 2 | 11 | 0 |
| group C | 31 | 0 | 28 | 17 | 3 | 12 | 0 | 2 | 0 |
Table 5.
Summary of the main statistical values for the IP parameter.
Table 5.
Summary of the main statistical values for the IP parameter.
| | | IP |
|---|
| | | Min | 1st Qu. | Median | Mean | 3rd Qu. | Max |
|---|
| Groups | N | T1 | T2 | T1 | T2 | T1 | T2 | T1 | T2 | T1 | T2 | T1 | T2 |
|---|
| all | 62 | 15.00% | 0.00% | 35.00% | 5.00% | 42.00% | 6.50% | 46.21% | 10.94% | 56.50% | 14.25% | 84.00% | 35.00% |
| group A | 31 | 15.00% | 2.00% | 40.00% | 5.00% | 50.00% | 10.00% | 53.06% | 13.77% | 70.00% | 20.00% | 84.00% | 35.00% |
| group C | 31 | 30.00% | 0.00% | 35.00% | 5.00% | 35.00% | 5.00% | 39.35% | 8.10% | 45.00% | 10.00% | 65.00% | 31.00% |
Table 6.
Results of Welch’s t statistical test, with comparisons between initial (T1) and final (T2) moments.
Table 6.
Results of Welch’s t statistical test, with comparisons between initial (T1) and final (T2) moments.
| | | IP |
|---|
| | | T1 | T2 | t | df | p Value | Signif |
|---|
| Groups | N | Mean | ±SD | Mean | ±SD |
|---|
| all | 62 | 46.21% | 15.67% | 10.94% | 9.94% | 14.97 | 102.28 | 1.28 × 10⁻²⁷ | **** |
| group A | 31 | 53.06% | 17.84% | 13.77% | 11.06% | 10.42 | 50.09 | 3.83 × 10⁻¹⁴ | **** |
| group C | 31 | 39.35% | 9.16% | 8.10% | 7.88% | 14.40 | 58.71 | 6.28 × 10⁻²¹ | **** |
Table 7.
Results of Welch’s t statistical test, showing comparisons between mean NTG values at initial (T1 = initial consultation) and final (T2 = three months after treatment) time points, **** Extremely strong evidence against the null hypothesis, *** Rather strong evidence against the null hypothesis.
| | | NTG |
|---|
| | | T1 | T2 | t | df | p Value | Signif |
|---|
| Groups | N | Mean | ±SD | Mean | ±SD |
|---|
| all | 62 | 3.08 × 10⁹ | 4.66 × 10⁹ | 3.05 × 10⁸ | 4.90 × 10⁸ | 4.66 | 62.35 | 0.0000169 | **** |
| group A | 31 | 4.85 × 10⁹ | 6.12 × 10⁹ | 4.13 × 10⁸ | 6.20 × 10⁸ | 4.02 | 30.62 | 0.000354 | *** |
| group C | 31 | 1.31 × 10⁹ | 5.86 × 10⁸ | 1.96 × 10⁸ | 2.83 × 10⁸ | 9.56 | 43.24 | 3.16 × 10⁻¹² | **** |
Table 8.
Results of Welch’s statistical t-test, showing comparisons between the prevalence of periodontal pathogens at the initial (T1) and final (T2) time points for groups A and C (A = subjects with cardiovascular disease; C = subjects without cardiovascular disease) (*** Rather strong evidence against the null hypothesis, **** Extremely strong evidence against the null hypothesis).
| | | | T1 | | T2 | t | df | p Value | Signif |
|---|
| Indicator | N | #n.n. | Mean/Val | ±SD | #n.n. | Mean | ±SD |
|---|
| Aa | 62 | 51/11Aa | 13,181.82 | 6896.64 | 57/5Aa | 1320 | 438.18 | 5.68 | 10.62 | 0.000191 | *** |
| Pg | 62 | 17/45 Pg | 38,984.44 | 34,805.29 | 44/18Pg | 7722.22 | 7493.81 | 5.70 | 52.95 | 5.35 × 10⁻⁷ | **** |
| Td | 62 | 16/46 Td | 35,613.04 | 50,352.79 | 26/36Td | 4206.94 | 3819.53 | 4.21 | 45.66 | 0.000117 | *** |
| Tf | 62 | 10/52 Tf | 13,707.69 | 7989.23 | 32/32Tf | 1529.33 | 2093.62 | 10.39 | 62.31 | 3.13 × 10⁻¹⁵ | **** |
| Pi | 62 | 25/37 Pi | 29,364.86 | 27,264.38 | 37/25Pi | 1032.40 | 724.93 | 6.32 | 36.08 | 2.60 × 10⁻⁷ | **** |
| Pm | 62 | 41/21 Pm | 22,266.67 | 17,722.06 | 46/16 | 1711.25 | 2588.38 | 5.24 | 21.11 | 3.33 × 10⁻⁵ | **** |
| Fn | 62 | 13/49 Fn | 7757.14 | 7825.23 | 45/17 | 719.41 | 586.28 | 6.25 | 49.53 | 9.41 × 10⁻⁸ | **** |
| En | 62 | 54/8 En | 6212.50 | 1389.18 | 57/5En | 410 | 610.04 | 10.33 | 10.27 | 9.47 × 10⁻⁷ | **** |
| Cg | 62 | 0/62 Cg | 19,258.06 | 6316.61 | 0/62Cg | 5285.32 | 5227.73 | 13.42 | 117.88 | 7.30 × 10⁻²⁴ | **** |
Table 9.
The prevalence of the 9 bacterial species among the patients included in the study, cumulatively and separately.
Table 9.
The prevalence of the 9 bacterial species among the patients included in the study, cumulatively and separately.
| Parameter | N (%) Patients Total Lot T1 | N (%) Patients Total Lot T2 | N (%) Patients Lot A T1 | N (%) Patients Lot A T2 | N (%) Patients Lot C T1 | N (%) Patients Lot C T2 |
|---|
| 11 (17.7%) | 5 (8.1%) | 7 (11.3%) | 4 (6.5%) | 4 (6.5%) | 1 (1.6) |
- 2.
Pg
| 45 (72.6%) | 18 (29.0) | 25 (40.3%) | 10 (16.1) | 20 (32.3%) | 8 (12.9%) |
- 3.
Td
| 46 (74.2%) | 36 (58.1%) | 26 (41.9) | 19 (30.6) | 20 (32.3%) | 19 (30.6) |
- 4.
Tf
| 52 (83.9%) | 32 (51.6%) | 26 (41.9) | 16 (25.8%) | 26 (41.9%) | 16 (25.8%) |
- 5.
Pi
| 37 (59.7%) | 25 (40.3%) | 20 (32.3%) | 13 (21.0%) | 17 (27.4%) | 12 (19.4%) |
- 6.
Pm
| 21 (33.9) | 16 (25.8%) | 12 (19.4%) | 9 (14.5%) | 9 (14.5%) | 7 (11.3%) |
- 7.
Fn
| 49 (79%) | 17 (27.4%) | 25 (40.3%) | 9 (14.5%) | 24 (38.7%) | 8 (12.9%) |
- 8.
Enc
| 8 (12.9%) | 5 (8.1%) | 5 (8.1%) | 3 (4.8%) | 3 (4.8%) | 2 (3.2%) |
- 9.
Cg
| 62 (100%) | 62 (100%) | 31 (50%) | 31 (50%) | 31 (50%) | 31 (50%) |


