Article

Seasonal Variation of Leaf Ca, Fe, and Mn Concentration in Six Olive Varieties

by
Ioanna Manolikaki
,
Nektaria Digalaki
,
Georgios Psarras
,
Constantinos Tzerakis
,
Chrysi Sergentani
,
Anastasia Papamanolioudaki
,
Safiye Tul
and
Georgios Koubouris
*
ELGO DIMITRA, Institute of Olive Tree, Subtropical Crops and Viticulture, 73134 Chania, Greece
*
Author to whom correspondence should be addressed.
Int. J. Plant Biol. 2022, 13(2), 95-105; https://doi.org/10.3390/ijpb13020010
Submission received: 6 April 2022 / Revised: 12 May 2022 / Accepted: 13 May 2022 / Published: 17 May 2022

Abstract

:
Leaf analysis is essential for diagnosing nutritional status and guiding fertilizer application. The present study aimed to investigate the appropriate time for leaf sampling and the effect of genotype on olive nutrition. We determined leaf nutrient concentrations of calcium (Ca), iron (Fe), and manganese (Mn) in five Greek (‘Amfissis’, ‘Chondrolia Chalkidikis’, ‘Koroneiki’, ‘Mastoidis’, and ‘Kalamon’) and one Spanish (‘Picual’) variety from May 2019 to April 2020. The concentrations of Ca, Fe, and Mn were significantly affected by genotype and season. The highest concentrations for all nutrients were determined in April, while the lowest were in May, June, and October. Leaf Ca concentration significantly increased progressively from May to September for all the varieties. Leaves of ‘Koroneiki’ had the highest Ca concentration. Iron concentrations were within the sufficiency thresholds for all the varieties during the whole experimental period, and ‘Mastoidis’ showed the highest concentration. Leaf Mn concentration for all the varieties increased from May to September with an instant decrease in June, apart from ‘Amfissis’. The varieties ‘Kalamon’ and ‘Chondrolia Chalkidikis’ were found to be above the Mn sufficiency threshold throughout the year. Variations among season and genotype depict the complexity of nutrient transportation in leaf tissues.

1. Introduction

More than 90% of global olive cultivation is realized in the Mediterranean countries that are characterized by hot, dry summers and cold, wet winters [1,2]. Management intensification has led to increased oil production in the recent decades [3]. Olive tree development and yield are dependent on essential nutrients such as C, H, O, N, P, K, Ca, Mg, S, Fe, Zn, Mn, Mo, Cu, B, Ni, Si, Co, Na, and Cl, [4]. Apart from C and O, all the nutrients are absorbed via the soil’s solution while being removed from olive orchards via fruit harvest and pruning [5]. The same authors observed that the amounts of nitrogen, potassium, and calcium removed annually by pruning and fruit yield were 54.4, 45.5, and 57.9 kg ha−1, respectively, while for phosphorus and magnesium, they were less than 7 kg ha−1, in mature olive trees growing under rainfed conditions. In the same study, micronutrient removal was less than 0.12 kg ha−1. Although N, K, and Ca are taken up in the most considerable amounts, all the elements are essential for plants. Applying the most deficient nutrient is usually enough to anticipate the deficiency problem even if several nutrients are in the range of deficiency or adequacy [6].
The olive tree is characterized by different phases of development, supporting an intense vegetative growth. Fluctuations of nutrient concentration during the growing season are dependent on these phases of development. The occurrence and duration of each phenological stage vary and are different for each genotype, area, and season [7]. Presently, leaf analysis is an essential tool for olive fertilization scheduling. Specifically, the leaf is one of the most important metabolic organs where all chemical alterations due to fertilization occur [8]. However, the soil properties provide an indirect indication of plant nutrition due to the complexes and precipitations of nutrients, transformation from one form to another, high or low mobility, and interaction with the microbiological environment [9].
Available information on the nutritional requirements of olive varieties is limited. Several studies have been realized using one variety [8,10,11,12,13,14], although few studies have compared the seasonal variation of nutrients in a range of varieties [15,16]. However, the relationship between leaf seasonal variation and availability of nutrients supplied from the soil have indicated that nutrient uptake during the cold winter months is reduced due to low tree activity under Mediterranean conditions. The appropriate time for leaf sampling to determine mineral element content is still unclear. Fernandez-Escobar [6] has proposed that leaf analysis should be held in July in the northern hemisphere using fully expanded leaves of the current season growth. On the other hand, autumn leaf analysis is more convenient for deciding on winter fertilization. Seasonal monitoring of leaf nutrient concentration for a range of varieties is necessary to understand the chemical alterations in olive nutrition that are dependent on each genotype’s physiology.
Moreover, nutrient concentration fluctuations have been observed to be related to meteorological conditions. Air temperature and humidity significantly influenced element mobility and absorption by the trees [8]. A previous study [8] reported low levels of Mn concentration during the winter, coinciding with a period of low temperatures, which reduced the absorption of this element by the trees. Moreover, the same authors observed lower concentrations of leaf P in April and May and higher concentrations during the winter, supporting the theory that P increase is detected when soil temperature and humidity are also augmented.
Irrigation is another critical parameter for the cultivation of olive trees. Rainfed management of olive orchards is the most common globally [1], although yields are lower when compared to irrigated farms, especially in environments with low precipitation [17]. Water is the most critical factor for nutrient uptake since its availability is reduced during the long dry summer [11]. The timing of fertilization in rainfed orchards is highly dependent on rainfall events. Mineral fertilizers are commonly applied in winter or early spring, and are designed to take advantage of rainfall events to transport minerals into the root zone in the Mediterranean areas.
One of the most crucial parameters for nutrient deficiencies is the soil physicochemical characteristics that are responsible for the availability of a specific nutrient. A soil with characteristics of sand 20–75%, silt 5–35%, and clay 5–35% with pH 7–8, organic matter >1%, nitrogen >0.10%, available phosphorus (P2O5) 5–35 ppm, exchangeable potassium (K2O) 50–150 ppm, exchangeable calcium (CaCO3) 1650–5000 ppm and exchangeable magnesium 10–200 ppm is suitable for olive cultivation [18]. Calcium deficiency is common in acidic soils. On the contrary, chlorosis caused by iron deficiency is a nutritional problem that negatively affects olive tree growth in calcareous soils. Information for Fe levels is scarce due to the inconsistent separation of chlorotic and non-chlorotic leaves [19]. However, a comparative study of Fe leaf concentration among varieties could be a useful resource for guiding fertilizer applications. Iron deficiency appears in the youngest leaves since iron is not highly mobile within the plant [19]. Iron deficiency is not corrected easily; thus, selecting a tolerant variety is a potential solution [6]. Manganese does not constitute a common nutritional problem in olive trees, although soil blockage derived from nutrient interaction could be a factor in the low availability of this element [5]. Symptoms of manganese deficiency are observed in recently-matured leaves [19].
The tendency to suggest the summer sampling of olive leaves as being more representative in relation to the sampling after the end of the growing season, which has been applied worldwide for several decades, has prevailed in the Spanish literature in recent years. The studies that have highlighted this tendency mainly focused on local olive varieties and soil types. In addition, the limited studies on Greek varieties in terms of nutrition mostly have used young and not productive trees. In addition, most studies have been implemented in potted plants.
Considering the poor background on mineral element interactions, the objective of the present study was to discuss whether the time variation of three nutrients (Ca, Fe, and Mn) was influenced by the genotype, as well as to detect possible nutritional problems among varieties during one olive growing season. In order to eliminate the soil and climatic parameters and highlight the genotypic effect on the nutritional status of olives, the present study focused on the seasonal fluctuations of leaf Ca, Fe, and Mn concentrations in 50-year-old trees of five Greek (‘Amfissis’, ‘Chondrolia Chalkidikis’, ‘Koroneiki’, ‘Mastoidis’, and ‘Kalamon’) and one Spanish (‘Picual’) variety during an “off” year, cultivated in the same field, in a soil composed of low organic matter, with the same fertilizing practices under rainfed conditions.

2. Materials and Methods

2.1. Experimental Site and Plant Material

Leaf samples of six olive varieties (‘Amfissis’, ‘Chondrolia Chalkidikis’, ‘Kalamon’, ‘Koroneiki’, ‘Mastoidis’, and ‘Picual’) were employed for this study in 2019 and 2020. Rainfed, 50 year-old olive trees spaced at 8 × 8 m and grown at the National Olive Germplasm Bank of Greece, located at Chrisopigi area (35°29′24″ N, 24°01′33″ E) near the Institute of Olive Tree, Subtropical Crops and Viticulture, ELGO-DIMITRA (Chania, Crete, Greece), were selected for the experiment. The mean air temperature was 17.8 °C, relative humidity was 69.6%, and annual rainfall was 680 mm in 2019. The hottest month of 2019 was August, with a mean atmospheric temperature of 25.2 °C. February was the coldest month, with an average temperature of 10.3 °C. The mean annual rainfall in 2019 was 680.8 mm. The highest rainfall in 2019 was observed in February, with an average of 334.6 mm, while the driest months were June, August, and September at 0 mm. The mean air temperature was 18.6 °C, relative humidity was 62.2%, and annual rainfall was 558 mm in 2020. The hottest month of 2020 was August, with a mean atmospheric temperature of 26.6 °C. January was the coldest month, with an average temperature of 10.4 °C. The mean annual rainfall in 2020 was 558.4 mm. The highest rainfall in 2020 was observed in October, with an average of 196.4 mm, while the driest months were June, August, and September at 0 mm (ELGO-DIMITRA meteorological station, Chania, Greece). Meteorological data are presented in Figure 1.

2.2. Soil Physicochemical Properties

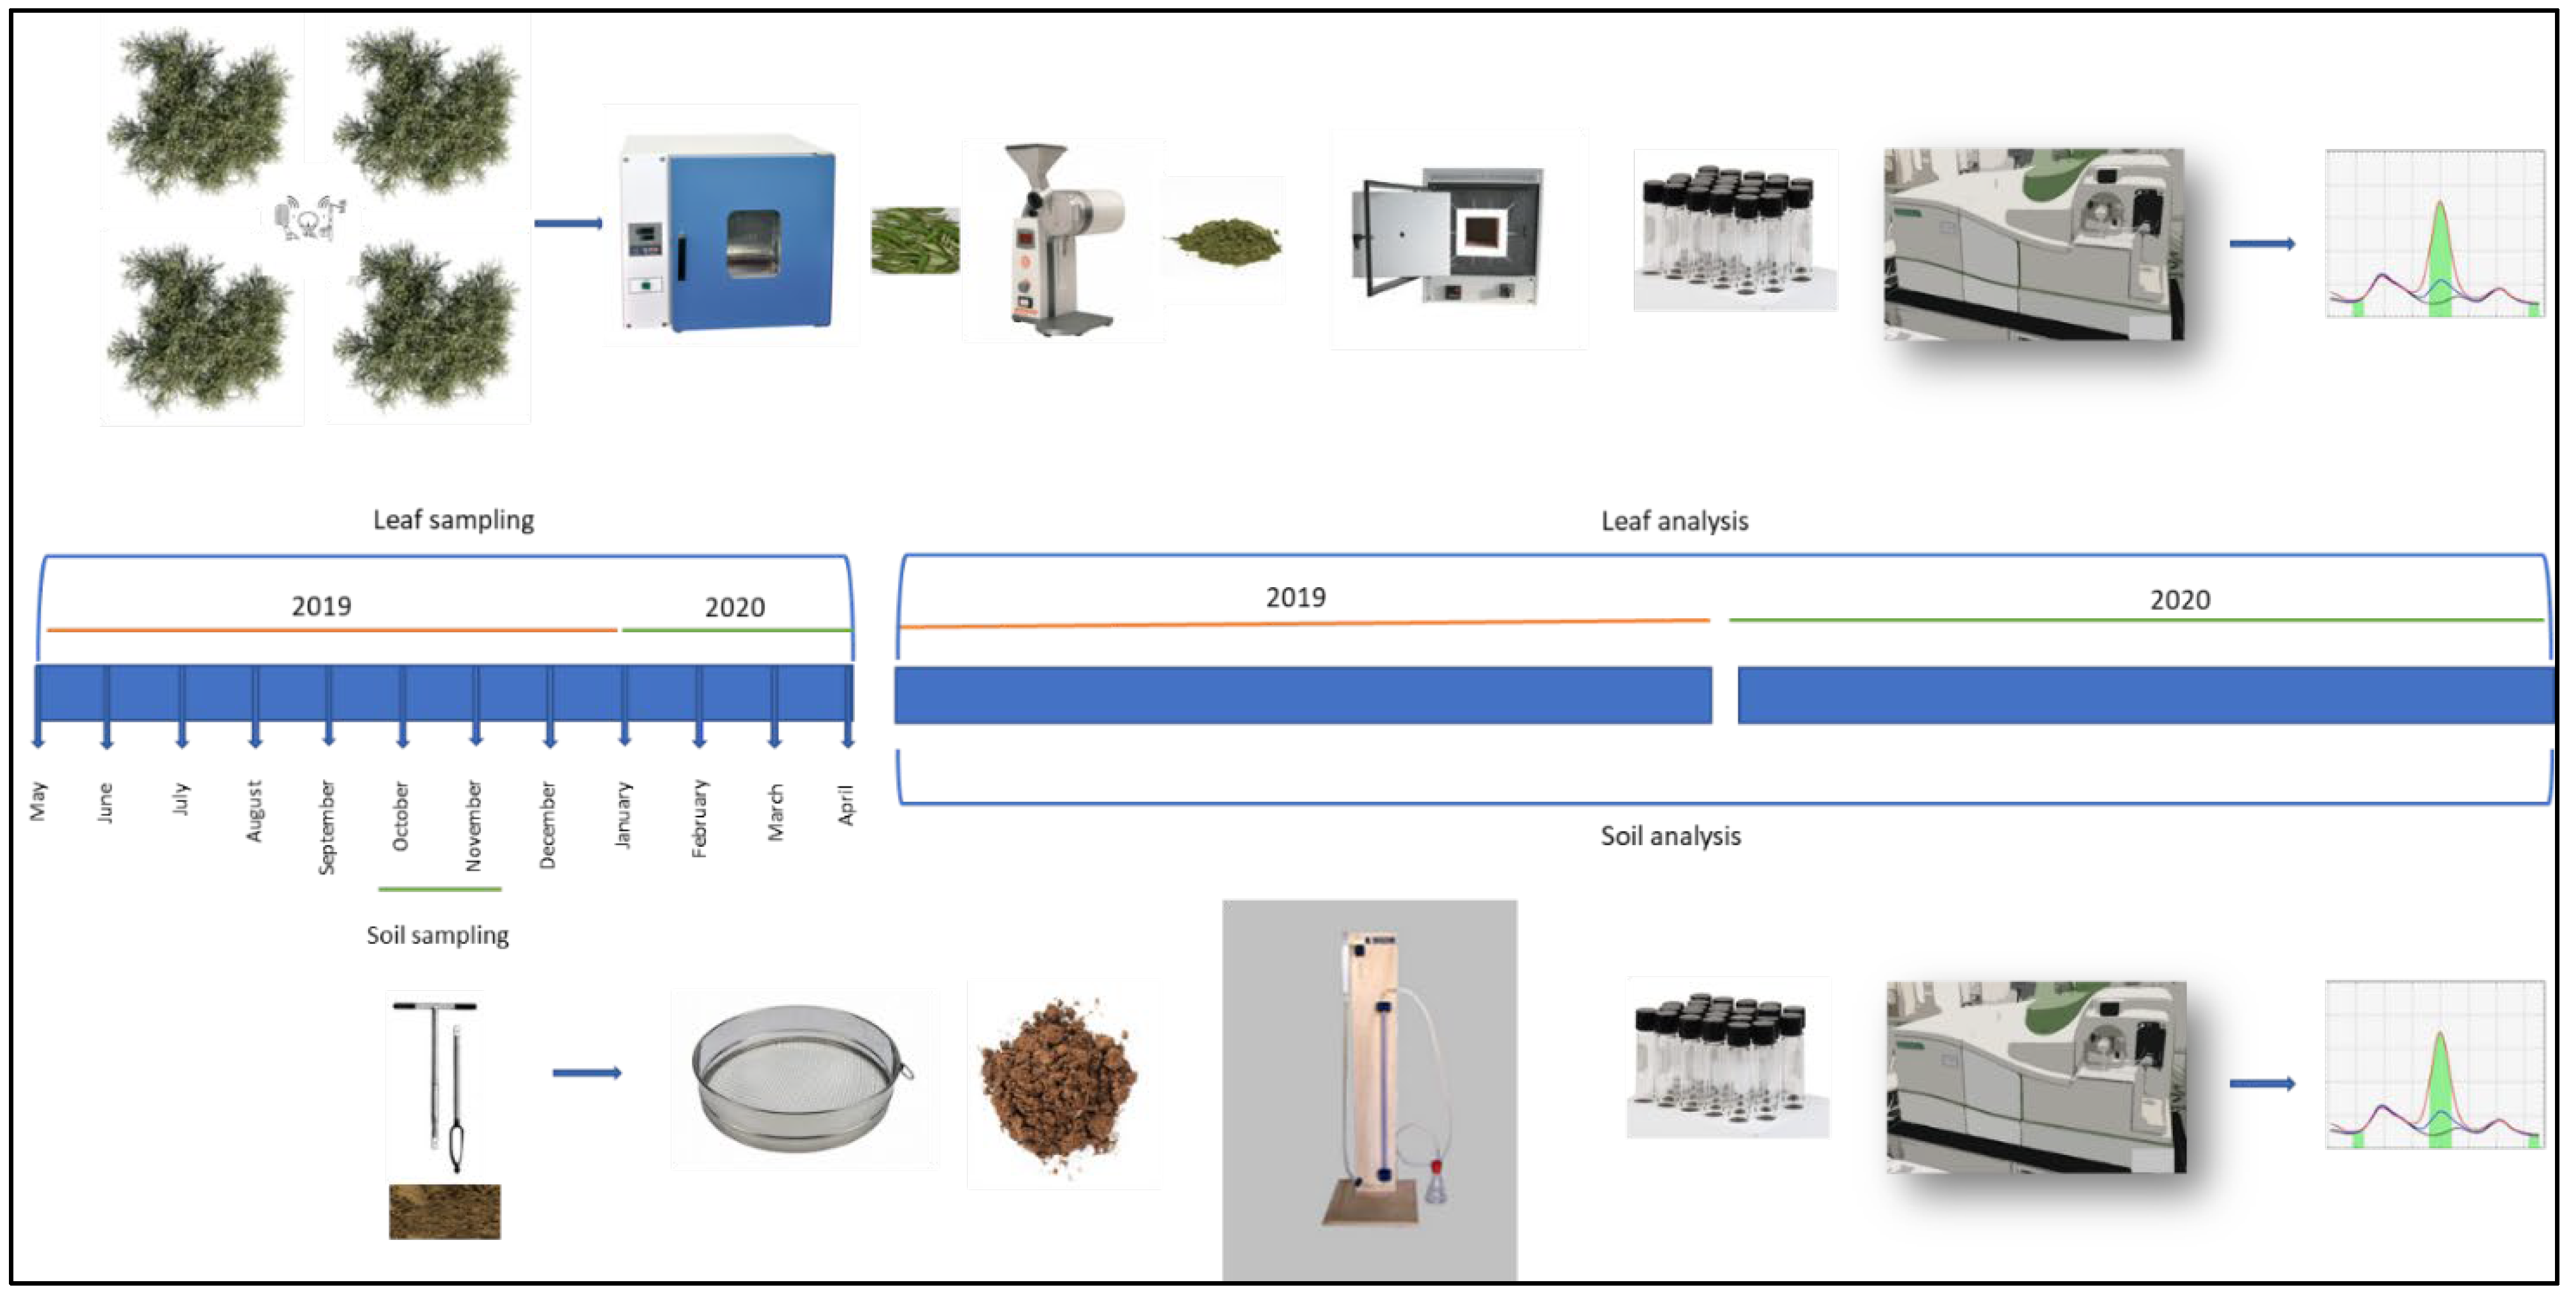
Soil samples were initially airdried, crushed, and then sieved through a 10 mm and 2mm mesh. Soil and leaf analyses were carried out as described previously [20]. Soil pH and electrical conductivity (EC) were determined by preparing a 1:2.5 soil/distilled water (w/v) suspension, respectively, and the respective measurements were made with a multi-meter (Mettler-Toledo AutoChem Inc., Columbia, MD, USA ) using the relevant electrodes. Soil particle size analysis was determined by the Bouyoucos hydrometer method. The modified Walkley-Black wet combustion method was used to determine the soil organic matter (OM) content. Available P was measured using the Olsen method, while the carbonate content (CaCO3 %) was analyzed by the Bernard calcimeter method. Exchangeable cations in soil (Ca, Mg and K) were extracted using 1N ammonium acetate at a 1:20 dilution, while the bioavailable fraction of micronutrients (Fe, Mn, Zn, and Cu) was determined by extraction with 0.005 M DTPA (pH 7.3) [20] and quantified by ICP-OES (Optima 8300, PerkinElmer, Waltham, MA, USA). Nitrate nitrogen in the soil was measured colorimetrically using the Cd reduction method and Nitraver reagent (Hach Company, Loveland, Colodaro, USA), after extraction with 1 M KCl for 1 h. The soil was characterized as sandy–clay–loam, the pH was slightly acidic (6.6), and the EC was 0.215 dS m−1. The organic matter was 0.4%, and the CaCO3 was 0.12%. The NO3-N, Olsen-P, exchangeable K, Ca, Mg, DTPA-Fe, DTPA-Mn, and DTPA-Zn were 24.9, 10.4, 58, 470, 56, >20, 15, and 3.23 mg kg−1, respectively.

2.3. Leaf Mineral Analysis

Leaf samples were collected every month from May 2019 to April 2020, representing the annual cycle during an “off” year (2019 yield). Each variety was represented by three blocks (replications), each with four olive trees. A sample of 100 leaves consisting of the third and fourth pairs of fully expanded leaves, starting from the top of the shoot, was collected once a month per experimental block, then was washed with distilled water and dried at 65 °C to a constant weight prior to fine grinding with a mill (Figure 2). Ground samples (1 g) were dry ashed (520 °C for 5 h), then dissolved with 1M HCl (1:4) with mild heating (50–60 °C), prior to being filtered and diluted to 25 mL. Concentrations of Ca, Fe, and Mn in plant tissue were measured by ICP-OES (Optima 8300, PerkinElmer, Waltham, MA, USA). Element concentrations in plant tissue were then calculated as mg kg−1 d.w. (ppm).

2.4. Statistical Analysis

A two-way ANOVA was used to assess the effects of variety and time, as well as their interaction, on element concentrations. The least significant difference (LSD) test was used for mean separation and to provide homogeneous groups for the means (at p ≤ 0.05). All data were processed in SPSS statistical software version 25 (SPSS Inc., Chicago, IL, USA).

3. Results and Discussion

Research on olive nutrition has been focused on nitrogen [21], phosphorus [22], and potassium [23], due to their fundamental role in shaping vegetative growth and maximizing fruit yields. However, other mineral elements may also play a critical role in crop success. In order to estimate the appropriate time for leaf sampling and to determine the genotype effect on the exploitation of soil mineral elements, leaf nutrient concentrations of Ca, Fe, and Mn in five Greek (‘Amfissis’, ‘Chondrolia Chalkidikis’, ‘Koroneiki’, ‘Mastoidis’, and ‘Kalamon’) and one Spanish (‘Picual’) variety were analyzed. Elucidating the mineral element content of olive varieties may have significant implications not only for plant nutrition but also for plant–pathogen interactions [6,24]. In this study, marked differences in nutrient content were observed among varieties and seasons.

3.1. Genotypic and Seasonal Effect on Leaf Ca Concentration

Calcium concentrations intensively fluctuated in our study due to its fundamental role in olive tree nutrition, mainly in the stages of flowering, fruit development, maturation, and new vegetation. ‘Mastoidis’ had the lowest leaf Ca concentration (<1.0%) during the annual growth, while ‘Koroneiki’ had the highest (>1.0%). Leaf Ca concentration showed significant differences between variety, time, and their interaction. Ca concentration increased in the order: May and June < July < October < August, November, September < December, March, February, January < April (Table 1).
Leaf Ca concentration increased progressively from May to September, with an instant decrease in June for ‘Koroneiki’, ‘Mastoidis’, and ‘Chondrolia Chalkidikis’. We detected a decrease in October, followed by an increase until January for ‘Koroneiki’, ‘Mastoidis’, ‘Kalamon’, and ‘Amfissis’, whereas for ‘Chondrolia Chalkidikis’ and ‘Picual’, the increase continued until February. In March and April, an increase was observed for ‘Koroneiki’, ‘Mastoidis’, and ‘Kalamon’, whereas for ‘Amfissis’, ‘Chondrolia Chalkidikis’, and ‘Picual’, there was a slight decrease in March and a subsequent increase in April (Figure 3). Leaf Ca concentration significantly increased progressively from May to September for all the varieties. In addition, a significant decrease was detected in October for all varieties, although it was not statistically significant when compared to July, August, September, and November. After this period, we recorded a significant increase in December when compared to October. The values were constant from January to March, while these values were not significant when compared to August, September, and November (Table 1).
The mean highest Ca concentration was detected in April (1.51% D.M.) and the lowest in May (0.62% D.M.) (Table 1). Leaf Ca concentration was above the threshold for sufficiency of 1.0% for ‘Koroneiki’, ‘Amfissis’, and ‘Picual’ from July to April. ‘Kalamon’ reached a sufficient concentration only in August and ‘Mastoidis’ in April. ‘Chondrolia Chalkidikis’ reached a sufficient concentration in two periods, being from July to August and January to April (Figure 3). ‘Mastoidis’ had the lowest mean leaf Ca concentration (0.81%) during the annual growth, while ‘Koroneiki’ had the highest (1.38%) (Table 1).
Leaf Ca concentration was above the threshold for sufficiency of 1.0% for ‘Koroneiki’, ‘Amfissis’, and ‘Picual’ for ten months (July–April). Spanish researchers [5] have reported similar results regarding ‘Picual’. ‘Kalamon’ and ‘Mastoidis’ reached a sufficient Ca concentration only for a month each, in August and April, respectively. The variety ‘Chondrolia Chalkidikis’ reached a sufficient concentration in two periods, from July to August and January to April. Significant differences were observed among four Croatian and one Italian variety, highlighting the primary function of the genotypic effect [16]. Calcium increased during the period June–March of the following year in a previous experiment with potted plants of the same variety [13]. In our investigation, Ca concentrations were higher than 0.5% during the whole period for all the varieties apart from ‘Kalamon’ and ‘Amfissis’ in May.
The leaf Ca seasonal trend was almost similar in alkaline and acidic soils in a previous study in Greece [14]. We observed the maximum Ca concentration in April, while the minimum was in May. It is suggested that the massive vegetative growth during that period underlies the sharp leaf Ca decrease via reallocation from old to new leaves; however, this function remains to be verified by future research. Calcium was higher in autumn when compared to spring in Spanish varieties [15]. Leaf Ca concentration increased progressively from May to September, with an instant decrease in June for some of the varieties we evaluated. After this period, a decrease was detected in October for all varieties, followed by an increase in December when compared to October, and finally, the values were constant from January to March. Chatzistathis et al. [25] reported an increase in leaf calcium concentration from May until September, which then reached its maximum in early September, and afterward declined until October for ‘Koroneiki’, which agrees with our data. The partial differences among studies could be attributed to the different varieties and soil characteristics employed.
Olive trees in the Mediterranean countries have a high leaf Ca content due to their adaptation to calcareous soils [15]. Additionally, Ca concentration fluctuations upon element absorption by the trees were observed due to temperature changes and rainfall events during the winter when compared to the dry period of the summer. Ca concentration was higher in basal compared to the apical leaves in young ‘Koroneiki’ plants [10].

3.2. Genotypic and Seasonal Effect on Leaf Fe Concentration

Leaf Fe content fluctuated to a lesser extent throughout the year when compared to Ca. ‘Mastoidis’ showed the highest leaf Fe concentration (95.9 ppm), while all the other varieties demonstrated a lower Fe concentration, with ‘Amfissis’ showing the lowest (62.9 ppm). In a previous study of Greek varieties, ‘Kothreiki’ absorbed a significantly greater quantity of Fe per plant when compared with ‘Koroneiki’ [26]. The maximum concentration was observed in April (114.2 ppm) and the minimum in June (53 ppm). Leaf Fe concentration showed significant differences between variety and time but not their interaction (Table 1). Fe concentration increased in the order: June < October, December, March < September, January, February, November < July, and August < May < April (Figure 4). Mean leaf Fe concentration significantly decreased in June when compared to May, July, August, and April; however, this decrease was not significant when compared to September, October, November, December, January, February, and March (Table 1).
In our study, iron concentrations were higher than 50 ppm during the whole experimental period for all the varieties. Chatzistathis et al. [25] reported minimum values of iron concentration during the period of September–October or at the end of May, while its maximum ones were in July for ‘Koroneiki’, irrespective of soil type. Leaf Fe concentration showed a general tendency to oscillate around a value. Fe concentration was higher in basal compared to the apical leaves in young ‘Koroneiki’ plants [10]. Stateras and Moustakas [8] also reported a low fluctuation of Fe leaf concentration.

3.3. Genotypic and Seasonal Effect on Leaf Mn Concentration

Mn highly fluctuated throughout our experiment. The maximum Mn concentration was detected in April (44.7 ppm) and the minimum was in June (17.5 ppm) (Table 1). ‘Kalamon’ showed the highest leaf Mn concentration (47.8 ppm), and ‘Mastoidis’ had the lowest (16.9 ppm). ‘Kalamon’ and ‘Chondrolia Chalkidikis’ were found above the Mn sufficiency threshold (20 ppm) for twelve months, while ‘Amfissis’ and ‘Picual’ reached the sufficient concentration for ten months and ‘Mastoidis’ only for a month. ‘Koroneiki’ reached a sufficient concentration in two periods, for a total of eight months. Leaf Mn concentration showed significant differences between variety and time and their interaction (Table 1). Mn concentration increased in the order: June, May, October < July, August, September, December, November < February, March, January < April. Leaf Mn concentration for all the varieties increased from May to September with an instant decrease in June, followed by a decrease in October (Table 1). The instant decrease in June was not observed in ‘Amfissis’ (Figure 5). Τhe decline in October was not significant when compared to May, June, July, and August (Table 1). A significant increase in November compared to October was detected. The values remained constant from January to March, while they were not significantly different when compared to August, September, November, and December (Table 1). Leaf Mn concentrations from May to April were above the threshold of sufficiency (20 ppm) for ‘Kalamon’ and ‘Chondrolia Chalkidikis’ while ‘Amfissis’, and ‘Picual’ reached sufficient concentrations from July to April, and ‘Mastoidis’ in April (Figure 5). ‘Koroneiki’ reached a sufficient concentration in two periods, from August to September and November to April.
Chatzistathis et al. [25] indicated that the leaf Mn concentration of ‘Koroneiki’ plants gradually increased, reaching the maximum from August to early September, and afterwards declined in October, independently of soil type. A study on the Greek olive variety ‘Kothreiki’ [8] also reported an increase from April to May and July to August, while a decrease was found during the winter, indicating the reduced absorption of Mn by the trees due to low temperatures of this period. Finally, it should be pointed out that [26] supported that ‘Koroneiki’ could be considered as an Mn- and Fe-efficient variety when compared with ‘Kothreiki’ because of its better transport system of these two elements from the root to the shoot.

4. Conclusions

Genotype and season affected the leaf nutrient concentration of the investigated elements, indicating the importance of standardized leaf sampling for nutrient determination concerning each variety. ‘Amfissis’ and ‘Picual’ reached the sufficiency threshold for both calcium and manganese at the same periods, while all the other varieties strongly fluctuated throughout the year. Element adsorption may be influenced by temperature fluctuations, especially between summer and winter. Additionally, nutrient accumulation is dependent on the genotype. It is justified by the higher concentration of calcium in leaves of ‘Koroneiki’, iron in ‘Mastoidis’, and manganese in ‘Kalamon’. The results of the present study may be helpful for genotype-customized fertilization in olive groves under Mediterranean conditions. Significant economic and environmental benefits may be achieved by a controlled application taking into account genotype and season. The application of fertilizer for a variety that needs specific nutrients and can uptake these nutrients in a specific period reduces the risk of pollution, such as emissions of CO2 that are released by the fertilizer industry and underground water. Moreover, a precise fertilization schedule adapted to a specific variety in a specific period could save money when compared to over-fertilization. In addition, many areas comprising soils with low nutrient content could be cultivated with olive varieties that have the greatest efficiency in nutrient absorption; thus olive cultivation will be expanded, and uncultivated areas will be more efficiently used.

Author Contributions

Conceptualization, G.K. and G.P.; methodology, G.K. and G.P.; validation, I.M. and N.D.; formal analysis, I.M., C.T., A.P., C.S., S.T. and N.D.; investigation, I.M., C.T., A.P., C.S., S.T. and N.D.; resources, G.K.; data curation, I.M.; writing—original draft preparation, I.M.; writing—review and editing, G.K., G.P. and S.T.; visualization, I.M.; supervision, G.K. and G.P.; funding acquisition, G.K. All authors have read and agreed to the published version of the manuscript.

Funding

This research was funded partially by (i) Greek national funds through the Action “Establishment of a National Research Network in the Olive Value Chain,” code 2018ΣΕ01300000 of GSRT, (ii) the General Secretariat for Research and Innovation of the Ministry of Development and Investments under the PRIMA Programme for the project Freeclimb (PRIMA is an Art.185 initiative supported and co-funded under Horizon 2020, the European Union’s Programme for Research and Innovation) and (iii) the European Union’s Horizon 2020 research and innovation programme under grant agreement No. 101000427 for the project Gen4Olive.

Institutional Review Board Statement

Not applicable.

Informed Consent Statement

Not applicable.

Data Availability Statement

Data are available by the authors upon reasonable request.

Conflicts of Interest

The authors declare no conflict of interest. The funders had no role in the design of the study, in the collection, analyses, or interpretation of data, in the writing of the manuscript, or in the decision to publish the results.

References

  1. Rallo, L.; Caruzo, T.; Diez, C.M.; Campisi, G. Olive growing in a time of change: From empiricism to genomics. In The Olive Tree Genome; Rugini, L.B., Muleo, R., Sebastiani, L., Eds.; Springer: Berlin/Heidelberg, Germany, 2016; pp. 55–64. [Google Scholar]
  2. International Olive Council. World Olive Figures. Madrid, Spain. 2018. Available online: https://www.internationaloliveoil.org/what-we-do/economic-affairs-promotion-unit/ (accessed on 18 March 2022).
  3. International Olive Council. World Olive Figures. Madrid, Spain. 2016. Available online: https://www.internationaloliveoil.org/what-we-do/economic-affairs-promotion-unit/ (accessed on 18 March 2022).
  4. Zipori, I.; Erel, R.; Yermiyahu, U.; Ben-Gal, A.; Dag, A. Sustainable Management of Olive Orchard Nutrition: A Review. Agriculture 2020, 10, 11. [Google Scholar] [CrossRef] [Green Version]
  5. Fernández-Escobar, R.; Sánchez-Zamora, M.A.; García-Novelo, J.M.; Molina-Soria, C. Nutrient removal from olive trees by fruit yield and pruning. Hort. Sci. 2015, 50, 1–5. [Google Scholar] [CrossRef] [Green Version]
  6. Fernández-Escobar, R. Olive Nutritional Status and Tolerance to Biotic and Abiotic Stresses. Front. Plant Sci. 2019, 10, 1151. [Google Scholar] [CrossRef]
  7. Sanz-Cortés, F.; Martínez-Calvo, J.; Badenes, M.L.; Bleiholder, H.; Hack, H.; Llácer, G.; Meier, U. Phenological growth stages of olives trees (Olea europaea). Ann. App. Biol. 2002, 140, 151–157. [Google Scholar] [CrossRef]
  8. Stateras, D.C.; Moustakas, N.K. Seasonal changes of macro- and micro-nutrients concentration in olive leaves. J. Plant Nutr. 2018, 41, 186–196. [Google Scholar] [CrossRef]
  9. Tekaya, M.; Dahmen, S.; Mansour, M.B.; Ferhout, H.; Chehab, H.; Hammami, M.; Attia, F.; Mechri, B. Foliar application of fertilizers and biostimulant has a strong impact on the olive (Olea europaea) rhizosphere microbial community profile and the abundance of arbuscular mycorrhizal fungi. Rhizosphere 2021, 19, 100402. [Google Scholar] [CrossRef]
  10. Chatzistathis, T.; Tzanakakis, V.A.; Papaioannou, A.; Giannakoula, A. Comparative Study between Urea and Biogas Digestate Application towards Enhancing Sustainable Fertilization Management in Olive (Olea europaea L., cv. ‘Koroneiki’) Plants. Sustainability 2022, 14, 4785. [Google Scholar] [CrossRef]
  11. Chatzistathis, T.A.; Papadakis, I.E.; Therios, I.N.; Giannakoula, A.; Dimassi, K. Is chlorophyll fluorescence technique a useful tool to assess manganese deficiency and toxicity stress in olive plants? J. Plant Nutr. 2010, 34, 98–114. [Google Scholar] [CrossRef]
  12. Chouliaras, V.; Tasioula, M.; Chatzissavvidis, C.; Therios, I.; Tsabolatidou, E. The effects of a seaweed extract in addition to nitrogen and boron fertilization on productivity, fruit maturation, leaf nutritional status and oil quality of the olive (Olea europaea L.) cultivar Koroneiki. J. Sci. Food Agric. 2009, 89, 984–988. [Google Scholar] [CrossRef]
  13. Chatzissavvidis, C.A.; Therios, I.N.; Molassiotis, A.N. Seasonal Variation of Nutritional Status of Olive Plants as Affected by Boron Concentration in Nutrient Solution. J. Plant Nutr. 2005, 28, 309–321. [Google Scholar] [CrossRef]
  14. Barouchas, P.E.; Vatista, P.; Kalantzis, E.; Moustakas, N.K. Seasonal changes of macronutrients concentration in olive trees grown in acid and in alkaline soils. Notulae Botanicae Horti Agrobotanici 2021, 49, 12498. [Google Scholar] [CrossRef]
  15. Martínez-Navarro, M.E.; Cebrián-Tarancón, C.; Alonso, G.L.; Salinas, M.R. Determination of the Variability of Bioactive Compounds and Minerals in Olive Leaf along an Agronomic Cycle. Agronomy 2021, 11, 2447. [Google Scholar] [CrossRef]
  16. Pasković, I.; Lukić, I.; Žurga, P.; Germek, V.M.; Brkljača, M.; Koprivnjak, O.; Major, N.; Grozić, K.; Franić, M.; Ban, D.; et al. Temporal Variation of Phenolic and Mineral Composition in Olive Leaves Is Cultivar Dependent. Plants 2020, 9, 1099. [Google Scholar] [CrossRef]
  17. Melgar, J.C.; Mohamed, Y.; Navarro, C.; Parra, M.A.; Benlloch, M.; Fernández-Escobar, R. Long-term growth and yield responses of olive trees to different irrigation regimes. Agric. Water Manag. 2008, 95, 968–972. [Google Scholar] [CrossRef]
  18. International Olive Council. Production techniques in olive growing. Madrid, Spain. 2017. Available online: https://www.internationaloliveoil.org/wp-content/uploads/2019/12/Olivicultura_eng.pdf (accessed on 18 March 2022).
  19. Fernández-Escobar, R.; Guerreiro, M.; Benlloch, M.; Benlloch-González, M. Symptoms of nutrient deficiencies in young olive trees and leaf nutrient concentration at which such symptoms appear. Sci. Hortic. 2016, 209, 279–285. [Google Scholar] [CrossRef]
  20. Bechara, E.; Papafilippaki, A.; Doupis, G.; Sofo, A.; Koubouris, G. Nutrient dynamics, soil properties and microbiological aspects in an irrigated olive orchard managed with five different management systems involving soil tillage, cover crops and compost. J. Water Clim. Change 2018, 9, 736–747. [Google Scholar] [CrossRef]
  21. Fernández-Escobar, R.; Antonaya-Baena, F.; Almeida-Lavado, S. Nitrogen Uptake Efficiency of Olive Cultivars. Horticulturae 2021, 7, 136. [Google Scholar] [CrossRef]
  22. Haberman, A.; Dag, A.; Erel, R.; Zipori, I.; Shtern, N.; Ben-Gal, A.; Yermiyahu, U. Long-Term Impact of Phosphorous Fertilization on Yield and Alternate Bearing in Intensive Irrigated Olive Cultivation. Plants 2021, 10, 1821. [Google Scholar] [CrossRef]
  23. Haberman, A.; Dag, A.; Shtern, N.; Zipori, I.; Erel, R.; Ben-Gal, A.; Yermiyahu, U. Long-Term Impact of Potassium Fertilization on Soil and Productivity in Intensive Olive Cultivation. Agronomy 2019, 9, 525. [Google Scholar] [CrossRef] [Green Version]
  24. Coco, L.D.; Migoni, D.; Girelli, C.R.; Angilè, F.; Scortichini, M.; Fanizzi, F.P. Soil and Leaf Ionome Heterogeneity in Xylella fastidiosa Subsp. Pauca-Infected, Non-Infected and Treated Olive Groves in Apulia, Italy. Plants 2020, 9, 760. [Google Scholar] [CrossRef]
  25. Chatzistathis, T.; Therios, I.; Alifragis, D.; Dimassi, K. Effect of sampling time and soil type on Mn, Fe, Zn, Ca, Mg, K and P concentrations of olive (Olea europaea L., cv. ‘Koroneiki’) leaves. Sci. Hortic. 2010, 126, 291–296. [Google Scholar] [CrossRef]
  26. Chatzistathis, T.; Therios, I.; Alifragis, D. Differential Uptake, Distribution within Tissues, and Use Efficiency of Manganese, Iron, and Zinc by Olive Cultivars Kothreiki and Koroneiki. Hort. Sci. 2009, 44, 1994–1999. [Google Scholar] [CrossRef] [Green Version]
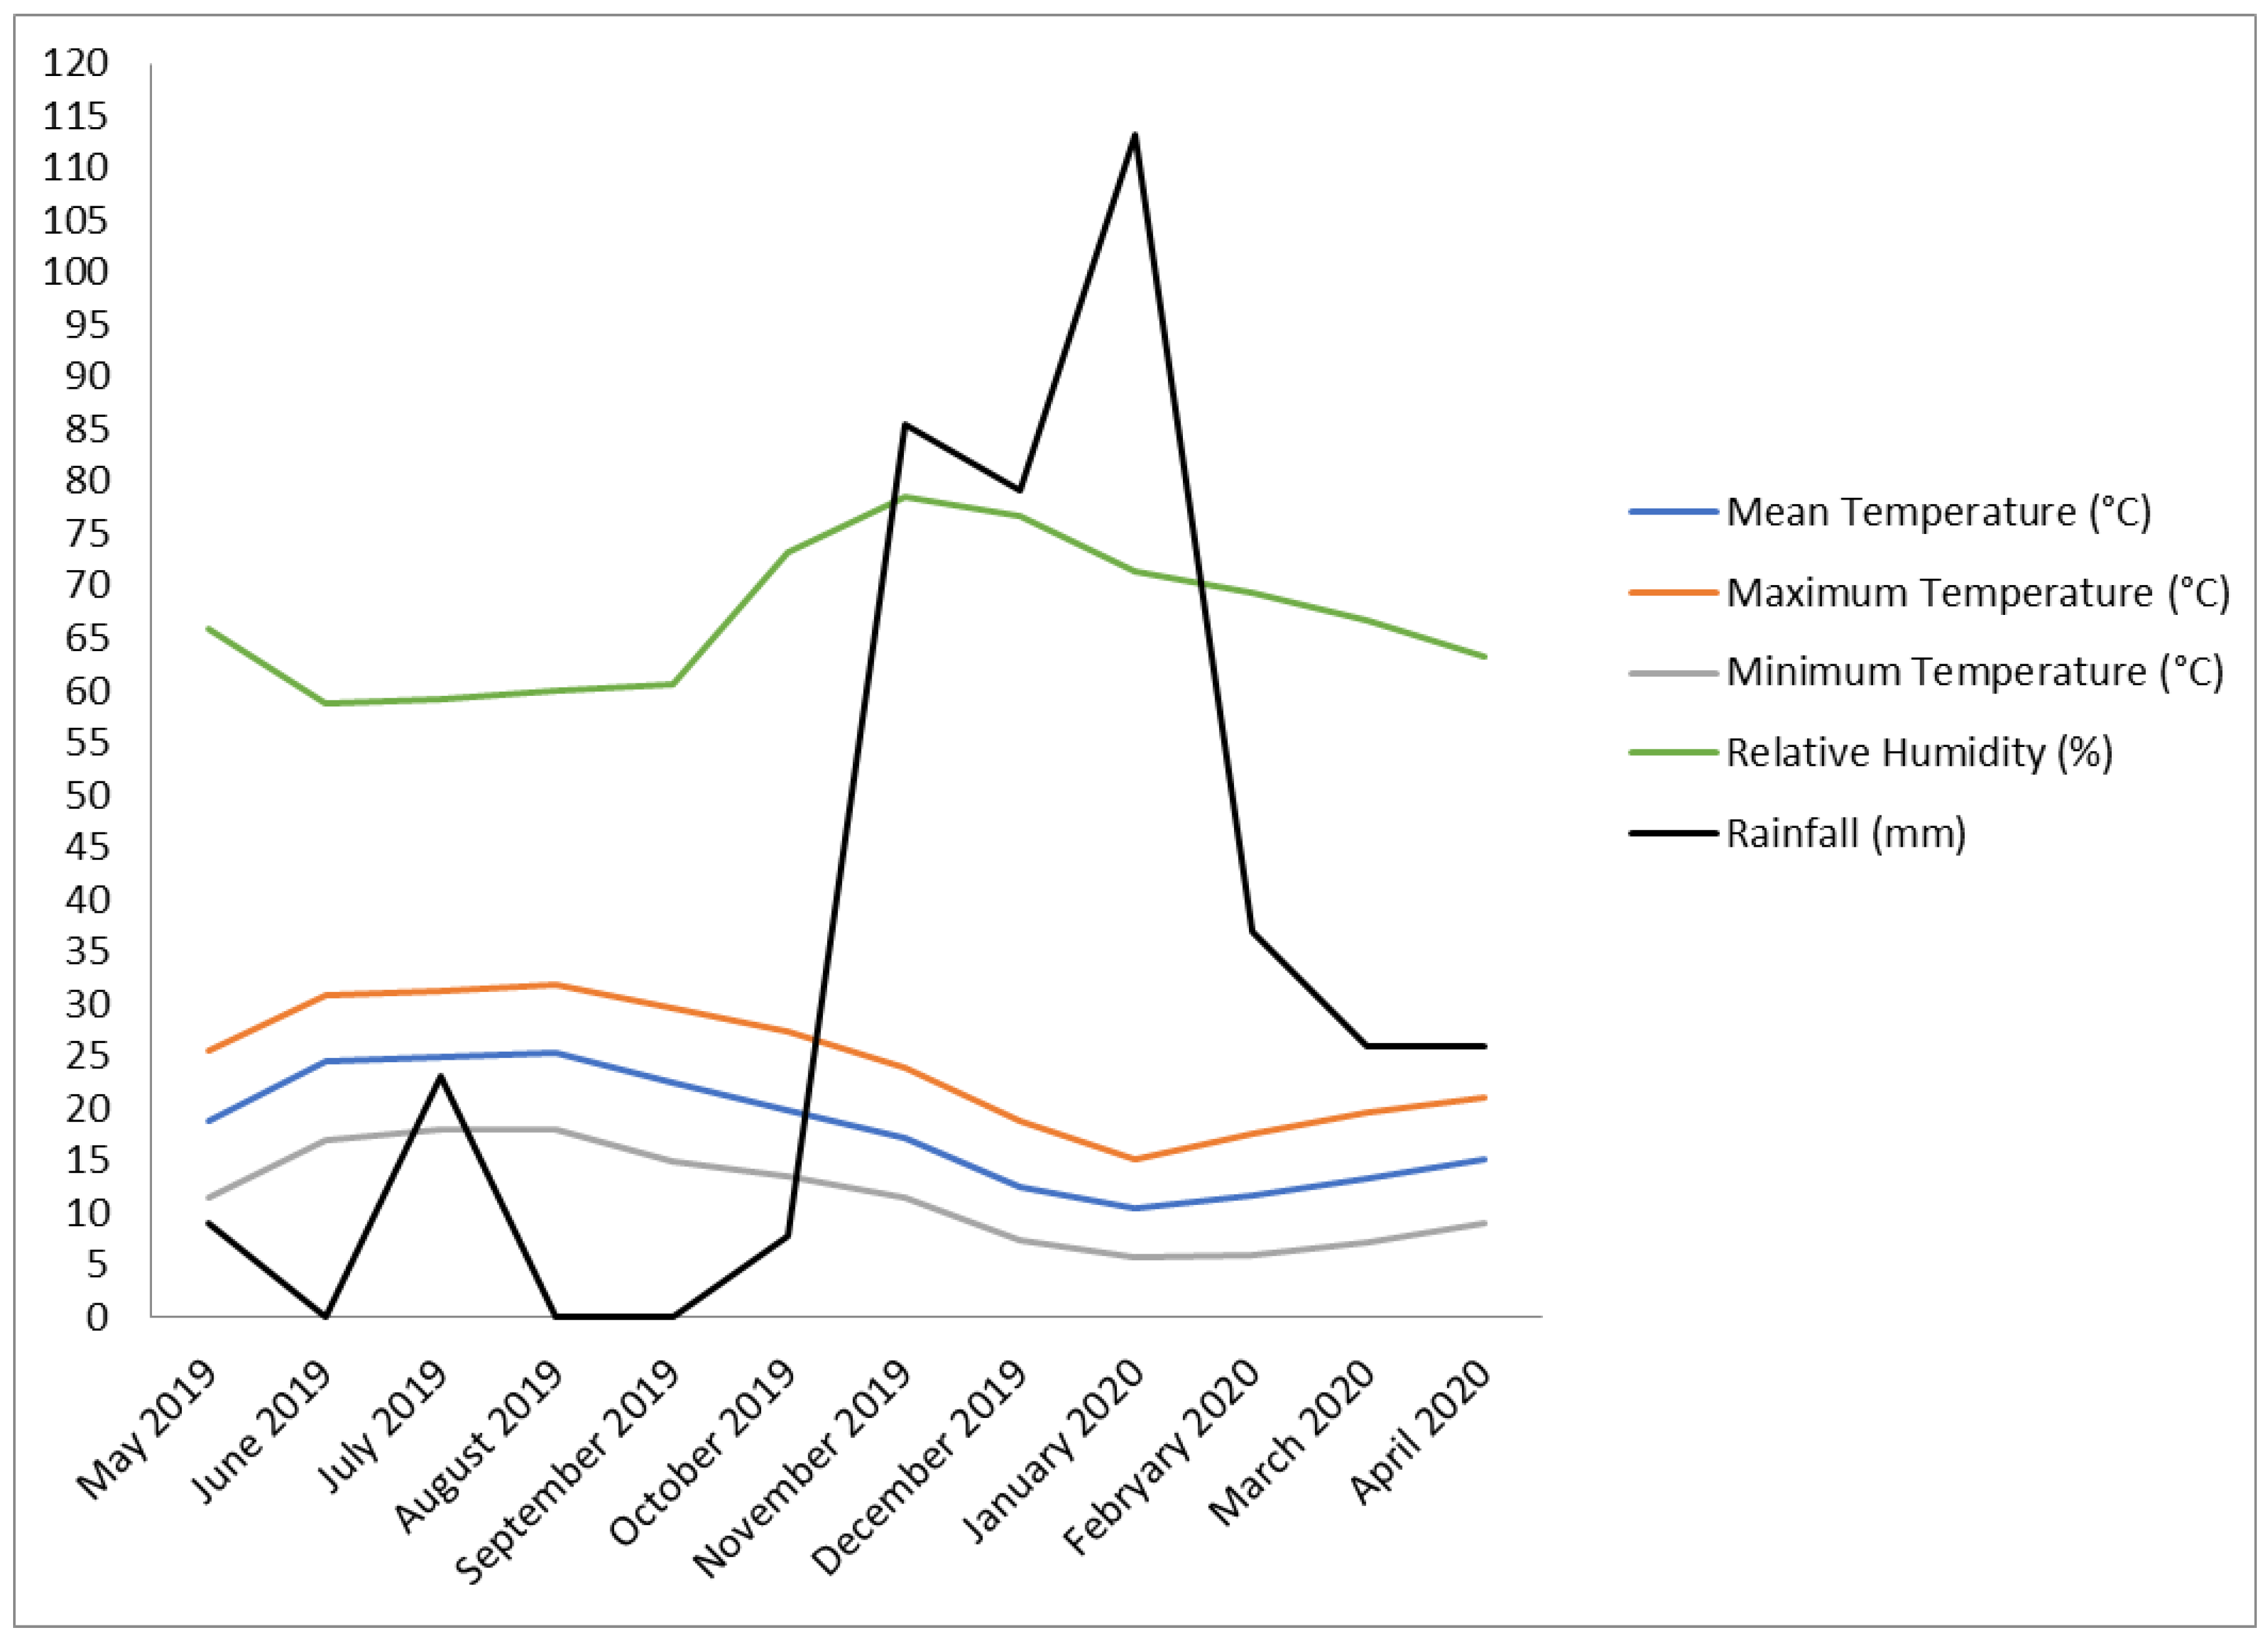
Figure 1. Meteorological data in 2019 and 2020.
Ijpb 13 00010 g001
Figure 2. Schematic illustration of leaf and soil analyses over time.
Ijpb 13 00010 g002
Figure 3. Seasonal trends of calcium concentration in olive leaves developed during annual growth. Error bars represent the standard error of the mean of three replicates. Means within a variety followed by the same letters do not differ at p < 0.05 (LSD test).
Ijpb 13 00010 g003
Figure 4. Seasonal trends of iron concentration in olive leaves that developed during annual growth. Error bars represent the standard error of the mean of three replicates. Means were compared at p < 0.05 (LSD test).
Ijpb 13 00010 g004
Figure 5. Seasonal trends of manganese concentration in olive leaves developed during annual growth. Error bars represent the standard error of the mean of three replicates. Means within a variety followed by the same letters do not differ at p < 0.05 (LSD test).
Ijpb 13 00010 g005
Table 1. Effects of variety, time, and interaction on the calcium, iron, and manganese concentrations in ‘Amfissis’, ‘Chondrolia Chalkidikis’, ‘Kalamon’, ‘Koroneiki’, ‘Mastoidis’, and ‘Picual’.
F Value
Source 1dfCa (%)Fe (ppm)Mn (ppm)
Variety579.966 ***12.667 ***90.200 ***
Time1150.641 ***11.344 ***20.554 ***
Variety × Time552.743 ***1.286 ns1.717 **
Mean values ± SE 2
Main factor Ca (%)Fe (ppm)Mn (ppm)
VarietyAmfissis1.11 ± 0.06 c62.9 ± 3.9 a30.6 ± 1.6 b
Chondrolia Chalkidikis0.94 ± 0.03 b67.5 ± 2.7 a35.8 ± 1.5 c
Kalamon0.88 ± 0.04 ab63.4 ± 3.1 a47.8 ± 3.1 d
Koroneiki1.38 ± 0.07 e68.9 ± 3.9 a21.5 ± 0.9 a
Mastoidis0.81 ± 0.02 a95.9 ± 8.0 b16.9 ± 0.6 a
Picual 1.24 ± 0.05 d70.8 ± 2.3 a28.9 ± 1.5 b
TimeMay 20190.62 ± 0.06 a87.6 ± 2.9 c20.2 ± 1.7 ab
June 20190.64 ± 0.02 a53.0 ± 3.1 a17.5 ± 1.1 a
July 20190.89 ± 0.04 b78.0 ± 4.5 bc25.6 ± 1.6 b–d
August 20191.08 ± 0.05 cd78.0 ± 7.9 bc30.8 ± 2.8 c–e
September 20191.12 ± 0.07 cd64.7 ± 4.4 a–c31.9 ± 3.3 de
October 20190.96 ± 0.06 bc58.5 ± 3.9 ab24.1 ± 2.0 a–c
November 20191.11 ± 0.07 cd69.1 ± 4.9 a–c33.2 ± 3.6 de
December 20191.13 ± 0.06 d59.0 ± 3.4 ab32.8 ± 3.1 de
January 20201.22 ± 0.08 d66.0 ± 2.7 a–c34.4 ± 3.2 e
February 20201.20 ± 0.07 d66.7 ± 3.9 a–c34.0 ± 3.7 e
March 20201.19 ± 0.06 d63.2 ± 4.6 ab34.0 ± 3.0 e
April 20201.51 ± 0.09 e114.2 ± 13.4 d44.7 ± 4.8 f
1 Values of F: * p < 0.05 ** p < 0.01 *** p < 0.001. 2 Mean values for each measured parameter within factor, with the same letter are not significantly different (p < 0.05) LSD test.
Publisher’s Note: MDPI stays neutral with regard to jurisdictional claims in published maps and institutional affiliations.