Abstract
In this study, we used RT-qPCR to examine how PR genes were expressed in model tomato (Solanum lycopersicum L.) plants that had been infected with TMV or CMV. Under greenhouse conditions, the indirect ELISA data showed that both viruses were detected for the first time at 6 dpi. Then, the levels of accumulation increased very quickly, reaching a peak of 15 dpi. During the course of the study (1–15 dpi), the Delta CT, NormFinder, BestKeeper, and GeNorm software tools revealed that the β-actin gene was the most informative reference gene in the virally infected tomato tissues. For both the TMV- and CMV-infected tomato plants, the transcriptional expression levels of most tested genes changed between activation and repression, especially in the first 12 dpi. Compared to mock-inoculated plants, the expression levels of PR-1 were induced at all time intervals except at 8 dpi for CMV and at 6, 7, and 8 dpi for TMV infection. Conversely, the greater activation and accumulation of both viruses were associated with the greater up-regulation of PR-2 at 8 dpi, with relative expression levels of 7.28- and 5.84-fold for TMV and CMV, respectively. The up-regulated expression of PR-3, PR-4, and PR-7 was shown at 4 dpi. In contrast, the PR-5 gene was inhibited in TMV at 1 dpi until 9 dpi, and the induction of this gene at 10 dpi increased by 1.72-fold, but PR-5 was observed to up-regulate the expression of CMV at 1 dpi. This study provides the first valuable information on the comparative transcriptional levels of these tomato genes between TMV and CMV infections.
1. Introduction
Plant viruses are the most important pathogens that cause serious crop production problems once they appear in the field [1,2]. Plant viruses are responsible for the world’s most damaging agricultural diseases, which cost billions of dollars every year [3]. Tobacco mosaic virus (TMV)—genus Tobamovirus, family Virgaviridae—is one of the most common plant viruses that causes serious quality and crop production damage worldwide [4,5]. TMV is a single-stranded RNA virus that infects approximately 885 plant species from 65 families, mainly tobacco and tomato plants, as well as other members of the Solanaceae family [4,5]. TMV infection causes mosaic symptoms on the leaves as well as plant tissue yellowing. The virus has resulted in significant economic losses all over the world [6]. Cucumber mosaic virus (CMV)—genus Cucumovirus, family Bromoviridae—is one of the most damaging and economically essential plant viruses, causing serious crop quality and productivity problems worldwide [6]. It affects about 1200 species of plants in over 100 plant families around the world, including monocots and dicots [7]. CMV has three single-stranded linear RNAs with a positive sense (RNA-1, RNA-2, and RNA-3) that code for four viral proteins [8].
When a pathogen attacks a plant, several signaling pathways are activated, leading to the production of secondary metabolites and the release of antimicrobial defense proteins. Pathogenesis-related (PR) proteins are a family of proteins that have been shown to accumulate in large amounts in plants following a pathogen infection. Since they were discovered in tobacco (Nicotiana tabacum L.) as a result of TMV infection, these proteins have been thoroughly studied and characterized [9]. Upon viral infection, the plant undergoes a series of gene expression changes, with several PR genes being induced as part of the defense response [9,10]. PR genes are involved in plant defense against biotic stressors, and a subset of these genes may be responsible for systemic acquired resistance to pathogens such as plant viruses [9]. Based on their functions, interactions with antibodies, amino acid sequences, number of molecules, and a few other factors, Linthorst and Van Loon [11] classified PR proteins into different categories. Because they are either extremely acidic or extremely basic, PR proteins are highly soluble and, as a result, reactive. At least 14 different protein families belong to the PR category. Most of these have known functions or activities: for example, PR-2 is a β-1,3-glucanase; PR-3, -4, -8, and -11 are different types of chitinase; PR-5 is a thaumatin-like protein; PR-6 is a proteinase inhibitor; PR-7 is an endoproteinase; PR-9 is a peroxidase; PR-10 is a ribonuclease; PR-12 is a defensin; PR-13 is a thionin; and PR-14 is a lipid-transfer protein [12]. There are often a large number of isoforms of each PR protein present in the diverse host plants.
Real-time quantitative polymerase chain reaction (RT-qPCR) has been shown to be a good way to measure gene expression in many situations, including those involving plant viruses [13]. This is because it is sensitive, accurate, and repeatable when it comes to detecting small amounts of RNA molecules. However, the results are only reliable if they have been normalized using a reference gene that is expressed the same way in all tissues and experimental conditions. Housekeeping genes are thus good candidates for universal internal controls. As a result, if an inappropriate reference gene is used, then the reliability and accuracy of RT-qPCR are compromised [14,15]. For the purpose of this study, we evaluated the stability of three potential housekeeping genes (EF1-α, 18S rRNA, and β-actin) in a TMV and/or CMV tomato infection, grading their reliability as internal controls. Additionally, we examined how six tomato PR genes (PR-1, PR-2, PR-3, PR-4, PR-5, and PR-7) were expressed differently between TMV-infected, CMV-infected, and mock-inoculated samples every day for 15 days after infection (1–15 dpi) to compare and study how the plants reacted to the two viruses.
2. Materials and Methods
2.1. Sources of Tomato Seeds and Viruses
The Egyptian Agriculture Research center provided the virus-free tomato (Solanum lycopersicum L.) seeds of the Carmen F1 variety, which is susceptible to viral infection. In addition, two purified viral isolates (TMV; accession number MG264131 and CMV; accession number MN594112) were utilized as viral inoculums [16,17].
2.2. Greenhouse Experimental Design, Mechanical Inoculation and Sample Collection
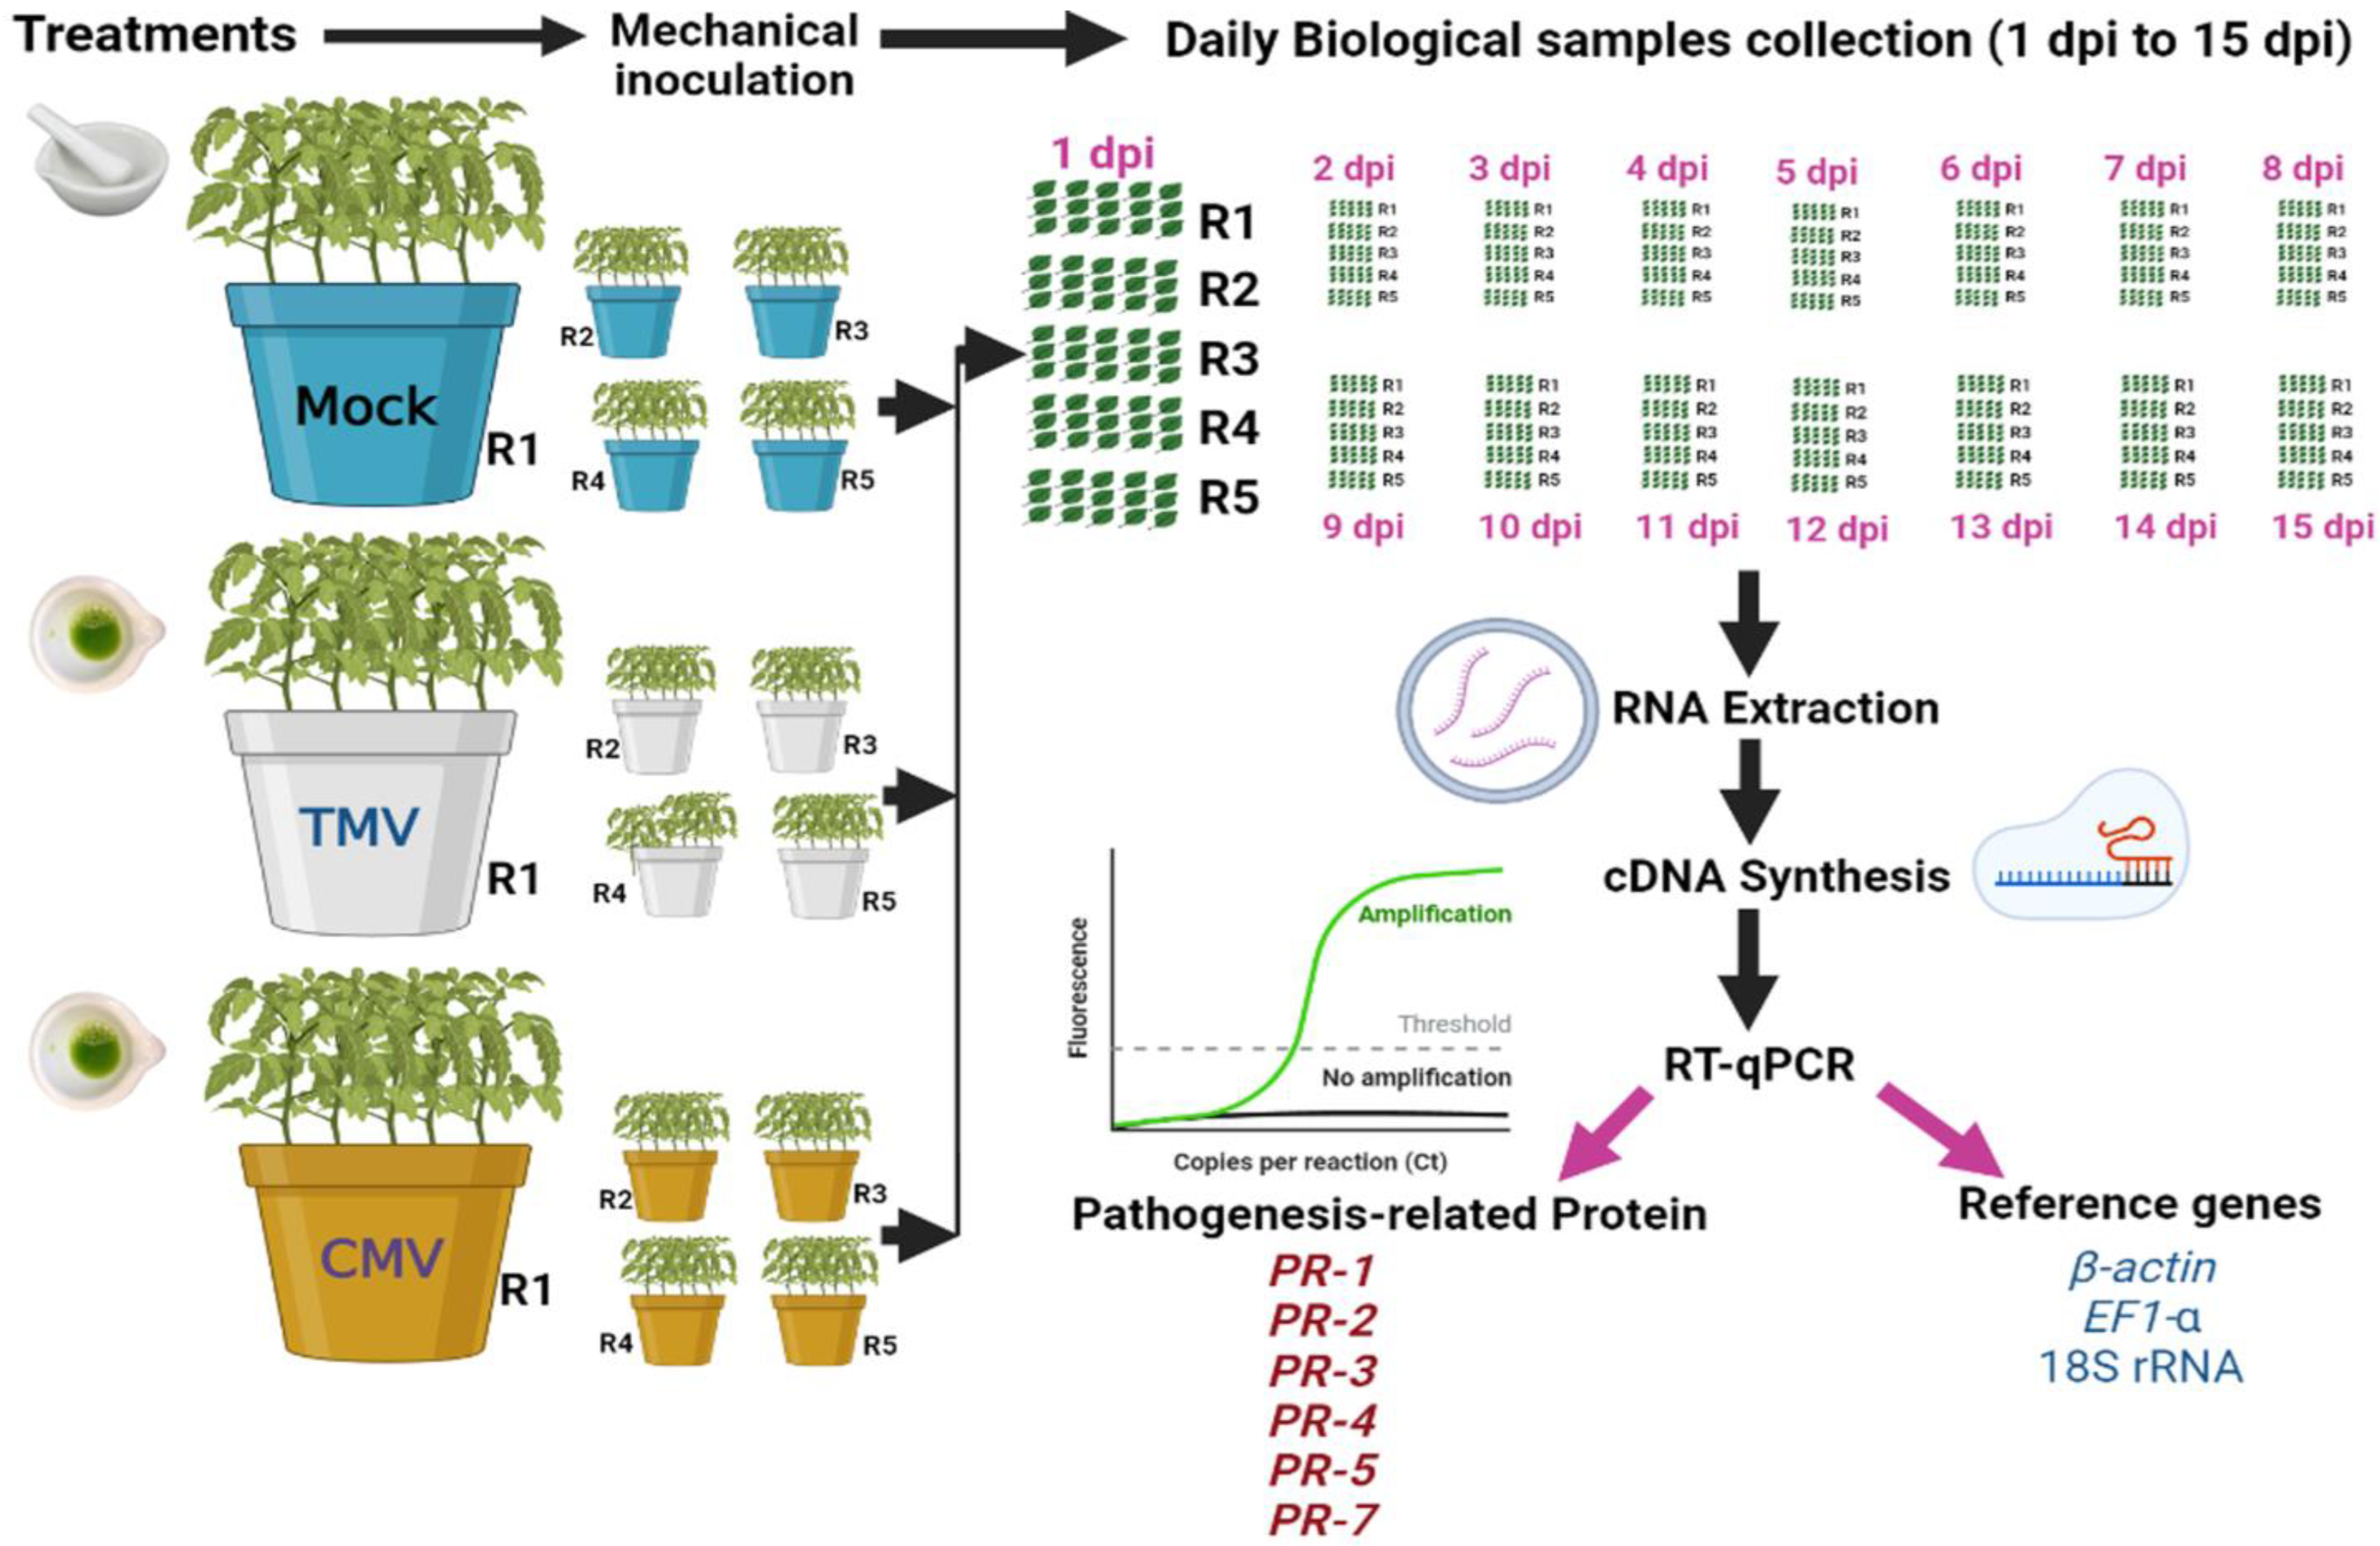
The tomato seeds were sterilized in a controlled environment and then grown in sterile vermiculite pots. After 28 days of growth, the seedlings were moved to other pots. Each pot (20 cm) contained 3 kg of autoclave-sterilized sand and clay (1:1). After a week, each plant’s top two true leaves were mechanically inoculated with 0.5 mL of 20 µg/mL freshly prepared TMV or CMV [18]. The experiment was carried out over three treatments (Figure 1). The first treatment (mock) was the control treatment, in which tomato plants were inoculated with viral inoculation buffer. The second treatment was tomato plants inoculated with TMV. The third treatment was tomato plants inoculated with CMV. Each treatment consisted of five pots (five biological replicates), and each pot contained five tomato plants. All the plants were kept in the greenhouse at a temperature of 28/16 °C day and night with a relative humidity of 65%. The CMV and TMV symptoms were observed on each day. The tomato leaves (not mechanically inoculated) were collected daily from 0 to 15 dpi and then subjected to further analyses (ELISA and RNA extraction). The independent biological replicate of each treatment was a pool of 15 tomato leaves that were collected from five plants, with three leaves per plant, grown in each pot. Each biological replicate was tested in three independent technical replicates for reliability.
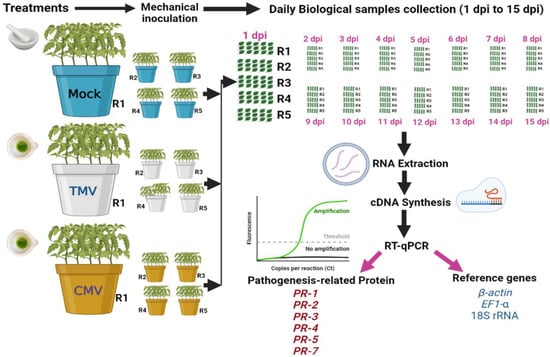
Figure 1.
A schematic diagram summarizing the experimental study.
2.3. Detection of TMV or CMV by Enzyme-Linked Immunosorbent Assay
The indirect enzyme-linked immunosorbent assay (I-ELISA) was used to detect the viral infection in the collected samples as previously described [19]. An absorbance at 405 nm was used as the unit of measurement for the ELISA results. If the absorbance value of the sample was double the threshold value of the healthy control samples, then it was said that there were viruses in the sample.
2.4. RNA Extraction and cDNA Synthesis
Total RNA was isolated from tomato leaves (100 mg fresh weight) using the RNeasy Plant Mini Kit (QIAGEN, Hilden, Germany), as recommended by the supplier. UV–Vis spectroscopy was used to determine the purity and quantity of the isolated RNA (EMCLAB Instruments GmbH, Duisburg, Germany). The RNA integrity was assessed by visualizing the quality of the isolated RNA via 1.2% agarose gel electrophoresis. For each sample, 1 µg of DNase-I-treated RNA was used as a template for cDNA synthesis using a reverse transcriptase enzyme (M-MuLV Reverse Transcriptase, Biolabs, New England, Ipswich, MA, USA) with oligo (dT) and random hexamer primers. The RT-PCR reaction was carried out in 20 µL and programmed at 42 °C for 1 h, followed by a deactivation step at 80 °C for 5 min. The cDNA was then stored at −20 °C until used in RT-qPCR.
2.5. Normalization and Standardization of the Housekeeping Genes
Three housekeeping genes were tested during the post-viral infection time course to identify the most stably expressed reference gene(s) in virally infected tomato plants: β-actin, elongation factor 1-α (EF1-α), and the 18S rRNA. The data were analyzed using four different programs: the Delta CT method (https://toptipbio.com/delta-delta-ct-qpcr; accessed on 1 January 2023), NormFinder (https://moma.dk/normfinder-software; accessed on 2 January 2023), BestKeeper (https://www.gene-quantification.de/bestkeeper.html; accessed on 2 January 2023), and GeNorm (https://genorm.cmgg; accessed on 3 January 2023).
2.6. RT-qPCR Assay
Six different PR genes (PR-1, PR-2, PR-3, PR-4, PR-5, and PR-7) were tested in this investigation. Table 1 displays the primer sequences. A total of 20 µL of a combination containing 1 µL of each primer at 10 pmol/µL, 1 µL of template cDNA, 10 µL of 2xSYBR Green PCR Master Mix, and 7 µL of nuclease-free water were used for the RT-qPCR reaction. Three independent replicates of each sample were run on the Rotor-Gene 6000 (QIAGEN, ABI System, Miami, FL, USA). The thermal cycling amplification technique included a 10 min denaturation at 95 °C, then 40 cycles of 15 s denaturation at the same temperature, 30 s annealing at 60 °C, and 30 s extension at 72 °C. After 40 cycles, melting curves were obtained to filter out any non-specific products. The qPCR efficiency was measured for each gene and was between 93% and 100% for all genes. The melting curve study at temperatures between 55 and 95 °C showed only one amplified product for all genes.

Table 1.
Nucleotide sequences of PR gene primers used in this study.
2.7. RT-qPCR Data Analysis
To figure out the relative expression ratio, the method created by Livak and Schmittgen [26] was used. With the use of an automated threshold analysis using the Applied Biosystems Integrated (ABI) system, we were able to calculate the CT (threshold of cycle) value for each gene. The equations show the mathematical model of the relative expression ratio to be obtained, where:
ΔCT target = (CT target − CT reference), ΔCT control = (CT control − CT reference)
The equations show the mathematical model of the relative gene expression level ratio to be obtained, where:
ΔΔCT expression = (ΔCT target − ΔCT control), accordingly 2−ΔΔCT algorithm.
2.8. Statistical Analysis
Using the CoStat program, we performed a one-way analysis of variance (ANOVA) on the relative expression of three biological replicates for each time, and we used post hoc Tukey’s honest differences (HSD) to distinguish between means at the p ≤ 0.05 level. The relative expression levels with the most statistically significant differences were plotted, and the standard deviation (±SD) is shown as a column bar. If the value was more than one, then it meant that gene expression was being turned up (up-regulated), and if it was less than one, then it meant that expression was being turned down (down-regulated).
3. Results and Discussion
3.1. Symptoms Development and Virus Detection
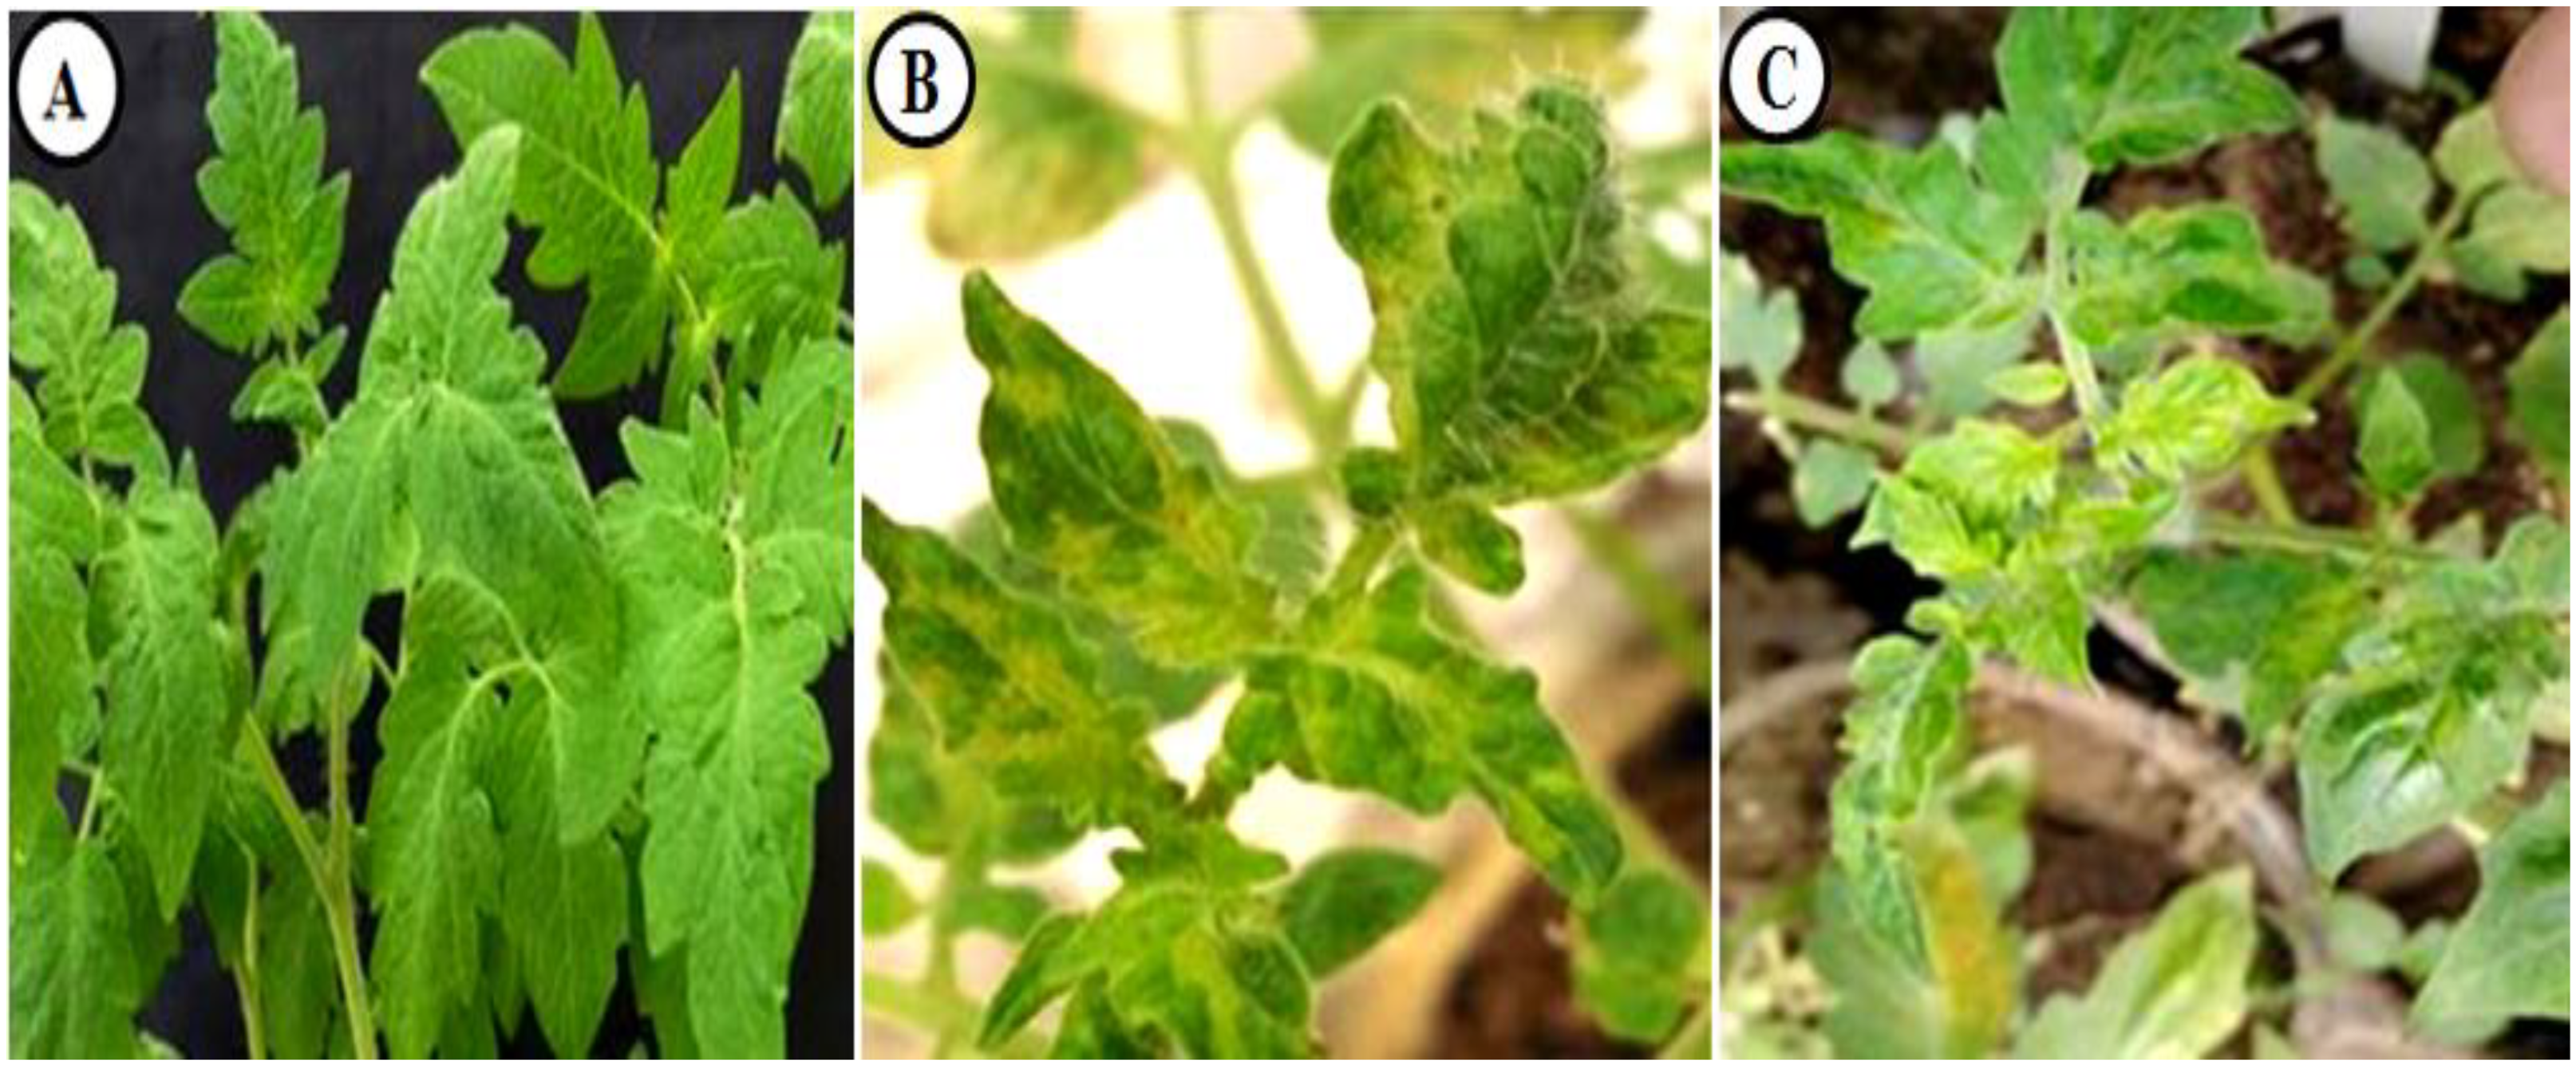
Under greenhouse conditions, both TMV- and CMV-infected tomato plants displayed multiple morphological changes. Similar to previous reports [27,28], the development of systemic mosaic with chlorosis symptoms on TMV tomato leaves was reported at 11 dpi. On the other hand, early CMV symptoms were noticed at 13 dpi. At 14 dpi, all the TMV-inoculated plants showed severe TMV-like symptoms such as mosaic, leaf deformation, and thickness on some tomato leaves (Figure 2B). On the other hand, at 16 dpi, all of the plants that had been infected with CMV showed severe symptoms such as mottling, mosaic, yellowing, and flecks of dead tissue (Figure 2C). The viral infections had a significant effect on leaf morphogenesis, which changed the shape of the leaves and slowed the growth of the whole plant [29,30]. An I-ELISA assay (Table 2) revealed that the first detection of viral infections was at 6 dpi for both TMV and CMV infection. Then, there was a dramatic increase in the accumulation levels, reaching a maximum of 15 dpi. No virus was detected in the mock-inoculated samples. The obtained results support previous studies, which showed that a viral infection might be detected in the early stages of an infected potato plant or other differential hosts [31,32].
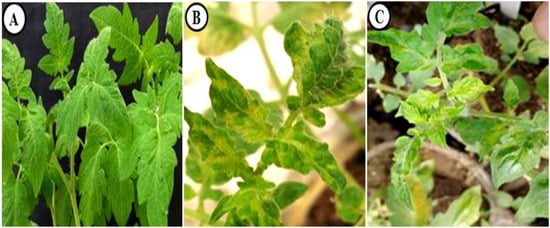
Figure 2.
Overview of tomato plants showing TMV and CMV symptoms under greenhouse conditions at 14 days post-viral infection. (A) Tomato control plants; (B) TMV-infected tomato plants; (C) CMV-infected tomato plants.

Table 2.
Indirect ELISA detection of TMV or CMV in a 1:10 dilution of sap extracted from inoculated tomato plants collected at different time intervals (1:15 dpi).
3.2. Determination and Standardization of the Housekeeping Genes
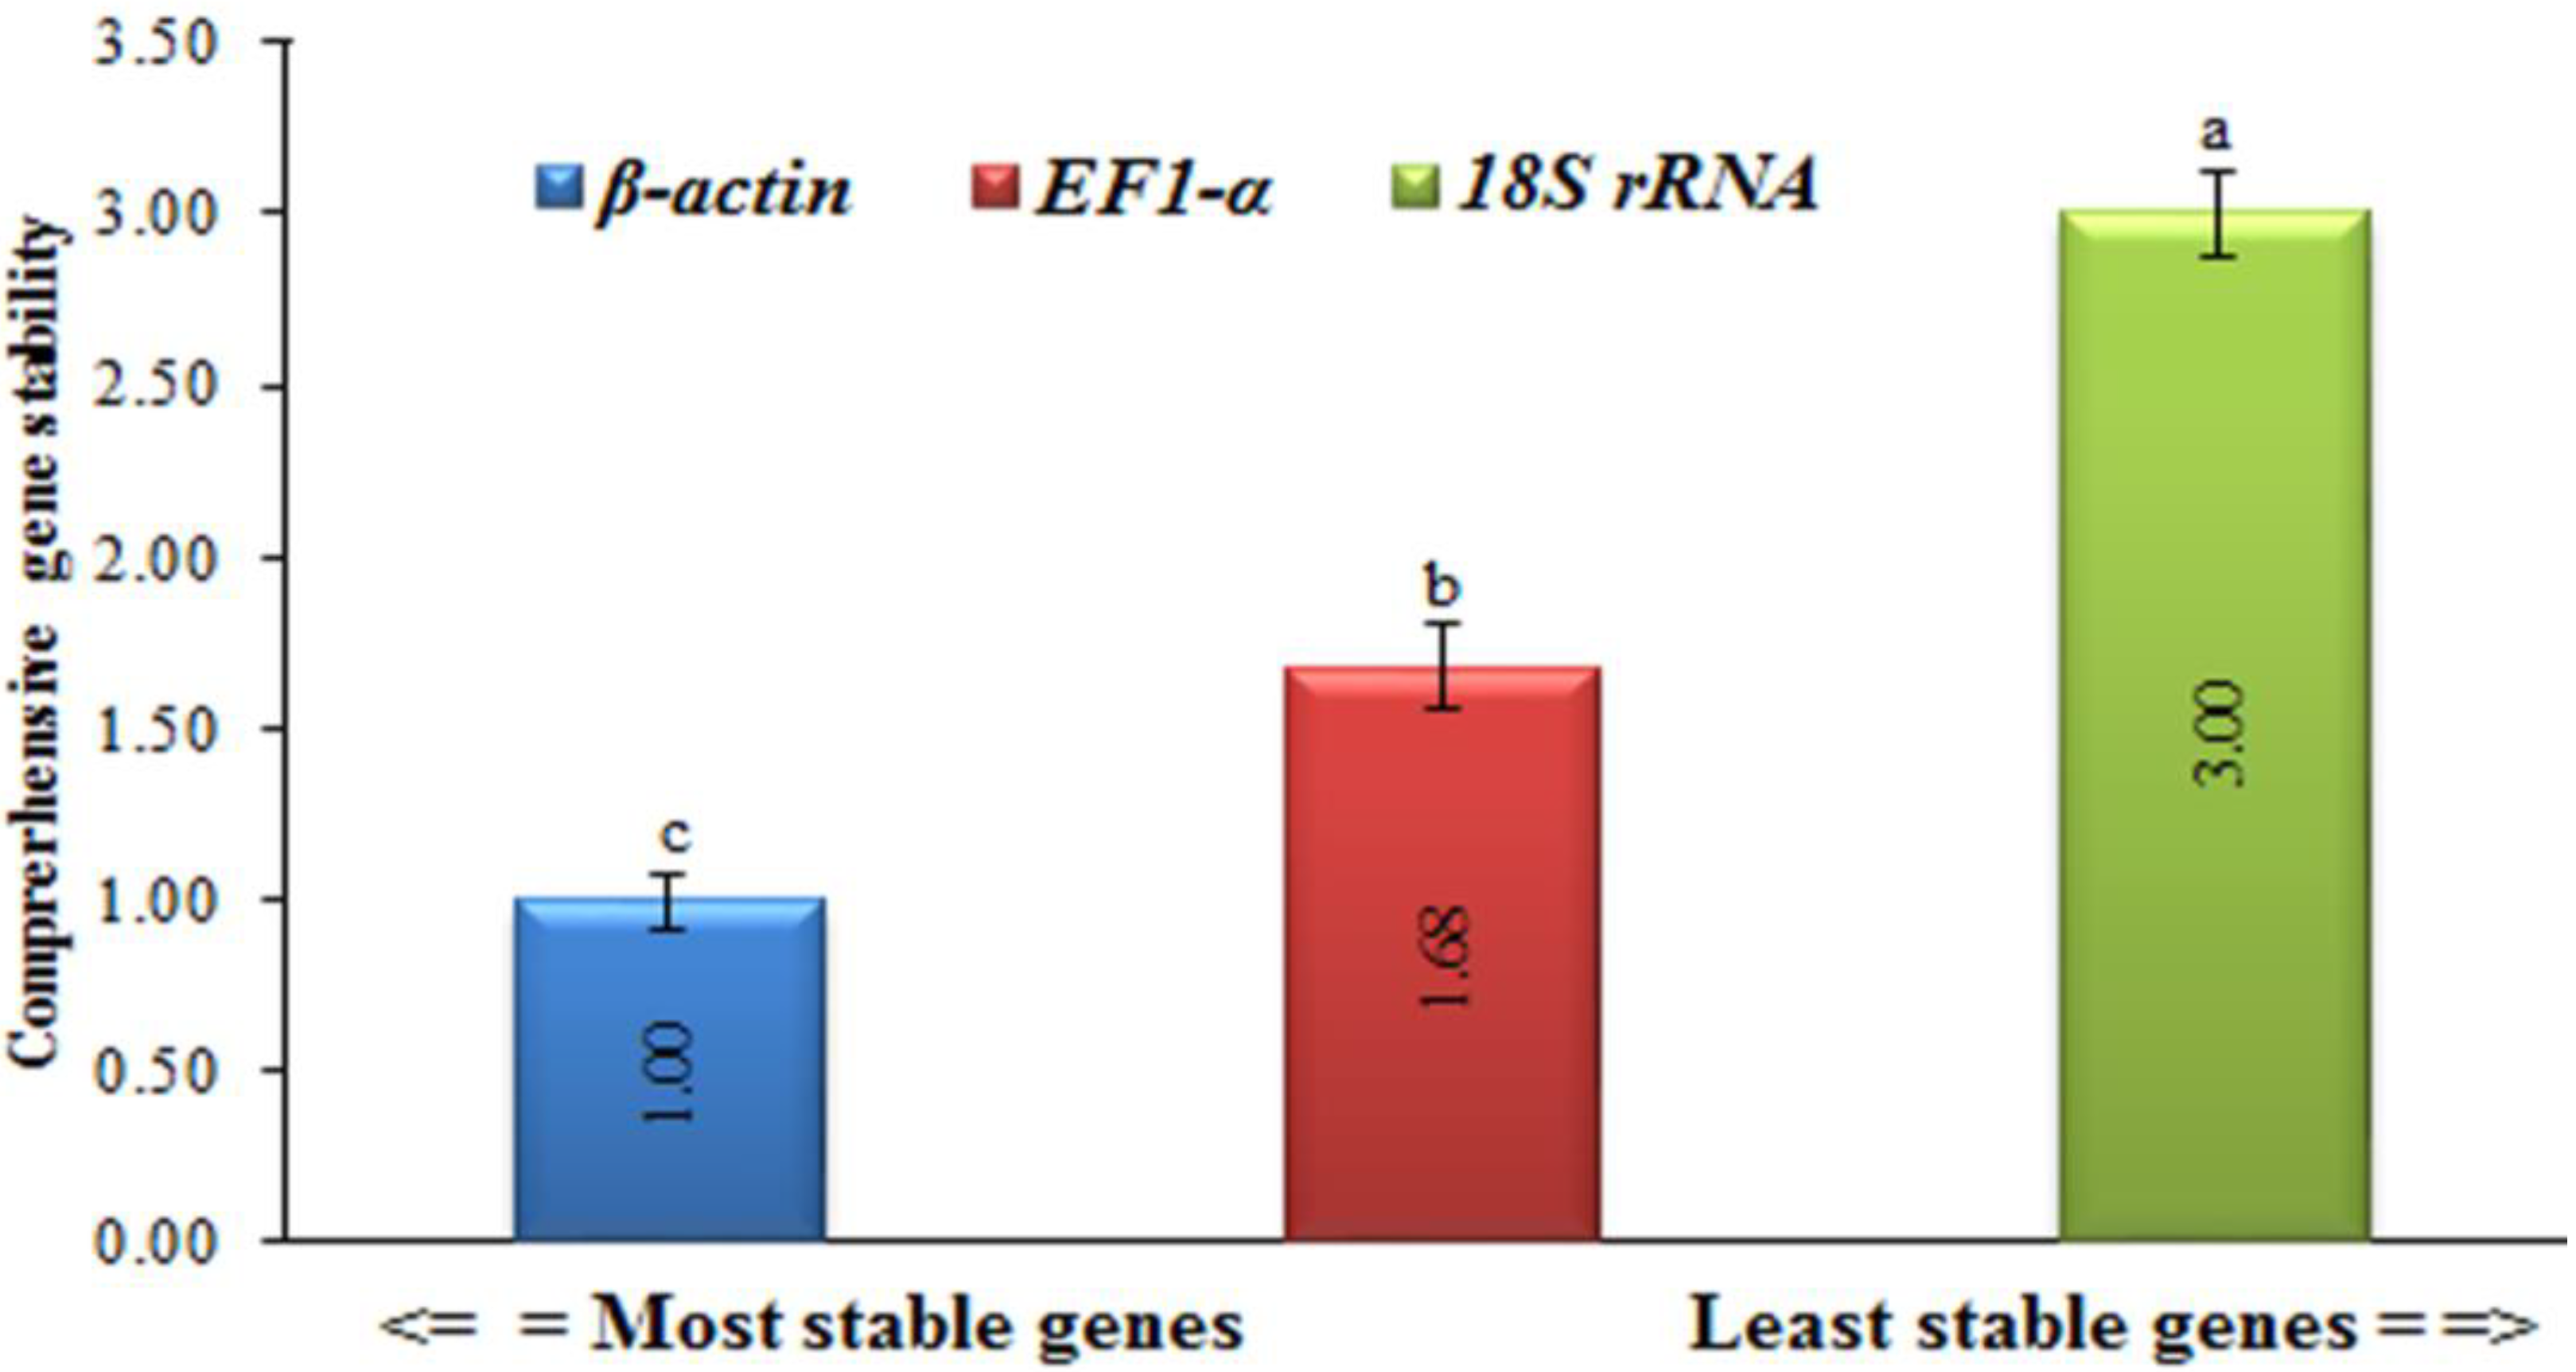
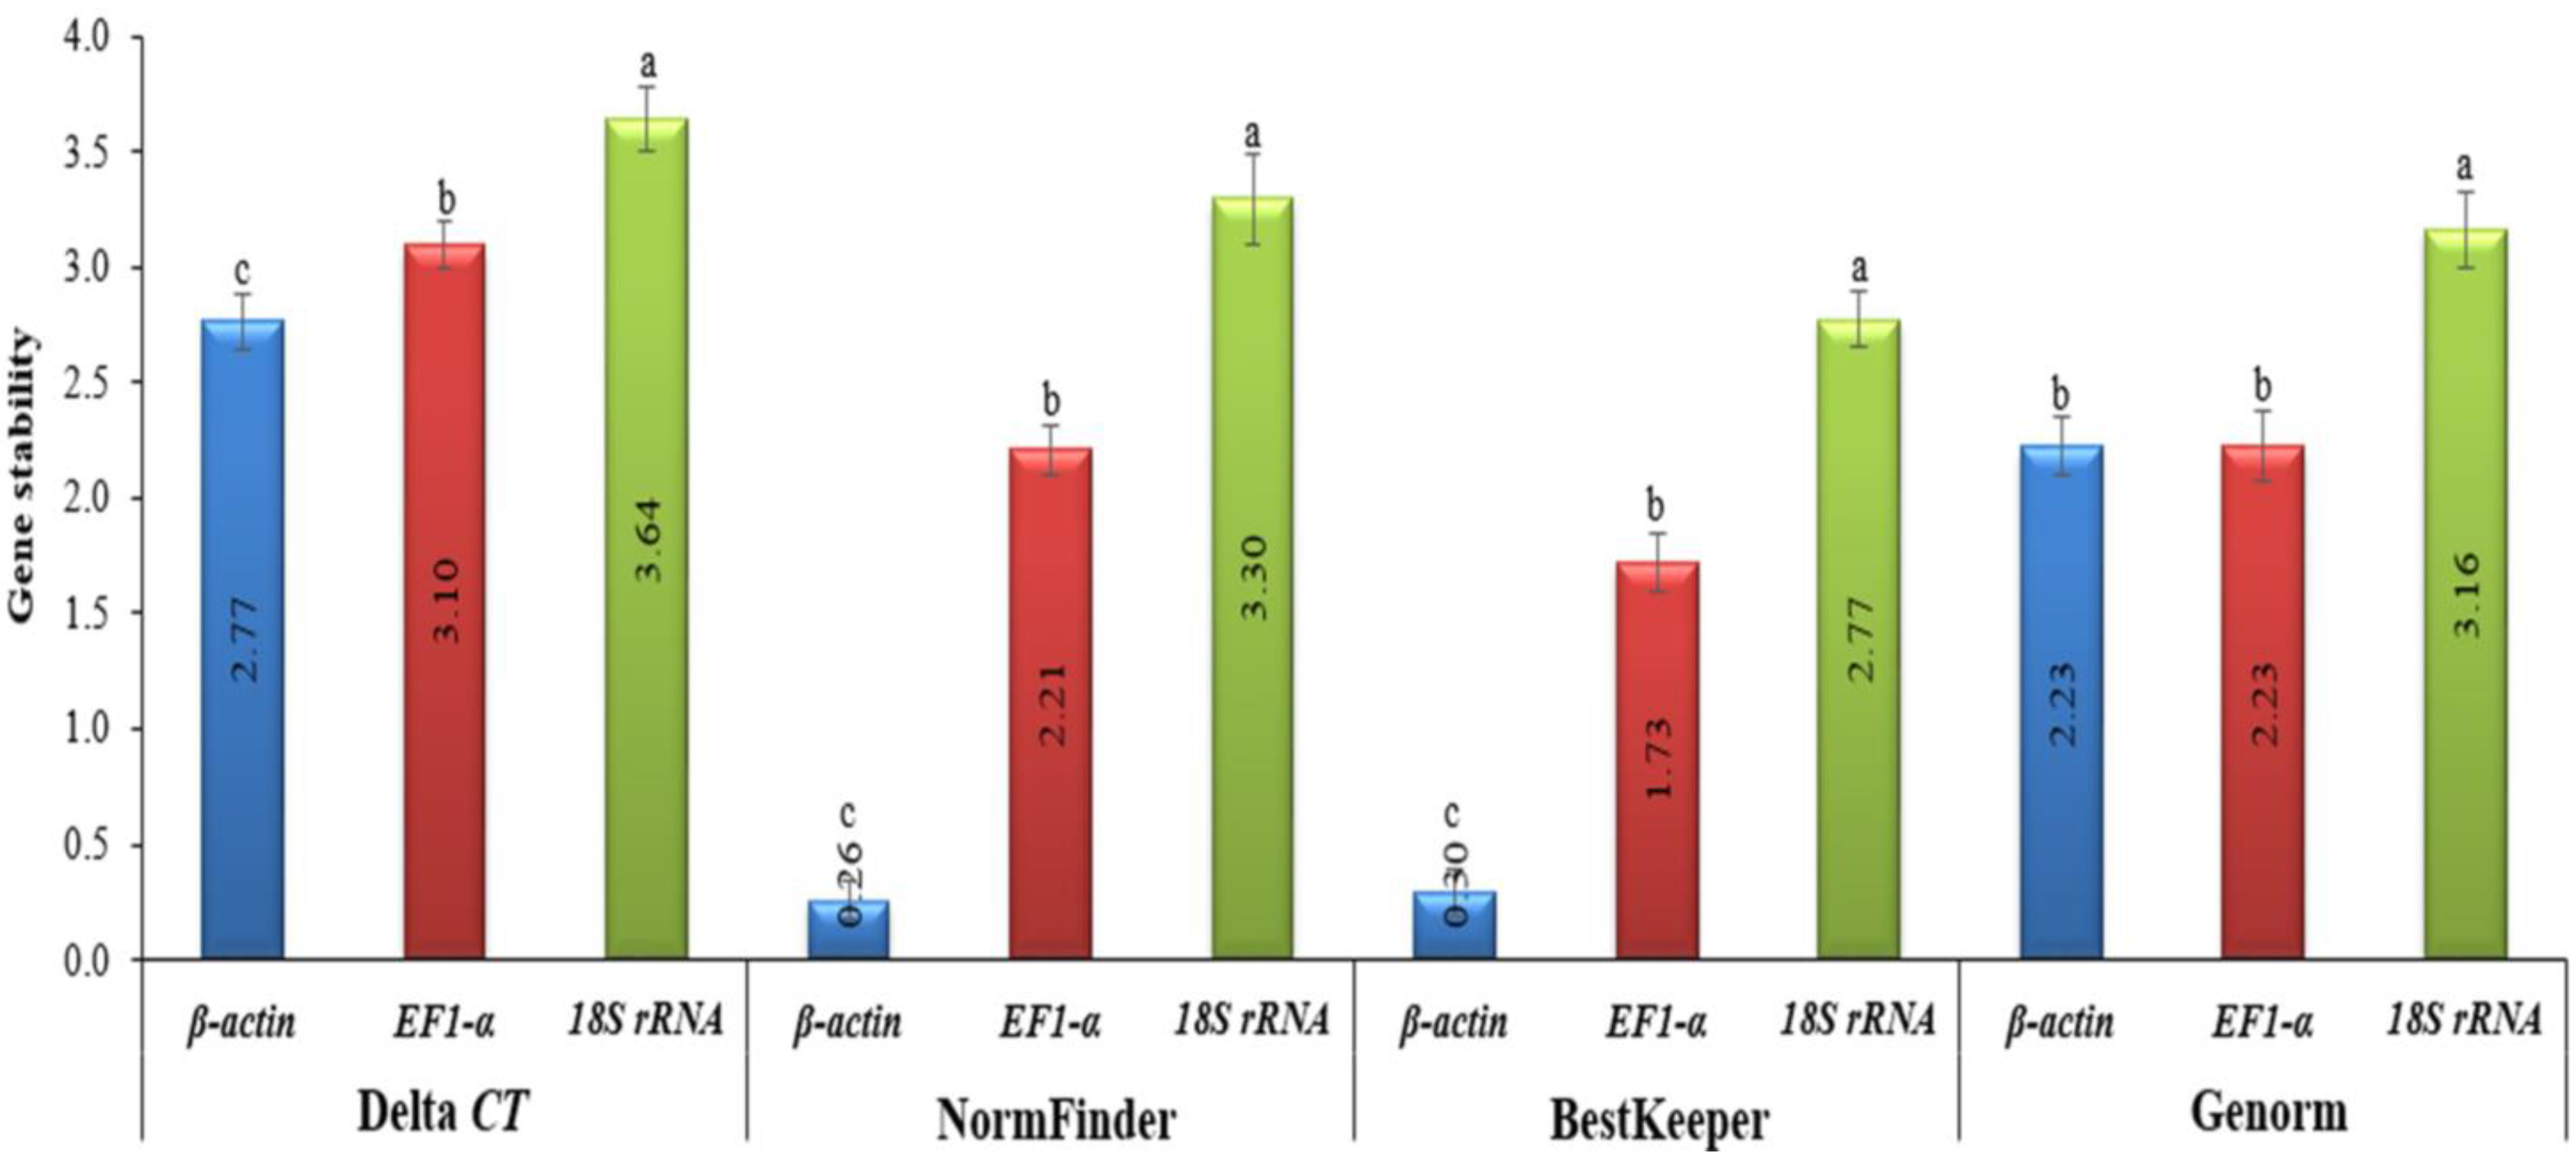
In order to provide an overview of the relative abundance of the three reference (housekeeping) genes in tomatoes, we determined cycle threshold (CT) values for all of these genes under both TMV and CMV infections (Supplementary Figure S1). The CT values for EF1-α and 18S rRNA greatly fluctuated, with a difference between the largest and smallest values of about 60% for 18S rRNA and 48% for EF-1α. Even though there was little β-actin CT fluctuation observed, the difference between the largest and smallest values did not exceed 4%, and it had the lowest standard error of all samples (Figure 3 and Figure 4). This provided the necessary evidence that β-actin could be used appropriately as an internal control in the downstream gene expression analyses of TMV and/or CMV tomato infection. The stability of the housekeeping genes was demonstrated in four distinct ways (Figure 3 and Figure 4). Based on the data analysis, it was determined that actin exhibited the highest level of gene expression stability.
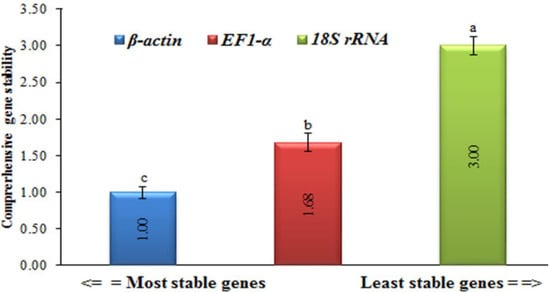
Figure 3.
The four different methods used to evaluate the gene expression stability levels of housekeeping genes in healthy, TMV-, and CMV-infected tomato plants. The Delta CT method, NormFinder, and BestKeeper (as is harbored by β-actin) indicates more stable gene expression. Average gene stability values (M value) across all treatment groups using GeNorm revealed more stable β-actin and EF-1α genes. The values in the columns represent the means of five independent biological samples, while the error bars show the standard deviation (SD). According to Tukey’s HSD test (p ≤ 0.05), the values in the columns labeled with the same letter (a, b, and c) do not differ statistically.
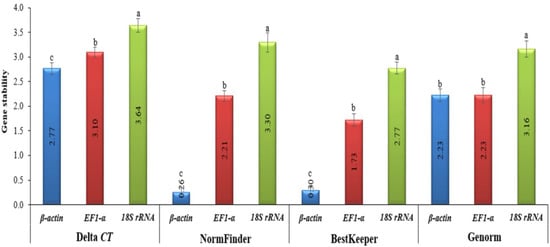
Figure 4.
Comprehensive gene expression stability levels of three housekeeping genes (β-actin, EF-1α, and 18S rRNA) in healthy, TMV-, and CMV-infected leaf tissue samples of tomato plants. Statistically, there is no significant change between the means of the columns that start with the same letter.
The obtained results are consistent with those of Mascia et al. [25], who reported that β-actin was one of the four least stable genes throughout virally infected tomato tissues. In RT-qPCR assays, the two housekeeping genes (18S rRNA and EF1-α) are typically used as reference genes [33], and 18S rRNA has been shown to be suitable for normalization in cereals infected with the barley yellow dwarf virus [34]. Even though EF1-α was sequentially rated by the GeNorm analysis, the performance of EF1-α and 18S rRNA was inadequate [35]. Additionally, our findings are in line with previous research in virus-infected tomatoes, which found highly varied levels of expression for both 18S rRNA and EF1-α [25]. On the other hand, the incorrect use of invalidated reference genes might introduce bias into the research and lead to data misinterpretation [36]. Nevertheless, precise transcript normalization using stably expressed reference genes at diverse biological and physiological states is required for an accurate target gene expression analysis [37]. The data for the melt curve analysis and standard curves developed for each potential reference gene were included in the study, as well as a set of primers constructed for the ten candidate genes. In the future, this information can be used to choose one reference gene for use in normalizing RT-qPCR data related to tomato–virus interactions [38].
3.3. RT-qPCR Analysis of Pathogenesis-Related (PR) Gene Expressions
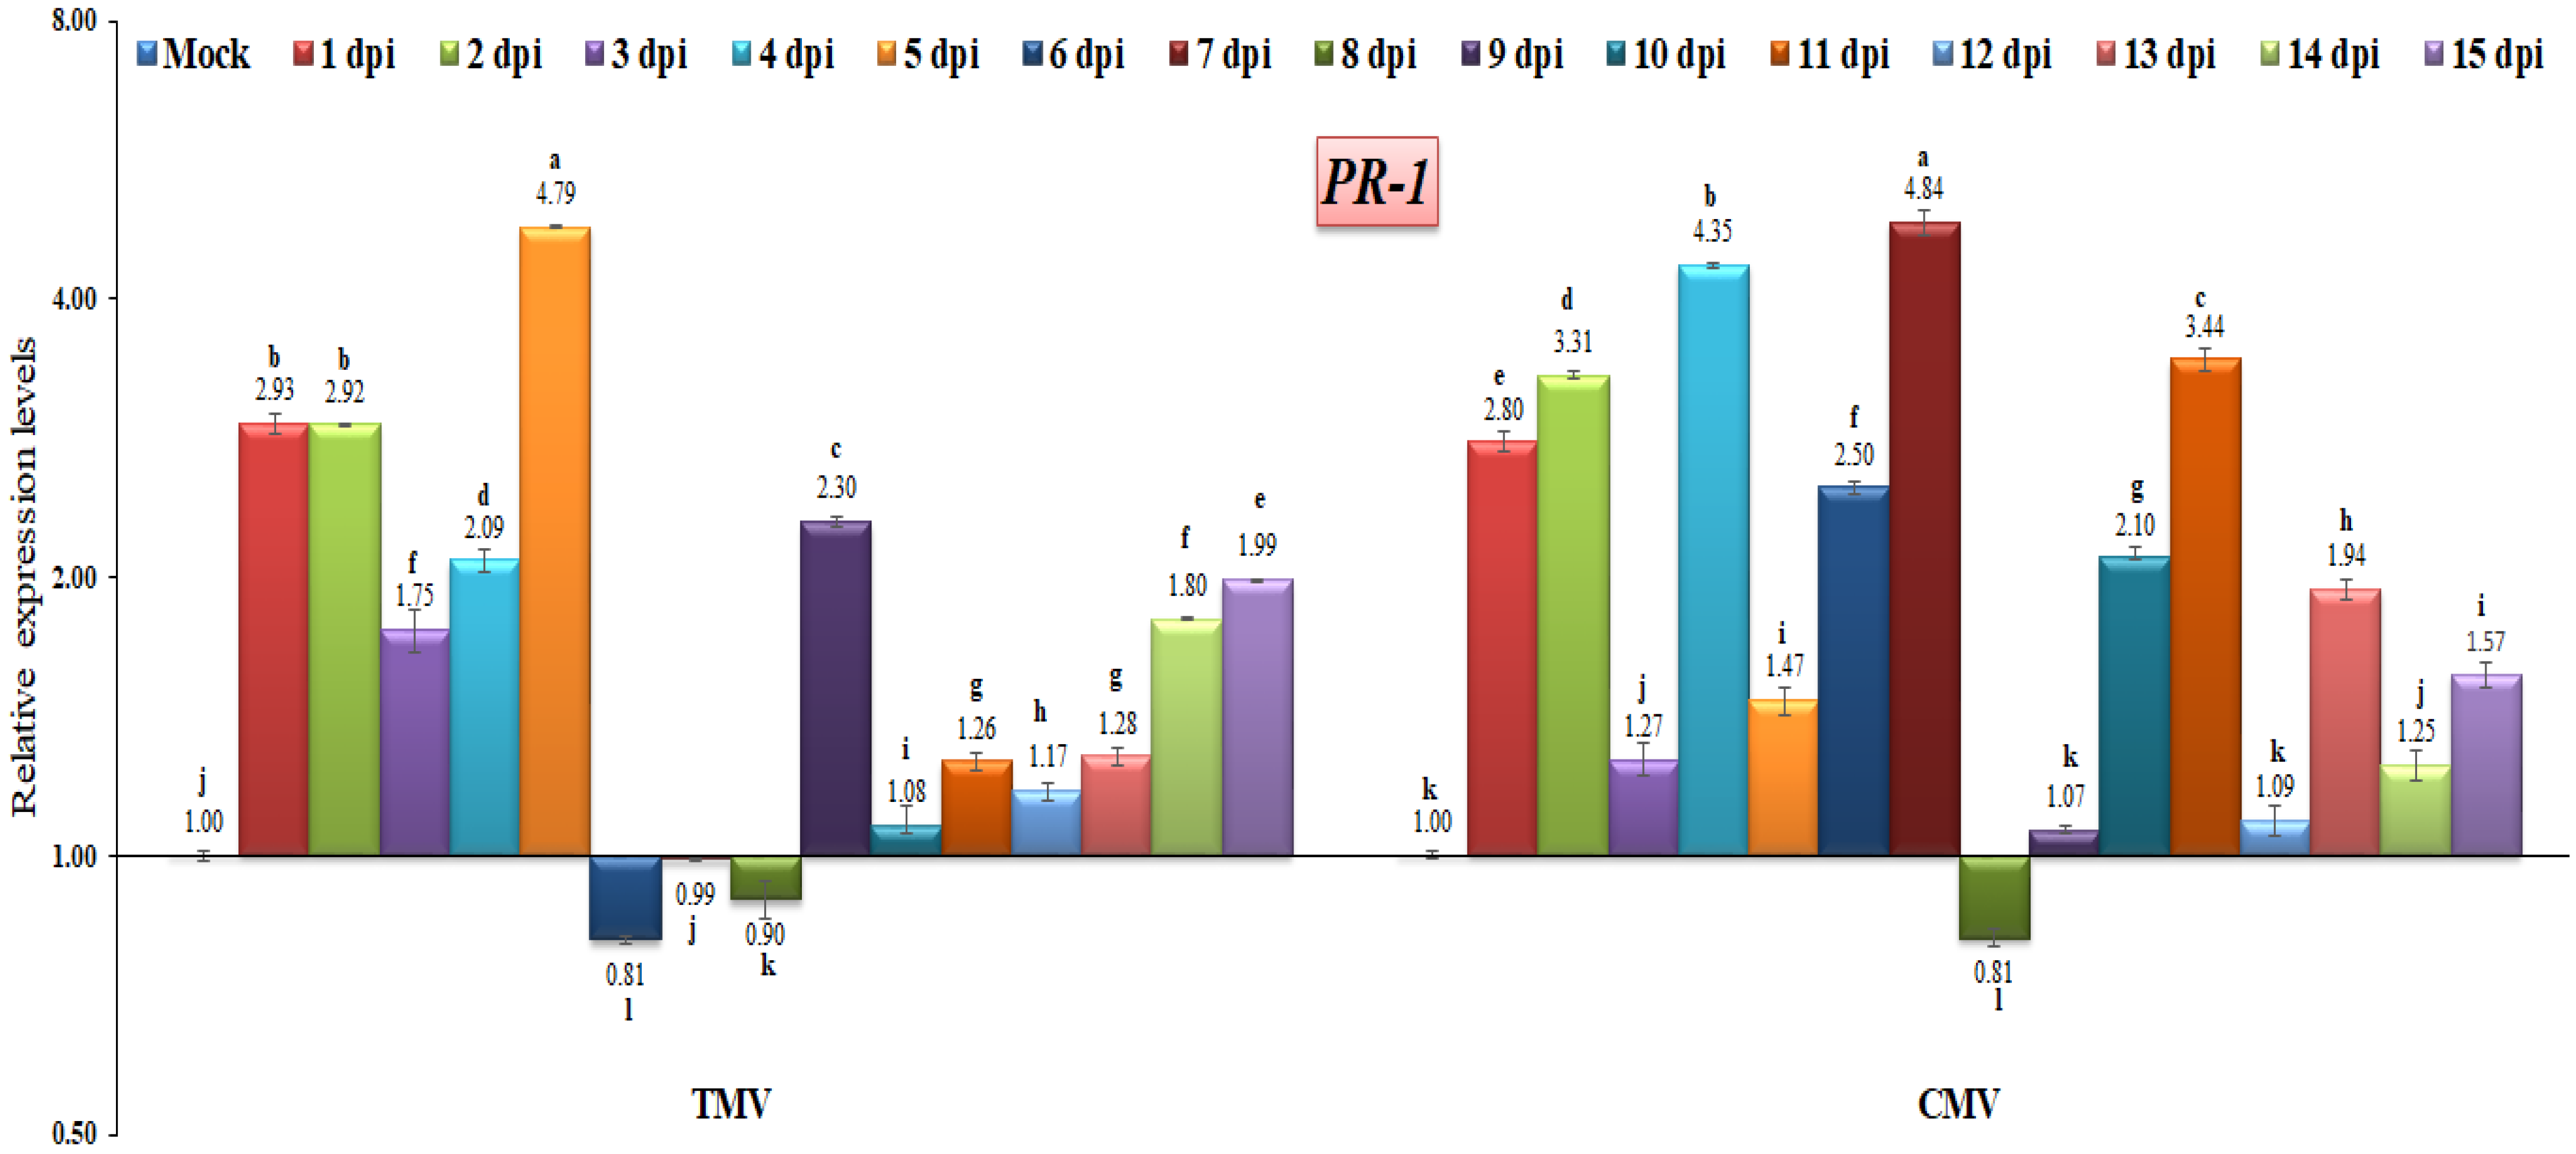
There have been a number of studies that point to pathogenesis-related proteins (PR) as the proteins that are responsible for systemic acquired resistance (SAR), as well as the proteins that are effective at halting the progression, multiplication, or spread of pathogens [27,35,39]. In the current study, both TMV and CMV infections induced the expression of PR-1 at almost identical time intervals (Figure 5). The highest transcriptional levels of PR-1 were observed in TMV-infected tomato plants at 1, 2, 4, 5, 9, and 15 dpi, with levels 2.93-fold, 2.92-fold, 2.09-fold, 4.79-fold, and 2.30-fold, and 1.99-fold, respectively, higher than the control. On the other hand, the higher gene expression of CMV-infected tomato plants was shown at 1, 2, 4, 6, 7, 10, and 11 dpi, with the relative expression being 2.80-fold, 3.37-fold, 4.35-fold, 2.50-fold, 4.84-fold, 2.10-fold, and 3.44-fold, respectively, greater than the control. These results agree with those of ElMorsi et al. [35], who reported that the PR-1 gene was quickly induced or up-regulated during the early stages of an onion plant with IYSV infection, and it was continuously expressed in onion tissues. Additionally, similar results here agree with Cutt et al. [40], who found that PR-1 proteins in tobacco were associated with viral resistance. Similar results indicated that the induction of PR-1 at 2 dpi appeared to reflect the early activation of SA biosynthesis in PVY-infected potato tissues [41]. On the other hand, the PR-1 gene expression decreased at 6, 7, and 8 dpi (0.81-fold, 0.99-fold, and 0.90-fold, respectively) in the TMV-infected tomato plants compared with the CMV-infected tomato plants, where the down-regulation of the gene expression occurred at 8 dpi only (Figure 5). These data suggest that the tomato PR-1 is not sufficient for resistance to TMV or CMV. Plants synthesize different PR-1 proteins and have different ways of fighting off various plant pathogens [42,43]. Many studies have found that the increased expression of PR-1 in transgenic plants is linked to increased resistance to bacteria, fungi, and oomycetes, but not to viruses [44,45]. According to the findings of this study, the relative gene expression of PR-1 may be associated with a response to viral infection.
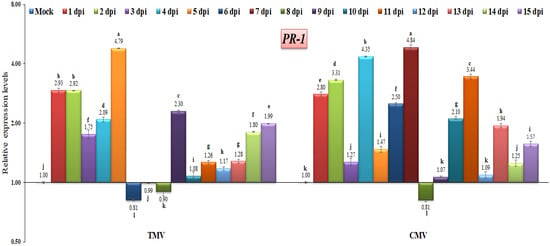
Figure 5.
Comparison between the relative transcriptional levels of the tomato PR-1 gene in TMV- and CMV-infected tissues compared to control at 1 to 15 dpi. The columns show the mean value from five biological replicates, and the bars represent the standard deviation (SD). Means were distinguished using Tukey’s HSD test at p ≤ 0.05 levels, and small letters are used to represent differences. Columns of data showing different letters are significant.
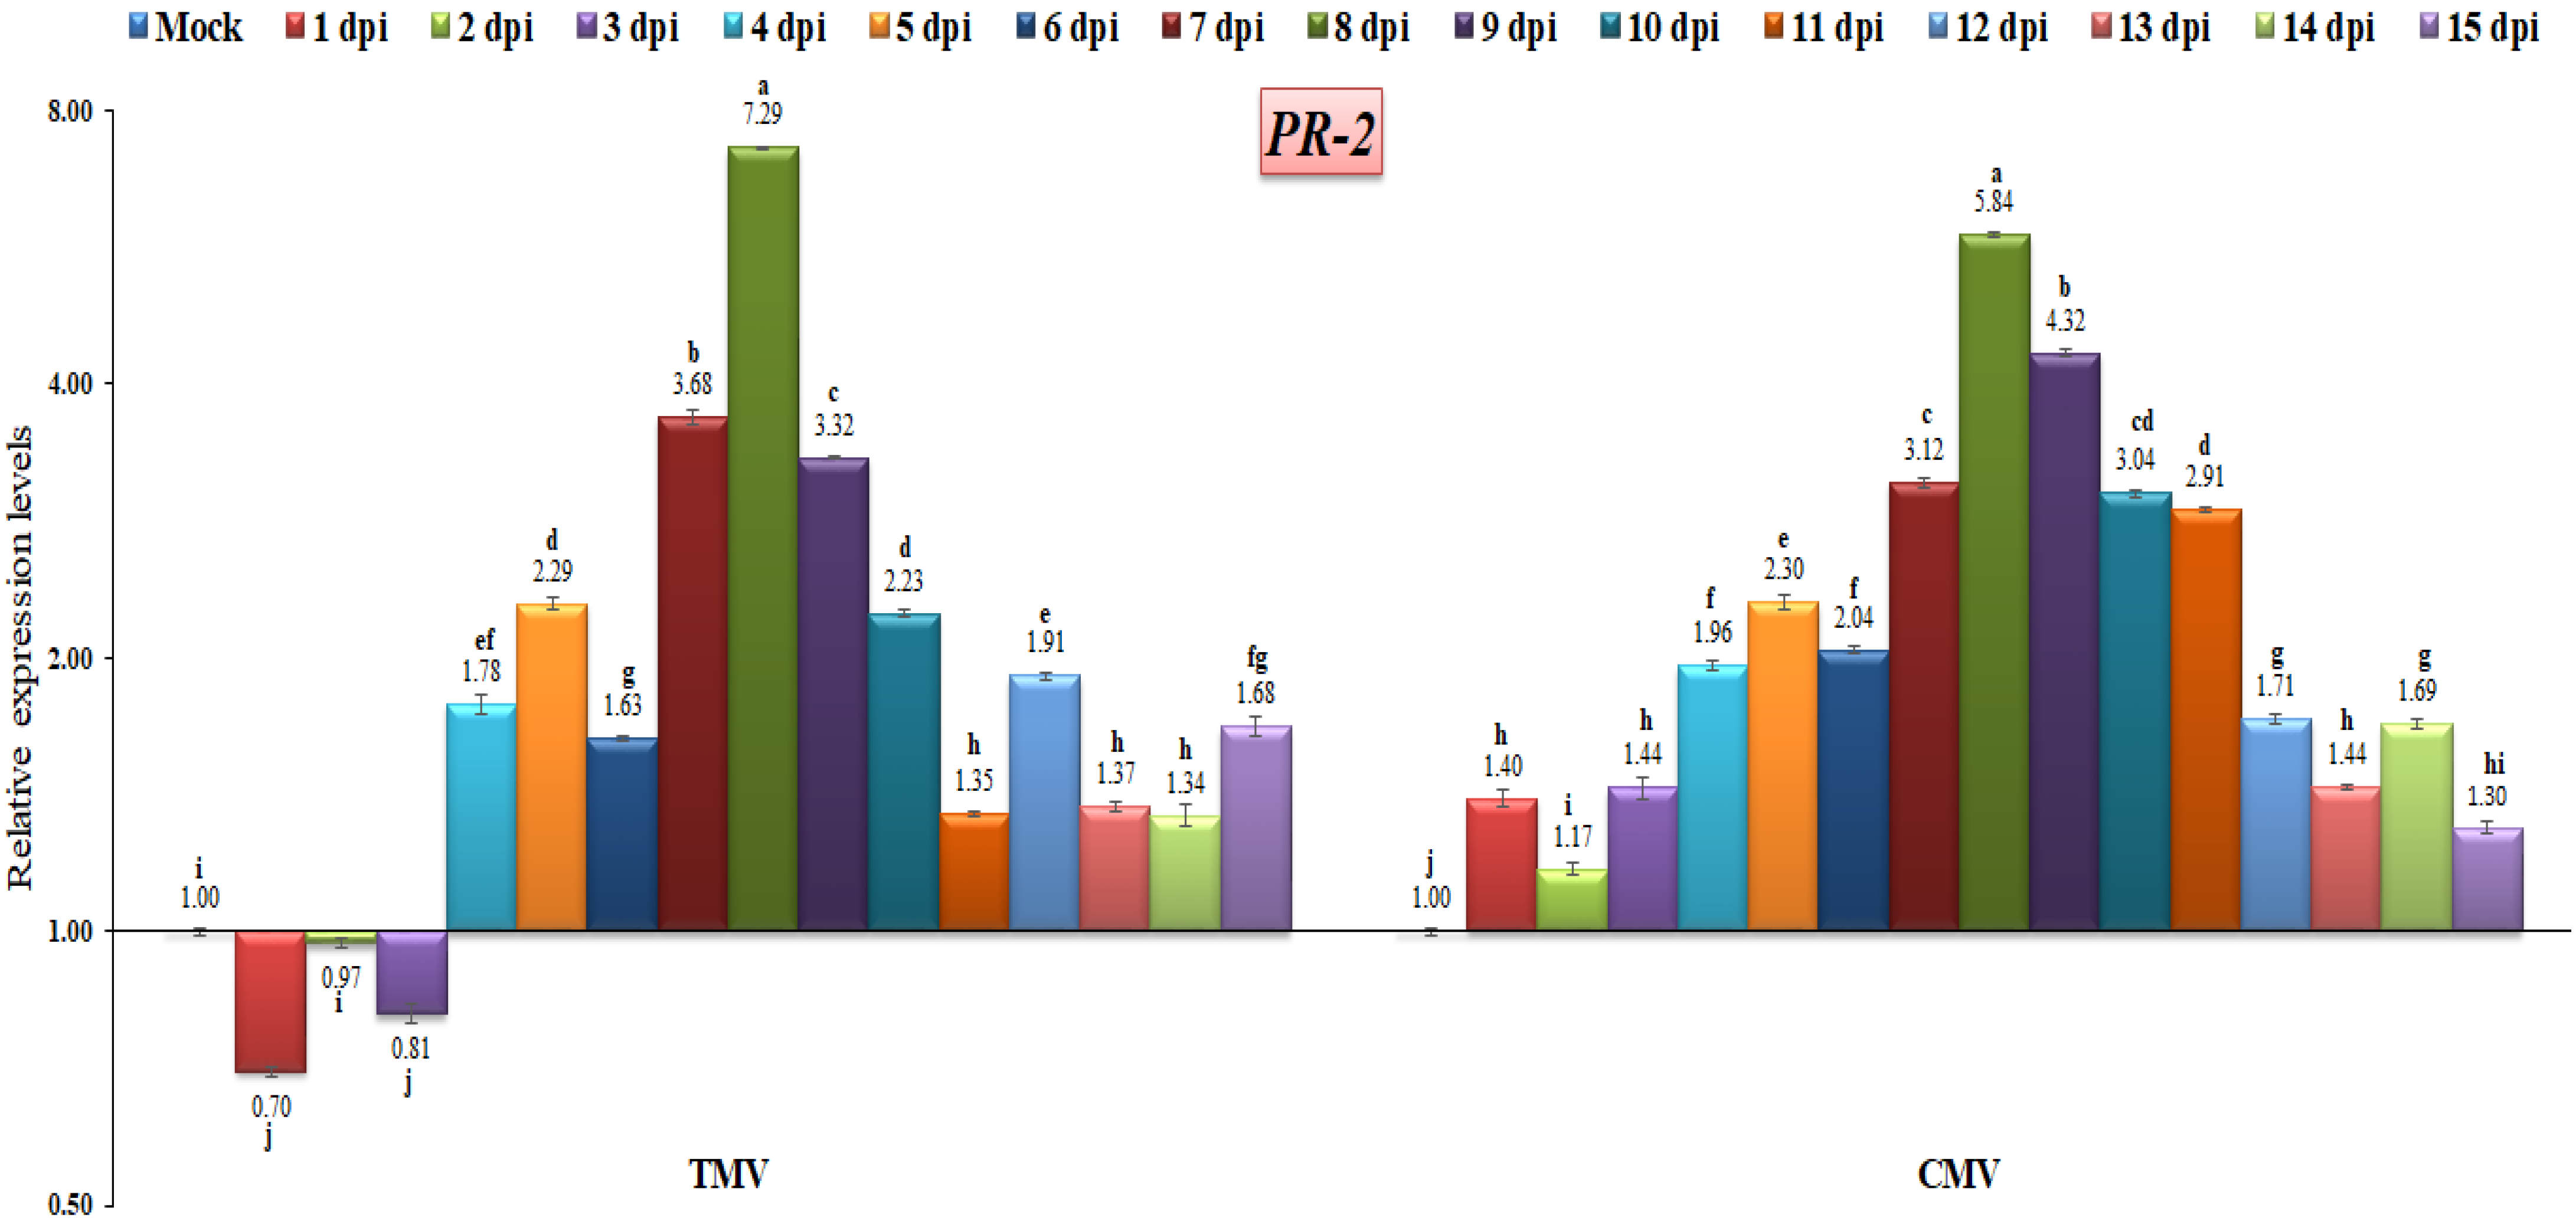
The PR-2 gene in tomato plants infected with TMV or CMV showed significant transcriptional levels at 8 dpi, with levels of 7.28-fold and 5.84-fold, respectively, as compared to uninfected tomato plants. The expression level was down-regulated at the first three days of TMV infection, with relative expression level changes of 0.7-fold, 0.97-fold, and 0.81-fold, respectively. On the other hand, compared to the control, the CMV-infected tomato plants showed up-regulation at all days post-infection (Figure 6). Therefore, we hypothesized that the PR-2 gene was related to viral infection. The PR-2 gene, which codes for a 1,3-glucanase, plays a role in the cell-to-cell spread of virus movement complexes by limiting callose accumulation around the plasmodesmata [46]. TMV is thought to increase tobacco activation for PR-2 genes, allowing it to move more easily into cells [47]. Our findings are in agreement with the previous studies that reported a clear induction of PR-2 during viral infections in Arabidopsis, tobacco, potato, onion and tomato plants [35,48,49]. Furthermore, lowering tobacco PR-2 reduces susceptibility to viral infection [50]. Moreover, the reduction in tobacco PR-2 expression decreased viral infection susceptibility, whereas overexpression increased potato virus Y movement across cells [51,52]. Although PR-1 expression is the most commonly utilized as a marker for resistance response after viral infection, it has been demonstrated that PR-2 is elevated in response to viral infection in tobacco leaves [53].
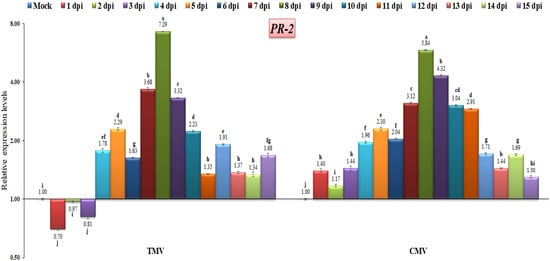
Figure 6.
Comparison between the relative transcriptional levels of the tomato PR-2 gene in TMV- and CMV-infected tissues compared to control at 1 to 15 dpi. The columns show the mean value from five biological replicates, and the bars represent the standard deviation (SD). Means were distinguished using Tukey’s HSD test at p ≤ 0.05 levels, and small letters are used to represent differences. Columns of data showing different letters are significant.
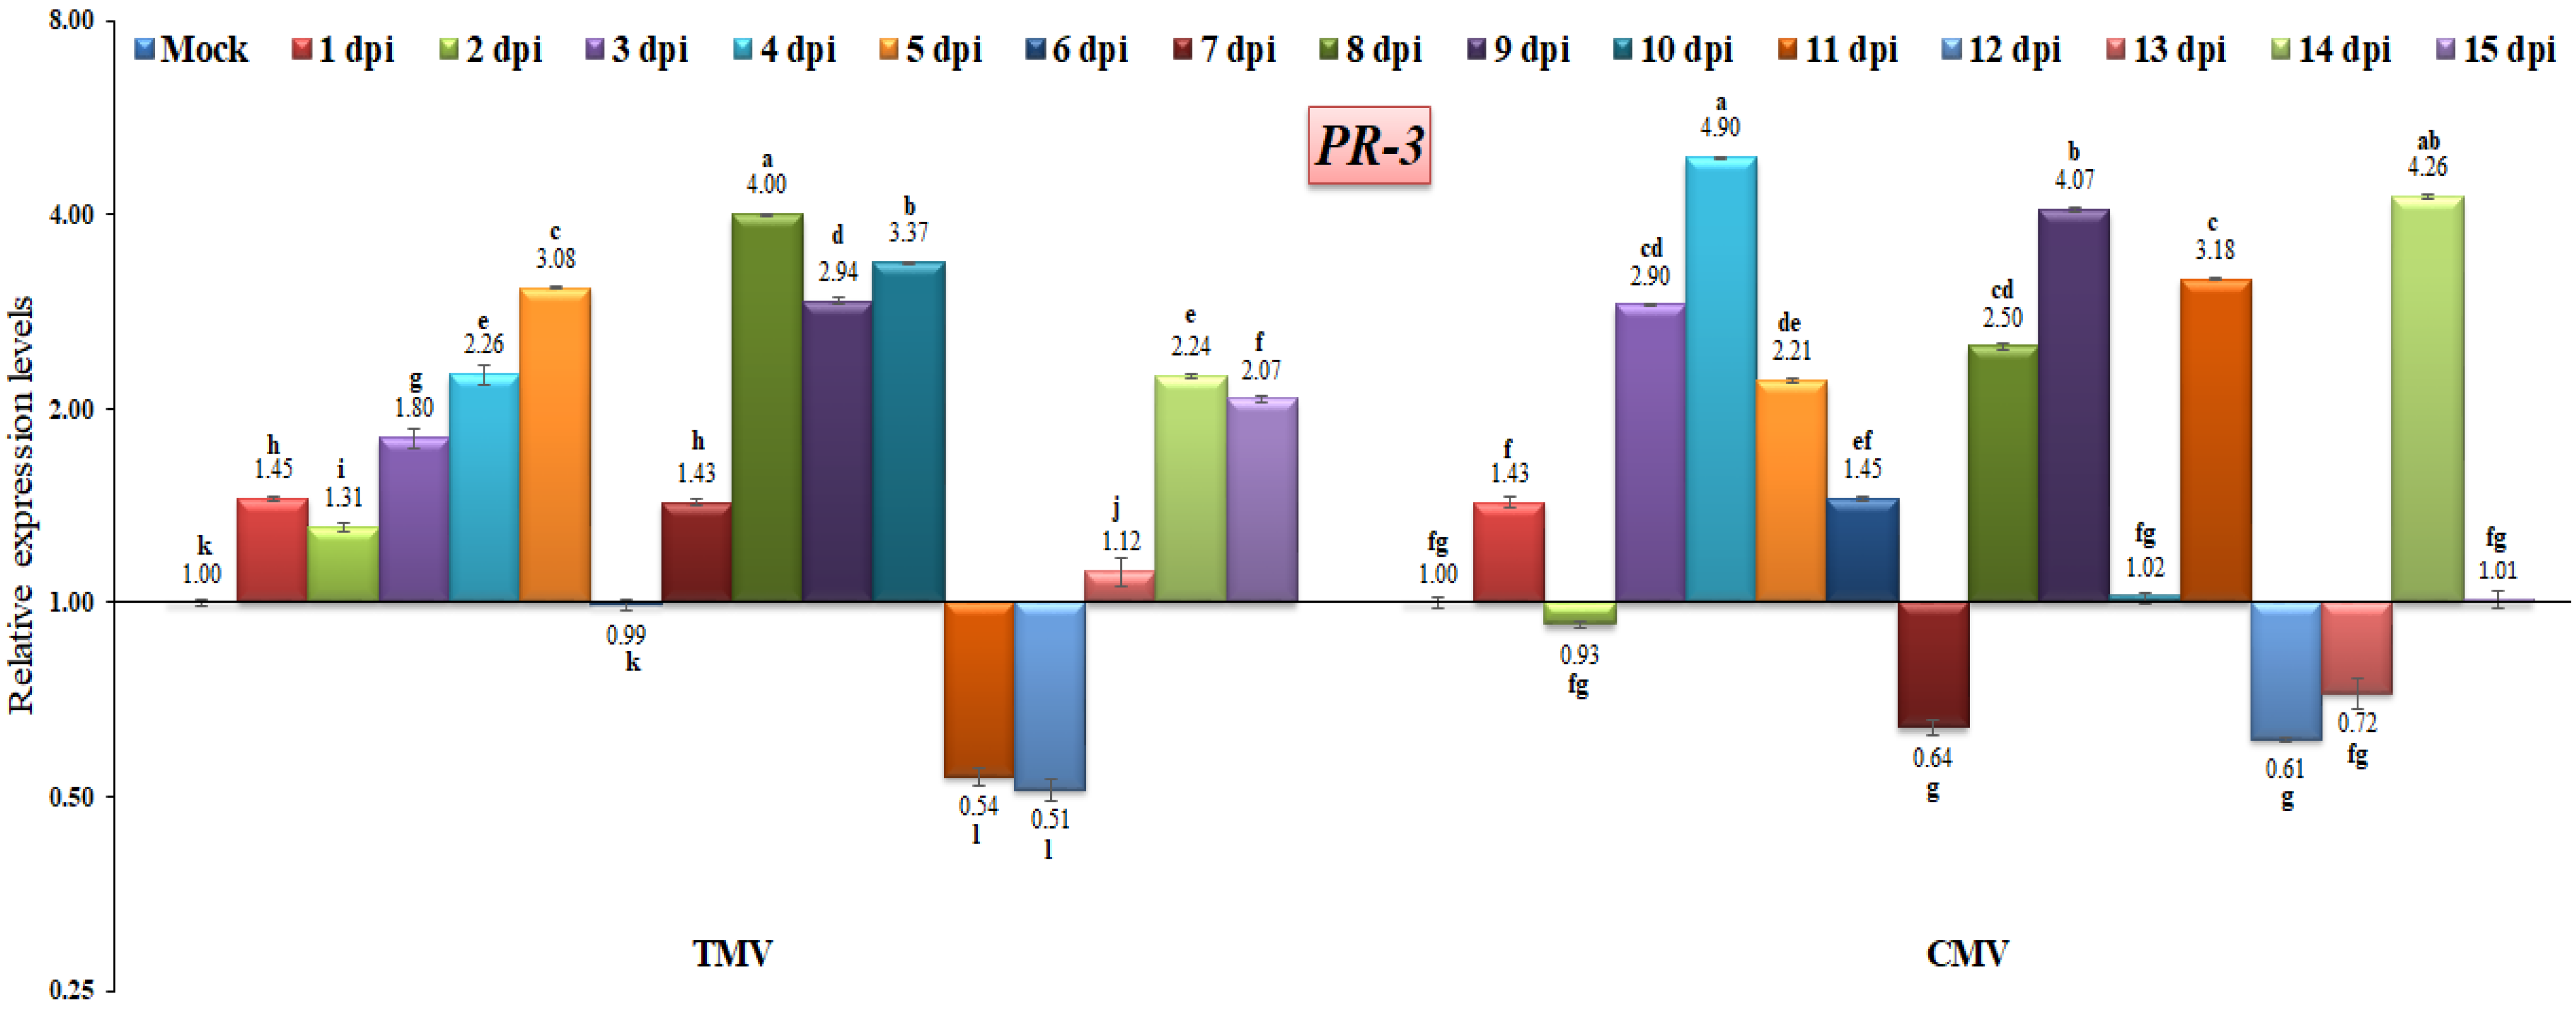
The PR-3 family of proteins includes chitinases, which are responsible for catalyzing the hydrolysis of chitin [39,54]. Chitinases are mainly involved in the organism’s defense against pathogen attack in both animals and plants [55]. The present study showed that PR-3 gene expression was rapidly induced following the TMV infection of tomato plants, increasing from 1.45-fold at 1 dpi to 4-fold at 8 dpi (Figure 7). Conversely, PR-3 was down-regulated at 11 and 12 dpi, with a relative expression level about 0.53-fold lower than the control (Figure 7). On the other hand, PR-3 was induced in most of the CMV-infected tomato plants, with the highest relative expression levels being 4.90-, 4.07-, and 4.26-fold higher than the control at 4, 9, and 14 dpi, respectively (Figure 7). These results are the same as those of Abdelkhalek et al. [56], who found that PR-3 accumulated in the first few days after a viral infection and became more active and higher until it reached its highest level at 4 days post-infection, which was 4.64-fold higher than in the control group. Additionally, the present findings agree with those of earlier research on the activation of chitinases in response to viral infections [57,58]. It has also been discovered that the infection caused by a pathogen boosts the naturally occurring production of enzymes that hydrolyze chitin [55,59,60,61]. On the other hand, it was seen that Setaria viridis at 10 days post-viral infection had a substantial reduction in PR-3 expression [62]. Such a down-regulation or decreased PR-3 expression level may be due to viral suppressor activity or cellular damage [56].
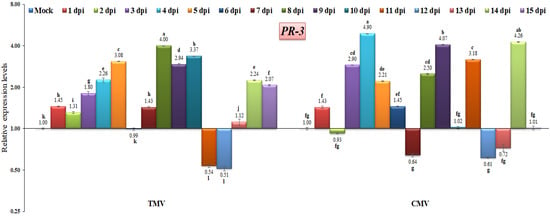
Figure 7.
Comparison between the relative transcriptional levels of the tomato PR-3 gene in TMV- and CMV-infected tissues compared to control at 1 to 15 dpi. The columns show the mean value from five biological replicates, and the bars represent the standard deviation (SD). Means were distinguished using Tukey’s HSD test at p ≤ 0.05 levels, and small letters are used to represent differences. Columns of data showing different letters are significant.
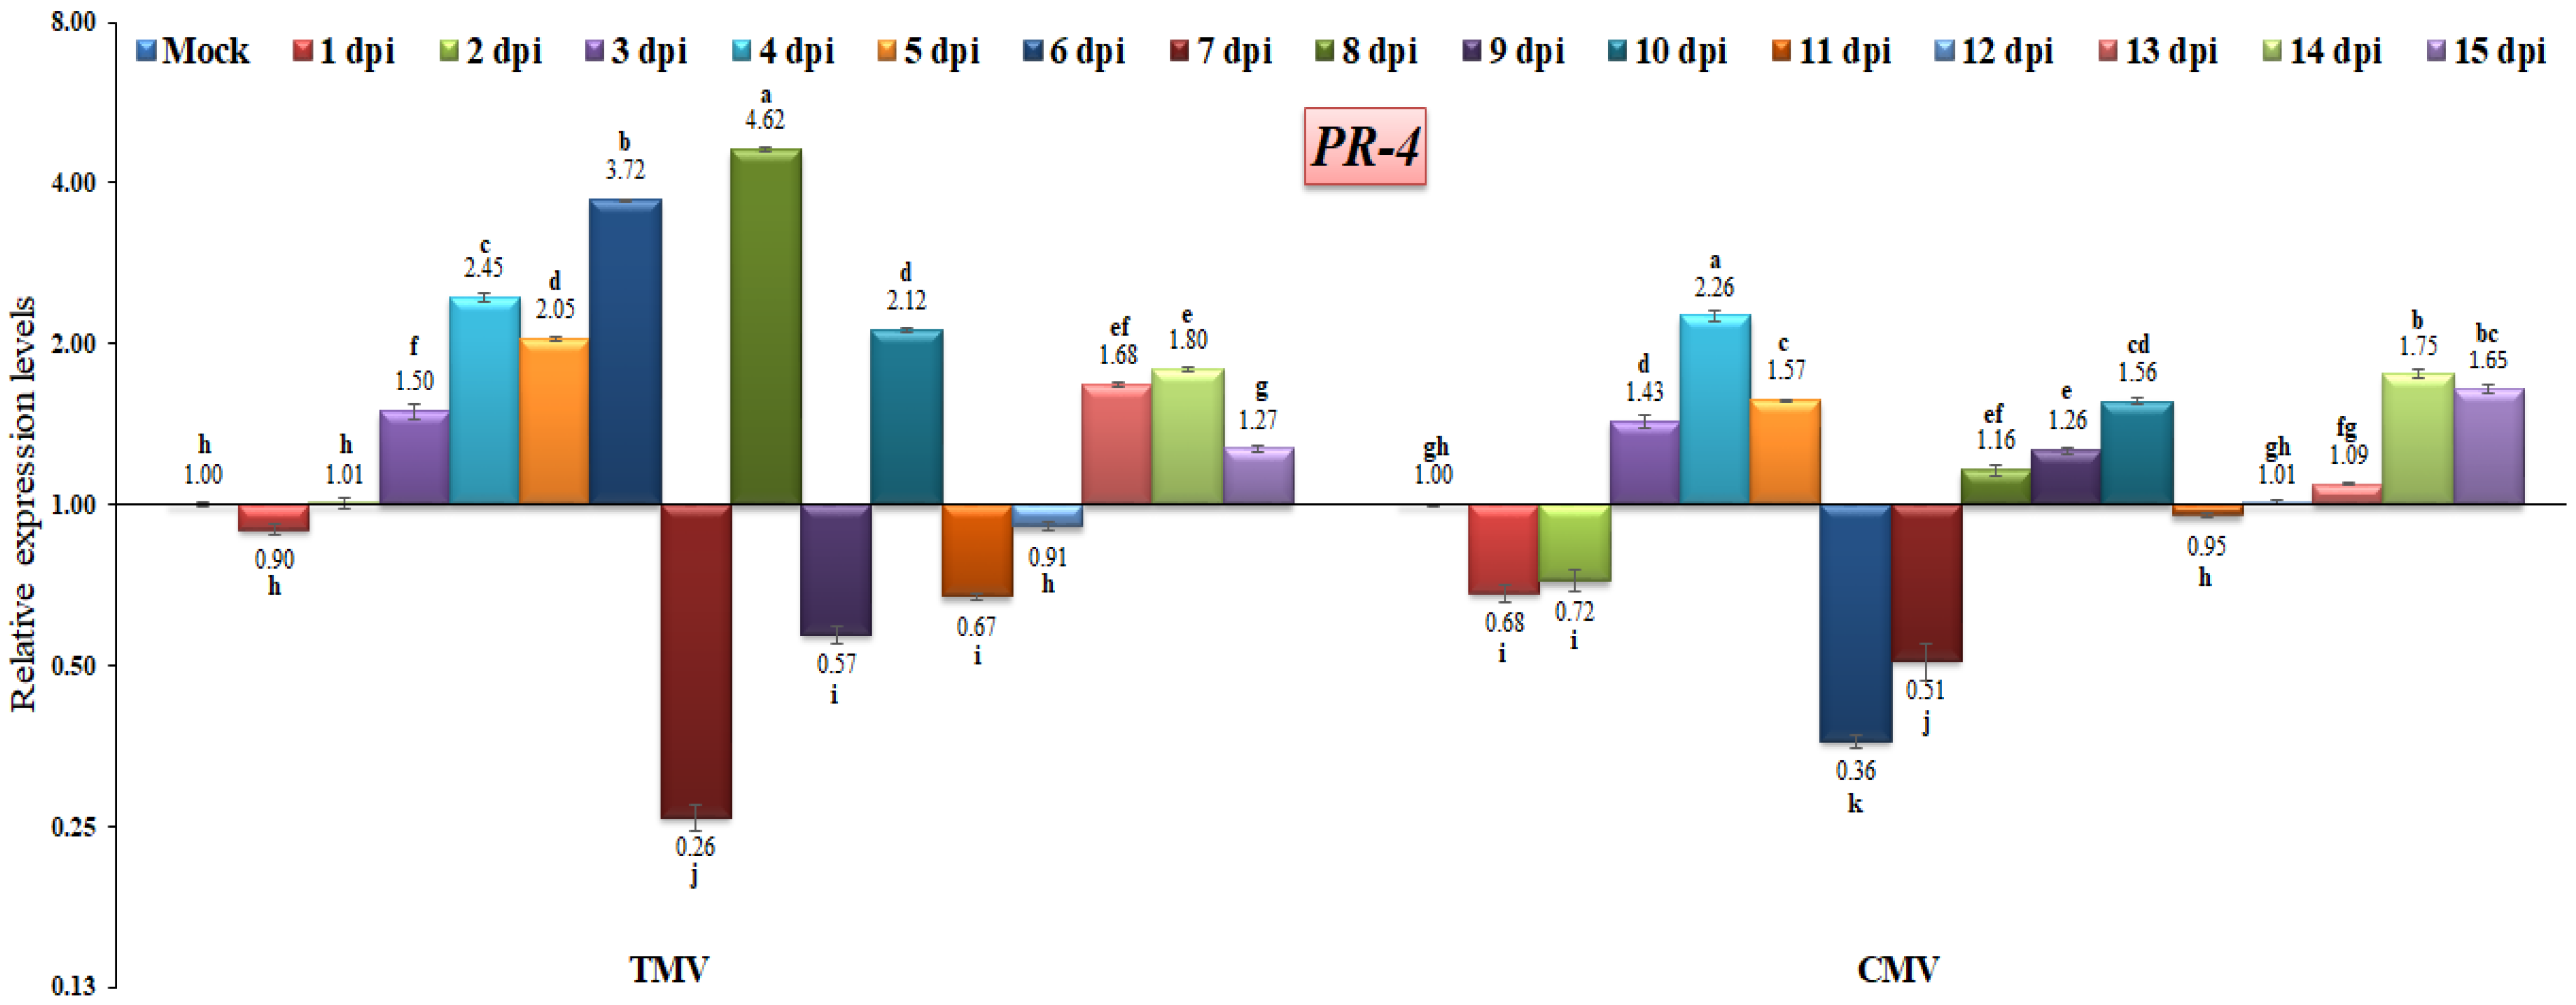
The PR-4 protein family is classified as chitinases [39] and can be linked with a chitin-binding domain, also known as the hevein-like domain. This relationship distinguishes PR-4 classes I (presence of a hevein-like domain) and II (absence of a hevein-like domain) [63,64]. However, other reports have shown its RNase activity [65] or nuclease activity [66]. In this study, the results revealed that PR-4 (class I) was induced after three days of both viral infection and then increased, reaching maximum expression levels of 4.62-fold at 8 dpi in TMV-infected plants and 2.26-fold at 4 dpi in CMV-infected plants when compared to the control (Figure 8). Compared to the TMV-infected plant profile, the CMV-infected plants exhibited lower levels of PR-4 expression, either through down-regulation at 1, 2, 6, and 7 dpi or up-regulation at 3, 4, 5, 8, 9, 10, 14, and 15 dpi (Figure 8). Thus, the expression profile of PR-4 may depend on the type of viral infection. The outcomes obtained are consistent with those that Wang et al. [67] reported. They stated that the TMV-infection-induced tobacco plants expressed PR-4 at moderate levels. It was reported that the increased overexpression of the PR-4 gene in Vitis vinifera led to improved resistance to infection by powdery mildew [68]. As a result, we hypothesized that PR-4 might not be associated with TMV or CMV resistance.
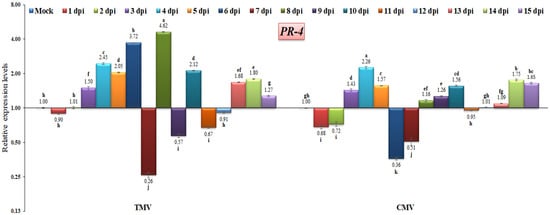
Figure 8.
Comparison between the relative transcriptional levels of the tomato PR-4 gene in TMV- and CMV-infected tissues compared to control at 1 to 15 dpi. The columns show the mean value from five biological replicates, and the bars represent the standard deviation (SD). Means were distinguished using Tukey’s HSD test at p ≤ 0.05 levels, and small letters are used to represent differences. Columns of data showing different letters are significant.
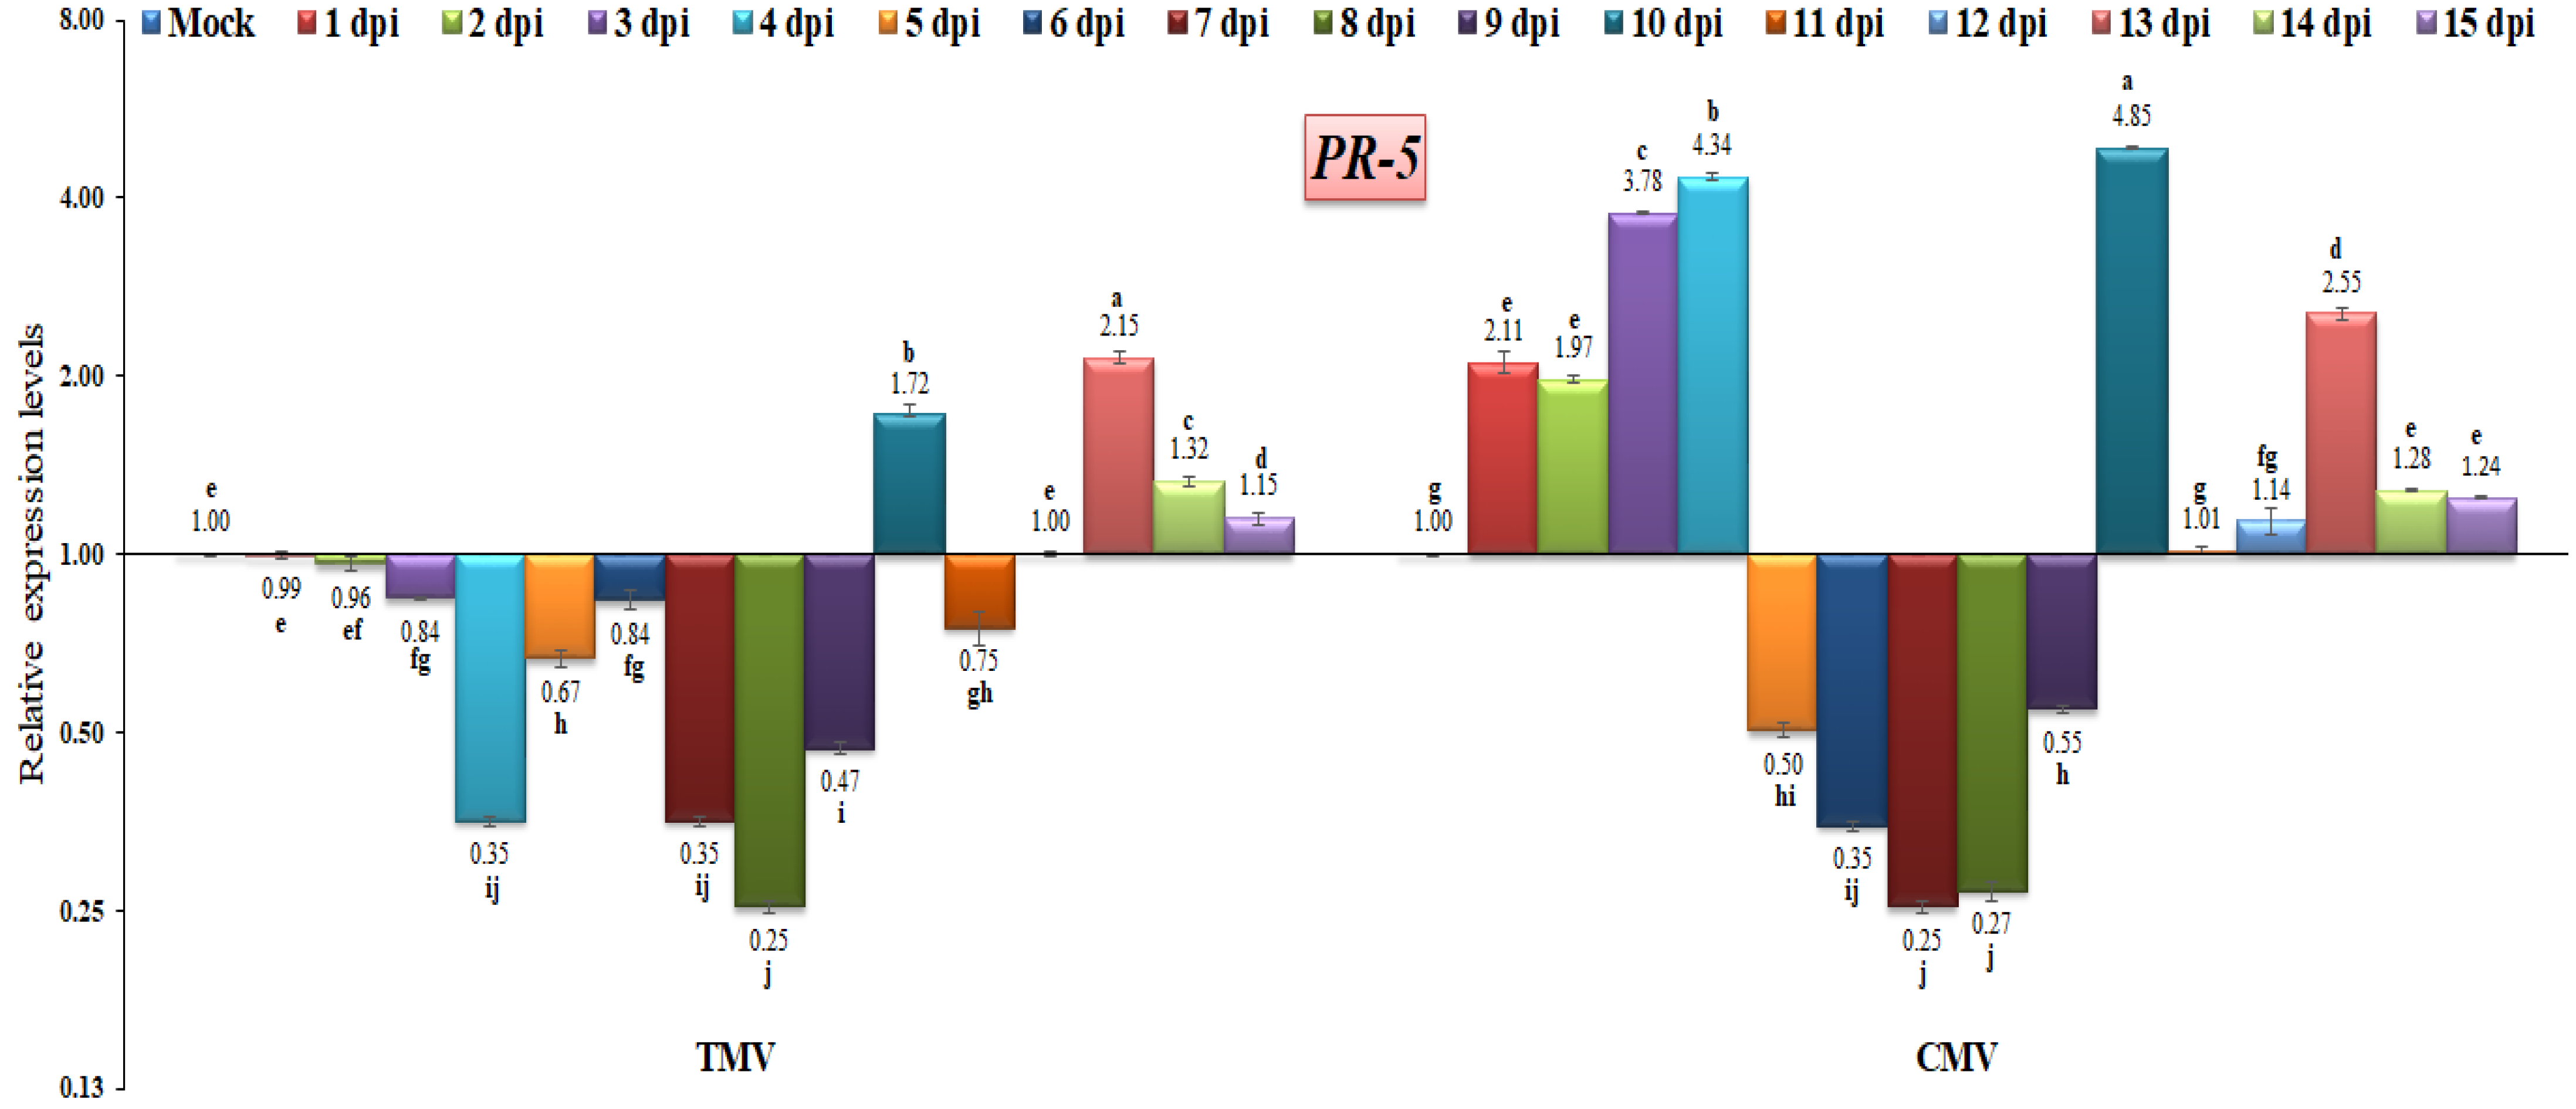
Concerning PR-5, it encodes a thaumatin-like protein, is present in cell vacuoles, and has antifungal activities [69]. PR-5 is activated by the host plant against a wide range of pathogens, and it is thought to be a basal resistance protein [9,67]. In the current study, the PR-5 gene exhibited down-regulation at almost all time intervals after TMV infection, except at 10, 13, 14, and 15 dpi, with relative expression levels that were 1.72-, 2.15-, 1.32-, and 1.15-fold higher than the control, respectively (Figure 8). In the current study, the PR-5 gene had a low expression level at 1 to 9 dpi with a range of 0.25- to 0.96-fold in TMV-infected tomato plants (Figure 9). However, the highest expression level of PR-5 was observed at 13, 14 and 15 dpi, with values of 2.15-fold, 1.32-fold, and 1.15-fold, respectively. Compared to the TMV-infected tomato plants, the CMV-infected tomato plants showed PR-5 expression at 1 dpi, which was 2.11-fold higher than the control (Figure 9). Additionally, the PR-5 gene reached its highest level of expression after it increased by 4.34-fold at 4 dpi. After that, the gene expression decreased and fell from 0.67-fold to 0.47-fold at 5, 6, 7, 8, and 9 dpi. We suggest that in this study, the viral infection switched off the PR-5 gene expression in this time period, which then highly increased to 4.85 at 10 dpi (Figure 9). It was reported that the virus infection had a moderate effect on PR-5 expression [35]. The up-regulation of PR-5 induces resistance in tomatoes, resulting in delayed symptom appearance and tomato spotted wilt virus accumulation [70]. The overexpression of PR-5 in tobacco-vein-banding-mosaic-virus-infected tobacco plants and beet-severe-curly-top-virus-infected Arabidopsis has also been observed [71,72]. Similar results were reported by Wang et al. [73], who noticed that infection with the turnip crinkle virus resulted in an increase in PR-5 expression. In addition, the rice dwarf virus also leads to the activation of the PR-5 gene, suggesting that the PR-5 domain might bind a polypeptide ligand and raising the possibility that mature PR-5 proteins may also interact with polypeptides [74].
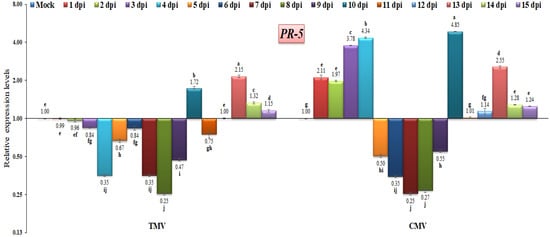
Figure 9.
Comparison between the relative transcriptional levels of the tomato PR-5 gene in TMV- and CMV-infected tissues compared to control at 1 to 15 dpi. The columns show the mean value from five biological replicates, and the bars represent the standard deviation (SD). Means were distinguished using Tukey’s HSD test at p ≤ 0.05 levels, and small letters are used to represent differences. Columns of data showing different letters are significant.
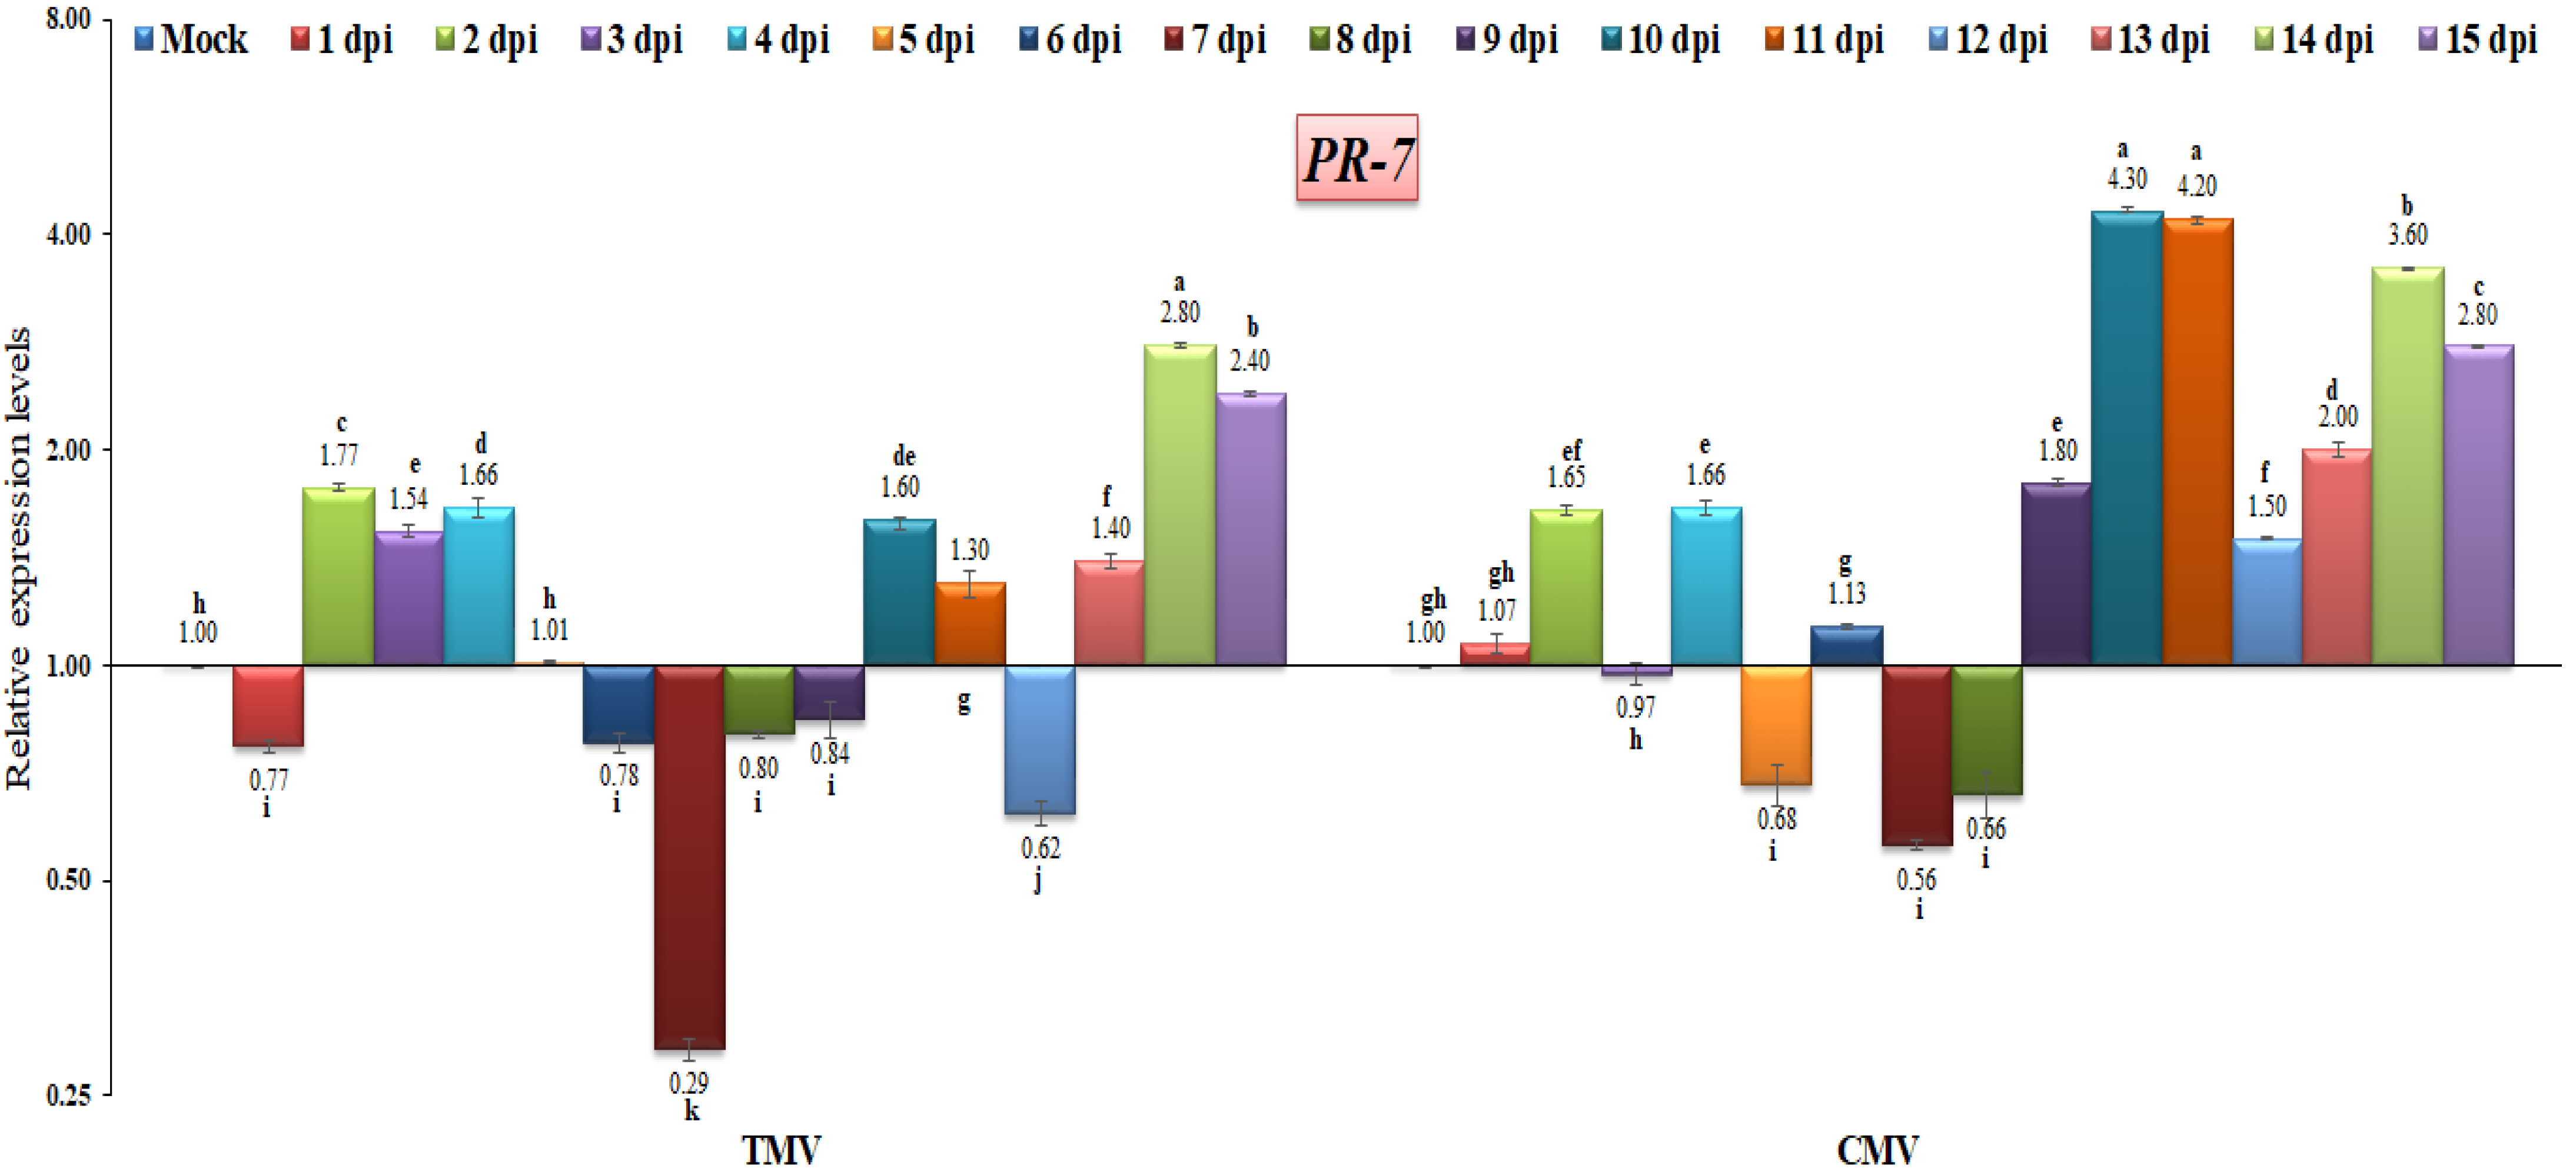
PR-7, which codes for plant proteases, is known to be an important part of defensive response proteins and to help break down the cell walls of microorganisms [39,75]. TMV was shown to shut down PR-7 gene expression at 1 dpi by 0.77-fold compared to the control (Figure 10). These two viruses (TMV and CMV) were up-regulated at 2 dpi and had almost the same expression levels at this point (1.77-fold and 1.65-fold, respectively). At 14 and 15 dpi, TMV-infected tomato plants showed that PR-7 was building up and expressing itself much more than before (Figure 10). However, in tomato plants infected with CMV, PR-7 was found to have rapid accumulation and significant maximum expression at 10, 11, and 14 dpi, with 4.3-fold, 4.2-fold, and 3.6-fold increases, respectively (Figure 10). On the other hand, in TMV or CMV-infected tomato plants, these two viruses shut down the PR-7 gene expression at 5, 6, 7, and 8 dpi, and at 9 dpi in TMV only (Figure 10). These results agree with the previous report that stated that the PR-7 expression level was increased by 11.1-fold at 9 days and reached higher levels of 34.7-fold at 15 days of TMV infection [16]. In another study, the up-regulation of tomato PR-7 expression in response to pathogen infections was detected [75]. The results of this study showed that the PR-5 and PR-7 genes had a similar transcriptional profile in terms of how much they were expressed. It is also possible that these genes are co-regulated in a cis-acting way [72], which shows that they work together.
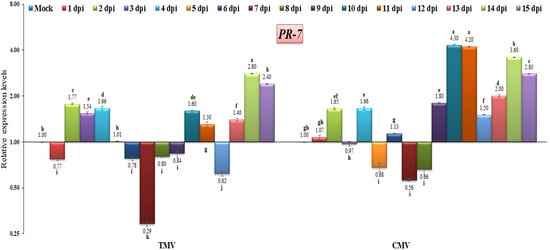
Figure 10.
Comparison between the relative transcriptional levels of the tomato PR-7 gene in TMV- and CMV-infected tissues compared to control at 1 to 15 dpi. The columns show the mean value from five biological replicates, and the bars represent the standard deviation (SD). Means were distinguished using Tukey’s HSD test at p ≤ 0.05 levels, and small letters are used to represent differences. Columns of data showing different letters are significant.
4. Conclusions
Globally, TMV and CMV have a significant impact on the tomato, a model species for the family Solanaceae. The comparative expression profiling of two destructive plant viruses infecting tomato plants, TMV and CMV, found a positive correlation between PR gene expression (PR-1, PR-2, PR-3, PR-4, PR-5, and PR-7) during the time course study (1 to 15 dpi). All the tested genes exhibited fluctuations in their expression levels at different time intervals, except PR-2, which showed up-regulation for both viruses at all intervals. Based on the expression profiles of other PR genes, we can divide the time course study into three time groups: The first is the virus replication stage or virus incubation period (1–6 dpi), in which almost all genes exhibited up-regulation, indicating a rapid response of the plant against viral infection. The second group, at the early stage of infection or virus activation (7–10 days), is when most of these genes were down-regulated or exhibited lower expression levels, which may be related to viral suppressor activity. The last group is the late stage of infection or the symptom appearance stage (11–15 days), in which the genes begin to increase again after the virus has succeeded in multiplying and systemically transferring between cells. Finally, the differences between the expression profiles of PR genes for both viruses indicated that the response of the defense system of the same plant might be changed or different from one pathogen to another or from one virus to another. Overall, our results give important information about the biology behind how the tomato, TMV, and CMV interact. Based on the transcriptional data, future research should be able to find the host genes that are needed for a virus to take hold. This could lead to ways to control these and other viruses.
Supplementary Materials
The following supporting information can be downloaded at: https://www.mdpi.com/article/10.3390/ijpb14020035/s1, Figure S1: The cycle threshold (Ct) for all samples with the three housekeeping genes (EF-1α, 18S rRNA, and β-actin).
Author Contributions
Conceptualization, A.A.; methodology, D.G.A., S.S., E.H., M.A.S., S.I.B. and A.A.; software, D.G.A. and A.A.; validation, D.G.A., S.S., E.H., M.A.S., S.I.B. and A.A.; investigation, S.S., E.H., M.A.S., and A.A.; writing—original draft preparation, D.G.A. and A.A.; writing—review and editing, D.G.A., S.S., E.H., M.A.S., S.I.B. and A.A.; project administration, A.A.; funding acquisition, A.A. All authors have read and agreed to the published version of the manuscript.
Funding
This research received no external funding.
Institutional Review Board Statement
Not applicable.
Informed Consent Statement
Not applicable.
Data Availability Statement
Data are available upon request.
Acknowledgments
This paper is based upon work supported by the Science, Technology & Innovation Funding Authority (STDF) under grant (30102).
Conflicts of Interest
The authors declare no conflict of interest.
References
- Nicaise, V. Crop immunity against viruses: Outcomes and future challenges. Front. Plant Sci. 2014, 5, 660. [Google Scholar] [CrossRef] [PubMed]
- Hančinský, R.; Mihálik, D.; Mrkvová, M.; Candresse, T.; Glasa, M. Plant Viruses Infecting Solanaceae Family Members in the Cultivated and Wild Environments: A Review. Plants 2020, 9, 667. [Google Scholar] [CrossRef] [PubMed]
- Mumford, R.A.; Macarthur, R.; Boonham, N. The role and challenges of new diagnostic technology in plant biosecurity. Food Secur. 2016, 8, 103–109. [Google Scholar] [CrossRef]
- Ge, Y.; Liu, K.; Zhang, J.; Mu, S.; Hao, X. The limonoids and their antitobacco mosaic virus (TMV) activities from Munronia unifoliolata Oliv. J. Agric. Food Chem. 2012, 60, 4289–4295. [Google Scholar] [CrossRef]
- Abdelkhalek, A.; Sanan-Mishra, N. A comparative analysis of the suppressor activity of Tobacco mosaic virus proteins in the tomato plant. Jordan J. Biol. Sci. 2018, 11, 469–473. [Google Scholar]
- Scholthof, K.G.; Adkins, S.; Czosnek, H.; Palukaitis, P.; Jacquot, E.; Hohn, T.; Hohn, B.; Saunders, K.; Candresse, T.; Ahlquist, P. Top 10 plant viruses in molecular plant pathology. Mol. Plant Pathol. 2011, 12, 938–954. [Google Scholar] [CrossRef]
- Mochizuki, T.; Ohki, S.T. Cucumber mosaic virus: Viral genes as virulence determinants. Mol. Plant Pathol. 2012, 13, 217–225. [Google Scholar] [CrossRef]
- Palukaitis, P.; Roossinck, M.J.; Dietzgen, R.G.; Francki, R.I.B. Cucumber mosaic virus. Adv. Virus Res. 1992, 41, 281–348. [Google Scholar]
- Van Loon, L.C.; Rep, M.; Pieterse, C.M.J. Significance of inducible defense-related proteins in infected plants. Annu. Rev. Phytopathol. 2006, 44, 135–162. [Google Scholar] [CrossRef]
- Whitham, S.A.; Yang, C.; Goodin, M.M. Global impact: Elucidating plant responses to viral infection. Mol. Plant-Microbe Interact. 2006, 19, 1207–1215. [Google Scholar] [CrossRef]
- Linthorst, H.J.M.; Van Loon, L.C. Pathogenesis-related proteins of plants. CRC. Crit. Rev. Plant Sci. 1991, 10, 123–150. [Google Scholar] [CrossRef]
- Sehgal, O.P.; Mohamed, F. Pathogenesis-related proteins. In Plant Viruses; CRC Press: Boca Raton, FL, USA, 2018; pp. 65–83. ISBN 1351075780. [Google Scholar]
- Deepak, S.A.; Kottapalli, K.R.; Rakwal, R.; Oros, G.; Rangappa, K.S.; Iwahashi, H.; Masuo, Y.; Agrawal, G.K. Real-time PCR: Revolutionizing detection and expression analysis of genes. Curr. Genom. 2007, 8, 234–251. [Google Scholar] [CrossRef] [PubMed]
- Remans, T.; Keunen, E.; Bex, G.J.; Smeets, K.; Vangronsveld, J.; Cuypers, A. Reliable gene expression analysis by reverse transcription-quantitative PCR: Reporting and minimizing the uncertainty in data accuracy. Plant Cell 2014, 26, 3829–3837. [Google Scholar] [CrossRef] [PubMed]
- Xu, Z.; Dai, J.; Su, W.; Wu, H.; Shah, K.; Xing, L.; Ma, J.; Zhang, D.; Zhao, C. Selection and validation of reliable reference genes for gene expression studies in different genotypes and TRV-infected fruits of peach (Prunus persica L. Batsch) during Ripening. Genes 2022, 13, 160. [Google Scholar] [CrossRef]
- Abdelkhalek, A. Expression of tomato pathogenesis related genes in response to Tobacco mosaic virus. JAPS J. Anim. Plant Sci. 2019, 29, 1596–1602. [Google Scholar]
- Abdelkhalek, A.; Behiry, S.I.; Al-Askar, A.A. Bacillus velezensis PEA1 Inhibits Fusarium oxysporum Growth and Induces Systemic Resistance to Cucumber Mosaic Virus. Agronomy 2020, 10, 1312. [Google Scholar] [CrossRef]
- Kumar, S.; Udaya Shankar, A.C.; Nayaka, S.C.; Lund, O.S.; Prakash, H.S. Detection of Tobacco mosaic virus and Tomato mosaic virus in pepper and tomato by multiplex RT–PCR. Lett. Appl. Microbiol. 2011, 53, 359–363. [Google Scholar] [CrossRef]
- Khalil, A.M.; Behiry, S.I.; Abdelkhalek, A.; Younes, H.A. Isolation and purification of Alfalfa mosaic virus-infecting potato (Solanum tuberosum L.) in Beheira governorate. Middle East J. 2020, 9, 617–623. [Google Scholar]
- Kavroulakis, N.; Ehaliotis, C.; Ntougias, S.; Zervakis, G.I.; Papadopoulou, K.K. Local and systemic resistance against fungal pathogens of tomato plants elicited by a compost derived from agricultural residues. Physiol. Mol. Plant Pathol. 2005, 66, 163–174. [Google Scholar] [CrossRef]
- Arasimowicz-Jelonek, M.; Floryszak-Wieczorek, J.; Izbiańska, K.; Gzyl, J.; Jelonek, T. Implication of peroxynitrite in defence responses of potato to Phytophthora infestans. Plant Pathol. 2016, 65, 754–766. [Google Scholar] [CrossRef]
- Aseel, D.G.; Madian, R.A.; Aggag, S.A.; Elseehy, M.A. Evaluation of some defensin genes against tomv in different tomato cultivars using pathogenesis related protein genes. J. Microbiol. Biotechnol. Food Sci. 2021, 2021, 29–33. [Google Scholar]
- Wang, X.; El Hadrami, A.; Adam, L.R.; Daayf, F. Differential activation and suppression of potato defence responses by Phytophthora infestans isolates representing US-1 and US-8 genotypes. Plant Pathol. 2008, 57, 1026–1037. [Google Scholar] [CrossRef]
- Dixit, R.; Agrawal, L.; Gupta, S.; Kumar, M.; Yadav, S.; Chauhan, P.S.; Nautiyal, C.S. Southern blight disease of tomato control by 1-aminocyclopropane-1-carboxylate (ACC) deaminase producing Paenibacillus lentimorbus B-30488. Plant Signal. Behav. 2016, 11, e1113363. [Google Scholar] [CrossRef] [PubMed]
- Mascia, T.; Santovito, E.; Gallitelli, D.; Cillo, F. Evaluation of reference genes for quantitative reverse-transcription polymerase chain reaction normalization in infected tomato plants. Mol. Plant Pathol. 2010, 11, 805–816. [Google Scholar] [CrossRef]
- Livak, K.J.; Schmittgen, T.D. Analysis of relative gene expression data using real-time quantitative PCR and the 2-ΔΔCT method. Methods 2001, 25, 402–408. [Google Scholar] [CrossRef]
- Abdelkhalek, A.; Al-Askar, A.A.; Alsubaie, M.M.; Behiry, S.I. First Report of Protective Activity of Paronychia argentea Extract against Tobacco mosaic virus Infection. Plants 2021, 10, 2435. [Google Scholar] [CrossRef]
- Deloko, D.C.T.; Chofong, N.G.; Ali, I.M.; Kachiwouo, I.G.; Songolo, F.O.; Manock, A.R.N.; Kamgaing, M.; Fonkou, T.; Njukeng, A.P. Detection of Cucumber mosaic virus on Solanum lycopersicum L. and Capsicum annuum L. in the Western region of Cameroon. J. Agric. Food Res. 2022, 8, 100294. [Google Scholar]
- Pfitzner, A.J.P. Resistance to Tobacco mosaic virus and Tomato mosaic virus in tomato. In Natural Resistance Mechanisms of Plants to Viruses; Springer: Berlin/Heidelberg, Germany, 2006; pp. 399–413. [Google Scholar]
- Abdelkhalek, A.; Sanan-Mishra, N. Differential expression profiles of tomato miRNAs induced by Tobacco mosaic virus. J. Agric. Sci. Technol. 2019, 21, 475–485. [Google Scholar]
- El-Helaly, H.S.; Ahmed, A.A.; Awad, M.A.; Soliman, A.M. Biological and molecular characterization of potato infecting Alfalfa mosaic virus in Egypt. Int. J. Virol. 2012, 8, 106–113. [Google Scholar] [CrossRef][Green Version]
- Al-Saleh, M.A.; Amer, M.A. Biological and molecular variability of Alfalfa mosaic virus affecting alfalfa crop in Riyadh region. Plant Pathol. J. 2013, 29, 410–417. [Google Scholar] [CrossRef]
- Wood, A.J.; Joel Duff, R.; Oliver, M.J. The translational apparatus of Tortula ruralis: Polysomal retention of transcripts encoding the ribosomal proteins RPS14, RPS16 and RPL23 in desiccated and rehydrated gametophytes. J. Exp. Bot. 2000, 51, 1655–1662. [Google Scholar] [CrossRef] [PubMed]
- Jarošová, J.; Kundu, J.K. Validation of reference genes as internal control for studying viral infections in cereals by quantitative real-time RT-PCR. BMC Plant Biol. 2010, 10, 146. [Google Scholar] [CrossRef]
- ElMorsi, A.; Abdelkhalek, A.; Alshehaby, O.; Hafez, E. Pathogenesis-related genes as tools for discovering the response of onion defence system against Iris yellow spot virus infection. Botany 2015, 93, 735–744. [Google Scholar] [CrossRef]
- Mafra, V.; Kubo, K.S.; Alves-Ferreira, M.; Ribeiro-Alves, M.; Stuart, R.M.; Boava, L.P.; Rodrigues, C.M.; Machado, M.A. Reference genes for accurate transcript normalization in citrus genotypes under different experimental conditions. PLoS ONE 2012, 7, e31263. [Google Scholar] [CrossRef] [PubMed]
- Maltseva, D.V.; Khaustova, N.A.; Fedotov, N.N.; Matveeva, E.O.; Lebedev, A.E.; Shkurnikov, M.U.; Galatenko, V.V.; Schumacher, U.; Tonevitsky, A.G. High-throughput identification of reference genes for research and clinical RT-qPCR analysis of breast cancer samples. J. Clin. Bioinform. 2013, 3, 13. [Google Scholar] [CrossRef]
- Bokhale, M.; Mwaba, I.; Allie, F. Real-time PCR data for reference candidate gene selection in tomato infected with Tomato curly stunt virus. Data Brief 2020, 31, 105750. [Google Scholar] [CrossRef]
- Van Loon, L.C.; Van Strien, E.A. The families of pathogenesis-related proteins, their activities, and comparative analysis of PR-1 type proteins. Physiol. Mol. Plant Pathol. 1999, 55, 85–97. [Google Scholar] [CrossRef]
- Cutt, J.R.; Harpster, M.H.; Dixon, D.C.; Carr, J.P.; Dunsmuir, P.; Klessig, D.F. Disease response to Tobacco mosaic virus in transgenic tobacco plants that constitutively express the pathogenesis-related PR1b gene. Virology 1989, 173, 89–97. [Google Scholar] [CrossRef]
- Vuorinen, A.L.; Gammelgård, E.; Auvinen, P.; Somervuo, P.; Dere, S.; Valkonen, J.P.T. Factors underpinning the responsiveness and higher levels of virus resistance realised in potato genotypes carrying virus-specific R genes. Ann. Appl. Biol. 2010, 157, 229–241. [Google Scholar] [CrossRef]
- Niderman, T.; Genetet, I.; Bruyere, T.; Gees, R.; Stintzi, A.; Legrand, M.; Fritig, B.; Mosinger, E. Pathogenesis-related PR-1 proteins are antifungal (isolation and characterization of three 14-kilodalton proteins of tomato and of a basic PR-1 of tobacco with inhibitory activity against Phytophthora infestans). Plant Physiol. 1995, 108, 17–27. [Google Scholar] [CrossRef]
- Luo, X.; Tian, T.; Feng, L.; Yang, X.; Li, L.; Tan, X.; Wu, W.; Li, Z.; Treves, H.; Serneels, F. Pathogenesis-related protein 1 suppresses oomycete pathogen by targeting against AMPK kinase complex. J. Adv. Res. 2023, 43, 13–26. [Google Scholar] [CrossRef] [PubMed]
- Klessig, D.F.; Tian, M.; Choi, H.W. Multiple targets of salicylic acid and its derivatives in plants and animals. Front. Immunol. 2016, 7, 206. [Google Scholar] [CrossRef] [PubMed]
- Breen, S.; Williams, S.J.; Outram, M.; Kobe, B.; Solomon, P.S. Emerging Insights into the Functions of Pathogenesis-Related Protein 1. Trends Plant Sci. 2017, 22, 871–879. [Google Scholar] [CrossRef] [PubMed]
- Otulak, K.; Garbaczewska, G. Cellular localisation of calcium ions during potato hypersensitive response to Potato virus Y. Micron 2011, 42, 381–391. [Google Scholar] [CrossRef] [PubMed]
- Iglesias, V.A.; Meins, F.; Meins, F., Jr. Movement of plant viruses is delayed in a β-1, 3-glucanase-deficient mutant showing a reduced plasmodesmatal size exclusion limit and enhanced callose deposition. Plant J. 2000, 21, 157–166. [Google Scholar] [CrossRef]
- Oide, S.; Bejai, S.; Staal, J.; Guan, N.; Kaliff, M.; Dixelius, C. A novel role of PR 2 in abscisic acid (ABA) mediated, pathogen-induced callose deposition in Arabidopsis thaliana. New Phytol. 2013, 200, 1187–1199. [Google Scholar] [CrossRef]
- Šindelářová, M.; Šindelář, L. Isolation of pathogenesis-related proteins from TMV-infected tobacco and their influence on infectivity of TMV. Plant Prot. Sci 2005, 41, 52–57. [Google Scholar] [CrossRef]
- Otulak-Kozieł, K.; Kozieł, E.; Lockhart, B. Plant cell wall dynamics in compatible and incompatible potato response to infection caused by Potato virus Y (PVYNTN). Int. J. Mol. Sci. 2018, 19, 862. [Google Scholar] [CrossRef]
- Bucher, G.L.; Tarina, C.; Heinlein, M.; Di Serio, F.; Meins, F., Jr.; Iglesias, V.A. Local expression of enzymatically active class I β-1, 3-glucanase enhances symptoms of TMV infection in tobacco. Plant J. 2001, 28, 361–369. [Google Scholar] [CrossRef]
- Dobnik, D.; Baebler, Š.; Kogovšek, P.; Pompe-Novak, M.; Štebih, D.; Panter, G.; Janež, N.; Morisset, D.; Žel, J.; Gruden, K. β-1, 3-glucanase class III promotes spread of PVY NTN and improves in planta protein production. Plant Biotechnol. Rep. 2013, 7, 547–555. [Google Scholar] [CrossRef]
- Kørner, C.J.; Klauser, D.; Niehl, A.; Domínguez-Ferreras, A.; Chinchilla, D.; Boller, T.; Heinlein, M.; Hann, D.R. The immunity regulator BAK1 contributes to resistance against diverse RNA viruses. Mol. Plant-Microbe Interact. 2013, 26, 1271–1280. [Google Scholar] [CrossRef] [PubMed]
- Jannoey, P.; Channei, D.; Kotcharerk, J.; Pongprasert, W.; Nomura, M. Expression Analysis of Genes Related to Rice Resistance Against Brown Planthopper, Nilaparvata lugens. Rice Sci. 2017, 24, 163–172. [Google Scholar] [CrossRef]
- Abo-Zaid, G.A.; Matar, S.M.; Abdelkhalek, A. Induction of Plant Resistance against Tobacco MOSAIC Virus Using the Biocontrol Agent Streptomyces cellulosae Isolate Actino 48. Agronomy 2020, 10, 1620. [Google Scholar] [CrossRef]
- Abdelkhalek, A.; Al-Askar, A.A.; Hafez, E. Differential induction and suppression of the potato innate immune system in response to Alfalfa mosaic virus infection. Physiol. Mol. Plant Pathol. 2020, 110, 101485. [Google Scholar] [CrossRef]
- Busam, G.; Kassemeyer, H.-H.; Matern, U. Differential expression of chitinases in Vitis vinifera L. responding to systemic acquired resistance activators or fungal challenge. Plant Physiol. 1997, 115, 1029–1038. [Google Scholar] [CrossRef] [PubMed]
- Sinha, M.; Singh, R.P.; Kushwaha, G.S.; Iqbal, N.; Singh, A.; Kaushik, S.; Kaur, P.; Sharma, S.; Singh, T.P. Current overview of allergens of plant pathogenesis related protein families. Sci. World J. 2014, 2014, 543195. [Google Scholar] [CrossRef]
- Abulikemu, S.; Yesilyurt, A.; Gencer, D.; Usta, M.; Nalcacioglu, R. Comparison of the potential activities of viral and bacterial chitinases. Egypt. J. Biol. Pest Control 2021, 31, 91. [Google Scholar] [CrossRef]
- Abo-Zaid, G.; Abdelkhalek, A.; Matar, S.; Darwish, M.; Abdel-Gayed, M. Application of Bio-Friendly Formulations of Chitinase-Producing Streptomyces cellulosae Actino 48 for Controlling Peanut Soil-Borne Diseases Caused by Sclerotium rolfsii. J. Fungi 2021, 7, 167. [Google Scholar] [CrossRef]
- Zhang, Y. Studies of Pathogenesis-Related Proteins in the Strawberry Plant: Partial Purification of a Chitinase-Containing Protein Complex and Analysis of an Osmotin-like Protein Gene; Louisiana State University and Agricultural & Mechanical College: Baton Rouge, LA, USA, 2006; ISBN 9798802747094. [Google Scholar]
- Mandadi, K.K.; Pyle, J.D.; Scholthof, K.-B.G. Comparative analysis of antiviral responses in Brachypodium distachyon and Setaria viridis reveals conserved and unique outcomes among C3 and C4 plant defenses. Mol. Plant-Microbe Interact. 2014, 27, 1277–1290. [Google Scholar] [CrossRef]
- Broekaert, I.; Lee, H.; Kush, A.; Chua, N.-H.; Raikhel, N. Wound-induced accumulation of mRNA containing a hevein sequence in laticifers of rubber tree (Hevea brasiliensis). Proc. Natl. Acad. Sci. USA 1990, 87, 7633–7637. [Google Scholar] [CrossRef]
- Neuhaus, J.-M.; Fritig, B.; Linthorst, H.J.M.; Meins, F.; Mikkelsen, J.D.; Ryals, J. A revised nomenclature for chitinase genes. Plant Mol. Biol. Rep. 1996, 14, 102–104. [Google Scholar] [CrossRef]
- Franco, F.P.; Dias, R.O.; Toyama, D.; Henrique-Silva, F.; Moura, D.S.; Silva-Filho, M.C. Structural and functional characterization of PR-4 SUGARWINs from sugarcaneand their role in plant defense. Front. Plant Sci. 2019, 9, 1916. [Google Scholar] [CrossRef]
- Guevara-Morato, M.A.; García de Lacoba, M.; García-Luque, I.; Serra, M.T. Characterization of a pathogenesis-related protein 4 (PR-4) induced in Capsicum chinense L3 plants with dual RNase and DNase activities. J. Exp. Bot. 2010, 61, 3259–3271. [Google Scholar] [CrossRef] [PubMed]
- Wang, R.; Wang, S.; Pan, W.; Li, Q.; Xia, Z.; Guan, E.; Zheng, M.; Pang, G.; Yang, Y.; Yi, Z. Strategy of tobacco plant against black shank and Tobacco mosaic virus infection via induction of PR-1, PR-4 and PR-5 proteins assisted by medicinal plant extracts. Physiol. Mol. Plant Pathol. 2018, 101, 127–145. [Google Scholar] [CrossRef]
- Dai, L.; Wang, D.; Xie, X.; Zhang, C.; Wang, X.; Xu, Y.; Wang, Y.; Zhang, J. The novel gene VpPR4-1 from Vitis pseudoreticulata increases powdery mildew resistance in transgenic Vitis vinifera L. Front. Plant Sci. 2016, 7, 695. [Google Scholar] [CrossRef] [PubMed]
- Li, X.-Y.; Gao, L.; Zhang, W.-H.; Liu, J.-K.; Zhang, Y.-J.; Wang, H.-Y.; Liu, D.-Q. Characteristic expression of wheat PR5 gene in response to infection by the leaf rust pathogen, Puccinia triticina. J. Plant Interact. 2015, 10, 132–141. [Google Scholar] [CrossRef]
- Padmanabhan, C.; Ma, Q.; Shekasteband, R.; Stewart, K.S.; Hutton, S.F.; Scott, J.W.; Fei, Z.; Ling, K.-S. Comprehensive transcriptome analysis and functional characterization of PR-5 for its involvement in tomato Sw-7 resistance to tomato spotted wilt tospovirus. Sci. Rep. 2019, 9, 7673. [Google Scholar] [CrossRef]
- Yang, L.; Xu, Y.; Liu, Y.; Meng, D.; Jin, T.; Zhou, X. HC-Pro viral suppressor from tobacco vein banding mosaic virus interferes with DNA methylation and activates the salicylic acid pathway. Virology 2016, 497, 244–250. [Google Scholar] [CrossRef]
- Chen, H.; Zhang, Z.; Teng, K.; Lai, J.; Zhang, Y.; Huang, Y.; Li, Y.; Liang, L.; Wang, Y.; Chu, C. Up-regulation of LSB1/GDU3 affects geminivirus infection by activating the salicylic acid pathway. Plant J. 2010, 62, 12–23. [Google Scholar] [CrossRef]
- Wang, X.; Zafian, P.; Choudhary, M.; Lawton, M. The PR5K receptor protein kinase from Arabidopsis thaliana is structurally related to a family of plant defense proteins. Proc. Natl. Acad. Sci. USA 1996, 93, 2598–2602. [Google Scholar] [CrossRef]
- Satoh, K.; Shimizu, T.; Kondoh, H.; Hiraguri, A.; Sasaya, T.; Choi, I.-R.; Omura, T.; Kikuchi, S. Relationship between symptoms and gene expression induced by the infection of three strains of Rice dwarf virus. PLoS ONE 2011, 6, e18094. [Google Scholar] [CrossRef] [PubMed]
- Roylawar, P.; Panda, S.; Kamble, A. Comparative analysis of BABA and Piriformospora indica mediated priming of defence-related genes in tomato against early blight. Physiol. Mol. Plant Pathol. 2015, 91, 88–95. [Google Scholar] [CrossRef]
Disclaimer/Publisher’s Note: The statements, opinions and data contained in all publications are solely those of the individual author(s) and contributor(s) and not of MDPI and/or the editor(s). MDPI and/or the editor(s) disclaim responsibility for any injury to people or property resulting from any ideas, methods, instructions or products referred to in the content. |
© 2023 by the authors. Licensee MDPI, Basel, Switzerland. This article is an open access article distributed under the terms and conditions of the Creative Commons Attribution (CC BY) license (https://creativecommons.org/licenses/by/4.0/).

