Article

Influence of Fruit Load and Water Deficit on Olive Fruit Phenolic Profiling and Yield

1
Department for Sustainable Food Process, Università Cattolica del Sacro Cuore, 29122 Piacenza, Italy
2
Department of Sustainable Crop Production, Università Cattolica del Sacro Cuore, 29122 Piacenza, Italy
*
Author to whom correspondence should be addressed.
Int. J. Plant Biol. 2024, 15(3), 895-913; https://doi.org/10.3390/ijpb15030064
Submission received: 10 July 2024 / Revised: 30 August 2024 / Accepted: 9 September 2024 / Published: 11 September 2024
(This article belongs to the Section Plant Biochemistry and Genetics)

Abstract

:
High-density olive groves, despite their interesting production potential, have several limitations, including their high fruit load and irrigation requirements. This study aimed to evaluate the effects of fruit load and deficit irrigation on oil yield, fruit quality, and olive chemical composition in a high-density olive grove (cv Sikitita). Our main hypothesis was that primary metabolism, as influenced by crop load and stress, could modify the accumulation of different phenolic classes. Different fruit loads were generated through flower thinning (66%, 50%, 33%, 0%), and two deficit irrigation treatments (−60%, −75%) were compared to the well-watered control (920 m3/ha). Thinning treatments had a limited effect on oil yield; on the other hand, deficit irrigation caused considerably less oil accumulation in the fruit on all sampling dates. Thinning 66% and deficit irrigation 75% were considered with the control for untargeted metabolomic analysis, including three sampling dates. A total of 233 distinct phenolic compounds were annotated. Multivariate HCA results indicated that harvest time had an impact on the phenolic profile of olive fruits, obtaining two separated clusters that grouped t1 and t2 together and apart from t3, which clustered independently. Regarding agronomic techniques, they played a differential role in the phenolic profile (supervised OPLS-DA). Fruit load mostly affected flavonoid glycosides. In contrast, the phenolic response to deficit irrigation was more heterogeneous, with phenolic acids (35%), flavonoids (25%), LMW, and other phenols (25%).

1. Introduction

Extra virgin olive oil (EVOO) worldwide consumption is increasing because of its now well-known health properties and high nutritional value, largely attributed to oleic acid and polyphenols [1]. However, the world olive oil production decreased by −22% (2414 thousand tons) in 2023–2024 compared with the average of the last 5 years (3109 thousand tons), specifically −29% for European production, of which the leading producers are Spain and Italy [2].
Italy is one of the most important players in the olive oil sector [3,4,5,6], but, in this country, consumption is greater than its production, and, consequently, some quantities of olive oil must be imported [7]. The Italian olive oil sector faces structural [5,8], olive grove management, and climate change [9] issues that limit its sustainable economic development, leading to the loss of competitiveness and market share of its main competitors. Indeed, Italian olive growers have production costs 1.30 times higher than the international weighted average cost of obtaining one kilogram of olive oil [10]. On the other hand, Italy has the richest olive biodiversity in the world [8] with about 600 varieties [11], and this allows for a unique number of cultivar–territory combinations and, consequently, numerous products, including many premium products. In Italy, oil quality is probably the only viable strategy for competition in the market [12]. However, it is necessary to optimize production costs too. From this perspective, the adoption of super-high-density olive orchards is becoming increasingly widespread. These are characterized by a density of more than 1200 trees per hectare [13], which results in increased productivity and the ability to produce oil at competitive prices to cope with the increasing global demand. Nevertheless, super-high-density olive groves are not without limitations [14], such as low oil yields in olive and high fruit water content, which could lead to the formation of emulsions during the oil extraction process, resulting in decreased oil extractability [15]. Moreover, oil yield, intended as the oil accumulation in the fruit, is affected by several factors, including environmental conditions [16], crop load [17,18], crop management, and irrigation [19,20].
The quantity of fruits on the tree is a crucial factor that significantly influences oil yield and primary metabolism. Several studies have established that elevated crop loads frequently result in reduced fruit size, decreased mesocarp–endocarp tissue ratios, and lower oil content per individual fruit [21]. Other studies have assessed the impact of fruit load on plant ecophysiological mechanisms, indicating that in the absence of fruit, there is an accumulation of carbohydrates in the leaves [22]. However, to the best of our knowledge, few studies have investigated the effects of fruit load on fruit quality traits and chemical composition, particularly the accumulation of phenolic compounds in the olive.
In terms of quality, phenolic compounds are abundant secondary metabolites of olives, renowned for their functional role and ability to scavenge free radicals [23] as well as their role in plant response to stress conditions [24]. This latter response is complex and encompasses a network of metabolic pathways leading to various metabolite adjustments [25]. The EFSA Panel on Dietetic Products, Nutrition and Allergies (NDA) 2011 [26] found that olive polyphenols (olive fruit, olive mill waste waters, or olive oil, Olea europaea L. extract and leaf) standardized to hydroxytyrosol content and its derivatives (5 mg in 20 g of olive oil) have a beneficial effect on human health (e.g., contribute to the protection of blood lipids from oxidative stress). However, the results by Jerman Klen and Mozetič Vodopivec, 2012 [27], indicated that the qualitative profile of olive phenols is significantly different from that of oil, suggesting that phenols are not only transferred but also transformed during oil processing. Indeed, the main fruit secoiridoids, such as oleuropein, demethyloleuropein, and ligstroside, and many fruits’ hydroxytyrosol glucoside were degraded during crushing/malaxation operation, forming several secoiridoid aglycone derivatives and hydroxytyrosol. However, more phenols in the fruit would automatically lead to more phenols in the oil [28].
The interaction between the genetic background (the cultivar) and environmental conditions can provide distinct phytochemical profiles in the fruits. In a study by Ortega-García and Peragón, 2009 [29], the Frantoio cultivar was found to be the variety with the highest phenolic content, compared with Picual, Verdial, and Arbequina cvs. Nevertheless, agronomic practices, water availability, and irrigation management have strongly affected olives’ phenolic composition [30]. Indeed, water deficit further limits carbon assimilation, and primary metabolism is widely recognized to impact water productivity of drupe metabolism, consequently affecting key chemical traits of the fruit [31]. Water deficit can alter the levels of compounds associated with oxidative imbalance, such as the polyphenols oleuropein, verbascoside, luteolin 7-O-glucoside, and apigenin 7-O-glucoside [25].
In the literature, the quality of oil in response to different irrigation strategies has been widely investigated [19,20,32,33,34,35], including olive chemical composition [25,30,31,35,36,37,38]. Nevertheless, there is a gap in knowledge regarding the accumulation of different phenolic classes within the fruits in response to events that may alter their primary metabolism, such as fruit load and deficit irrigation. Accordingly, the present study employed these two agronomic techniques with the purpose of evaluating the promotion of key secondary metabolites.
Our main hypothesis was that the effect of fruit load and water deficit on primary metabolism may influence phenol accumulation. Consequently, several biosynthetic pathways in olives, particularly that of shikimate, phenylpropanoids, and mevalonate, may be more affected.
Therefore, this work aimed to study the influence of fruit load and deficit irrigation on the main sinks of the olive tree, vegetative growth, and yield, as well as on the phenolic profile of olive over-ripening. Specifically, this was achieved by (a) evaluating the effects on olive growth dynamics, ripening, and oil accumulation; (b) investigating, through an untargeted metabolomics approach, the impact of fruit load and deficit irrigation on the olive phenolic profile, by quantitative means, of the most common polyphenol subfamilies found in this matrix; and (c) identifying, by multivariate statistics, the biomarkers mostly involved in response to both agronomical practices. On these bases, the valorization of olive quality in terms of bioactive profile was tackled, by providing useful information about the phenotypical impact of two intensive agronomical techniques involved in olive production.

2. Materials and Methods

2.1. Experimental Orchard and Experimental Design

This study was conducted in 2021 in a high-density 4-year-old olive grove of the Sikitita cultivar (University of Córdoba and the Institute of Agricultural and Fishery Research and Training (IFAPA)) with trees planted at 1.5 m on the row and 4 m between rows. The olive grove was located near Florence (43.762700, 11.416151, Central Italy), at an elevation of 180 m above sea level. The orchard was on a slope area (10% on average) with a soil depth of about 1.2 m. The soil was loamy, and the pH was 8.1. Organic matter was 0.9%. The climate was characterized by a warm and temperate climate. The farm weather shed recorded an average temperature of 18.2 °C and rainfall of 377.9 mm from 1 March 2021 to 1 November 2021. Referring to the irrigation period, which began on 1 May and ended on 31 September, 244 mm of rainfall was recorded.
Different fruit load levels were set by applying different levels of flower thinning (66%—1 out of 3, 50%—1 out of 2, and 33%—2 out of 3 inflorescences removed by hand at BBCH 55 from the whole tree canopy) in order to reduce, as much as possible, the effect of flower and fruit set formation on the primary metabolism of the tree.
Forty trees, distributed on two adjacent rows, were selected to carry out thinning, where ten trees were randomly assigned to the following flower thinning treatments: 66%, 50%, 33%, and 0% (unthinned, control). Twenty more trees, on the same rows, were selected for irrigation reduction. Ten control trees, the same ones selected for the thinning treatment, were irrigated according to the farm standard irrigation (920 m3/ha). Ten trees per treatment were randomly assigned to the two deficit irrigation treatments as follows: 60% reduction (383 m3/ha) with a 2 L/h dripper per plant and 75% reduction (230 m3/ha) with a 1.2 L/h dripper per plant. Irrigation was calculated to restore 100% of the required water demand, obtained by the equations previously described by Sastre et al., 2022 [35]. Therefore, the FAO method [39] was used to estimate crop evapotranspiration under standard conditions (ETc). Reference crop evapotranspiration (ET0) was determined with the Penman–Monteith method and was 589 mm between 1 May and 31 August. The crop coefficient (Kc) of 0.70 was selected from the FAO manual [39] as typical and recommended for olive trees. Considering that the alley was covered by active ground cover, the Kc value was added by 0.25, as usually recommended by FAO for other tree crops such as apple, pear, and cherry. The coefficient (Kr) that links the degree of orchard vegetation cover to evapotranspiration was found to be 0.50, with olive trees covering 25% of the orchard area.

2.2. Field Measurements and Fruit Harvest

Each month, from full bloom (21 May 2021) to the initial phase of ripening (7 October 2021), vegetative growth was monitored as follows: the shoot length (cm), the shoot nodes (number/shoot), the number of inflorescences (number/shoot), the fruits set (number/shoot), and the number of fruits (number/shoot) were measured on a representative two-year-old shoot per tree. In addition, the current-year shoot length (cm) and its number of nodes (number/apical shoot) were also recorded. In full bloom, before applying the different treatments, the trees showed similar vegetative and productive situations (Table S1). Every month, from fruit set (23 June 2021) to harvest time (15 November 2021), eight samplings were collected, and ten fruits were randomly sampled from five plants per treatment. Fresh weight, dry weight, pulp–stone ratio, maturation index, and oil accumulation (g) were monitored on thirty fruits per treatment. Part of the collected samples (twenty fruits) were frozen for metabolomics analysis. For deficit irrigation treatments, stem water potential (Ψstem) was measured over the same days, from late June to early October, using a pressure chamber (Soilmoisture Corp, Santa Barbara, CA, USA). Ψstem was measured on each olive tree on one mature leaf, which was wrapped in aluminum foil two hours before measurements [40]. The olives were harvested in two stages as follows: at an intermediate ripening stage (25 October 2021) and at a more advanced ripening stage (15 November 2021).

2.3. Maturation Index and Fruit Yield

The maturation index was determined according to the procedure proposed by the International Olive Council by evaluating the color of the skin and the pulp of the olives [41]. Oil extraction from the olive samples was performed using the Milestone ETHOS X microwave (Milestone srl, Bergamo, Italy). For each olive sample, the pulp was separated from the stone before drying in an oven at 50 degrees for at least 12 h and crushing. Then, 1 g of each sample was placed in a vessel with 25 mL of Petroleum ether. The combined hydrolysis and extraction process took place at 125 °C and required approximately 50 min. The temperature was monitored and controlled in each vessel using a unique combination of fiber optic and infrared temperature sensors. The ETHOS X built-in magnetic stirrer assured even heating and temperature uniformity in all vessels, as well as intensive mixing between the aqueous and solvent phases. The heating phase was followed by a 15–20 min cooling phase. The cooled samples were dropped into 50 mL Falcon tubes and centrifuged for 6 min at 5000× g. The supernatant was then transferred into weighed disposable cups. The measured aliquot of the solvent with the extracted oil inside was evaporated under a fume hood. Finally, the individual cups with the extracted oil inside were weighed, and the oil yield was expressed on the fresh weight of the whole drupe.

2.4. Sample Preparation and Extraction for Metabolomic Analysis

For the metabolomics investigation, olive samples from the control, 66% thinning, and 75% irrigation reduction treatments, collected in early September (2 September 2021), late September (23 September 2021), and mid-November (15 November 2021), with n = 5 biological replications, were selected. To examine the distinctive response of phenolic compounds, the aforementioned phenological stages were selected, corresponding to the initial oil accumulation stage in the olive, the early veraison stage, and the full ripening and harvesting stage, respectively.
Samples extracts were obtained by mixing 1 g of fresh olive pulp with 10 mL of 80% aqueous methanol solution (v/v) acidified with 0.1% formic acid (v/v). The mixture was homogenized by an Ultra-Turrax high-speed rotor for 1 min and then centrifuged at 6000× g for 10 min at 4 °C (5190-R, Eppendorf, Hamburg, Germany). After centrifugation, 1 mL aliquots were collected from the resulting supernatants, further filtered using a cellulose syringe filter of 0.22 μm pore size, and transferred to vials for metabolomics analysis.

2.5. Phenolic Profiling Using Untargeted Metabolomics

The phenolic compounds in the olive extracts were profiled through ultra-high-performance liquid chromatography coupled to a high-resolution quadrupole-time-of-flight hybrid mass spectrometry approach (UHPLC/QTOF-HRMS), as previously described [42]. The chromatographic system (UHPLC 1290 instrument by Agilent® Technologies, Santa Clara, CA, USA) was equipped with a reverse-phase Agilent® Poroshell 120 PFP column (100 mm × 2.1 i.d., 1.9 µm pore size), and the mobile phase consisted in a binary mixture of ultrapure water (solvent A) and acetonitrile (solvent B). Both solvents were acidified with 0.1% formic acid (v/v), and chromatographic separation was achieved by applying a continuous gradient elution (6%B to 94%B) for 32 min, followed by an equilibration period of 3 min to return to the initial elution conditions before the subsequent injection. The flow rate was adjusted at 200 μL min−1, and the injection volume was 6 μL.
The QTOF-MS analyzer (iFunnel G6550, Agilent®) was equipped with an electrospray ionization source. The mass spectrometer operated in positive polarity (ESI+) and SCAN modes, with an acquisition range of 100–1200 m/z (extended dynamic range) and a resolution of 30,000 FWHM. Nitrogen was employed as sheath gas (12 L min−1, 315 °C) as well as drying gas (14 L min−1, 250 °C). The nebulizer pressure was adjusted at 45 psi, and the nozzle and capillary voltages were set at 350 V and 4000 V, respectively. After the acquisition, raw feature deconvolution was carried out from the total ion current and further processed by Agilent® MassHunter Profinder software (v.10.0). Annotation was carried out by the “find-by-formula” algorithm setting the following parameters: retention time and mass alignment, 0.1 min retention time tolerance, 5 ppm mass tolerance, and data reduction filter to remove the features that were not present in at least the 80% of the replicates within each experimental group. Annotation was carried out by considering the isotope pattern of the acquired features, including their monoisotopic mass, isotopic spacing, and isotopic ratio. The database Phenol-Explorer 3.6 [43] was used to achieve the annotation of phenolic compounds, which was obtained following the level 2 (putatively annotated compounds) of the COSMOS initiative (COordination of Standards in MetabOlomicS) [44].
Once annotated, the phenolic compounds were classified and grouped into classes and subclasses, and then semi-quantification was performed using a representative analytical standard for each class (cyanidin for anthocyanins, (+)-catechin for flavanols, luteolin for flavones and other flavonoids, quercetin for flavonols, sesamin for lignans, tyrosol for the low-molecular-weight (LMW) and other phenolics, ferulic acid for phenolic acids, and trans-resveratrol for stilbenes). For this purpose, standards were used to build the corresponding calibration curves by preparing serial solutions analyzed through the same workflow used for the samples. All reference standards were analytical grade reference compounds (Extrasynthase®, Lyon, France). The results from the semi-quantification of the samples were expressed as equivalents of the corresponding standards in mg per gram of fresh weight (mg g−1 FW).

2.6. Statistical Analysis

The abundance of annotated compounds was transformed to log2, normalized at the 75th percentile, and baselined against the median values of all samples before applying multivariate statistical analyses using the software Mass Profiler Professional (v. 15.1, Agilent Technologies). Firstly, an unsupervised hierarchical cluster analysis (HCA) was performed to assess the influence of different factors on the phenolic profile of olive samples according to their profile-wide similarities. A fold-change-based heatmap was used to obtain the corresponding clustering dendrogram, applying Euclidean distance and Ward’s linkage rule. Afterward, a fold change (FC) analysis was performed to assess the relative variation in each compound due to the different treatments with respect to control. In parallel, a supervised orthogonal projection to latent structures discriminant analysis (OPLS-DA), using SIMCA software (v. 16.0, Umetrics®, Malmö, Sweden), was performed to discriminate the effect of every factor on the phenolic profile of olive samples. The quality of OPLS models was determined by goodness-of-fit and goodness-of-prediction parameters (R2 and Q2, respectively). Moreover, models were statistically validated by cross-validation analysis of variance (CV-ANOVA, p < 0.05), and overfitting was excluded according to the permutation test. Each OPLS model was combined with variable importance in projection (VIP) analysis to identify the most discriminant metabolites, setting a VIP score threshold of 1.4.
Concerning the data from the semi-quantification of phenolic compounds in olive samples, the results were expressed as the mean ± standard deviation (SD) and statistically analyzed by one-way ANOVA followed by Duncan’s post hoc test, assuming a significance threshold of α = 0.05 (n = 5), using the software SPSS (v. 25.0, IBM®, Armonk, NY, USA). Water potential data were analyzed using Sigmaplot 8.0 (SystatSoftware Inc., San Jose, CA, USA). The data referring to the effects of fruit load and deficit irrigation on olives and oil accumulation were presented as mean ± standard error and statistically analyzed by one-way ANOVA followed by Tukey’s post hoc test, assuming a significance threshold of α = 0.05 (n = 5), using the software SPSS (v. 25.0, IBM®, Armonk, NY, USA).

3. Results

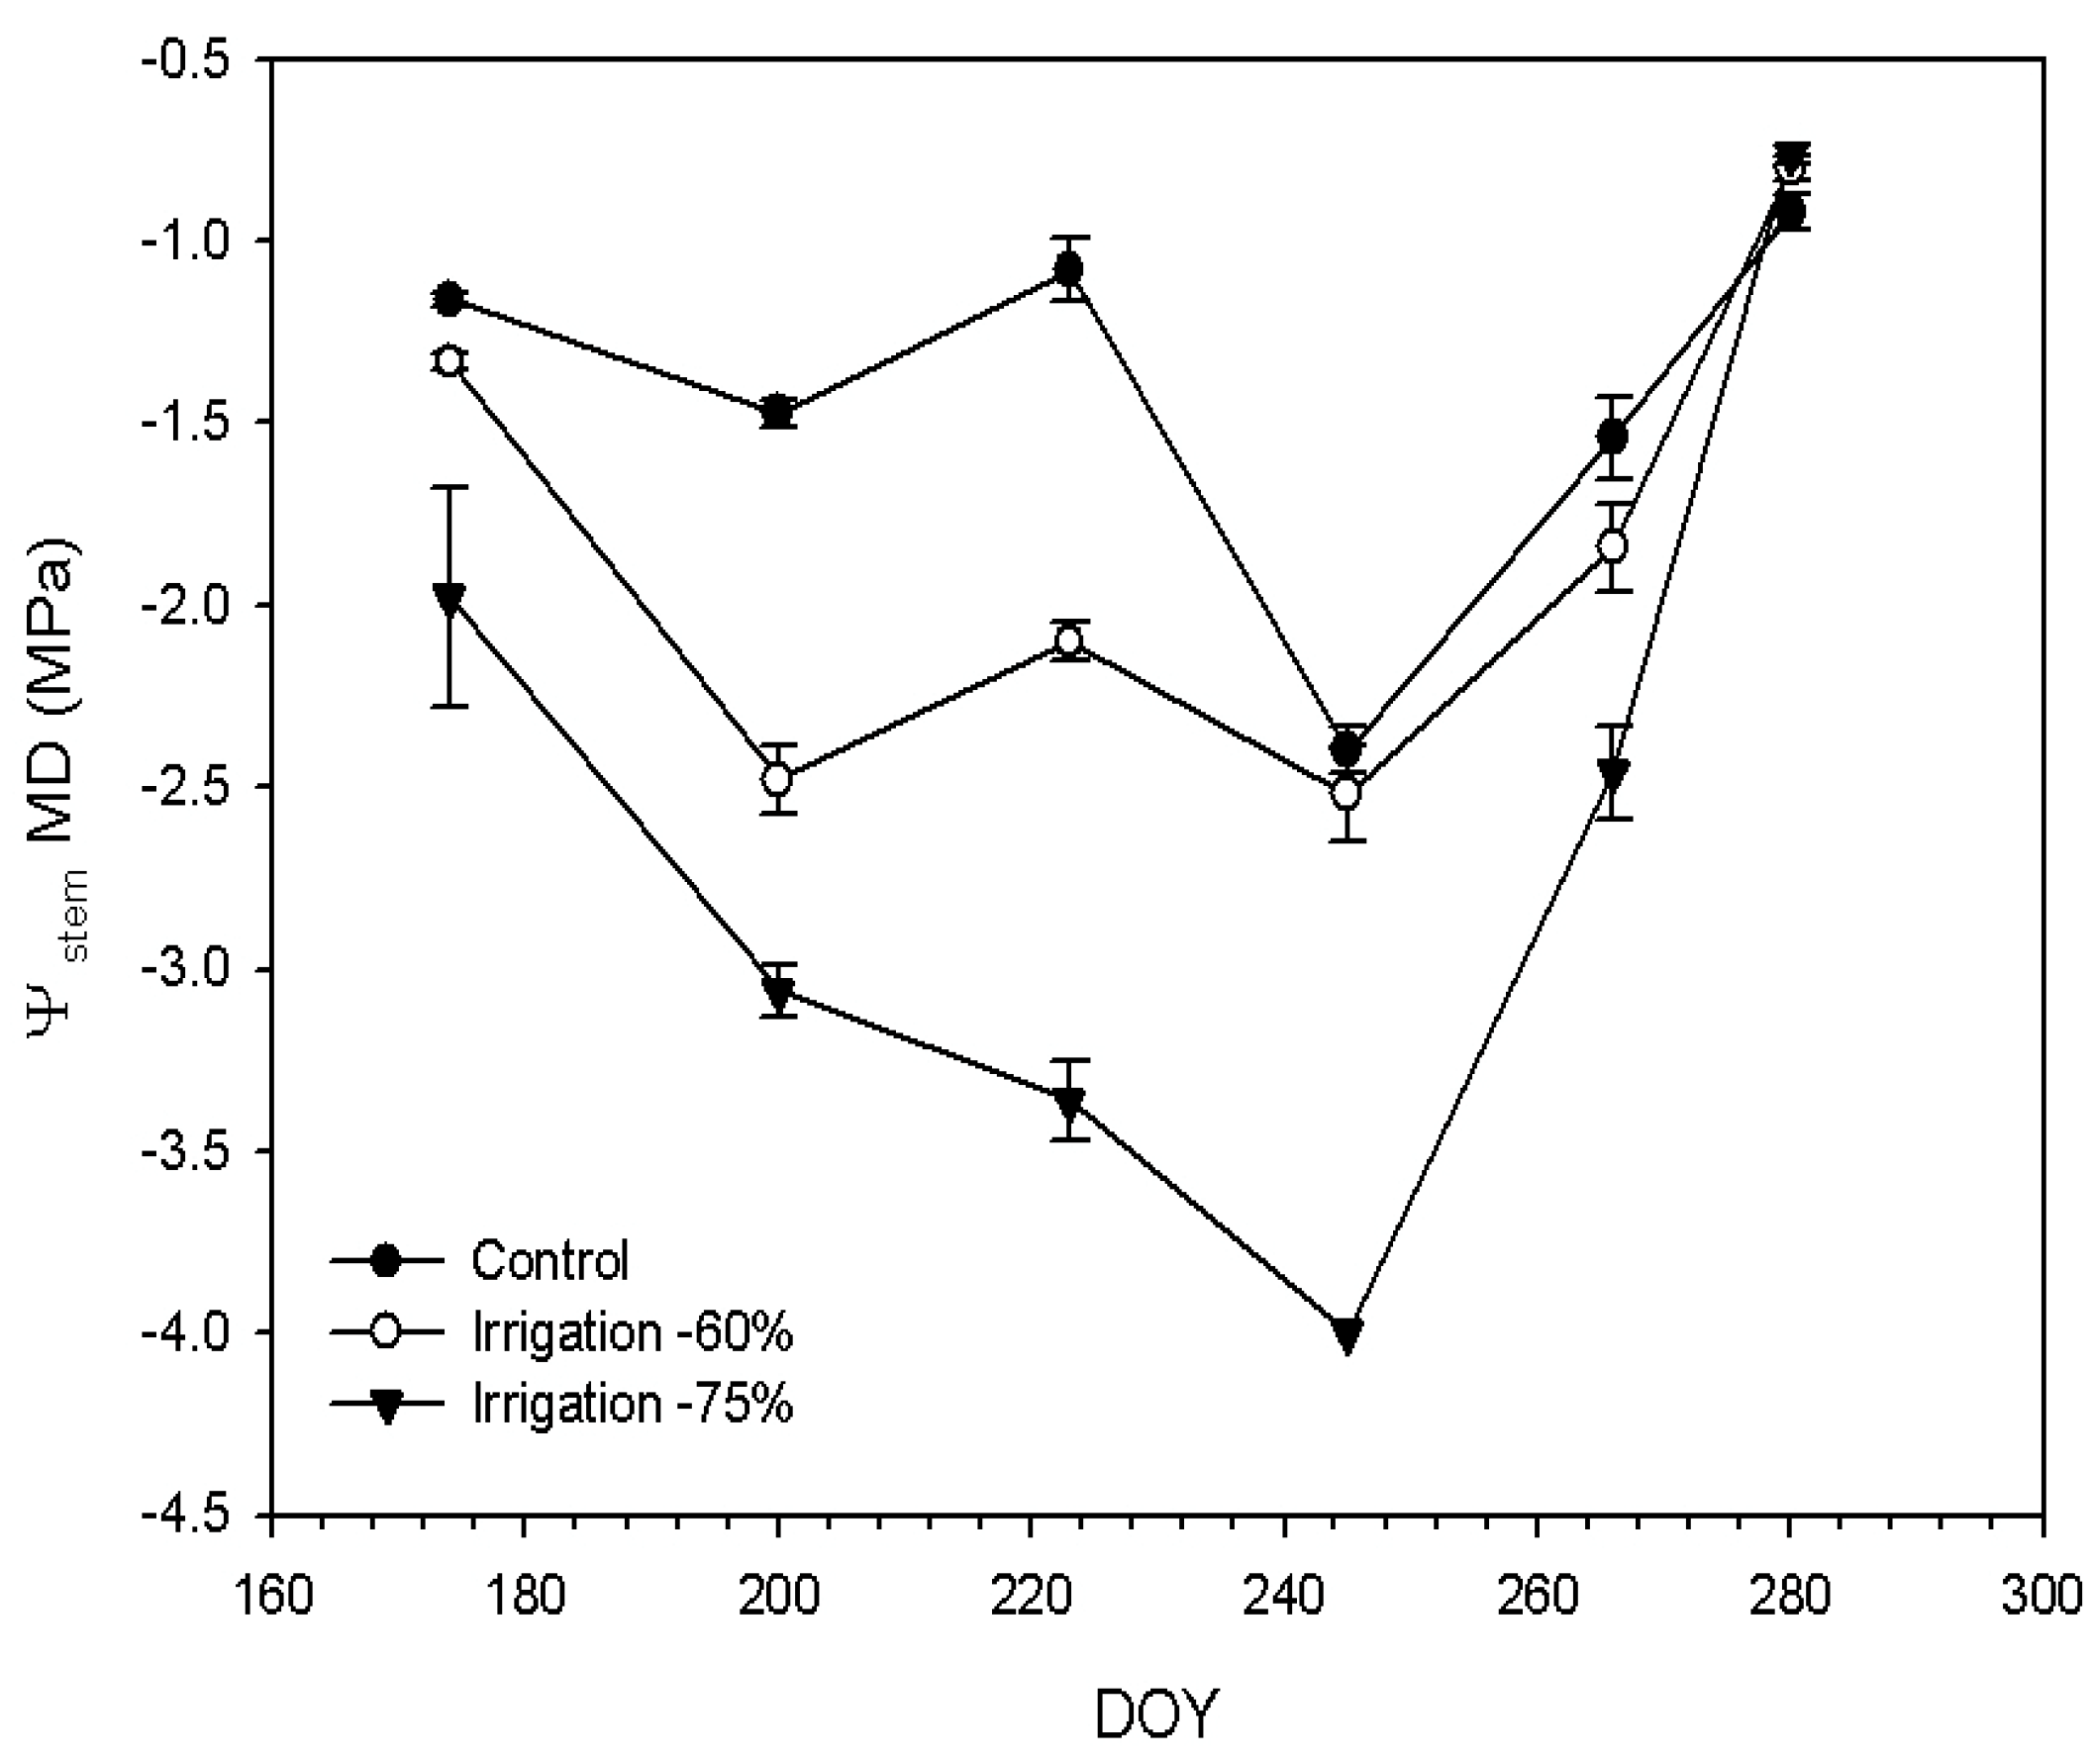
3.1. Fruit Load and Deficit Irrigation Effect on Oil Accumulation, Water Potential, and Olive Growth Dynamics

Regardless of the treatment, a steady increase in oil yield over time was observed. Thinning treatments had an oil accumulation trend similar to the control, with no statistically significant differences until the last sampling time (Table 1). Conversely, deficit irrigation caused a meaningful decrease in oil accumulation within the fruit. A significant statistical difference in oil yield was observed between the deficit irrigation treatments and the control since 23 September (Table 1).
Concerning vegetative growth, at the pre-harvest time (7 October 2021), the number of fruits, length, and nodes of the current-year shoot showed significant differences (Table S1). Specifically, current-year vegetative growth was higher in treatments with flower thinning than in the control. On the other hand, water deficit resulted in a noticeable decrease in both vegetative growth and the number of fruits. Although the number of inflorescences at the beginning of the experiment (during full bloom on 21 May 2021, as shown in Table S1) was higher in the −60% and −75% deficit irrigation treatments than in the other treatments, water deficit resulted in significantly fewer attached fruits and a reduced fruit yield at harvest compared with the control. Furthermore, at the pre-harvest time, the thinning treatments led to a decrease in the number of fruits and, consequently, an increase in the current-year vegetative growth compared with the control.
Considering the assessment of the water status of the trees, the water potential was determined, and the results are displayed in Figure 1. According to the FAO calculation method for the estimation of crop water requirement [39], crop evapotranspiration (ETc) including rainfall was 109.4 mm, which was slightly higher than the irrigation applied in the control trees (92 mm). As observed in Figure 1, the irrigation control allowed for maintaining Ψstem MD higher than −2 MPa, except in the record of September (245 DOY < 2.25 MPa). In the same way, the treatment involving −60% deficit irrigation entered water stress at two points between July and September, whereas −75% deficit irrigation remained under water stress for the whole season.
According to the present results, the treatments involving −66% thinning and −75% irrigation were considered with the control for subsequent analyses, representing the most severe conditions for each agronomical technique. It was therefore postulated that the conditions of more severe treatments may elicit a more pronounced response in phenol accumulation. Three critical sampling dates were considered, including 2 September, 23 September, and 15 November, coinciding with the final harvest time. As shown in Table 2, trees with low fruit load (thinning −66%) had a short-term significant increase in olive fresh and dry weight, according to the first sampling date. In contrast, both parameters remained similar to the control over fruit ripening, with the exemption of dry weight, which was significantly increased at the end of the experiment. In contrast, the deficit irrigation practice had a significant negative effect on fresh and dry weight throughout the experiment. Concerning the pulp–stone ratio, subtle differences were observed between the control and both practices since only deficit irrigation significantly reduced the ratio at the end of the experiment. Conversely, both techniques significantly increased the maturity index of fruits, although no significant differences were reported at the end of the experiment. In productive terms (Table 2), the production (kg/plant) of the −75% deficit irrigation treatment decreased by 80% compared with the control. Meanwhile, thinning resulted in a halving of production compared with the control. Furthermore, both the water deficit and thinning treatments reduced the plant fruit load; consequently, because of the larger availability of primary metabolites, ripening proceeded faster than in control. Indeed, the maturity index was higher in the deficit irrigation treatments on the first and second sampling dates (Table 2).

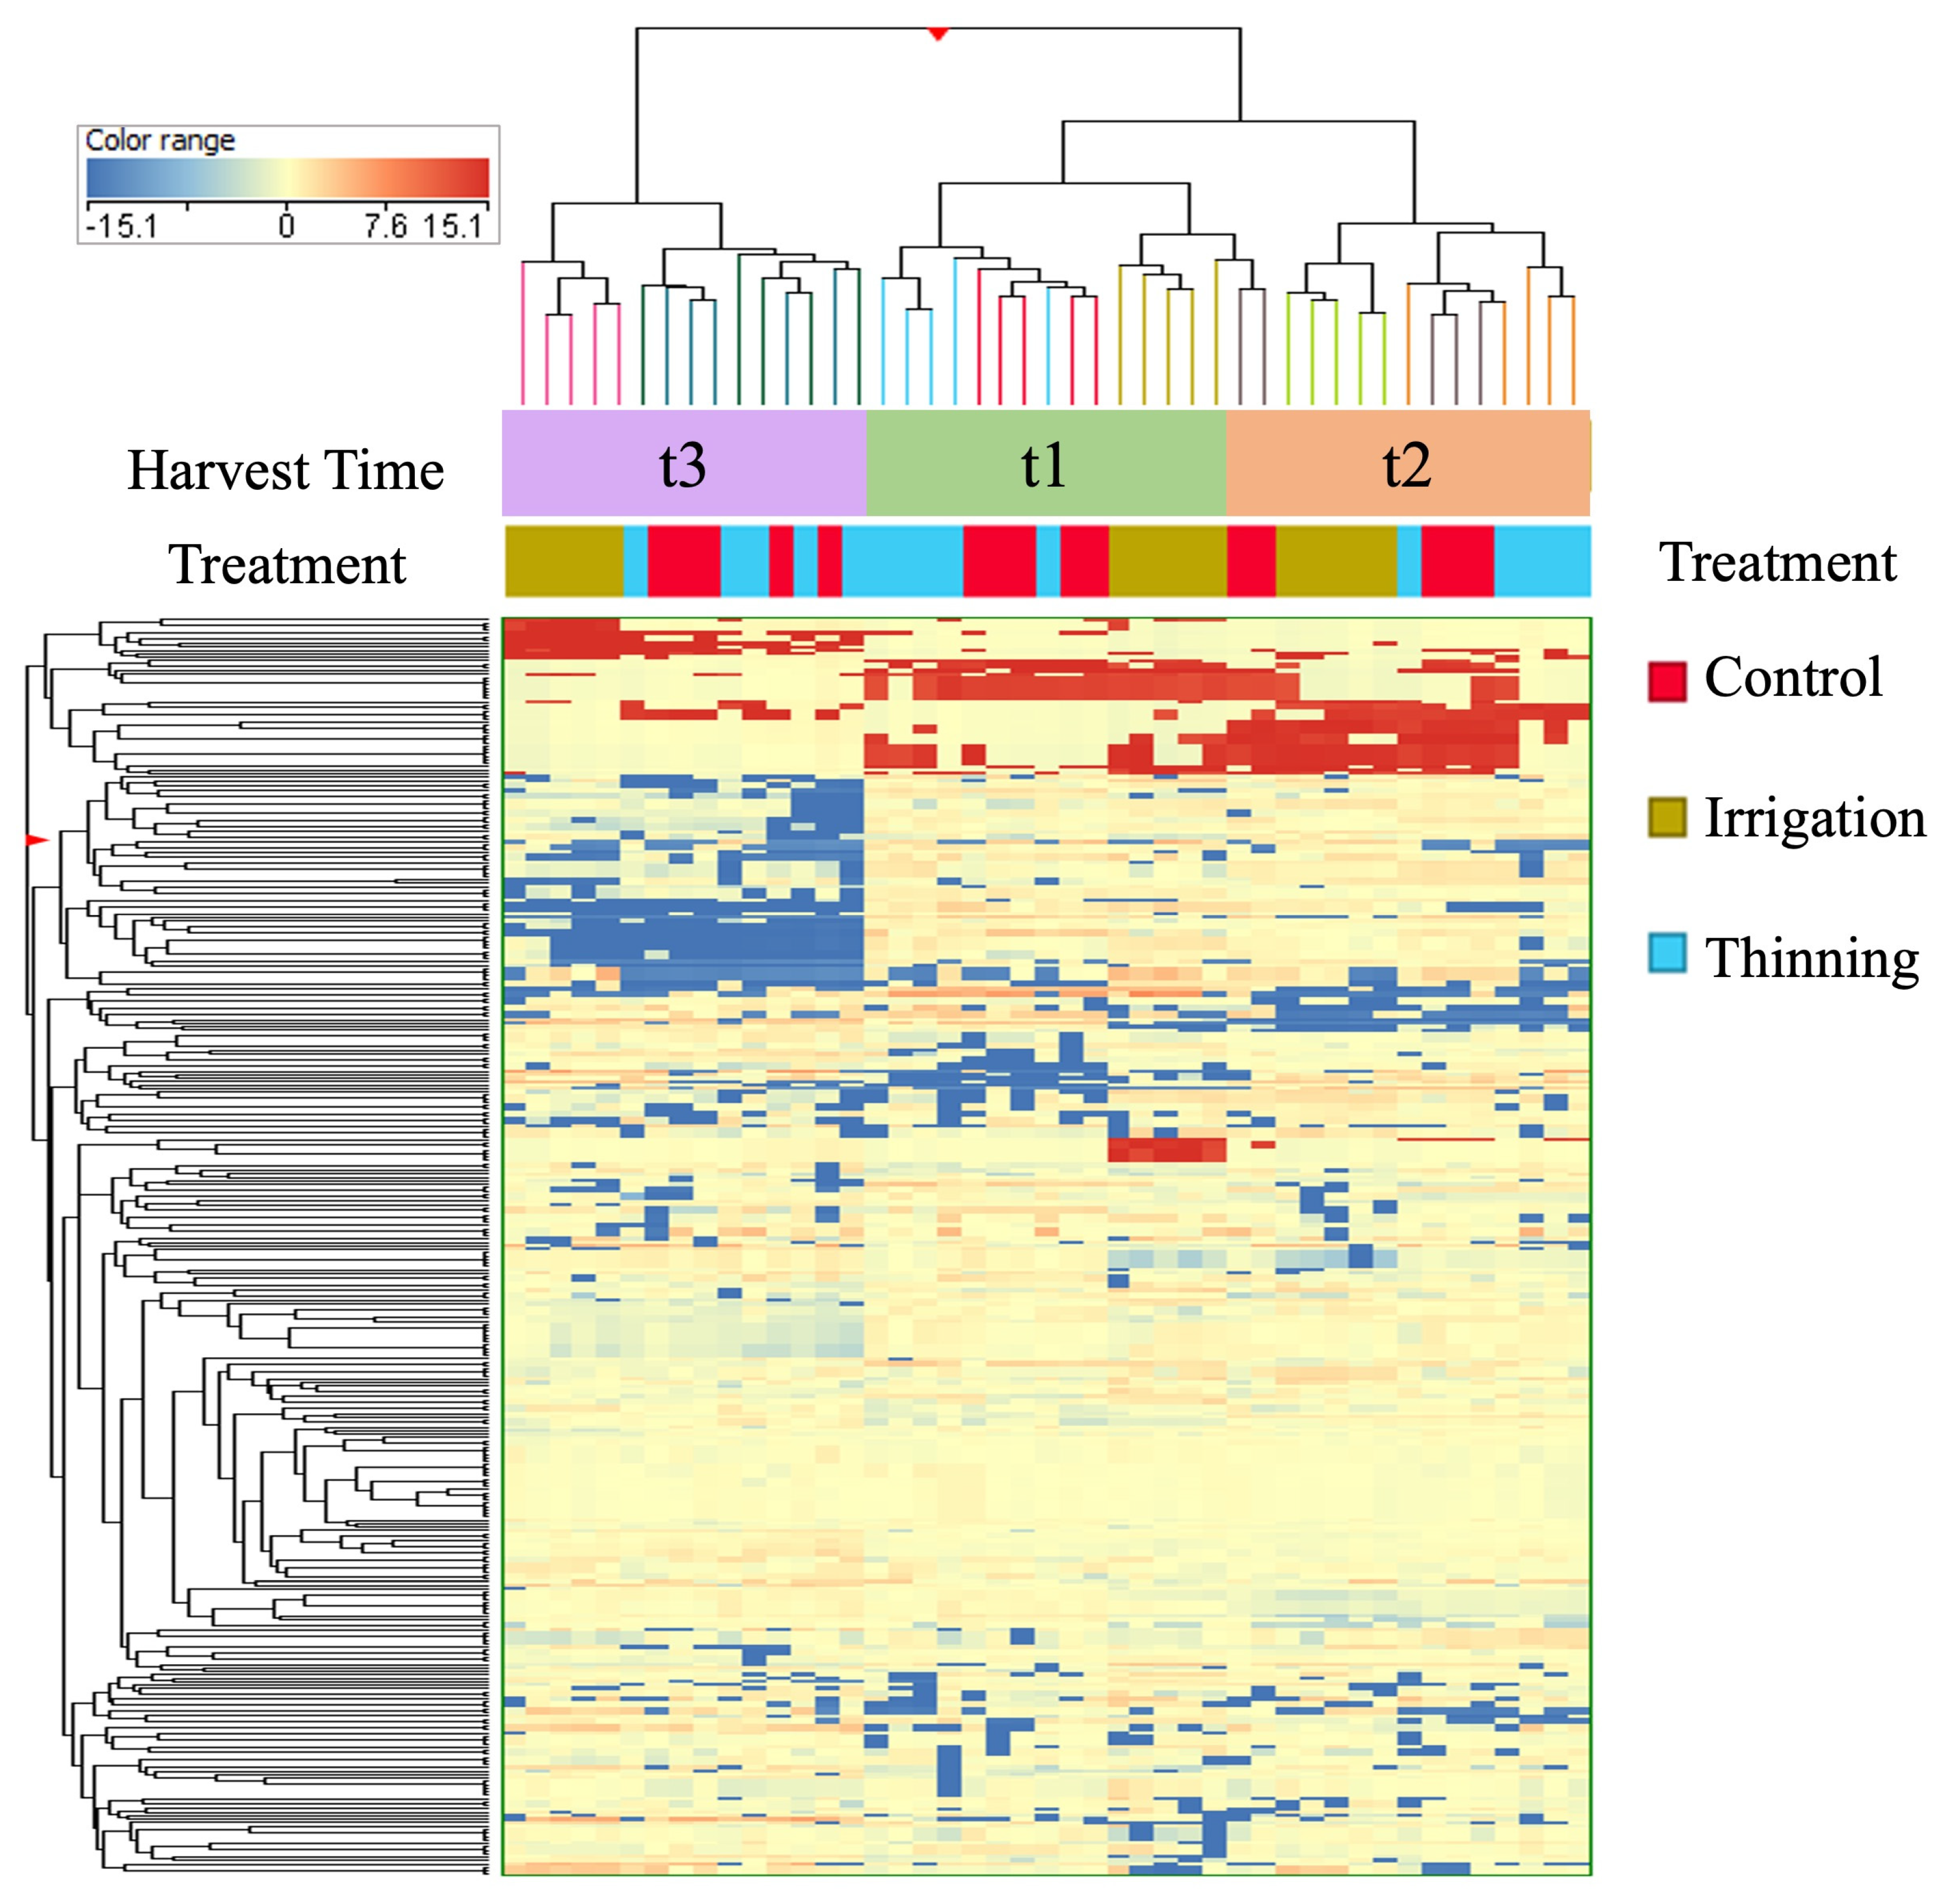
3.2. Fruit Load and Deficit Irrigation Effect on the Phenolic Profile of Olive Extracts

The effect of decreased crop load and deficit irrigation was investigated throughout the UHPLC/QTOF-HRMS untargeted metabolomics approach of olive fruits. A total of 233 different phenolic compounds were annotated within all the analyzed samples, which are reported in Table S2, together with their phenolic class and subclass and analytical parameters. From these, 107 compounds of flavonoids were reported, mostly represented by anthocyanins and flavones. Moreover, LMW and other phenolics (58 compounds) were widely represented, mainly including alkylphenols and tyrosols. Interestingly, the class of phenolic acids (43 compounds) contained >80% of hydroxycinnamic acids. Finally, the lignans and stilbenes classes showed the lowest contribution, with only 25 compounds (Table S2). These results indicate that olive fruits have a high heterogeneity in polyphenols and are thus considered a rich source of these compounds.
To investigate the effect of harvest time and agronomical techniques (thinning and deficit irrigation) on the phenolic profile of olive fruits, a multivariate HCA was performed to cluster olive extracts naively according to their similarities ascribed to both factors (Figure 2). The results indicate the impact of harvest time on the phenolic profile of olive fruits, obtaining two separated clusters that grouped t1 and t2 together and apart from t3, which clustered independently. The treatments played a differential role in the phenolic profile of the olive fruits, showing that deficit irrigation depicted an exclusive profile at all times, whereas thinning was found to promote a highly similar profile to that of the control regardless of the harvest time (Figure 3).
Once the differential influence of deficit irrigation and thinning on the phenolic profile of the olive fruits was assessed over time, a supervised OPLS discriminant analysis (OPLS-DA) was performed to identify those metabolites showing the strongest contribution to the discrimination between each agronomical technique and control conditions for thinning (Figure 3A) and deficit irrigation (Figure 3B). The quality of both models was assessed by the goodness-of-fit (R2) and goodness-of-prediction parameters (Q2), which resulted in the following values: R2 = 0.880 and Q2 = 0.537 for the thinning-associated model and R2 = 0.976 and Q2 = 0.888 for the deficit irrigation-associated model. The highest quality values observed for deficit irrigation may confirm the information provided earlier by HCA, which suggested a distinctive profile associated with this technique for control rather than thinning.
Concerning the OPLS model associated with thinning (Figure 3A), the list of VIP markers (Table 3) shows a predominance of flavonoids, which were found either up- or down-accumulated, thus suggesting a deep modulation of their biosynthesis due to the application of this agronomical technique. Among the most discriminant compounds, flavonoid glycosides were mainly found, except for flavanols, which were found in their aglycone forms. Among them, the anthocyanin glycoside malvidin 3-O-(6″-p-coumaroyl-glucoside) accumulated (logFC = 4.0), whereas for spinacetin glycosides, a decreased accumulation was reported (logFC = −4.0–−0.75). This fact also suggests that flavonoid mobilization towards olive fruits is highly influenced by thinning, although there is not a clear differential behavior compared to control. Besides flavonoids, phenolic acids, LMW, and other phenolics were also identified as VIP markers of thinning in a lower proportion (Table 3). In the case of phenolic acids, in contrast to what was observed for flavonoids, a general accumulation of deglycosylated hydroxycinnamic acids and derivatives, such as 3,4-dicaffeoylquinic acid, sinapine, and ferulaldehyde, was reported (logFC = 0.27–1.35), together with a repressed accumulation of hydroxycinnamic acid glycosides and esters, represented by 1,2-diferuloylgentiobiose and p-coumaric ethyl ester (logFC = −0.28 and −0.15, respectively). A parallel trend was attributed to LMW and other phenolics since free forms of the secoiridoid ligstroside (p-HPEA-EDA, logFC = 0.28) and catechols (3-methylcatechol, logFC = 0.38) accumulated. In contrast, a decreased accumulation of acetylated derivatives was observed, as reported for tyrosol acetate (p-HPEA-AC, logFC = −0.71) and acetyl eugenol (logFC = −0.32).
In contrast, the OPLS model attributed to deficit irrigation (Figure 3B) was combined with a heterogeneous representation of VIP markers, featuring phenolic acids (35%), flavonoids (25%), LMW, and other phenolics (25%) (Table 4). Interestingly, all VIP markers associated with deficit irrigation were found to be accumulated with respect to the control (logFC = 0.07–2.33 for all compounds). These results indicate a diversified metabolic response of olive fruits towards deficit irrigation, involving the accumulation of phenolic compounds. Considering the different classes, phenolic acids were exclusively represented by hydroxycinnamic acids, from which those presenting an aglycone form exhibited the highest accumulation rates, i.e., sinapine, coumaric acid, and 3-sinapoylquinic acid (logFC > 1.0), whereas gentiobioside glycosides exhibited a lower accumulation trend compared with the control (logFC < 1.0). In the case of flavonoids, only glycosylated forms were presented among discriminant markers, featuring the chalcone phloretin 2′-O-xylosyl-glucoside (logFC = 1.65), whereas the rest of the flavonoid glycosides showed a little contribution (logFC = 0.26–0.51; Table 4). Among LMW and other phenols, ligstroside presented a marked accumulation (logFC = 1.42), whereas other compounds like the coumarin scopoletin and pyrogallol were also found to be accumulated to a lesser extent (logFC = 0.75 and 0.71, respectively).
Finally, to shed light on the absolute effect of the two agronomical techniques tested in this work, a semi-quantification of phenolic classes was performed in olive extracts, and the results are depicted in Figure 4. Regarding the different phenolic subfamilies, LMW phenolics achieved the highest content rates, with maximum contents being >20 mg g−1 FW, followed by phenolic acids and lignans, reaching content peaks of 1–2 mg g−1 FW, whereas all flavonoid subclasses presented a content < 1 mg g−1 FW, and stilbenes reflected the lowest contents (<0.5 mg g−1 FW). Referring to the factors involved in this study, i.e., time and agronomical techniques, both played a significant role in the phenolic content of olive fruits.
Thus, in the case of LMW and other phenolics (Figure 4G), the results indicate that both agronomical techniques significantly increased the content of this subfamily with respect to the control in a time-dependent manner (p < 0.05) as follows: thinning led to a significant increase in the short term (t1, 23.3 mg g−1 FW), whereas deficit irrigation promoted a significant increase in the mid-term (t2, 24.4 mg g−1 FW), and the content harshly decreased in the long term regardless of the treatment (t3, 3.33–7.77 mg g−1 FW for all treatments). A similar trend was observed for lignans (Figure 4E), as deficit irrigation promoted a mid-term significant increase (t2, 1.11 mg g−1 FW), whereas a marked decrease was reported after long harvest times (t3, <0.77 mg g−1 FW for all treatments). Equally, deficit irrigation promoted a sustained significantly increased phenolic acid content up to 1.09–1.33 mg g−1 FW, reporting 51.1%, 28.4%, and 32.5% improvements with respect to the control at t1, t2, and t3, respectively (Figure 4F). Concerning flavonoid subfamilies, the accumulation of flavanols, flavones, and flavonols followed a similar trend as follows: the treatments did not induce a substantial effect on their contents, and a long-term decrease was observed in all cases (Figure 4B–D, respectively). Finally, the contents of anthocyanins and stilbenes were not markedly altered by any factor, showing slight variations over time regardless of the treatment (less than 5% variations due to any condition for both subfamilies at all times; Figure 4A,H).
Overall, the results provided by the untargeted metabolomics approach on the phenolic profile of olive fruits demonstrate that LMW and other phenolics, phenolic acids, and lignans are involved in the response attributed to the agronomical techniques tested. In contrast, flavonoids exhibited differential patterns of accumulation among their forms that do not reflect a quantitative change in accumulation. Specifically, deficit irrigation promoted a mid-term enhancement in the accumulation of their content, leading to an exclusive metabolic fingerprinting, as reported by the phenolic profile of olive fruits.

4. Discussion

The results in the present study provide important information for modern olive growing, whose goal is to produce Italian high-quality extra virgin olive oil at lower prices, considering an ongoing change in the olive oil sector to reach an efficient and sustainable productive system, with the ability to respond to current threads associated with climate change. From this perspective, high-density olive groves, designed to increase yield and make production more consistent, face the challenge of reducing inputs and obtaining a product with enhanced health-promoting properties and quality. Therefore, from the agronomic point of view, we tested the effect of fruit load and deficit irrigation on the oil accumulation and fruit ripening of the Sikitita cultivar.
Fruit load is one of the main carbon sinks on the tree, and it can influence primary metabolism by affecting carbon partitioning. In the case of high fruit loads, vegetative growth is reduced, and a condition of carbohydrate scarcity is also induced, causing low fruit quality at harvest [45]. In our experiment, fruit load was varied by applying flower thinning that allowed for deleting fruit carbon uptake before it became a significant sink for the tree. Fruit load affects the level of carbon demand without changing the carbon supply potential of the tree. Therefore, low fruit load reduces carbon uptake demand.
In our study, a lighter fruit load led to intermediate oil accumulation in the fruits of the intermediate thinning trees (−33% and −50%), without a significant difference from the control, whereas the fresh and dry weight of the fruits increased with the most intense conditions, −66% (Table 2). However, thinning caused a significant reduction in fruit yield per plant. In this context, Lavee and Wodner, 2004 [46], suggested that fruits of comparable size from both high-yielding and low-yielding trees have equivalent metabolic capabilities for oil synthesis. In Barnea and Manzanillo cultivars, it was also shown that the relative amount of oil in the fruit, once reaching an annual maximum, is not fruit size-dependent, but it is based on genetic and environmental conditions. However, several authors generally assume that the accumulation and concentration of oil within the fruit are significantly reduced with high crop loads [18,21]. The different responses of fruit oil content among these studies likely depend on the source–sink balance for carbon in olive trees during fruit development [17].
Irrigation has been shown to affect both oil yield and quality, indicating that oil in the fruit decreases as the amount of water applied increases [47]. However, water deficit significantly affects the availability of carbohydrates by reducing leaf photosynthesis, mostly because of stomatal restrictions, as well as the formation of new leaves over the season [48]. It should be noted that the present study did not include physiological measures, such as leaf carbohydrate content, photosynthesis rate, or stomatal conductance and aperture. However, it provides a foundation for future studies on primary metabolism. Our results showed that the deficit irrigation applied in this study resulted in a significant oil yield loss in the fruit and production per plant. This is attributable to the achieved values of water potential (Figure 1). This finding is consistent with previous reports, where oil content in the mesocarp decreased as the tree’s water deficit level increased [17]. Indeed, values between −2.0 and −2.5 MPa were identified as the threshold for the onset of water stress, significantly impacting oil yield and quality [49]. In contrast, the trial by Marra et al., 2016 [50], in olive groves of cv. Arbequina showed how a return of 50–60% of the Crop Irrigation Requirement, corresponding to a water potential value of about −3 MPa, and a seasonal irrigation volume of 130 mm resulted in maximum production while maintaining high product quality.
In our experiment, light fruit load and water deficit caused a decrease in yield, leading to faster ripening over time. These results are in accordance with previous reports indicating that low fruit load leads to precocious olive veraison (i.e., color change), which is generally associated with the advancement of the ripening process [51]. This clearly indicates that the availability and/or the concentration of primary metabolites can have a significant influence on the onset of the ripening process [37]. This assumption has been demonstrated in other species such as grapevine, where the veraison process and the concomitant accumulation of phenolic compounds (i.e., synthesis of anthocyanins) are correlated with the concentration of carbohydrates in the fruit [52].
Afterward, an untargeted metabolomics approach was performed to decipher the effect of thinning and deficit irrigation over time on the chemical composition of olives. As previously discussed, the harvest period played a key role in plant productivity (oil in the fruit) and it also impacted the phenolic composition of olives, suggesting an important contribution of these metabolites to the management of the applied agronomical techniques. Hence, optimizing olive harvesting becomes a critical stage to ensure the highest amount of oil of a predefined level of quality [53]. The application of unsupervised multivariate statistics to the phenolic profile of olive extracts, through hierarchical cluster analysis, showed that harvest time had a significant impact on the phenolic profile of olives (Figure 2). The t3, which corresponds to the olive’s full maturation stage, clustered independently from t1 and t2, which are the mesocarp development stage and the green mature stage, respectively. These results are in line with those by Karagiannis et al., 2021 [54], who reported a unique profile of secondary metabolites associated with the black mature stage, the full ripening of the olive, independent of the other maturation stages.
Regarding the treatments, the phenolic compound profile was affected by both water deficit and crop load, but the first explained a larger effect. Indeed, this is not surprising since fruit load mainly alters the availability of primary metabolites, while water deficit induces a complex response by the plant that involves many other physiological pathways such as water regulation and drought-escaping mechanisms [55]. Indeed, phenolic compounds are usually involved in the stress response; in our study, they resulted in sensitivity, though to a lesser extent to fruit load. In the thinning treatment, the increase in phenolics (particularly LMW phenolics, including secoiridoids) was more consistent during the early phases of ripening (t1, Figure 4G). Similar results were obtained in the study by Ivancic et al., 2022 [23], where the total polyphenol content increased during the ripening process until it reached a maximum and then decreased. In the same study, the highest polyphenol content was observed in the olive skin at the last stage of ripening because of the accumulation of anthocyanins. In our study, a clear accumulation of the anthocyanin glycoside malvidin 3-O-(6″-p-coumaroyl-glucoside) was observed in the case of thinning. Similarly, in peaches [56], crop load did not influence the content of phenolics, except anthocyanins, the only group affected by thinning. In another study by Andreotti et al., 2010 [57], on nectarine fruit, total phenolic compounds were influenced by fruit load. The accumulation of flavanols and cinnamic acids was significant with fruit thinning. Those findings are in accordance with the present results, where a general accumulation of hydroxycinnamic acids and derivatives was found because of thinning. Interestingly, a decreased accumulation of acetylated phenolic acids was observed, suggesting an increased susceptibility of this phenolic subclass to oxidation [58], which can be caused by the induction of mild stress conditions associated with this agronomical technique.
Regarding water deficit, our results revealed that all VIP markers increased compared with the control. Among discriminant markers for the deficit irrigation treatment, all flavonoids were found to be glycosylated, in agreement with previous results, where a specific accumulation of flavonoid glycosides, such as luteolin 7-O-glucoside, apigenin 7-O-glucoside, and quercetin-3,7′-di-O-glucoside, was generally observed [47,55]. Additionally, the accumulation of flavonoid glycosides in response to water deficit is a well-known biochemical mechanism guiding the stress responses in plants, thus suggesting that limiting irrigation may induce an abiotic stress condition led by the accumulation of these bioactive compounds [59]. Nevertheless, contrasting results also indicate that deficit irrigation did not play a significant role in the distribution of phenolic compounds or the total polyphenol content of olive oil [35], thus prompting the development of further studies to elucidate the accurate involvement of flavonoids in the response to deficit irrigation. Furthermore, flavonoid glycosides contribute to the biosynthesis of other polyphenols, thus enhancing the overall antioxidant capacity of plants in response to abiotic stress [60]. In our study, besides flavonoids, hydroxycinnamic acids were found to be greatly accumulated because of this agronomical technique, suggesting a coordinating effect on polyphenol biosynthesis, by eliciting the accumulation of heterogeneous families of secondary metabolites. In this case, there is a general assumption that water stress induces an increase in hydroxycinnamic acid amides as an antioxidant mechanism to resist the overproduction of reactive oxygen species (ROS) under these conditions [61]. In parallel, the deficit irrigation-mediated accumulation of hydroxycinnamic acids could be a consequence of the reduction in lignin biosynthesis, as they are recognized precursors of lignin, and it has been suggested that the decrease in lignification is an adaptive response to water stress [62]. Furthermore, in our experiment, concerning LMW and other phenols, ligstroside showed a marked accumulation due to deficit irrigation. Ligstroside is one of the most important secoiridoids in the olive fruit, and the concentration of this compound increases with fruit development [63]. In agreement with our findings, Machado et al., 2013 [64], reported that secoiridoids derivatives, including the 3,4-dihydroxyphenylethyl alcohol-deacetoxyelenolic acid dialdehyde (3,4-DHPEA-EDA), oleuropein, and ligstroside, decreased as olive and water availability increased. Similarly, Cirilli et al., 2017 [65], reported that phenolic contents were found to increase under rainfed conditions, also indicating that phenolic catabolism was particularly modulated by water availability during the early stages of fruit development. In our case, the deficit promoted a significant increase in the mid-term for LMW and significantly increased phenolic acids.
The present study did not consider the processing stage since it aimed to evaluate the variability in the chemical composition of the olive fruit derived from the agronomic techniques applied, as the extraction method would further affect the phenolic content of the resulting oil differently. Furthermore, in general terms, only a small percentage of total phenols present in the fruits was transferred to the oils for all cultivars (0.38−1.95%). Specifically, in the Sikitita cultivar, only 0.67% of phenolic content remained in the oil. Among all phenolic groups, secoiridoids were the compounds with the highest transfer rate from fruits to oil, followed by flavonoids and simple phenols [28].

5. Conclusions

The impact of water deficit on fruit growth dynamics, maturation index, and oil yield was considerably more pronounced than that of fruit load. Based on the reported results, the reduction in oil yield caused by fruit load can be reduced by delaying harvest. Although oil yield was highest at a later harvest time, the accumulation of most phenolic classes decreased over the long term. Fruit load, deficit irrigation, and harvest time influenced the olive phenolic profile. A distinctive metabolic response in the phenolic profile of olives was observed, indicating the existence of unique re-programming fates associated with these agricultural techniques. In particular, LMW phenolics, essentially represented by tyrosols and hydroxycinnamic acids, were affected by both treatments. In contrast, flavonoids exhibited disparate responses among their forms. In the fruit load treatment, flavonoid glycosides displayed a more specific response, while flavonoid aglycones showed a broader response in the irrigation treatment.
Further research should aim to obtain clear insight into the effect of agronomic practices on both production parameters and the modulation of phenolic metabolism, particularly how primary metabolites and/or the environment regulate physiological pathways. For this purpose, a multi-year experimental design is highly recommended. Overall, the approach described here sheds light on the functional characterization of two agronomical techniques, paving the road to establishing novel and efficient practices leading to a more profitable and sustainable system for olive oil production.

Supplementary Materials

The following supporting information can be downloaded at https://www.mdpi.com/article/10.3390/ijpb15030064/s1, Table S1: Data on the vegetative and productive situation of olive trees in full bloom (21 May 2021) and at the pre-harvest time (7 October 2021). The data present shoot length (cm), shoot nodes (number/shoot), number of inflorescences and fruits (number/shoot), current-year apical shoot length (cm), and number of nodes present on the current-year shoot (number/apical shoot). Table S2: Dataset on the phenolic profile of olive extracts from untargeted metabolomics. The annotated compounds are provided together with phenolic class and subclass, individual abundance, retention time (min), composite mass spectra (accurate mass and intensity combinations), and molecular formula.

Author Contributions

Conceptualization, C.F. and S.T.; methodology, S.T., L.L. and P.G.-P.; software, C.F. and P.G.-P.; formal analysis, C.F., S.T. and P.G.-P.; investigation, C.F., S.T. and P.G.-P.; resources, C.F., S.T., L.L. and P.G.-P.; data curation, C.F. and P.G.-P.; writing—original draft preparation, C.F. and P.G.-P.; writing—review and editing, C.F., S.T., L.L., E.C. and P.G.-P.; visualization, C.F. and P.G.-P.; supervision, S.T. and E.C.; project administration, C.F., S.T. and E.C.; funding acquisition, E.C. and L.L. All authors have read and agreed to the published version of the manuscript.

Funding

This research received no external funding.

Institutional Review Board Statement

Not applicable.

Informed Consent Statement

Not applicable.

Data Availability Statement

The original contributions presented in this study are included in this article and Supplementary Materials. Further data are available on request.

Acknowledgments

C.F. would like to thank the Doctoral School on the Agro-Food System (Agrisystem) at Università Cattolica del Sacro Cuore (Italy) for awarding her the research grant, which enabled her to explore the topics discussed in this paper. The authors wish to thank the “Romeo ed Enrica Invernizzi” foundation (Milan, Italy) for its kind support of the metabolomics facility at Università Cattolica del Sacro Cuore. The work by P.G.-P. was financed by the Spanish Ministry of Universities under the application 33.50.460A.752 and by the European Union NextGenerationEU/PRTR through a Margarita Salas contract by the Universidade de Vigo.

Conflicts of Interest

The authors declare no conflicts of interest.

References

  1. Lu, Y.; Zhao, J.; Xin, Q.; Yuan, R.; Miao, Y.; Yang, M.; Mo, H.; Chen, K.; Cong, W. Protective effects of oleic acid and polyphenols in extra virgin olive oil on cardiovascular diseases. Food Sci. Hum. Wellness 2024, 13, 529–540. [Google Scholar] [CrossRef]
  2. EC—European Commission, Expert Group for Agricultural Markets—Arable crops and olive oil. Market Situation in the Olive Oil and Table Olive Sectors. 2023. Available online: https://agriculture.ec.europa.eu/system/files/2023-12/market-situation-olive-oil-table-olives_en.pdf (accessed on 2 January 2024).
  3. D’Adamo, I.; Falcone, P.M.; Gastaldi, M.; Morone, P. A social analysis of the olive oil sector: The role of family business. Resources 2019, 8, 151. [Google Scholar] [CrossRef]
  4. Guarino, F.; Falcone, G.; Stillitano, T.; de Luca, A.I.; Gulisano, G.; Mistretta, M.; Strano, A. Life cycle assessment of olive oil: A case study in southern Italy. J. Environ. Manag. 2019, 238, 396–407. [Google Scholar] [CrossRef] [PubMed]
  5. Lombardo, L.; Farolfi, C.; Capri, E. Sustainability certification, a new path of value creation in the olive oil sector: The Italian case study. Foods 2021, 10, 501. [Google Scholar] [CrossRef] [PubMed]
  6. Stillitano, T.; Falcone, G.; Nicolò, B.F.; di Girolamo, C.; Gulisano, G.; de Luca, A.I. Technical efficiency assessment of intensive and traditional olive farms in Southern Italy. Agris Line Pap. Econ. Inform. 2019, 11, 81–93. [Google Scholar] [CrossRef]
  7. D’Adamo, I.; Falcone, P.M.; Gastaldi, M. Price analysis of extra virgin olive oil. Br. Food J. 2019, 121, 1899–1911. [Google Scholar] [CrossRef]
  8. Lombardo, L.; Farolfi, C.; Tombesi, S.; Novelli, E.; Capri, E. Development of a sustainability technical guide for the Italian olive oil supply chain. Sci. Total Environ. 2022, 820, 153332. [Google Scholar] [CrossRef]
  9. Orlandi, F.; Rojo, J.; Picornell, A.; Oteros, J.; Pérez-Badia, R.; Fornaciari, M. Impact of climate change on olive crop production in Italy. Atmosphere 2020, 11, 595. [Google Scholar] [CrossRef]
  10. International Olive Council. International Olive Oil Production Costs Study: Results, Conclusions and Recommendations. 2015. Available online: https://www.internationaloliveoil.org/wp-content/uploads/2019/11/INTERNATIONAL-OLIVE-OIL-PRODUCTION-COSTS-STUDY-.pdf (accessed on 25 January 2023).
  11. Criscuolo, N.; Guarino, F.; Angelini, C.; Castiglione, S.; Caruso, T.; Cicatelli, A. High biodiversity arises from the analyses of morphometric, biochemical and genetic data in ancient olive trees of South of Italy. Plants 2019, 8, 297. [Google Scholar] [CrossRef]
  12. Roselli, L.; Clodoveo, M.L.; Corbo, F.; de Gennaro, B. Are health claims a useful tool to segment the category of extra-virgin olive oil? Threats and opportunities for the Italian olive oil supply chain. Trends Food Sci. Technol. 2017, 68, 176–181. [Google Scholar] [CrossRef]
  13. Ferrara, R.M.; Bruno, M.R.; Campi, P.; Camposeo, S.; de Carolis, G.; Gaeta, L.; Martinelli, N.; Mastrorilli, M.; Modugno, A.F.; Mongelli, T.; et al. Water use of a super high-density olive orchard submitted to regulated deficit irrigation in Mediterranean environment over three contrasted years. Irrig. Sci. 2024, 42, 57–73. [Google Scholar] [CrossRef]
  14. Guerrero-Casado, J.; Carpio, A.J.; Tortosa, F.S.; Villanueva, A.J. Environmental challenges of intensive woody crops: The case of super high-density olive groves. Sci. Total Environ. 2021, 798, 149212. [Google Scholar] [CrossRef] [PubMed]
  15. Trentacoste, E.R.; Puertas, C.M.; Sadras, V.O. Effect of irrigation and tree density on vegetative growth, oil yield and water use efficiency in young olive orchard under arid conditions in Mendoza, Argentina. Irrig. Sci. 2015, 33, 429–440. [Google Scholar] [CrossRef]
  16. Navas-Lopez, J.F.; León, L.; Trentacoste, E.R.; de la Rosa, R. Multi-environment evaluation of oil accumulation pattern parameters in olive. Plant Physiol. Biochem. 2019, 139, 485–494. [Google Scholar] [CrossRef] [PubMed]
  17. Gucci, R.; Lodolini, E.; Rapoport, H.F. Productivity of olive trees with different water status and crop load. J. Hortic. Sci. Biotechnol. 2007, 82, 648–656. [Google Scholar] [CrossRef]
  18. Trentacoste, E.R.; Puertas, C.M.; Sadras, V.O. Effect of fruit load on oil yield components and dynamics of fruit growth and oil accumulation in olive (Olea europaea L.). Eur. J. Agron. 2010, 32, 249–254. [Google Scholar] [CrossRef]
  19. Gucci, R.; Caruso, G.; Gennai, C.; Esposto, S.; Urbani, S.; Servili, M. Fruit growth, yield and oil quality changes induced by deficit irrigation at different stages of olive fruit development. Agric. Water Manag. 2019, 212, 88–98. [Google Scholar] [CrossRef]
  20. Siakou, M.; Bruggeman, A.; Eliades, M.; Zoumides, C.; Djuma, H.; Kyriacou, M.C.; Emmanouilidou, M.G.; Spyros, A.; Manolopoulou, E.; Moriana, A. Effects of deficit irrigation on ‘Koroneiki’ olive tree growth, physiology and olive oil quality at different harvest dates. Agric. Water Manag. 2021, 258, 107200. [Google Scholar] [CrossRef]
  21. Fernández, F.J.; Ladux, J.L.; Hammami, S.B.M.; Rapoport, H.F.; Searles, P.S. Fruit, mesocarp, and endocarp responses to crop load and to different estimates of source: Sink ratio in olive (cv. Arauco) at final harvest. Sci. Hortic. 2018, 234, 49–57. [Google Scholar] [CrossRef]
  22. Kokkotos, E.; Zotos, A.; Patakas, A. The Ecophysiological Response of Olive Trees under Different Fruit Loads. Life 2024, 14, 128. [Google Scholar] [CrossRef]
  23. Ivancic, T.; Jakopic, J.; Veberic, R.; Vesel, V.; Hudina, M. Effect of Ripening on the Phenolic and Sugar Contents in the Meso- and Epicarp of Olive Fruits (Olea europaea L.) Cultivar ‘Leccino’. Agriculture 2022, 12, 1347. [Google Scholar] [CrossRef]
  24. Rao, G.; Liu, X.; Zha, W.; Wu, W.; Zhang, J. Metabolomics reveals variation and correlation among different tissues of olive (Olea europaea L.). Biol. Open 2017, 6, 1317–1323. [Google Scholar] [CrossRef]
  25. Dias, M.C.; Pinto, D.C.G.A.; Figueiredo, C.; Santos, C.; Silva, A.M.S. Phenolic and lipophilic metabolite adjustments in Olea europaea (olive) trees during drought stress and recovery. Phytochemistry 2021, 185, 112695. [Google Scholar] [CrossRef] [PubMed]
  26. EFSA Panel on Dietetic Products, Nutrition and Allergies (NDA). Scientific Opinion on the substantiation of health claims related to polyphenols in olive and protection of LDL particles from oxidative damage (ID 1333, 1638, 1639, 1696, 2865), maintenance of normal blood HDL-cholesterol concentrations (ID 1639), maintenance of normal blood pressure (ID 3781), “anti-inflammatory properties” (ID 1882), “contributes to the upper respiratory tract health” (ID 3468), “can help to maintain a normal function of gastrointestinal tract” (3779), and “contributes to body defences against external agents” (ID 3467) pursuant to Article 13 of Regulation (EC) No 1924/2006. EFSA J. 2011, 9, 2033. [Google Scholar] [CrossRef]
  27. Jerman Klen, T.; Mozetič Vodopivec, B. The fate of olive fruit phenols during commercial olive oil processing: Traditional press versus continuous two- and three-phase centrifuge. LWT Food Sci. Technol. 2012, 49, 267–274. [Google Scholar] [CrossRef]
  28. Talhaoui, N.; Gómez-Caravaca, A.M.; León, L.; de la Rosa, R.; Fernández-Gutiérrez, A.; Segura-Carretero, A. From olive fruits to olive Oil: Phenolic compound transfer in six different olive cultivars grown under the same agronomical conditions. Int. J. Mol. Sci. 2016, 17, 337. [Google Scholar] [CrossRef]
  29. Ortega-García, F.; Peragón, J. Phenylalanine ammonia-lyase, polyphenol oxidase, and phenol concentration in fruits of Olea europaea L. cv. picual, verdial, arbequina, and frantoio during ripening. J. Agric. Food Chem. 2009, 57, 10331–10340. [Google Scholar] [CrossRef]
  30. Servili, M.; Sordini, B.; Esposto, S.; Taticchi, A.; Urbani, S.; Sebastiani, L. Metabolomics of Olive Fruit: A Focus on the Secondary In The Olive Tree Genome, Compendium of Plant Genomes; Rugini, E., Baldoni, L., Muleo, R., Sebastiani, L., Eds.; Springer: Cham, Switzerland, 2016; pp. 123–139. [Google Scholar] [CrossRef]
  31. Pierantozzi, P.; Torres, M.; Tivani, M.; Contreras, C.; Gentili, L.; Mastio, V.; Parera, C.; Maestri, D. Yield and chemical components from the constitutive parts of olive (cv. Genovesa) fruits are barely affected by spring deficit irrigation. J. Food Compos. Anal. 2021, 102, 104072. [Google Scholar] [CrossRef]
  32. Angilè, F.; Vivaldi, G.A.; Girelli, C.R.; del Coco, L.; Caponio, G.; Lopriore, G.; Fanizzi, F.P.; Camposeo, S. Treated Unconventional Waters Combined with Different Irrigation Strategies Affect 1 H NMR Metabolic Profile of a Monovarietal Extra Virgin Olive Oil. Sustainability 2022, 14, 1592. [Google Scholar] [CrossRef]
  33. Faghim, J.; Ben Mohamed, M.; Bagues, M.; Guasmi, F.; Triki, T.; Nagaz, K. Irrigation effects on phenolic profile and extra virgin olive oil quality of “‘Chemlali’” variety grown in South Tunisia. S. Afr. J. Bot. 2021, 141, 322–329. [Google Scholar] [CrossRef]
  34. García-Garví, J.M.; Sánchez-Bravo, P.; Hernández, F.; Sendra, E.; Corell, M.; Moriana, A.; Burgos-Hernández, A.; Carbonell-Barrachina, Á.A. Effect of Regulated Deficit Irrigation on the Quality of ‘Arbequina’ Extra Virgin Olive Oil Produced on a Super-High-Intensive Orchard. Agronomy 2022, 12, 1892. [Google Scholar] [CrossRef]
  35. Sastre, B.; Arbonés, A.; Pérez-Jiménez, M.Á.; Pascual, M.; Benito, A.; de Lorenzo, C.; Villar, J.M.; Bonet, L.J.; Paz, S.; Santos, Á.; et al. Influence of Regulated Deficit Irrigation on Arbequina’s Crop Yield and EVOOs Quality and Sensory Profile. Agronomy 2022, 13, 31. [Google Scholar] [CrossRef]
  36. Fernandes-Silva, A.; Oliveira, M.; APaço, T.; Ferreira, I. Deficit Irrigation in Mediterranean Fruit Trees and Grapevines: Water Stress Indicators and Crop Responses. In Irrigation in Agroecosystems; IntechOpen: London, UK, 2019. [Google Scholar] [CrossRef]
  37. Martinelli, F.; Basile, B.; Morelli, G.; d’Andria, R.; Tonutti, P. Effects of irrigation on fruit ripening behavior and metabolic changes in olive. Sci. Hortic. 2012, 144, 201–207. [Google Scholar] [CrossRef]
  38. Martinelli, F.; Remorini, D.; Saia, S.; Massai, R.; Tonutti, P. Metabolic profiling of ripe olive fruit in response to moderate water stress. Sci. Hortic. 2013, 159, 52–58. [Google Scholar] [CrossRef]
  39. Allen, R.G.; Pereira, L.S.; Raes, D.; Smith, M. Crop Evapotranspiration—Guidelines for Computing Crop Water Requirements—FAO Irrigation and Drainage Paper 56; Food and Agriculture Organization of the United Nations (FAO): Rome, Italy, 1998. [Google Scholar]
  40. McCutchan, H.; Shackel, K.A. Stem-water potential as a sensitive indicator of water stress in prune trees (Prunus domestica L. cv. French). J. Am. Soc. Hortic. Sci. 1992, 117, 607–611. [Google Scholar] [CrossRef]
  41. International Olive Council. Guide for the Determination of the Characteristics of Oil-Olives. 2011. Available online: https://www.internationaloliveoil.org/wp-content/uploads/2019/11/COI-OH-Doc.-1-2011-Eng.pdf (accessed on 15 March 2023).
  42. García-Pérez, P.; Rocchetti, G.; Giuberti, G.; Lucchini, F.; Lucini, L. Phenolic acids, lignans, and low-molecular-weight phenolics exhibit the highest in vitro cellular bioavailability in different digested and faecal-fermented phenolics-rich plant extracts. Food Chem. 2023, 412, 135549. [Google Scholar] [CrossRef]
  43. Neveu, V.; Perez-Jiménez, J.; Vos, F.; Crespy, V.; du Chaffaut, L.; Mennen, L.; Knox, C.; Eisner, R.; Cruz, J.; Wishart, D.; et al. Phenol-Explorer: An online comprehensive database on polyphenol contents in foods. J. Biol. Databases Curation 2010, 2010, bap024. [Google Scholar] [CrossRef]
  44. Salek, R.M.; Steinbeck, C.; Viant, M.R.; Goodacre, R.; Dunn, W.B. The role of reporting standards for metabolite annotation and identification in metabolomic studies. GigaScience 2013, 2, 1–3. [Google Scholar] [CrossRef]
  45. Falchi, R.; Bonghi, C.; Drincovich, M.F.; Famiani, F.; Lara, M.V.; Walker, R.P.; Vizzotto, G. Sugar Metabolism in Stone Fruit: Source-Sink Relationships and Environmental and Agronomical Effects. Front. Plant Sci. 2020, 11, 573982. [Google Scholar] [CrossRef]
  46. Lavee, S.; Wodner, M. The effect of yield, harvest time and fruit size on the oil content in fruits of irrigated olive trees (Olea europaea), cvs. Barnea and Manzanillo. Sci. Hortic. 2004, 99, 267–277. [Google Scholar] [CrossRef]
  47. Gonçalves, A.; Silva, E.; Brito, C.; Martins, S.; Pinto, L.; Dinis, L.T.; Luzio, A.; Martins-Gomes, C.; Fernandes-Silva, A.; Ribeiro, C.; et al. Olive tree physiology and chemical composition of fruits are modulated by different deficit irrigation strategies. J. Sci. Food Agric. 2020, 100, 682–694. [Google Scholar] [CrossRef] [PubMed]
  48. Petridis, A.; Therios, I.; Samouris, G.; Koundouras, S.; Giannakoula, A. Effect of water deficit on leaf phenolic composition, gas exchange, oxidative damage and antioxidant activity of four Greek olive (Olea europaea L.) cultivars. Plant Physiol. Biochem. 2012, 60, 1–11. [Google Scholar] [CrossRef] [PubMed]
  49. Hueso, A.; Trentacoste, E.R.; Junquera, P.; Gómez-Miguel, V.; Gómez-del-Campo, M. Differences in stem water potential during oil synthesis determine fruit characteristics and production but not vegetative growth or return bloom in an olive hedgerow orchard (cv. Arbequina). Agric. Water Manag. 2019, 223, 105589. [Google Scholar] [CrossRef]
  50. Marra, F.P.; Marino, G.; Marchese, A.; Caruso, T. Effects of different irrigation regimes on a super-high-density olive grove cv. “Arbequina”: Vegetative growth, productivity and polyphenol content of the oil. Irrig. Sci. 2016, 34, 313–325. [Google Scholar] [CrossRef]
  51. Dag, A.M.; Kerem, Z.; Yogev, N.; Zipori, I.; Lavee, S.; Ben-David, E. Influence of time of harvest and maturity index on olive oil yield and quality. Sci. Hortic. 2011, 127, 358–366. [Google Scholar] [CrossRef]
  52. Martínez-Lüscher, J.; Kurtural, S.K. Source–Sink manipulations have major implications for grapevine berry and wine flavonoids and aromas that go beyond the changes in berry sugar accumulation. Food Res. Int. 2023, 169, 112826. [Google Scholar] [CrossRef]
  53. Nasini, L.; Proietti, P. Olive harvesting. In The Extra-Virgin Olive Oil Handbook; John Wiley & Sons, Ltd.: Chichester, UK, 2014; pp. 87–105. [Google Scholar] [CrossRef]
  54. Karagiannis, E.; Michailidis, M.; Skodra, C.; Stamatakis, G.; Dasenaki, M.; Ganopoulos, I.; Samiotaki, M.; Thomaidis, N.S.; Molassiotis, A.; Tanou, G. Proteo-metabolomic journey across olive drupe development and maturation. Food Chem. 2021, 363, 130339. [Google Scholar] [CrossRef]
  55. Mechri, B.; Tekaya, M.; Hammami, M.; Chehab, H. Effects of drought stress on phenolic accumulation in greenhouse-grown olive trees (Olea europaea). Biochem. Syst. Ecol. 2020, 92, 104112. [Google Scholar] [CrossRef]
  56. Buendía, B.; Allende, A.; Nicolás, E.; Alarcón, J.J.; Gil, M.I. Effect of regulated deficit irrigation and crop load on the antioxidant compounds of peaches. J. Agric. Food Chem. 2008, 56, 3601–3608. [Google Scholar] [CrossRef]
  57. Andreotti, C.; Ravaglia, D.; Costa, G. Effects of Fruit Load and Reflective Mulch on Phenolic Compounds Accumulation in Nectarine Fruit. Eur. J. Hort. Sci. 2010, 75, 53. [Google Scholar]
  58. Fotiadou, R.; Lefas, D.; Vougiouklaki, D.; Tsakni, A.; Houhoula, D.; Stamatis, H. Enzymatic Modification of Pomace Olive Oil with Natural Antioxidants: Effect on Oxidative Stability. Biomolecules 2023, 13, 1034. [Google Scholar] [CrossRef] [PubMed]
  59. Speeckaert, N.; El Jaziri, M.; Baucher, M.; Behr, M. UGT72, a major glycosyltransferase family for flavonoid and monolignol homeostasis in plants. Biology 2022, 11, 441. [Google Scholar] [CrossRef] [PubMed]
  60. Zhang, W.; Wang, S.; Yang, J.; Kang, C.; Huang, L.; Guo, L. Glycosylation of plant secondary metabolites: Regulating from chaos to harmony. Environ. Exp. Bot. 2022, 194, 104703. [Google Scholar] [CrossRef]
  61. Macoy, D.M.; Kim, W.Y.; Lee, S.Y.; Kim, M.G. Biosynthesis, physiology, and functions of hydroxycinnamic acid amides in plants. Plant Biotechnol. Rep. 2015, 9, 269–278. [Google Scholar] [CrossRef]
  62. Hoffmann, L.; Besseau, S.; Geoffroy, P.; Ritztenthaler, C.; Meyer, D.; Lapierre, C.; Pollet, B.; Legrand, M. Silencing of hydroxycinnamoyl-coenzyme A shikimate/quinate hydroxycinnamoyltransferase affects phenylpropanoid biosynthesis. Plant Cell 2004, 16, 1446–1465. [Google Scholar] [CrossRef]
  63. Alagna, F.; Mariotti, R.; Panara, F.; Caporali, S.; Urbani, S.; Veneziani, G.; Esposto, S.; Taticchi, A.; Rosati, A.; Rao, R.; et al. Olive phenolic compounds: Metabolic and transcriptional profiling during fruit development. BMC Plant Biol. 2012, 12, 162. [Google Scholar] [CrossRef]
  64. Machado, M.; Felizardo, C.; Fernandes-Silva, A.A.; Nunes, F.M.; Barros, A. Polyphenolic compounds, antioxidant activity and l-phenylalanine ammonia-lyase activity during ripening of olive cv. “Cobrançosa” under different irrigation regimes. Food Res. Int. 2013, 51, 412–421. [Google Scholar] [CrossRef]
  65. Cirilli, M.; Caruso, G.; Gennai, C.; Urbani, S.; Frioni, E.; Ruzzi, M.; Servili, M.; Gucci, R.; Poerio, E.; Muleo, R. The role of polyphenoloxidase, peroxidase, and β-glucosidase in phenolics accumulation in Olea europaea L. fruits under different water regimes. Front. Plant Sci. 2017, 8, 717. [Google Scholar] [CrossRef]
Figure 1. Water potential measurements of the deficit irrigation treatments from fruit set to pre-harvest time. Data are expressed as the mean ± standard error (n = 5).
Ijpb 15 00064 g001
Figure 2. Hierarchical cluster analysis (HCA) indicating the effect of deficit irrigation and thinning on the phenolic profile of olive fruits (Euclidean distance, Ward’s linkage rule).
Ijpb 15 00064 g002
Figure 3. Orthogonal projection to latent structures (OPLS) models were built to discriminate between thinning (A) and deficit irrigation (B) according to the phenolic profile of olive fruits.
Ijpb 15 00064 g003
Figure 4. Semi-quantification of each subfamily of phenolic compounds (AH). All results are expressed in mg g−1 of equivalents (Eq.) for each reference compound. Vertical bars indicate the standard deviation (n = 6). Different lowercase letters indicate statistically significant differences (p < 0.05) within the same treatment at different sampling times. Different capital letters indicate statistically significant differences (p < 0.05) among treatments within the same sampling time.
Ijpb 15 00064 g004
Table 1. Olive oil yield, provided as a percentage of weight with respect to olive fruits, over time according to the different treatments applied.
TreatmentsSampling Dates
06/2307/1908/1109/0209/2310/0710/2511/15
Control0.0% ± 0.00 1.4% ± 0.22 4.8% ± 0.61 11.8% ± 0.43 12.7% ± 0.80 14.7% ± 1.02 19.3% ± 0.40 22.3% ± 0.29
Thinning −33%0.0% ± 0.001.3% ± 0.12 5.8% ± 0.33 12.6% ± 0.38 12.6% ± 0.59 15.7% ± 0.61 20.3% ± 0.87 23.6% ± 1.13
Thinning −50%0.0% ± 0.00 1.2% ± 0.25 6.1% ± 0.47 11.9% ± 0.2712.8% ± 0.72 14.8% ± 0.27 19.6% ± 0.84 23.8% ± 0.72
Thinning −66%0.0% ± 0.00 1.0% ± 0.26 6.3% ± 0.29 12.5% ± 0.38 12.6% ± 0.71 15.0% ± 0.76 19.2% ± 1.47 21.6% ± 0.96
Factor
(p-value)
n.s.n.s.n.s.n.s.n.s.n.s.n.s.n.s.
Control0.0% ± 0.00 1.4% ± 0.22 4.8% ± 0.61 11.8% ± 0.43 12.7% ± 0.80 a14.7% ± 1.02 19.3% ± 0.40 a22.3% ± 0.29 a
Irrigation −60%0.0% ± 0.00 1.1% ± 0.38 6.6% ± 0.72 9.6% ± 1.31 12.7% ± 0.38 a13.6% ± 0.71 19.3% ± 0.62 a21.2% ± 0.31 a
Irrigation −75%0.0% ± 0.00 1.8% ± 0.16 6.9% ± 0.56 9.4% ± 0.21 9.5% ± 0.61 b13.1% ± 1.17 14.2% ± 0.71 b19.3% ± 0.78 b
Factor
(p-value)
n.s.n.s.n.s.n.s.0.004n.s.<0.0010.003
Data are expressed as the mean ± standard error (n = 5). Different letters in the same column indicate statistically significant differences between treatments according to Tukey’s post hoc test (α = 0.05). n.s.: non-significant at α = 0.05.
Table 2. Olive fruit quality and production parameters at selected sampling dates for −66% thinning and −75% deficit irrigation treatments.
Sampling DateTreatmentsFresh Weight (g)Dry Weight (g)Pulp–Stone RatioMaturity Index
2 SeptemberControl1.11 ± 0.06 0.55 ± 0.03 1.46 ± 0.03 2.1 ± 0.07
Thinning −66%1.39 ± 0.05 0.71 ± 0.03 1.07 ± 0.11 2.9 ± 0.04
p-value0.0060.0050.011<0.001
Control1.11 ± 0.06 0.55 ± 0.03 1.46 ± 0.03 2.1 ± 0.07
Irrigation −75%0.63 ± 0.05 0.39 ± 0.03 1.01 ± 0.07 4.0 ± 0.07
p-value<0.0010.004<0.001<0.001
23 SeptemberControl1.40 ± 0.09 0.69 ± 0.05 1.80 ± 0.05 3.20 ± 0.09
Thinning −66%1.50 ± 0.08 0.74 ± 0.05 1.93 ± 0.11 4.50 ± 0.06
p-valuen.s.n.s.n.s.<0.001
Control1.40 ± 0.09 0.69 ± 0.05 1.80 ± 0.05 3.20 ± 0.09
Irrigation −75%0.90 ± 0.03 0.44 ± 0.01 1.65 ± 0.12 6.00 ± 0.11
p-value<0.0010.001n.s.<0.001
15 NovemberControl2.46 ± 0.08 1.10 ± 0.03 3.04 ± 0.08 6.94 ± 0.02
Thinning −66%2.85 ± 0.15 1.41 ± 0.12 3.47 ± 0.20 7.00 ± 0.01
p-valuen.s.0.038n.s.0.043
Control2.46 ± 0.08 1.10 ± 0.03 3.04 ± 0.08 6.94 ± 0.02
Irrigation −75%1.89 ± 0.090.73 ± 0.01 1.78 ± 0.05 6.98 ± 0.03
p-value0.001<0.001<0.001n.s.
Sampling DateTreatmentsCanopy Volume (m3/tree)Production (kg/plant)
15 NovemberControl2.69 ± 0.04 1.13 ± 0.15
Thinning −66%3.15 ± 0.01 0.52 ± 0.09
p-value<0.0010.009
Control2.69 ± 0.04 1.13 ± 0.15
Irrigation −75%1.97 ± 0.01 0.34 ± 0.08
p-value<0.0010.003
Data are expressed as the mean ± standard error (n = 5). According to the Tukey’s post hoc test (α = 0.05), statistically significant differences were observed between the treatments. n.s.: non-significant at α = 0.05.
Table 3. List of VIP (variable importance in projection) markers associated with the OPLS-DA model of the untargeted phenolic profile attributed to thinning in olive extracts.
Phenolic ClassPhenolic SubclassCompound NameVIP Score 1LogFC 2
FlavonoidsFlavonesApigenin 6,8-di-C-glucoside2.31 ± 1.54−0.32
ChalconesButein1.68 ± 0.791.12
Flavanones6-Prenylnaringenin1.65 ± 1.82−0.38
FlavonesLuteolin 7-O-glucuronide1.63 ± 1.930.34
AnthocyaninsMalvidin 3-O-(6″-p-coumaroyl-glucoside)1.62 ± 1.204.00
IsoflavonoidsGlycitin1.59 ± 2.670.68
FlavonesIsorhoifolin1.55 ± 0.84−0.28
FlavonolsSpinacetin 3-O-(2″-p-coumaroylglucosyl) (1–6)-[apiosyl(1–2)]-glucoside1.44 ± 1.95−0.75
Flavones5,6-Dihydroxy-7,8,3′,4′-tetramethoxyflavone1.42 ± 0.871.11
AnthocyaninsCyanidin 3-O-rutinoside1.41 ± 1.32−0.21
FlavonolsSpinacetin 3-O-glucosyl-(1–6)-[apiosyl(1–2)]-glucoside1.37 ± 1.38−4.00
FlavanolsTheaflavin1.35 ± 0.81−0.63
Flavanols(+)-Catechin1.35 ± 1.490.13
LignansLignansConidendrin1.50 ± 1.120.36
LignansSecoisolariciresinol1.41 ± 1.34−0.52
LMW and othersHydroxycinnamaldehydesFerulaldehyde1.64 ± 1.070.27
Alkylphenols3-Methylcatechol1.41 ± 1.080.38
HydroxyphenylpropenesAcetyl eugenol1.35 ± 1.36−0.32
Tyrosolsp-HPEA-EDA1.34 ± 1.040.28
Tyrosolsp-HPEA-AC1.32 ± 1.84−0.71
Other polyphenolsCoumestrol1.30 ± 1.49−4.00
Phenolic acidsHydroxycinnamic acidsSinapine1.92 ± 2.321.35
Hydroxybenzoic acidsEllagic acid1.58 ± 1.150.80
Hydroxycinnamic acids3,4-Dicaffeoylquinic acid1.50 ± 1.541.18
Hydroxycinnamic acidsp-Coumaric acid ethyl ester1.43 ± 1.22−0.15
Hydroxycinnamic acids1,2-Diferuloylgentiobiose1.38 ± 1.10−0.28
StilbenesStilbenesd-Viniferin1.76 ± 1.170.80
1 VIP score is expressed as the mean ± standard error provided by CV-ANOVA validation (n = 6). 2 Logarithm of fold change, expressed as the log2-transformed abundances of VIP markers calculated for the pairwise comparison thinning vs. control.
Table 4. List of VIP (variable importance in projection) markers associated with the OPLS-DA model of the untargeted phenolic profile attributed to deficit irrigation in olive extracts.
Phenolic ClassPhenolic SubclassCompound NameVIP Score 1LogFC 2
FlavonoidsDihydrochalconesPhloretin 2′-O-xylosyl-glucoside1.60 ± 0.541.65
FlavanonesNaringenin 7-O-glucoside1.58 ± 0.510.48
AnthocyaninsPetunidin 3-O-rhamnoside1.41 ± 0.380.27
FlavonesApigenin 6,8-di-C-glucoside1.40 ± 0.260.07
FlavonolsMyricetin 3-O-rhamnoside1.39 ± 0.570.15
LignansLignansCyclolariciresinol1.63 ± 0.351.38
LignansSecoisolariciresinol1.56 ± 0.410.20
LignansSesamol1.42 ± 0.671.09
LMW and othersOther polyphenolsPyrogallol1.54 ± 0.630.72
CurcuminoidsCurcumin1.53 ± 0.730.55
TyrosolsLigstroside1.52 ± 0.331.42
HydroxycoumarinsScopoletin1.47 ± 0.560.75
Other polyphenols3,4-Dihydroxyphenylglycol1.38 ± 0.630.48
Phenolic acidsHydroxycinnamic acidsCinnamic acid1.66 ± 0.740.94
Hydroxycinnamic acidsSinapine1.65 ± 0.762.33
Hydroxycinnamic acidsCaffeoyl aspartic acid1.60 ± 0.500.79
Hydroxycinnamic acids3-Sinapoylquinic acid1.59 ± 0.421.25
Hydroxycinnamic acidsp-Coumaric acid1.44 ± 1.011.92
Hydroxycinnamic acids1-Sinapoyl-2-feruloylgentiobiose1.38 ± 0.520.68
Hydroxycinnamic acids1,2-Diferuloylgentiobiose1.37 ± 1.090.60
1 VIP score is expressed as the mean ± standard error provided by CV-ANOVA validation (n = 6). 2 Logarithm of fold change, expressed as the log2-transformed abundances of VIP markers calculated for the pairwise comparison deficit irrigation vs. control.
Disclaimer/Publisher’s Note: The statements, opinions and data contained in all publications are solely those of the individual author(s) and contributor(s) and not of MDPI and/or the editor(s). MDPI and/or the editor(s) disclaim responsibility for any injury to people or property resulting from any ideas, methods, instructions or products referred to in the content.

