1. Introduction
Quercus L.(Fagaceae) is widely distributed throughout the Northern Hemisphere, both in the Holarctic (Nearctic and Palaearctic), the Neotropics (with the southern limit found in Colombia, where a single species,
Q. humboldtii Bonpl., is known), and some parts of the Oriental region, almost overlapping the Fagaceae distribution [
1]. Currently, it includes more than 400 species, although less conservative authors suggest there could be more than 500 or 600 [
2,
3]. The current consensus [
4] shows that
Quercus is divided into two subgenera:
Quercus and
Cerris. The subgenus
Quercus is divided into five sections (
Protobalanus,
Ponticae,
Virentes,
Lobatae, and
Quercus) and the subgenus
Cerris includes three sections (
Cyclobalanopsis,
Ilex,and
Cerris). The genus
Quercus L. (Fagaceae) is known for its complexity, and the difficulty that taxonomists face in classifying the taxa they observe [
5]. This is not only related to its plasticity but also to the existence of interspecific hybridizations [
6,
7] and introgressions [
7,
8,
9]. This is the reason why the list of synonyms is very long in many species.
Among the oaks mentioned throughout history in the Maghreb countries and especially in Algeria, very little is known about them, and this makes it difficult to distinguish them and compare with the European taxa. Different organs are used to classify the genus
Quercus according to the taxonomic level [
10]. Thus, floral organs are useful for the recognition of subgenera or sections [
11], while leaves (morphoanatomical and biometric) are used at the species and subspecies level [
12,
13]. Finally, acorns and the flours (catkins) can be used to recognize the taxa of the genus at different levels, but above all they help to delimit sections or complexes of species [
5,
13].
In Algeria,
Quercus genus is represented by the following species [
14,
15,
16]
Q. ilex L.,
Q. coccifera L.,
Q. suber L.,
Q. afares Pomel (belonging to Cerris section),
Q. faginea Lam. (with several subspecies) and
Q. canariensis Wills. (belonging to Quercus section);
Q. afares originates from hybridisation between
Q. suber and
Q. canariensis [
17] but recently, Simeone et al. [
18] found no evidence for this.
Around the denomination,
Quercus faginea Lam. are grouped into deciduous or semideciduous trees or shrubs, endemic to the Ibero–Maghreb region (Spain, Portugal, Morocco, Algeria, Tunisia), with a very remarkable foliar polymorphism. This has led to the description of numerous subspecies with a highly variable leaf morphology that is sometimes incompatible with the type form. To further complicate the problem of specific adjudication,
Q. faginea is able to hybridize with several species of two different sections [
19]; of the Quercus section (
Q. petraea (Matt.) Liebl,
Q. lusitanica Lam.,
Q. pubescens Willd.,
Q. pyrenaica Willd. and
Q. robur L.) and of the Cerris section (
Q. ilex L.,
Q. coccifera L.,
Q. suber L.,
Q. afares Pomel.). This fact causes the taxonomic delimitation to be delicate and unstable [
20,
21,
22]. The result of all this is the difficulty of relating inter-individual phenotypic variability to populations or even to coherent geographical subsets, both in the Iberian Peninsula and in North African distribution.
Within the annotations to the nomenclature of the genus
Quercus L. (Fagaceae), in the Iberian Peninsula and NW Africa of Vázquez et al. [
23], the following subspecies of
Q. faginea were recognized: subsp.
faginea Lam. 1783, subsp.
maroccana (Braun-Blanq. and Maire) [
24], present only in Morocco, and the subsp.
oscensis (P. Monts) FM Vázquez [
23], exclusively found in the north of the Iberian Peninsula (Eurosiberian region), which probably originated from an hybridization between the populations of
Q. faginea Lam. (sub.
Q. lusitanica) and
Q. robur L. On the other hand, Vázquez et al. [
23] consider that
Q. broteroi (Cout.) [
25] and
Q. broteroi subsp.
tlemcenensis (A.DC.) [
24], are synonymous with
Q. tlemcenensis Trab. Battandier and Trabut [
26] and Aissi et al. [
5] affirm that
Q. broteroi subsp.
oscensis hardly differs from
Q. tlemcenensis, because apart from its branchlets, it quickly becomes hairless over the course of the year. According to the data, the following species are present in Algeria:
Q. canariensis and
Q. tlemcenensis (=
Q. faginea subsp.
broteroi from Aissi et al. [
5]), because
Q. faginea subsp.
baetica is considered a synonymy of Q.
tlemcenensis by Vázquez et al. [
23]. Nevertheless, some authors affirm that
Q. faginea subsp.
faginea is also present [
5], and some others consider
Q. faginea subsp.
broteroi as a valid species ([
5,
27], for example).
Concerning
Q. canariensis, it is classified as a semi-evergreen tree, endemic to the Ibero–Maghreb region (eastern and southern Spain, Algeria, Morocco and Tunisia), with a remarkable foliar polymorphism. There are also several synonyms included in this denomination [
19]. The most interesting is
Q. nordafricana [
28], reported from Algeria and considered as
Q. canariensis by Vázquez et al. [
23].
Quercus nordafricana has also been named as
Q. canariensis Willd. var.
mirbeckii (Durieu) [
29] and
Q. faginea Lam. var.
mirbeckii (Durieu) [
30]. According to Quezel and Santa [
15],
Q. canariensis corresponds to
Q. faginea subsp.
baetica.
In view of the above findings, the aim of this study is to assess the taxonomic status of these complexes of species (Q. faginea and Q. canariensis from Algeria) by statistically analyzing the morphological variability of the Algerian populations compared to those already known in the Iberian Northeast, in order to re-evaluate its taxonomic–morphological definition, to know what is in Algeria.
3. Results
Mean and standard deviation for each quantitative variable and group can be found in
Table 3. Some evident differences are revealed between groups, although that is not the case between WS and WD: their means and standard deviations are very similar (see column W, which shows the conjoint or pooled results from WS and WD), but clearly differentiated from B and C, which is not quite different from F in some variables. On the other hand, the groups B and C show some similar values, though not for all the variables.
In
Figure 4, we can see the plot of the two first principal components obtained from a PCA, performed with the observations of groups WS and WD. We do not observe evident differences between the distributions of the two groups in these two axes. Nevertheless, can we affirm that the two groups are not significantly different? To answer this question, we performed a three-factor PERMANOVA design, including group (WS and WD), station (TMO1, TMO2 and TTT) and tree as factors. All quantitative variables were included, calculating the matrix of Euclidean distances between samples after normalizing the variables. As mentioned earlier, groups WS and WD share the same stations, so the factors group and station were crossed, whereas tree (stated as a random effect factor) was nested within the interaction group x station. The results were crystal clear: no significant differences between groups WS and WD (
p = 0.7724), but significant differences between stations (
p = 0.0001) and variability (as was expected) among trees (
p = 0.0001). No interaction was detected between groups and stations (
p = 0.6982). In addition, we performed the same PERMANOVA design for each of the quantitative variables separately (in fact, a permutational ANOVA for each variable), and the results confirmed the diagnostic: no significant differences for any of the seven variables between WS and WD (the smaller
p-value for group is
p = 0.2493 in the case of variable LP). In summary, we can accept that groups WS and WD are very close in terms of these quantitative variables, so we can consider pooling the groups WS and WD (labeled W) for the purposes of the analysis.
After pooling the groups WS and WD in a new group labeled W, we show the boxplots for every variable and group in
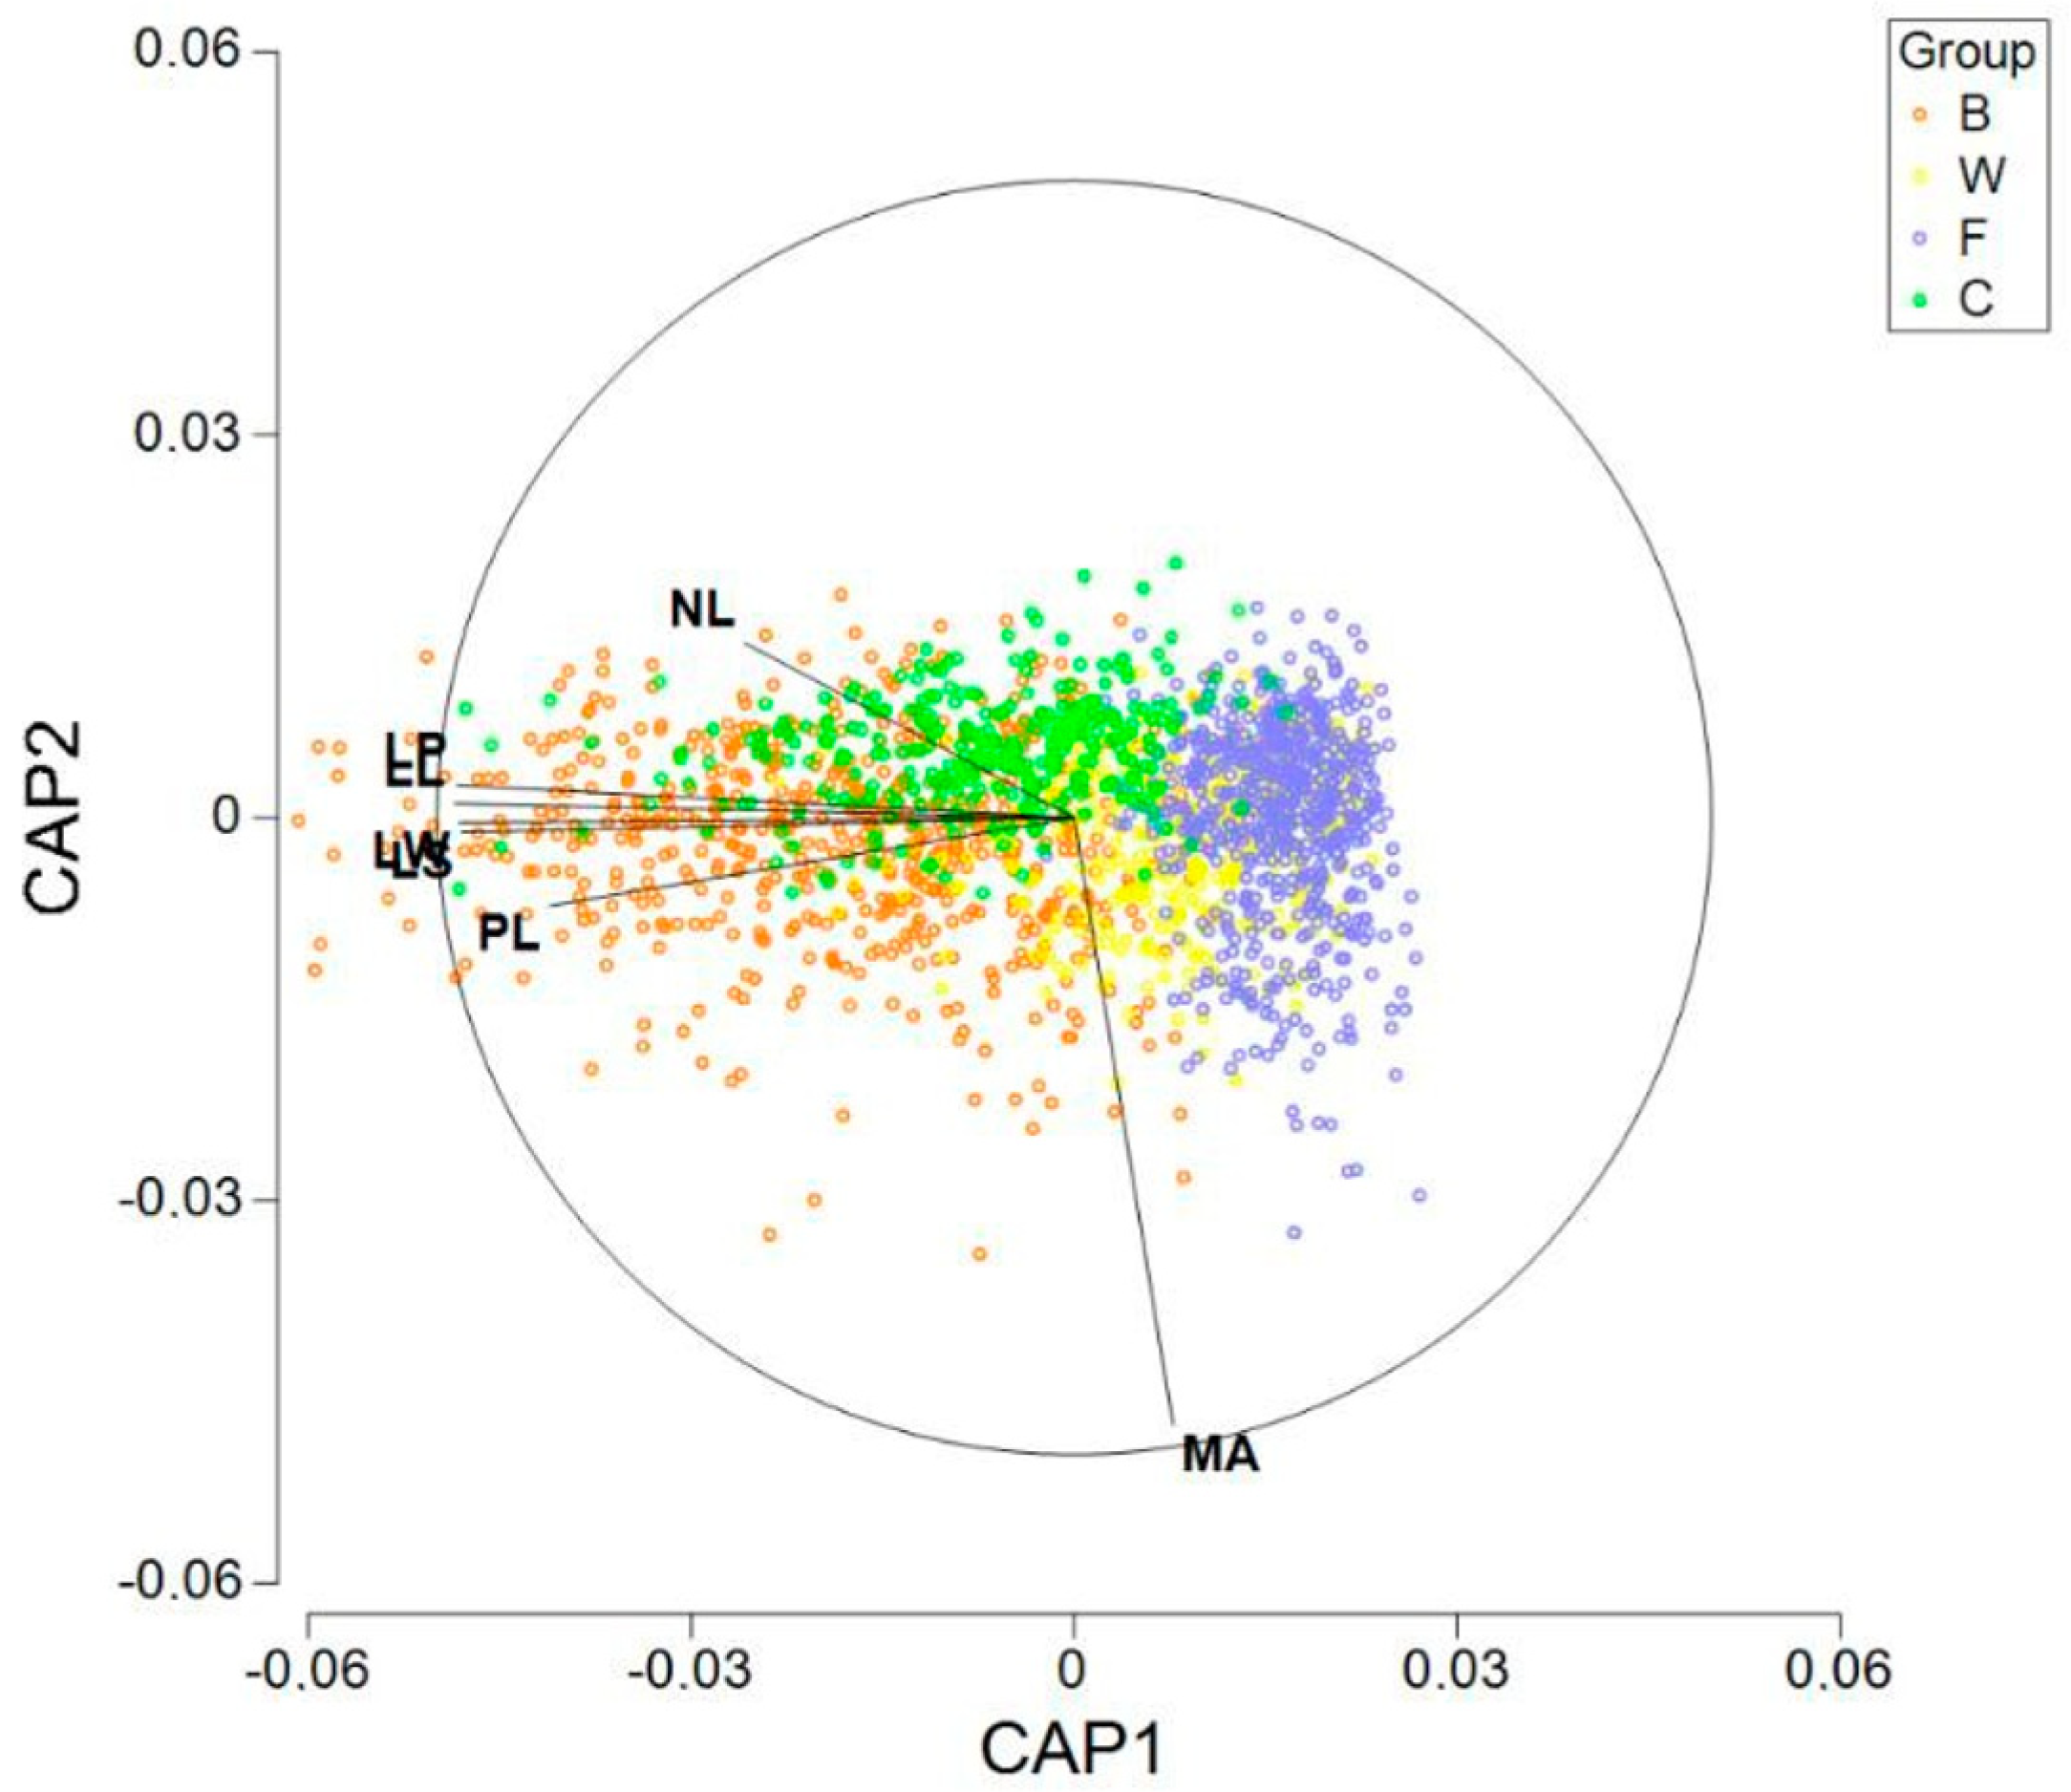
Figure 5. In addition, we performed a CAP (canonical analysis of principal coordinates). Previously, to execute the analysis, all the seven variables were normalized and the matrix of Euclidean distances between all samples was calculated. In
Figure 6, we can observe the results of plotting the two first axes (canonical variates). Besides the graphic, we calculated the distances between the centroids (
Table 4). From our calculations, the minimum distance was 0.997 between the centroids F and W. On the other hand, centroid C was the closest to centroid B, but the distance was 1.733.
Using the procedure SIMPER from PRIMER 7, the average squared distance between observations has been calculated and reported in
Table 5. This measure is an estimate of dispersion or variability within and between groups. Clearly, group B has the highest variability (the average squared distance within the group is equal to 6.39), while group F has the lowest dispersion (average of 2.03). It is remarkable that group W (average of 2.45) has less variability than group C (average of 3.33) and group B. On the other hand, observing the average square distances between groups, we can confirm that group F appears to be close to group W (the average square distance is 5.46), whereas group B is close to C (average of 12.71). Nevertheless, it is to be noted that the average square distance between groups W and C (average of 12.13) is less than 12.71, but this result is probably due to the high variability within group B.
With the aim to test for significant differences between the four groups, we performed another PERMANOVA design with three factors, but now completely nested: tree (stated as a random factor) is nested to the station, and the station is nested to the group (recall that now there are no shared stations between groups). The results show significant differences between groups (
p = 0.0001), between stations (
p = 0.0001) and, as was clearly expected, variability among trees (
p = 0.0001). Post hoc pairwise comparisons were also performed and the results revealed significant differences between all groups (
p = 0.0001 for all pairwise comparisons). In addition to these results, we executed the same PERMANOVA design for each one of the quantitative variables separately, confirming significant differences in all cases (so we reject the seven null hypothesis of no differences between groups;
p = 0.0001 in all cases) A summary of the significant pairwise comparisons for each single variable can be observed in
Table 6.
The SIMPER analysis reveals some additional results. Three variables (MA, NL and PL) jointly explain 76% of the square distances between W and F, the two closest groups. Nevertheless, no significant differences for MA was detected in the post hoc comparisons between W and F (very likely due to the high variability of this variable), so interpreting this variable must be carried out with caution. Perhaps the focus should be on LS, NL and PL when assessing the differences between W and F.
Recall that group B has shown the highest within-group variability, being in this way the most heterogeneous, and it appears to be closer to C than to the other groups. Despite this relative proximity, significant differences between B and C were detected for all the seven variables. The SIMPER results agree, showing that all variables have relevant contributions to the square distances between the two groups.
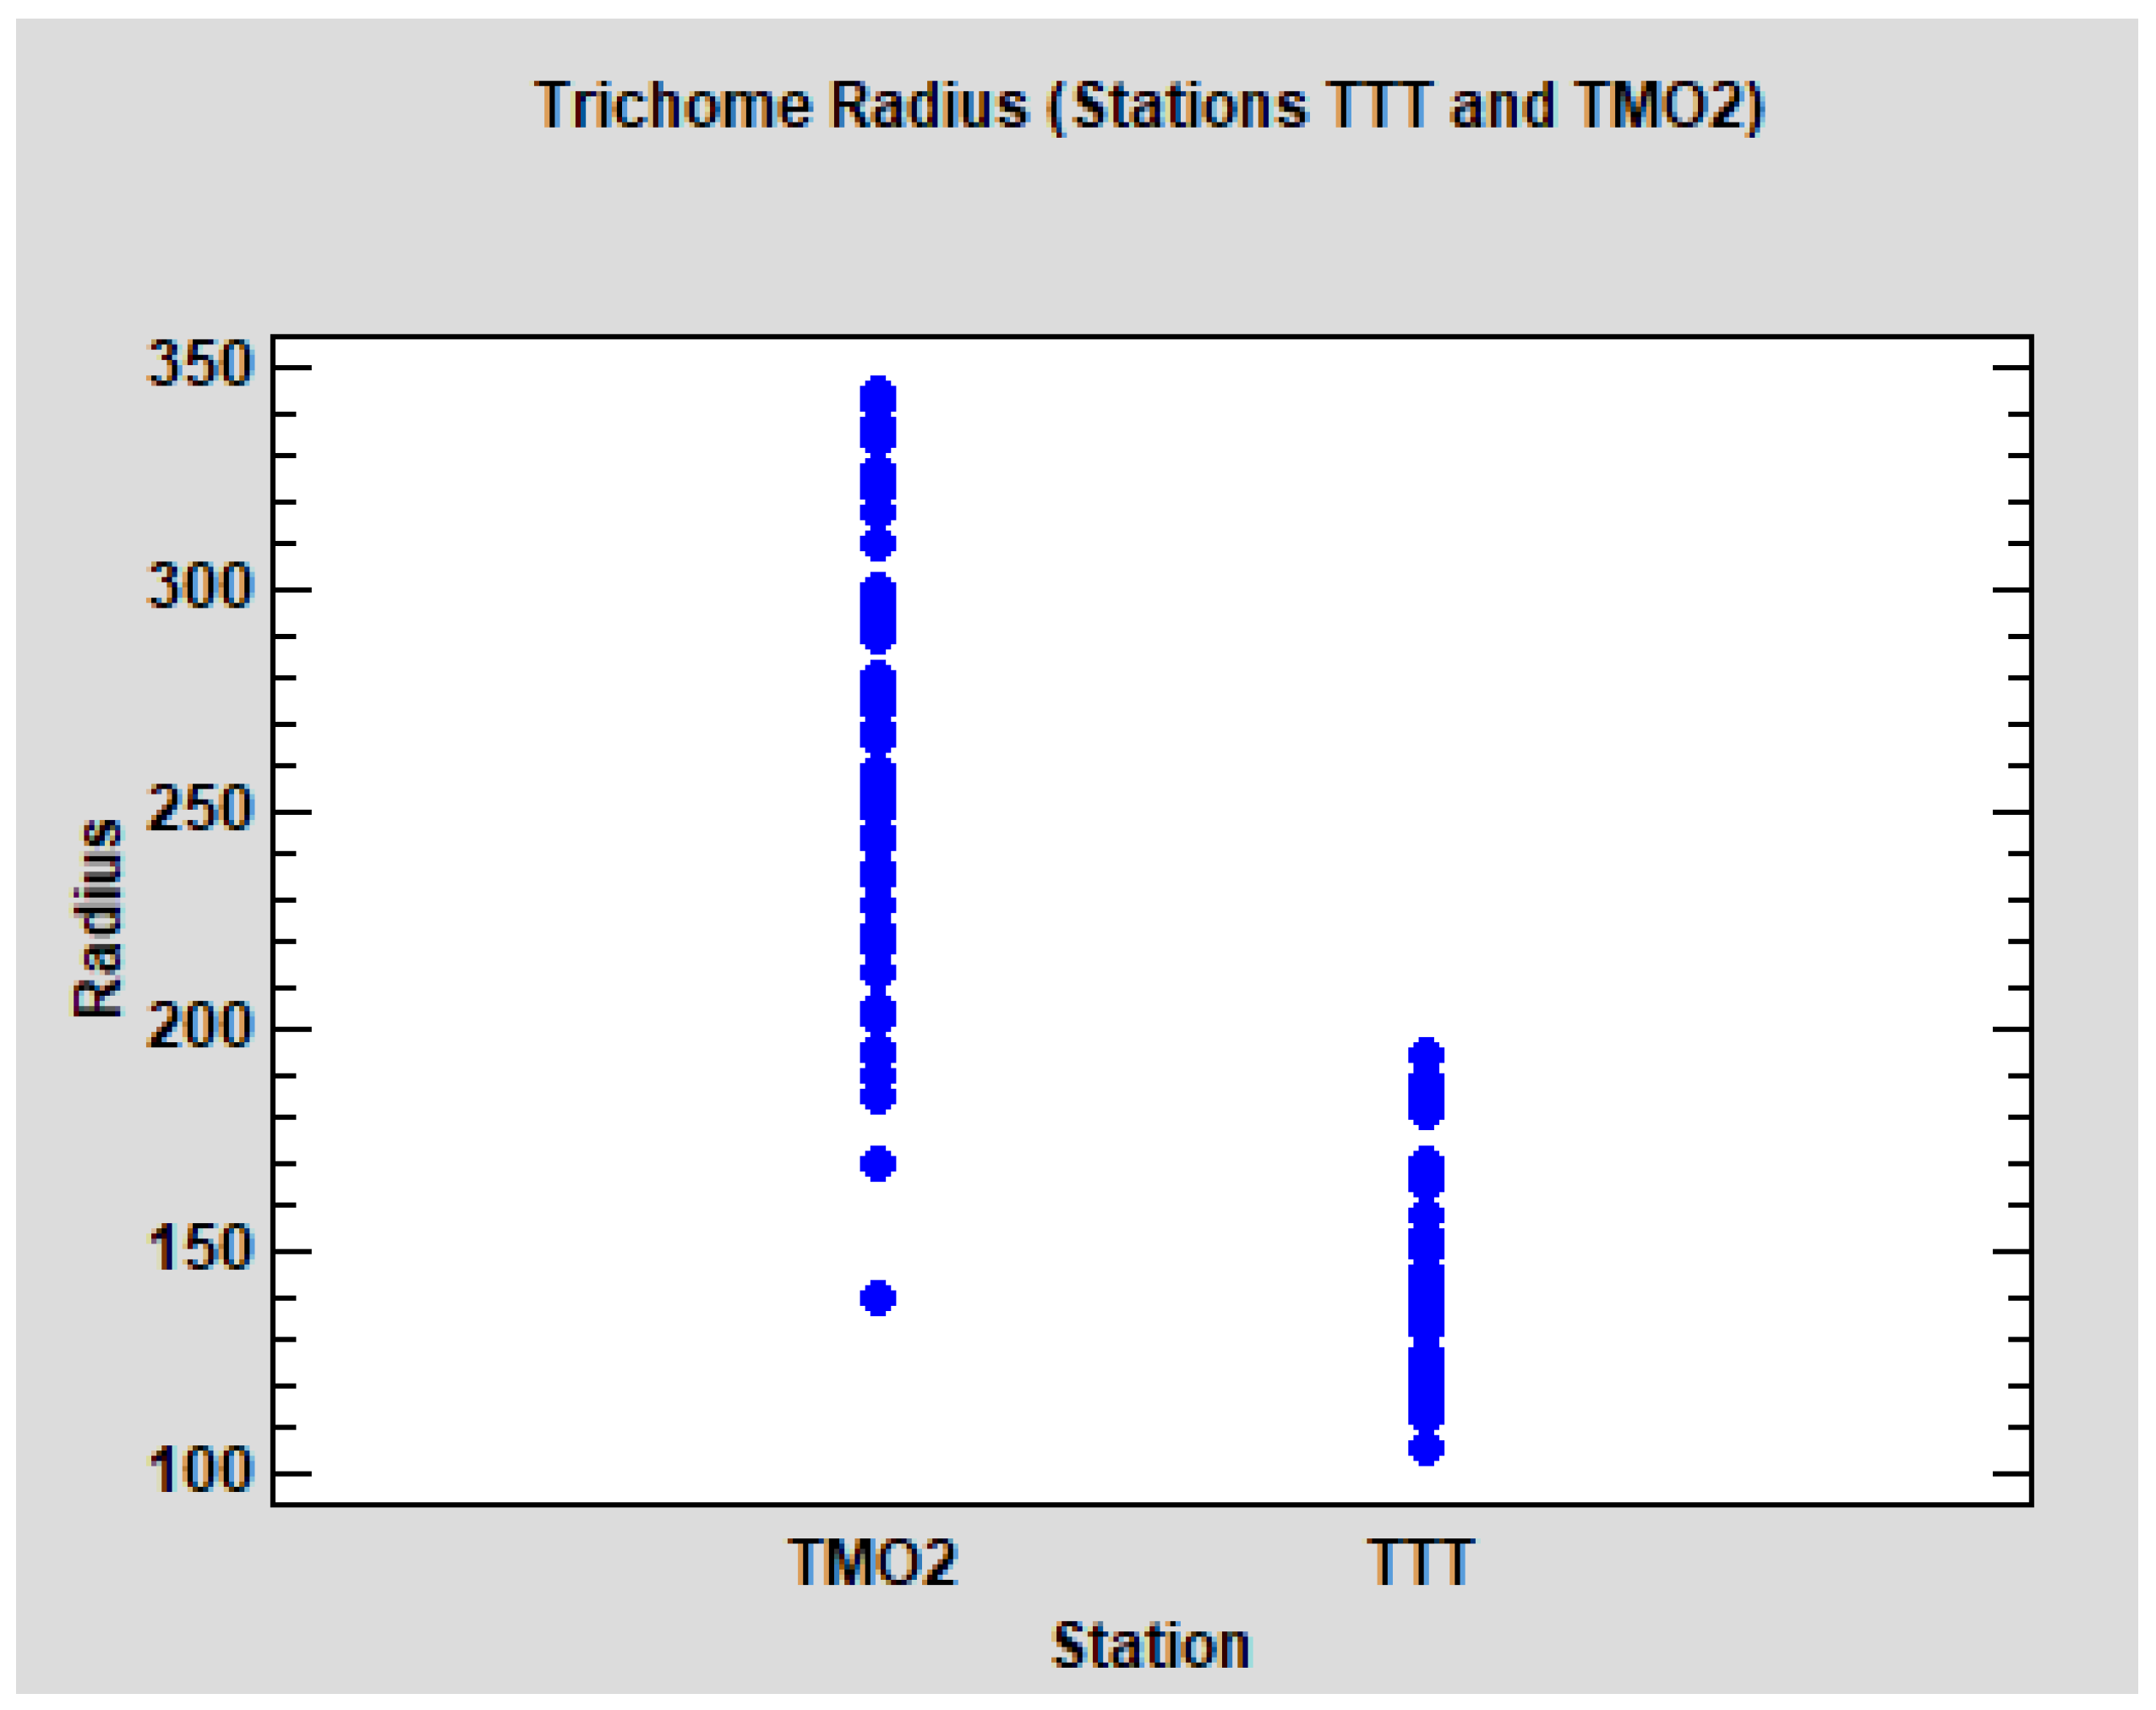
Concerning the analysis of the radius of the trichomes, we initially focused on the Algerian data. The descriptive results for all groups and stations can be observed in
Table 7. The differences between the stations TMO2 and TTT seem obvious, but not between groups WS and WD. To test this hypothesis, a three factor ANOVA model was performed: group (WS and WD), station (TMO2 and TTT) and tree, with the last stated as a random factor nested to the interaction between group and station. Group and station are crossed factors, and the interaction term was included in the model. The results are clear: no significant differences between WS and WD (
p = 0.4510), significant differences between TMO2 and TTT (
p < 0.0001), but no interaction detected (
p = 0.1929). As was expected, tree variability is significant (
p < 0.0001). The dot-plot (
Figure 7) shows the evident differences between the leaves of the two stations. It can be noted that the radius in TMO2 is higher, but also more variable. Due to the homoscedasticity condition of the ANOVA models, we performed separate models for each station (ANOVA nested design, tree nested to the group) No significant differences between groups WS and WD were detected in TMO2 (
p = 0.1934) neither in TTT (
p = 0.5322), so it seems reasonable that WS and WD can be pooled (group W).
On the other hand, we analyzed the trichome radius of
Quercus faginea in Catalonia (see the descriptive results in
Table 6). A nested design was devised(now tree is nested to station), and no significant differences between the stations were detected (
p = 0.1586), only variability among trees (
p < 0.0001).
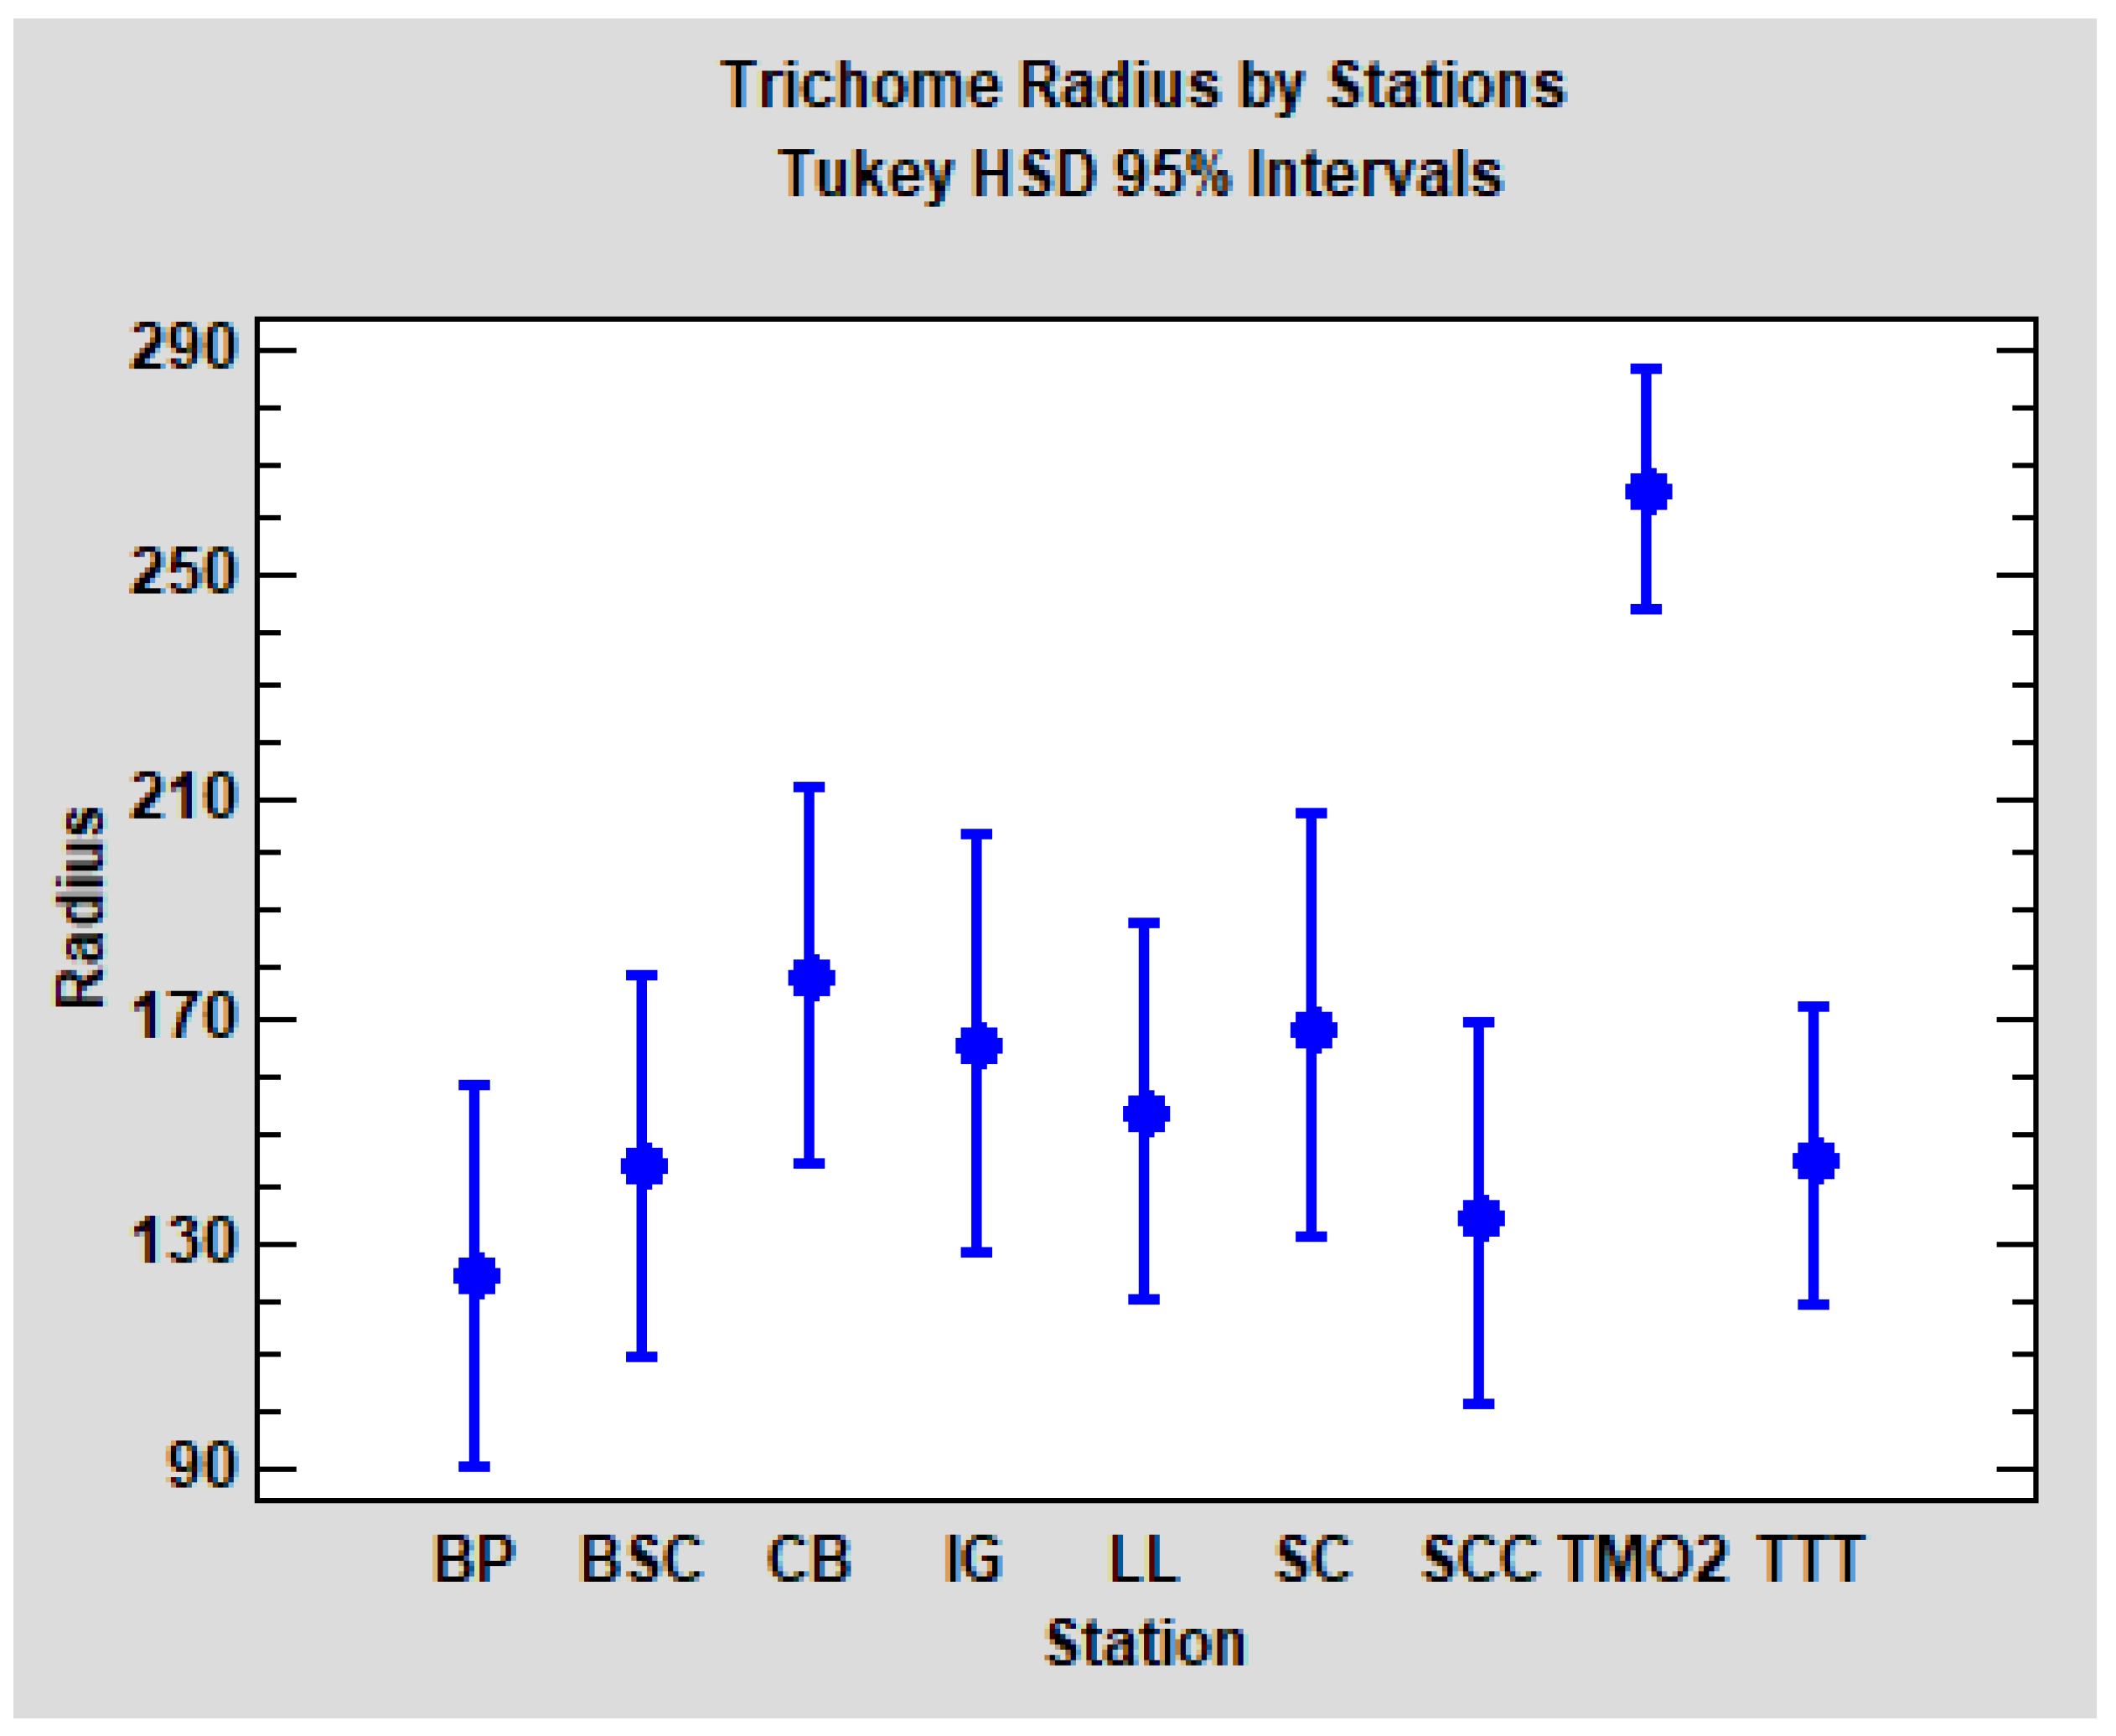
With the aim to compare the trichome radius of TMO2 and TTT with the stations from Catalonia, we reran the last ANOVA design (tree nested to station), this time including the Algerian stations. When we added TTT into the analysis, the result showed no significant differences between stations (
p = 0.1296). Finally, we reran the analysis, adding TTT and TMO2;a significant difference among stations was detected this time (
p < 0.0001). As could be expected, post hoc pairwise comparisons (Tukey HSD method, α = 5%) revealed that solely TMO2 is significantly different from the others (TTT and the seven Catalonian stations). Tukey HSD confidence intervals for each station are plotted in
Figure 8.
In summary, in relation to the radius of the trichomes, we found evident differences between the stations TMO2 and TTT, but no significant differences between the groups WS and WD. TTT seems to be comparable to Quercus faginea populations from Catalonia, but TMO2 is clearly differentiated.
4. Discussion
The identification of Quercus species at the specific level, both in the Iberian Peninsula and North Africa, has always been complex and challenging. The reasons for this lie in the plasticity of the trees as well as in the high level of hybridization of the neighboring species. In North Africa, this confusion is exacerbated because the vernacular name of all deciduous species is ‘Chëne Zéen’, also known as chêne zang, remarkable for its density in the forest. This effect increases the confusion regarding taxonomic identification, and sometimes contradictory published morphological names and descriptions from North Africa are observed. The consequence of all this has been that, in different monographies, botanists consider different classifications or taxonomies belonging to the Chêne Zéen denomination.
One of the first classifications of the North African
Quercus [
32] considered no less than six species of “Chêne Zéen”:
Q. faginea Lamk,
Q. mirbekki Durieu,
Q. alpestris Boiss,
Q. maroccana (Br.-Bl. and Maire) Villar,
Q. baetica (Weeb) Huguet and
Q. tlemcenensis (A.DC.) Trabut. In the same period, Camus [
33] distinguished three species:
Q. mirbeckii (with two varieties,
tlemcenensis and
maroccana),
Q. alpestris and
Q. faginea, and Quezel and Santa [
15] only a single species:
Q. faginea, with two subspecies (
bateica and
tlemcenensis). Later on, Quezel [
34], Achhal et al. [
35] and Benabid [
36] considered two valid taxa:
Q. canariensis Willd and
Q. faginea, and this was more or less the principal denomination of the species from Algeria named Chêne Zéen until the early 21st century. Nevertheless, Naima et al. [
27] incomprehensibly considered, again, the classification from Quezel and Santa [
15] from Algerian Chêne Zéen species. Concerning
Q. canariensis, a series of different names has been attributed to the species in the Iberian Peninsula and in North Africa. In the last revision [
23], the authors concluded that there exist a single species related to
Q. canariensis:
Q. canariensis s.l. When Villar [
28] described
Quercus nordafricana Villar, he relied on a group of materials distributed by different enclaves of North Africa, where there was evidence of the presence of
Q. canariensis Willd., usually called
Q. mirbeckii Durieu [
23,
26,
37].
Quercus nordafricana is identified as a specimens of
Q. canariensis Willd., with medium to small leaves, with short petioles, usually partially depilated when the leaves mature, with an ovate–lanceolate outline which can become oblong–lanceolate. Vázquez et al. [
23] considered this species a synonym of
Q. canariensis.
Quercus nordafricana is also related to the taxon
Q. salzmanniana (Webb) Coutinho, currently also synonymous with
Q. canariensis according to Vázquez et al. [
23]. However, these authors mentioned that
Q. nordafricana Villar and
Q. salzmaniana (Webb) Coutinho differ fundamentally in the presence of leaves with non-flocculous pubescence in the case of
Q. salzmaniana, with persistent short trichomes of less than 240 microns, against the leaves with flocculent trichomes of more than 300 microns, those non-persistent of
Q. nordafricana on the surface of the blade.
Quercus mirbeckii Dur., also called
Q. lusitanica var.
baetica Webb., is considered synonymous with
Q. canariensis by Vázquez et al. [
23]; it is characterized by presenting a drooping pubescence, but usually remains especially in the midrib, with medium-sized leaves with a crenate margin. On the other hand, multiple subspecies or varieties (such as
angustifolia,
brevipetiolata,
fagifolia,
microphylla,
subpedunculata and
typica) of
Q. Mirbeki have been described, none of which will be considered valid after Vázquez et al. [
23]. Overall,
Q. canariensis is considered as a single species with several varieties [
19], but our results do not support this possibility.
The statistical analysis shows the existence of two morphologically different populations of
Q. canariensis; one of them is found in the northeast of the peninsula (corresponding to the typical form of
Q. canariensis) and the other one in Algeria. Both populations have significant differences for all the seven quantitative variables (
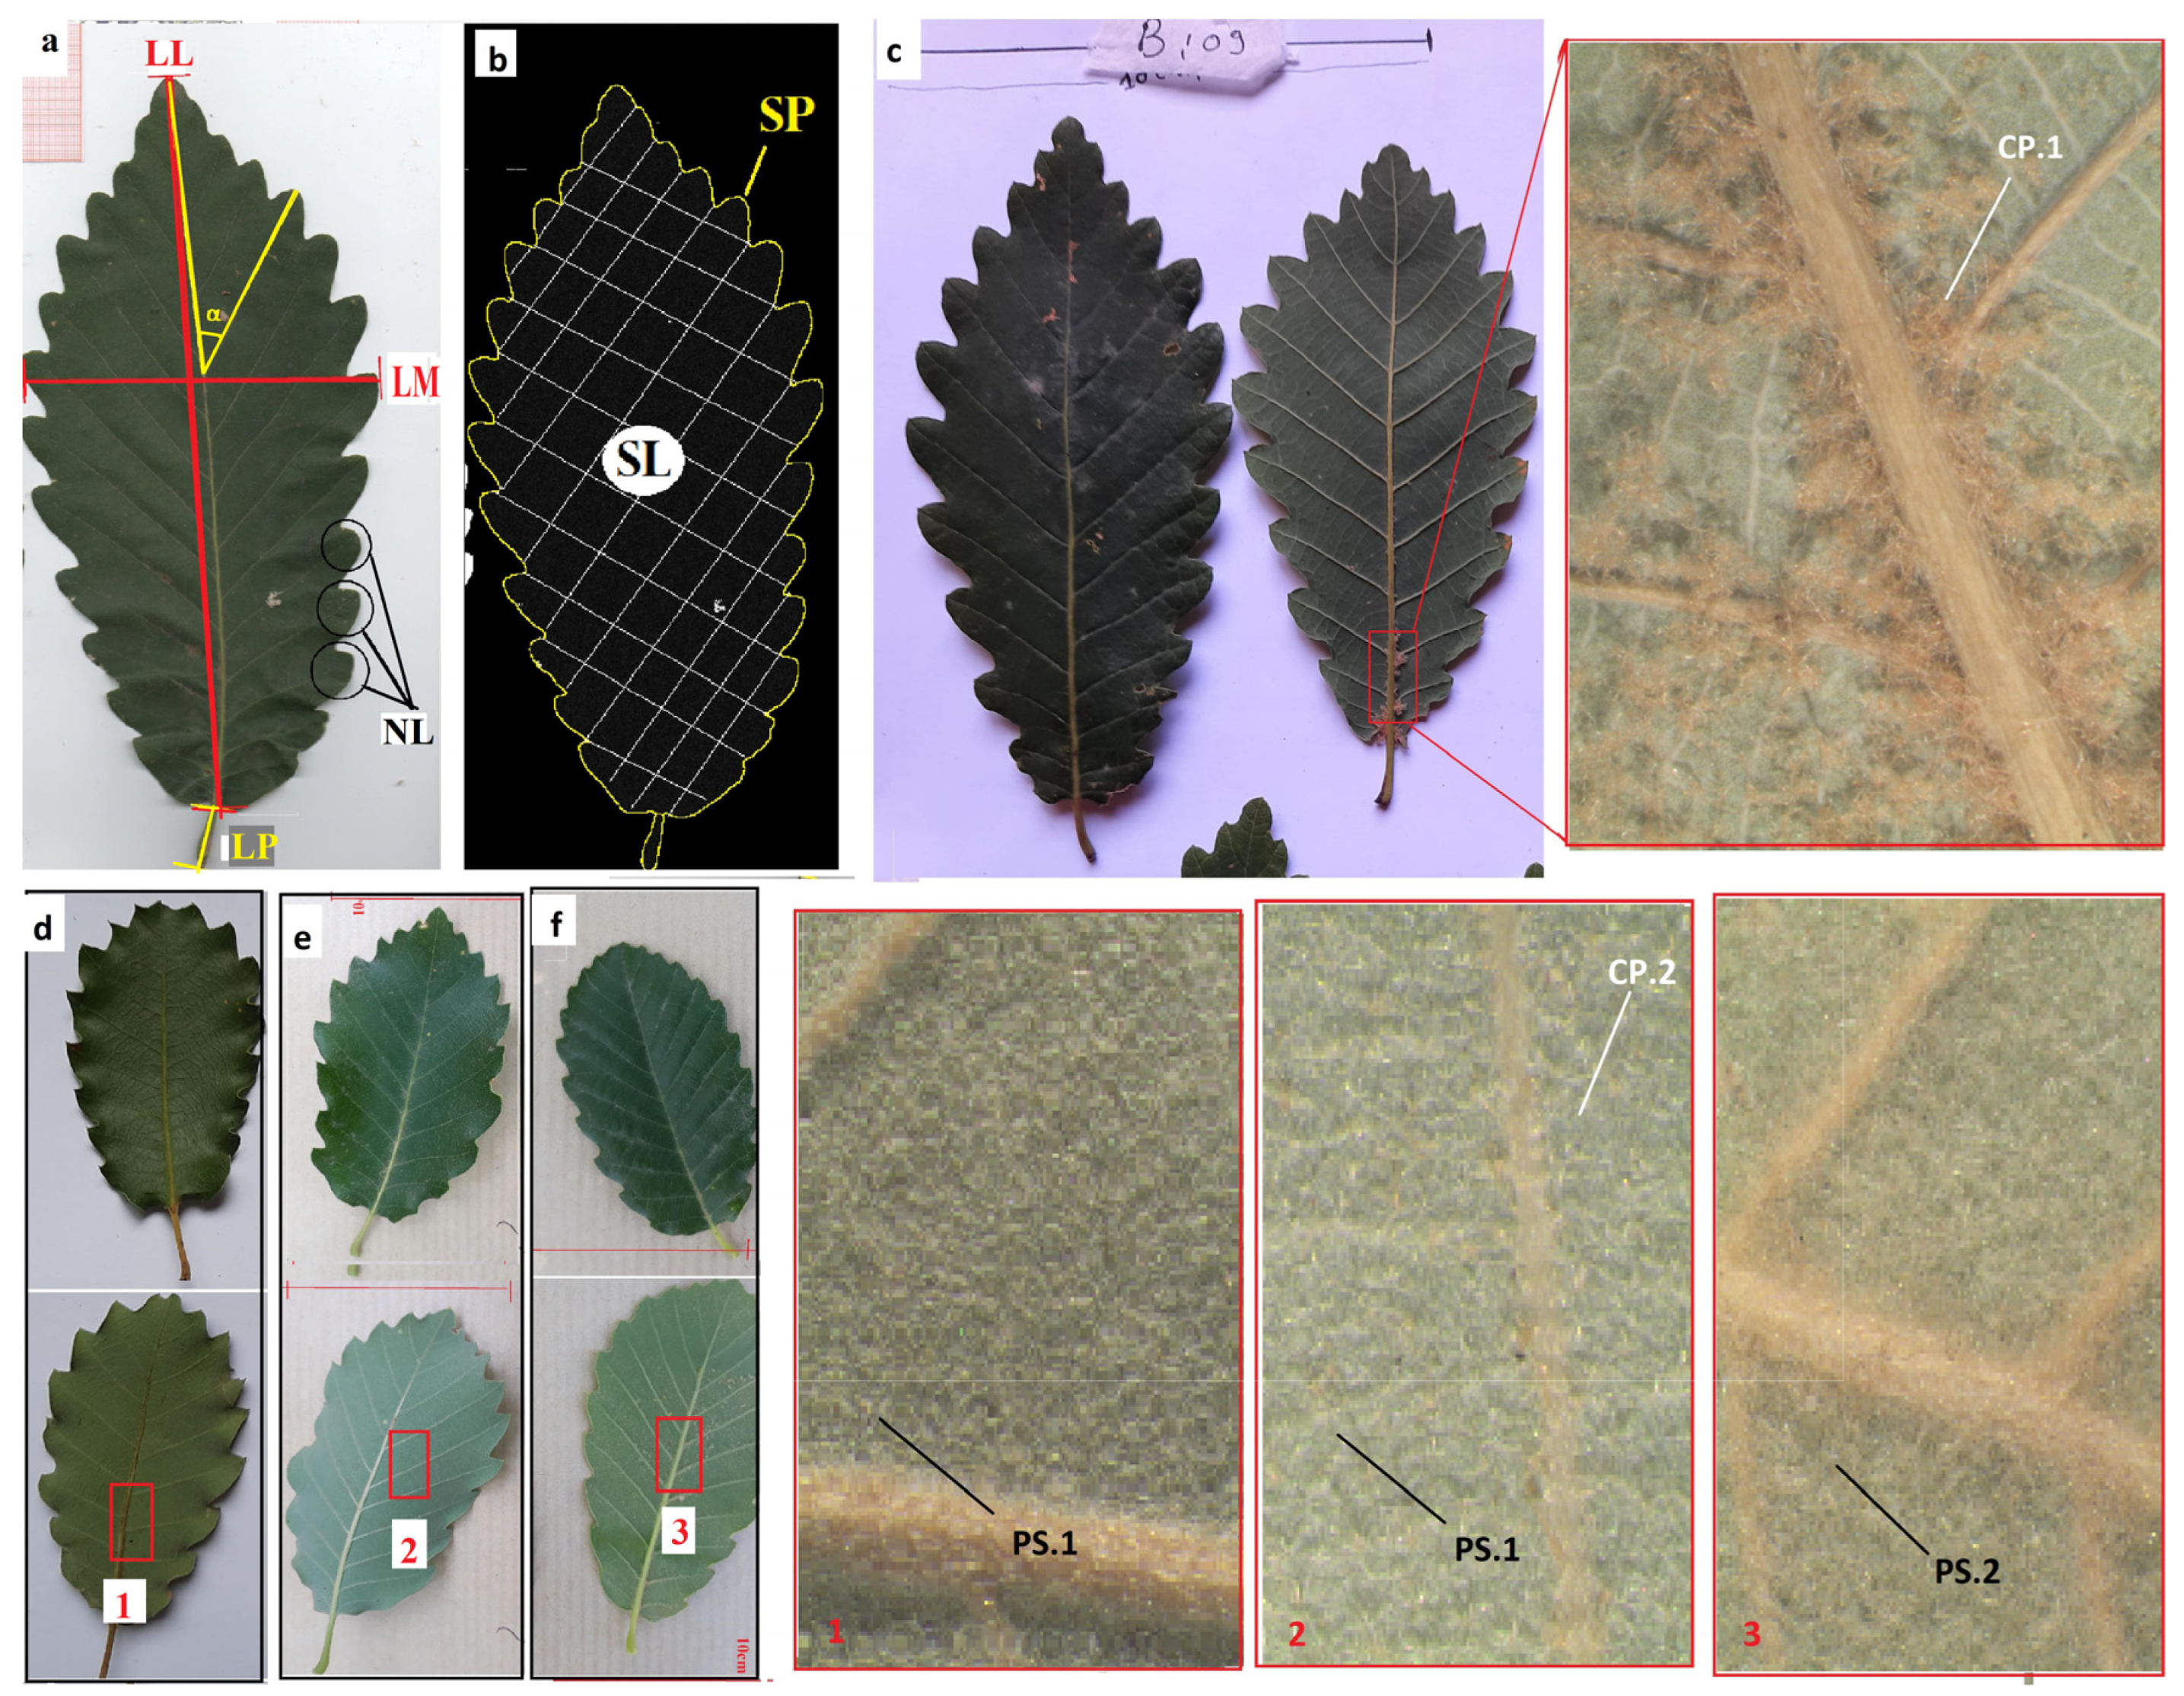
Table 6). Morphologically, both populations differ (
Figure 5). In terms of petiole length, it is less than 23.2 mm in Catalan populations but it reaches a length of up to 35.6 mm in Algerian populations; the shapes of the lobes are deeper and bigger in Catalan populations, and shallower and smaller in Algerian populations; leaves from Algerian populations can be bigger (up to 25 cm) than in Catalan populations (less than 19 cm); the angle of secondary nervation can also be bigger in Algerian populations (less than 50° in Catalan populations, but it could reach 72° in Algerian populations); something similar could be said about the width, surface and perimeter of the leaf. Concerning the pilosity, no difference has been observed in both populations; the trichomes are non-persistent, with 300–800 microns in length. According to all of this, we probably have two different species or varieties belonging to the
canariensis group and, in this sense, from Algeria,
mirbeckii may have to be considered as a valid name, because the Algerian specimens correspond morphologically to this denomination. This population cannot be
Q. nordafricana, because this species has short leaves and a short petiole (Vázquez et al. [
23]), and the studied Algerian population has large leaves and long petioles.
Concerning
Quercus faginea, it is a very plastic species, so the number of synonyms and combinations of species, subspecies and varieties has been huge [
19,
23,
24,
27].
In Algeria, Camus [
38] distinguishes different taxonomic series, where the
tlemcenensis, and
maroccana taxa are attached to
Quercus mirbeckii; this species,
Q. mirbeckii, is now a synonym of
Q. canariensis (see above). Later, Quezel and Santa [
15] consider two Algerian subspecies of
Q. faginea:
baetica and
tlemcenensis, and Babali et al. [
39] mentions that
Q. faginea would be represented in the Tlemcen Mountains (Algeria) by the subspecies
tlemcenensis, as the subspecies
broteroi is considered synonymous with
tlemcenensis.
Concerning the denominations mentioned, Vázquez and Coombes [
24] differentiated two taxa of the
faginea group:
Q. faginea (including the subspecies
faginea and
maroccana) and
Q. broteroi (with the subspecies
broteroi and
tlenceniensis). Nevertheless, Vázquez et al. [
23] concluded that
Q. tlemcenensis is a valid species (=
Q. faginea Lam. subsp.
broteroi (Coutinho) A. Camus =
Q. broteroi (Coutinho) [
25]) for taxonomical reasons (see Vázquez et al. [
23], for example). Recently, Aissi et al. [
5] reported two
faginea subspecies from Morocco (
faginea and
maroccana) and another from Algeria (
broteroi), but there is no doubt that the
broteroi from Aissi et al. [
5] corresponds to
Q. tlemcenensis from Vázquez et al. [
23].
Finally, according to Vázquez et al. [
23],
Q. faginea subsp.
maroccana is considered a valid subspecies; however, it may also has to be considered as a hybrid between
Q. canariensis and
Q. tlemcenensis (=
Q. x
maroccana Villar 1943). In the Algerian “
Q. faginea” group,
Q. tlemcenensis is mentioned as single species. The differences are mentioned in Vázquez and Coombes [
24]. Nevertheless, Vázquez et al. [
23] found that the most notable characteristics to discriminate this taxon from the rest of the
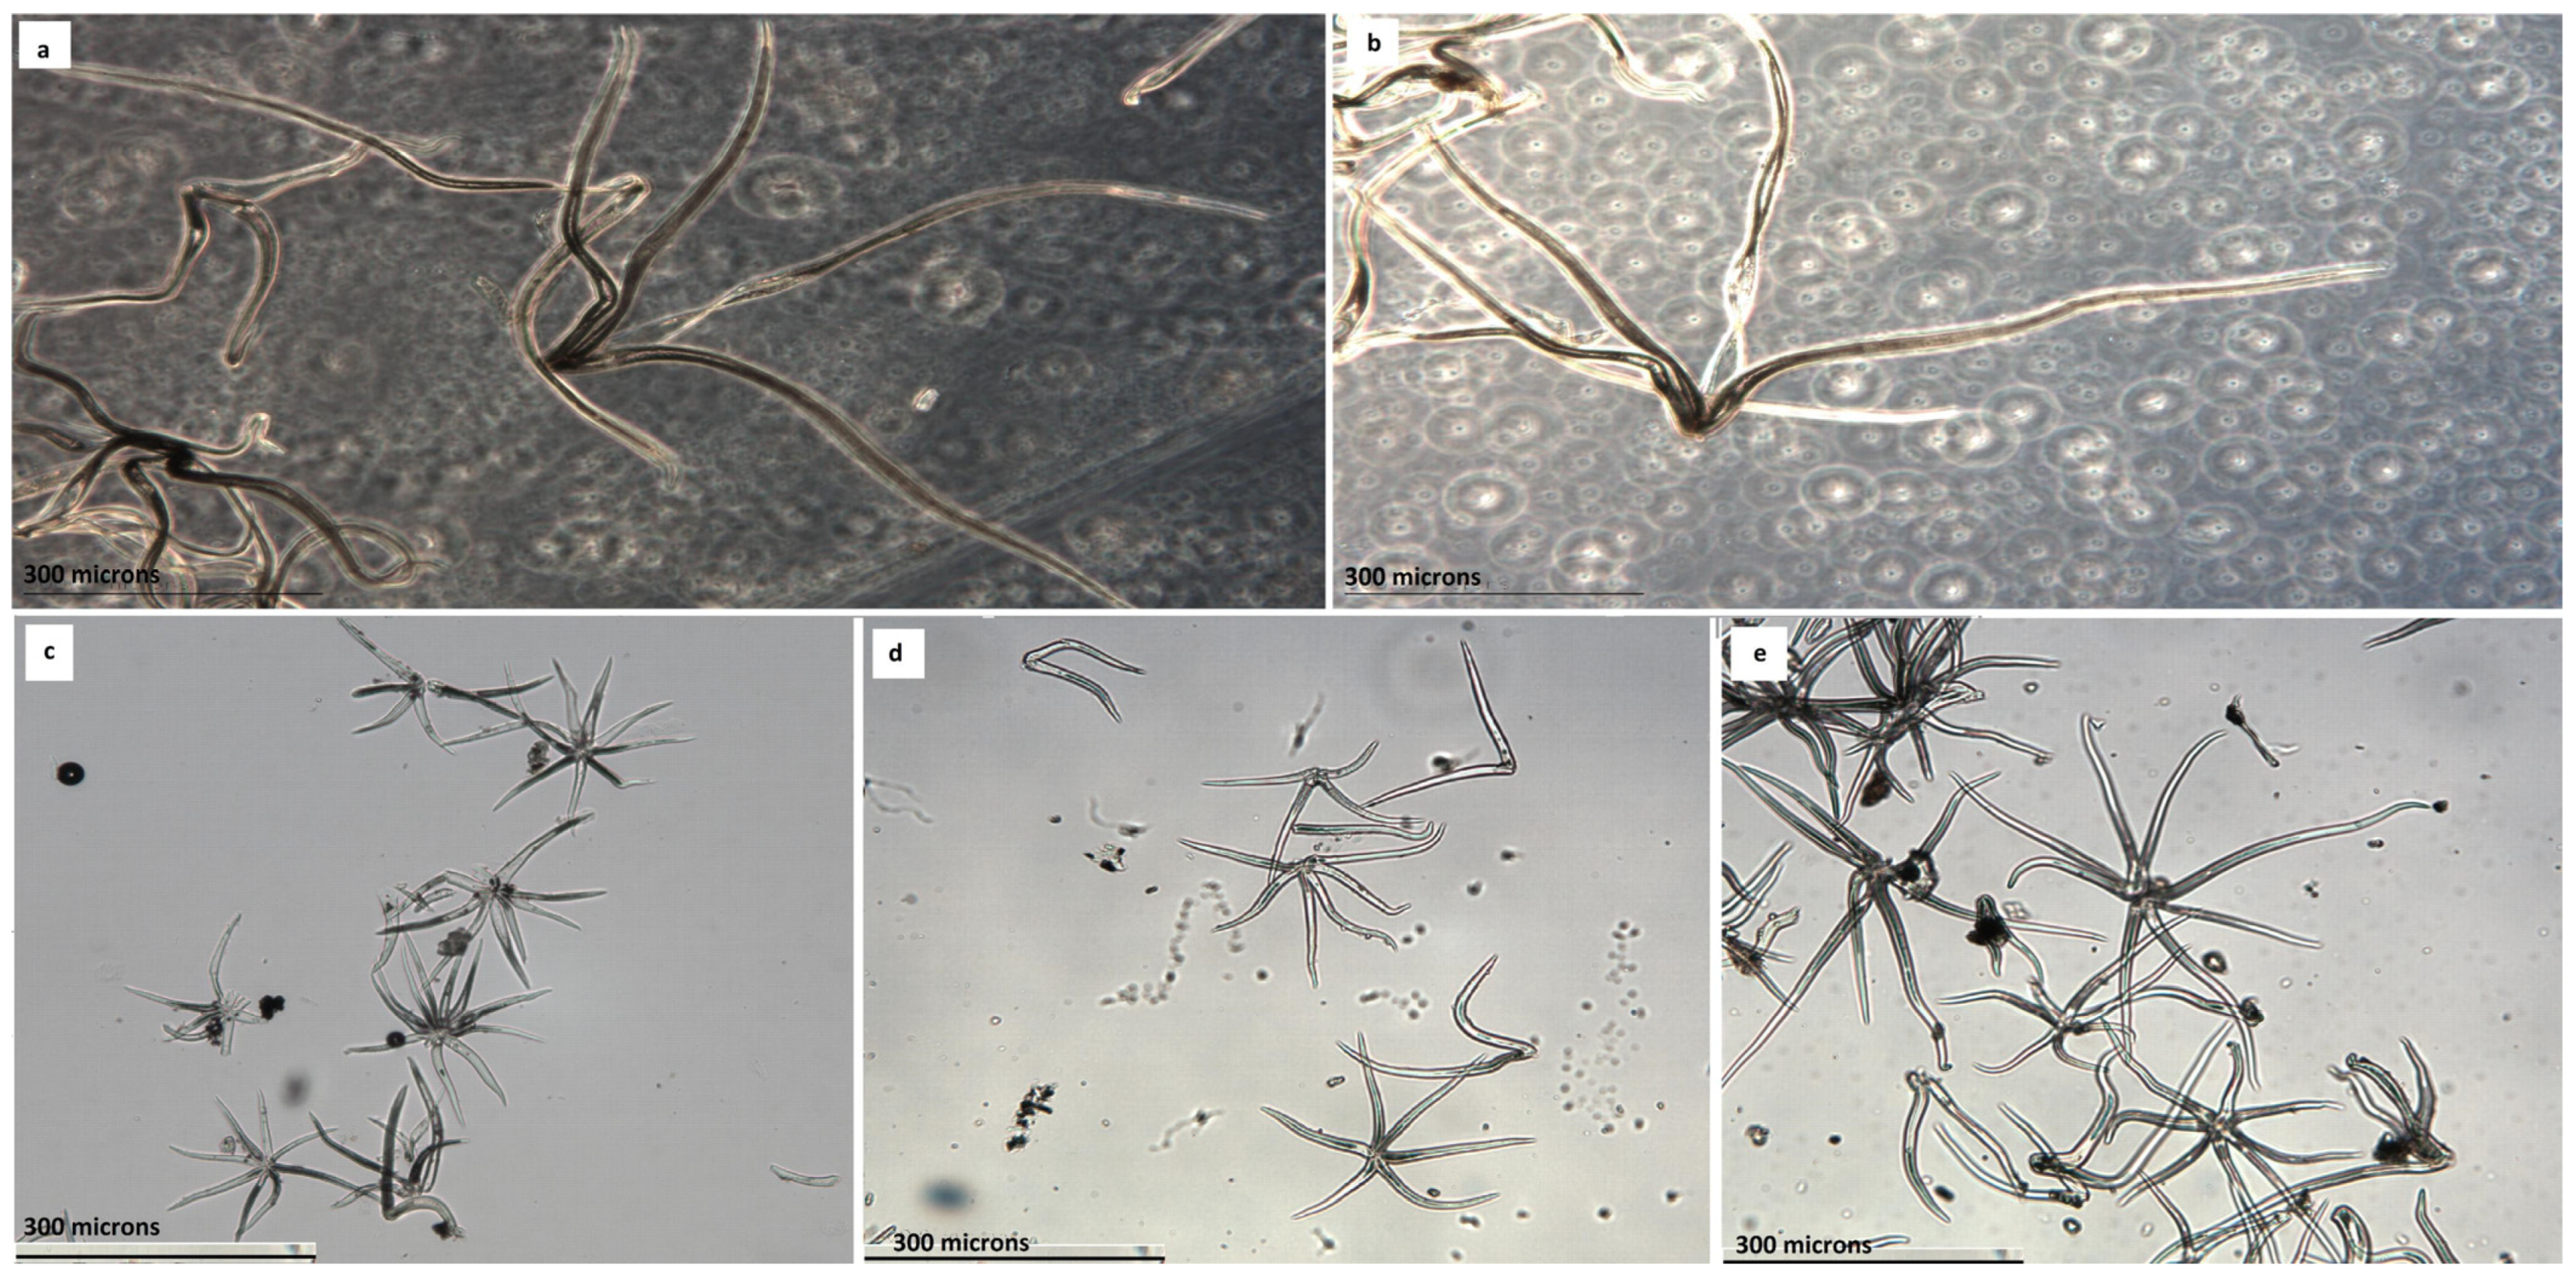
Q. faginea s.l. group are not the dimensions of its leaves, the morphology of the blade or its margin, but the dimensions and typology of the foliar trichomes that are deposited in greater or lesser intensity on the underside of the lamina, since they are multi-starred, mixed with starlets and pedicels, with rays that exceed 200 microns. Berrichi and Bouazzaoui [
40], studying the dendrometry of
Q. faginea from Moutas (Themcen), concluded that the leaves collected from the southern trees have the lowest vegetative values, while the leaves collected from eastern trees have large leaves with developed vegetative characteristics. These results confirm the plasticity of
Q. faginea, and this poses challenges to historically recognizing the Algerian populations.
According to our results, the differences in the distribution of hairiness (dense vs. sparse) in the Algerian populations of Q. faginea s.l. are not significant in the examined samples (WS and WD); the PERMANOVA results between the WS and WD groups confirm this hypothesis (p = 0.7724), as well as the PERMANOVA design for each of the quantitative variables separately. Therefore, since no significant difference was found, we can accept that the WS and WD groups are the same.
In addition, our study shows the existence of two different Algerian populations of
Q. faginea s.l.: one with a typology which statistically coincides with the population of Catalonia (
Q. faginea ssp
faginea), and another similar to the
Q. themcenensis concept. According to Vázquez et al. [
23] the principal characteristic for recognizing
Q. tlemcenensis is the length of the pilosity: the multi-stellate leaf trichomes have rays of (180) 210–350(420) microns in
Q. themcenensis and shorter in
Q. faginea ssp
faginea, which have rays of (160) 180–250 (280) microns. In our study, the trichomes of the examined
Q. themcelensis can be a little longer (can reach almost 470 microns) and for the examined
Q. faginea population, the rays are often less than 200 microns in length, but they can reach almost 300 microns; these values agree with the definition of
Q. faginea ssp
faginea and
Q. tlemcenensis reported by Vázquez et al. [
23]. In addition, the TTT (
Q. faginea ssp
faginea) and TMO2 (
Q. themcenensis) populations statistically have almost the same foliar characters (no significant statistical differences detected;
Figure 7 and
Figure 8) and this also concurs with the conclusions of Vázquez et al. [
23] about these species. Nevertheless, the results by Amaral Franco [
21] concerning the foliar pubescence, and Tschan and Denk [
41] concluded that this characteristic seems insufficient in itself to differentiate populations, due to the superposition of values between the two Algerian populations studied by Amaral Franco [
21], an aspect that does not agree with our results (
Figure 7), where the supposition is really minimal. The reason for this is that Amaral Franco included hybrids forms in his study.
In summary, in Algeria we have a single
Q. canariensis population, which is different from the Iberian population examined. It corresponds morphologically probably to
Q. mirbeckii, which is currently considered a synonym of
Q. canariensis. For the
faginea group, we have two Algerian populations,
Q. faginea spp
faginea and
Q. tlemcenensis, as reported by Vázquez et al. [
23]. Our results do not completely harmonize with the current knowledge from Algeria [
5,
23]; therefore, a phylogenetic study would be required to clarify the borderline populations of
Q. canariensis and
Q. faginea in North Africa, as well as new sampling in other North African areas for a new data analysis.


 and
and 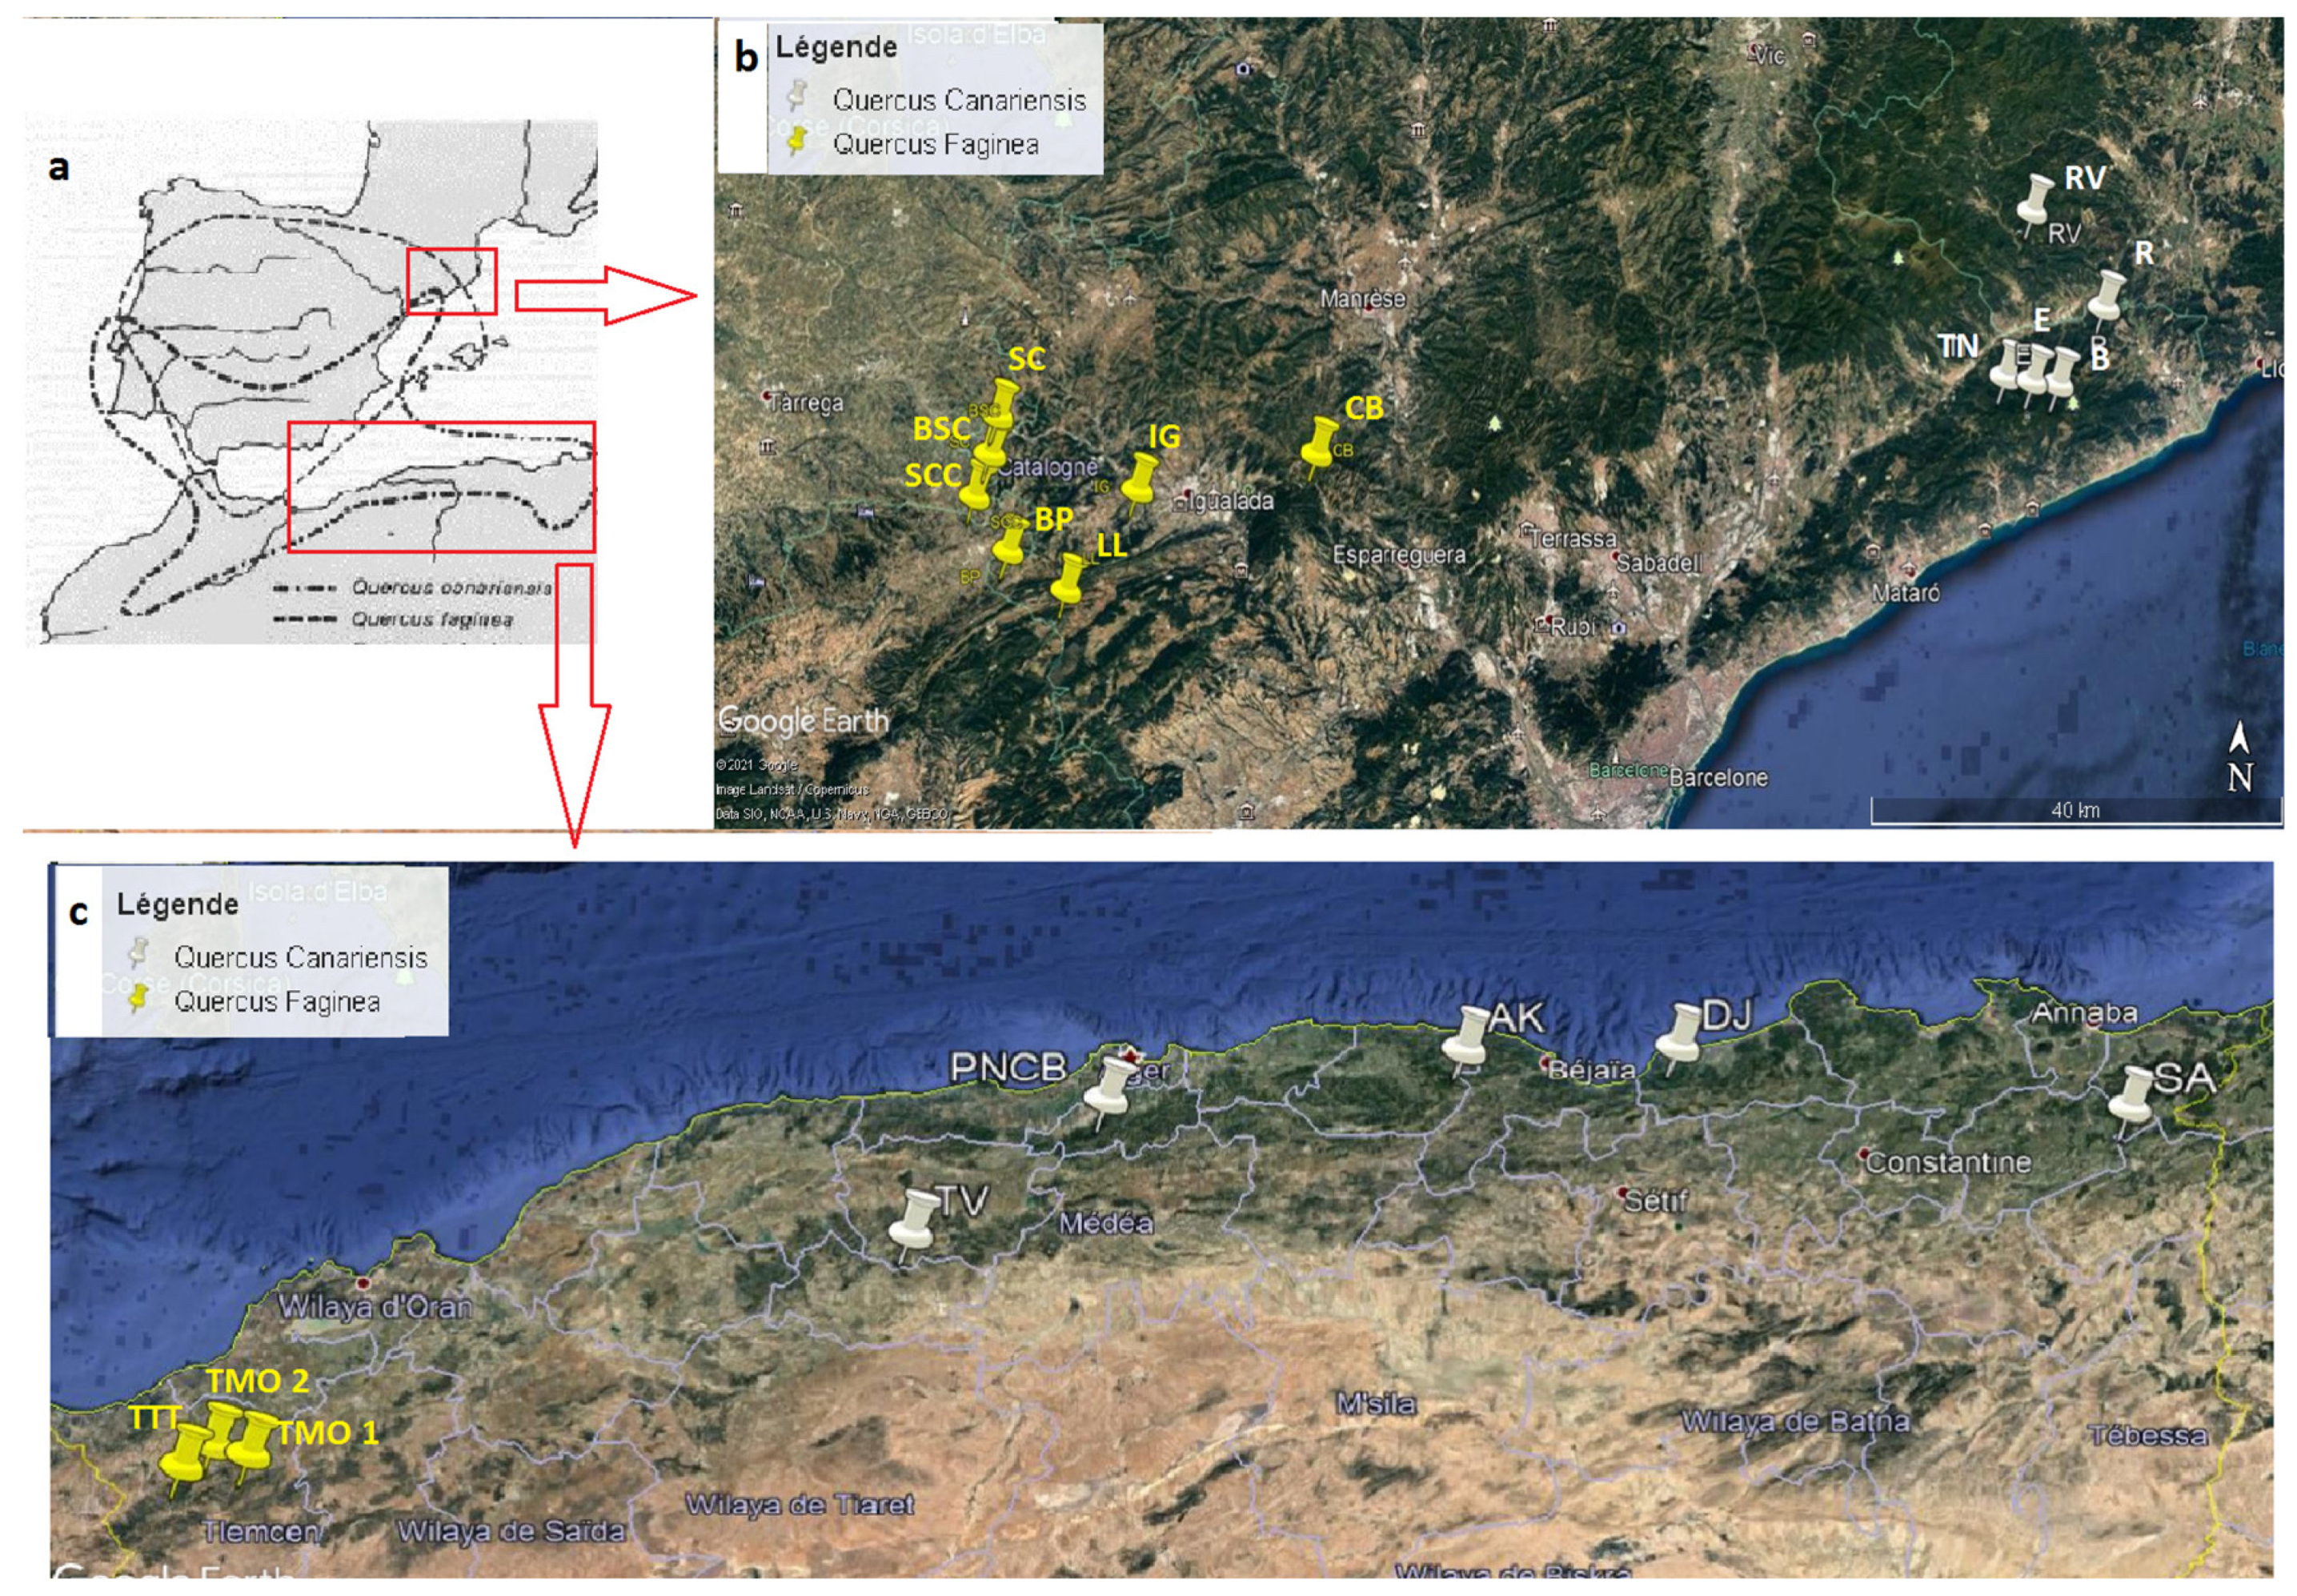


