Article

Regional Variability in Growth and Leaf Functional Traits of Mitragyna speciosa in Thailand

by
Suthaporn Chongdi
1,
Suwimon Uthairatsamee
1,
Chatchai Ngernsaengsaruay
2,
Tushar Andriyas
3 and
Nisa Leksungnoen
1,4,*
1
Department of Forest Biology, Faculty of Forestry, Kasetsart University, 50 Ngamwongwan Rd, Lat Yao, Bangkok 10900, Thailand
2
Department of Botany, Faculty of Science, Kasetsart University, 50 Ngamwongwan Rd, Lat Yao, Bangkok 10900, Thailand
3
Department of Food and Pharmaceutical Chemistry, Faculty of Pharmaceutical Sciences, Chulalongkorn University, 254 Phayathai Rd, Pathumwan, Bangkok 10330, Thailand
4
Center for Advance Studies in Tropical Natural Resources, National Research University—Kasetsart University, 50 Ngamwongwan Rd, Lat Yao, Bangkok 10900, Thailand
*
Author to whom correspondence should be addressed.
Int. J. Plant Biol. 2025, 16(1), 24; https://doi.org/10.3390/ijpb16010024
Submission received: 16 December 2024 / Revised: 13 February 2025 / Accepted: 18 February 2025 / Published: 20 February 2025
(This article belongs to the Section Plant Physiology)

Abstract

:
Kratom (Mitragyna speciosa (Korth.) Havil.) is a tropical evergreen species native to Southeast Asia, widely recognized for its medicinal properties. Recent legal changes in Thailand permitting its cultivation and commercial use have increased interest in understanding the optimal conditions for its growth, particularly in regions beyond its native southern habitat. This study examined the leaf functional traits associated with kratom’s growth in the southern (native habitat), central, and northeastern regions of Thailand. Species adaptation was determined by analyzing variations in leaf functional traits across different environments. The results showed that the specific leaf area (SLA), leaf thickness, chlorophyll content (SPAD), and stomatal density (SD) did not exhibit any significant regional variations. However, the leaf pH, performance index (PI), and quantum yield (Fv/Fm) differed significantly across regions. The northeastern region had higher leaf pH and lower photosynthetic efficiency compared to the southern and central regions. Non-Metric Multidimensional Scaling (NMDS) ordination indicated that environmental factors such as elevation, light intensity, temperature, and soil water content significantly influenced leaf trait variability in the northeastern region. These findings demonstrate kratom’s ability to grow under diverse environmental conditions, potentially indicative of cultivation beyond its native range.

1. Introduction

Kratom (Mitragyna speciosa (Korth.) Havil.) is a tropical evergreen tree species from the Rubiaceae family, native to Southeast Asia, primarily found in Thailand, Malaysia, Indonesia, the Philippines, and Papua New Guinea [1]. The species thrives in moist environments, typically near streams and swamps, in both natural forests and residential areas [2]. It is found mostly in the southern part of Thailand [3], which is considered its native habitat. It grows to heights ranging from 5 to 33 m and is characterized by grey to greenish brown bark, elliptic to ovate leaves, and fragrant, many-flowered inflorescences [3,4]. It was classified as a Category 5 narcotic under the Narcotics Act B.E. 2522 (1979) until August 2021, when it was removed from the narcotic list, and has since been classified as a medicinal plant. It is reported to have several secondary metabolites that have analgesic, antidiarrheal, antidiabetic, and antipyretic effects and have also found usage in treating gastrointestinal ailments [5,6,7]. In the rural parts of Southeast Asia, fresh leaves of kratom are consumed by laborers and farmers to boost energy, alleviate fatigue, and improve endurance for working long hours under direct sunlight [8,9,10,11]. The legalization of its cultivation, consumption, storage, and commercial trade has sparked renewed interest in its agricultural and economic potential [12]. The resulting increase in demand for kratom leaves among growers, sellers, and consumers has driven efforts to maximize yields, including kratom cultivation in various parts of Thailand [13]. However, variations in environmental conditions, such as temperature, humidity, soil composition, light, and water availability, can significantly influence the morphological and physiological traits of kratom, influencing its growth, leaf health, and alkaloid production. Studies indicate that high temperatures, appropriate humidity, well-drained soils, and sufficient water availability are critical for maximizing kratom yield and alkaloid accumulation [14,15].
Kratom growth has been reported to be significantly affected by light intensity and the spectral composition. Zhang et al. [16] demonstrated that higher radiance levels can enhance the growth and production of phytoactive alkaloids in kratom. In general, the leaves of naturally growing species exhibit distinct sun- or shade-associated leaf traits [17]. Sunlit leaves are typically smaller and thicker and have a higher leaf dry mass per surface area, as well as a greater stomatal density, compared to shade leaves [18,19]. Additionally, sunlit leaves tend to have higher photosynthetic rates and total nitrogen contents but lower chlorophyll concentrations [17]. The wild populations of kratom thrive in the understory of dense equatorial rainforests where the presence of competition from surrounding vegetation may promote shade-avoidance traits such as increased leaf areas and chlorophyll concentrations [20].
Leaf functional traits serve as indicators of a plant’s growth potential and its ability to adapt to environmental changes [21]. Understanding the key traits in kratom, such as its specific leaf area (SLA), leaf thickness, chlorophyll content, chlorophyll efficiency, and stomatal density, is essential to assessing its growth under various environmental conditions [21,22]. Zhang et al. [16] reported significantly higher SLAs and chlorophyll contents in kratom seedlings under shade, suggesting an optimization of light capture and enhanced photosynthetic efficiency. In the tropical deciduous forests of the Vindhyachal Highlands, India, Chaturvedi and Raghubanshi [23] reported a higher SLA in the wetter climates compared to drier sites for a related species, M. parvifolia. Similarly, Torres-Leite et al. [24] investigated the leaf traits of nine Rubiaceae species growing in the understory of a tropical forest and found that the SLA was the highest in valleys, where light availability was the lowest, which may have enhanced the light capture efficiency and photosynthetic capacity. Conversely, a higher leaf thickness was reported for trees growing in abundant light and with limited water availability [25,26]. Kratom cultivation in Thailand remains underexplored due to 41 years of legal restrictions [13], limiting the available knowledge on its optimal growth conditions. Successful cultivation requires an understanding of its survival, adaptability to diverse environmental conditions, and growth performance beyond its native habitat.
Therefore, this study focused on the growth-related leaf functional traits of kratom in two non-native regions of Thailand. This included the central and northeastern regions, where leaf traits were compared to those of trees in the native southern region. The aims of this study were to investigate the variations in kratom leaf traits as an adaptive response to different environmental conditions, so as to help farmers select suitable planting sites for optimal growth and leaf yield.

2. Materials and Methods

2.1. Study Sites

Five kratom trees were randomly selected from the southern (S), central (C), and northeastern (NE) regions of Thailand (see Supplementary File). Multiyear climate data, obtained for each region from the Department of Meteorology, Ministry of Digital Economy and Society (DEDE), and the Department of Alternative Energy Development and Efficiency, Ministry of Energy, Bangkok, Thailand (TMD), were averaged over a 30-year period (1991–2020) (Table 1). The S region (Ranong Province) is closer to the Andaman Sea and is located at an average elevation of 20 m. It is characterized by mountainous terrain and a tropical monsoon climate [27]. It experiences the highest annual rainfall compared to the other regions, with high humidity and light intensity similar to that of the C region. The C region (Ayutthaya Province) is situated on the lowland floodplains of the Chao Phraya River at an average elevation of 6.5 m and receives relatively less rainfall. The extensive floodplains and proximity to rivers contribute to the region’s soil fertility [28]. The NE region (Mukdahan Province) features mountainous terrain interspersed with forest-covered plateaus and lowlands in the central and northeastern parts of the province. It has an average elevation of 315 m [29] and relatively lower humidity and light intensity (Table 1).

2.2. Soil Conditions

Soil parameters, including the volumetric water content (VW), bulk density (BD), and porosity, were determined using the undisturbed soil method with soil core samples (5.7 cm in diameter) (Soilmoisture Equipment Corp., Goleta, CA, USA) from the root zones of the sampled trees at depths of 30–45 cm [30]. These samples were wrapped in plastic bags to retain their soil moisture and oven-dried at 80 °C for two days. For each sampled tree, three soil replicates were collected.
The VW was determined as a percentage according to the following equation [31]:
VW (%) = (water volume/total soil volume) × 100,
where water volume is the amount of water in the soil sample, determined as the difference between the wet and dry weights, with total soil volume being the volume of the soil core.
BD was measured according to the following equation [32]:
BD (g cm−3) = (soil dry mass/total soil volume),
where soil dry mass is the mass of the oven-dried soil.
Porosity was determined using the following equation [33]:
Porosity (%) = (1 − (BD/soil particle density)) × 100,
where soil particle density is the density of the soil particles (2.65 g cm−3).
Soil chemical parameters were determined using the disturbed soil method with three replicates. The soil pH was analyzed using the 1:1 ratio method, following Sparks et al. [34]. Organic matter (OM) was determined using the method by Walkley [35], which estimates the OM content based on the oxidation of organic carbon. The total carbon (C) and nitrogen (N) contents were analyzed using the dry combustion method, following Sparks et al. [34]. The available phosphorus (P), exchangeable potassium (K), exchangeable calcium (Ca), and exchangeable magnesium (Mg) were measured using Atomic Absorption and Flame Emission Spectrometry (AAS-Flame), following Sparks et al. [34].

2.3. Plant Selection and Growth Measurement

The kratom samples were collected from September to December 2021. Since the southern region is the species’ native habitat, it served as the control in this study. Five trees were randomly selected from each location (Figure 1), following the guidelines outlined in the handbook for functional traits by Pérez-Harguindeguy et al. [21] and Leksungnoen et al. [15]. Although the exact age of the trees was unknown, they were estimated to be between 5 and 25 years old based on the landowner’s feedback. Older trees were found in the southern region, while trees were relatively younger in the northeastern region. It was ensured that all trees were at least two years old, as this is the minimum age at which their leaves are typically harvested for local consumption. The specific genetic origins of the trees could not be determined; however, all seeds and seedlings were confirmed to originate from southern Thailand [3]. The size of the kratom trees was quantified through their girth (cm), total height (m), and crown area (cm2).

2.4. Leaf Functional Trait Measurements

Several leaf functional traits associated with growth were measured [21]. Physiological leaf samples were collected from sun-exposed leaves, specifically the second or third pair from the top of a shoot, to ensure that they were mature and physiologically active. Sunlit leaves were typically sampled from the outer canopy, using the center of the canopy as a reference. Leaves fully exposed to direct sunlight or showing signs of disease or insect infestation were excluded. Each leaf trait was measured using 10 leaf samples per tree. The measured traits included the chlorophyll content (SPAD), performance index (PI), quantum yield (Fv/Fm), specific leaf area (SLA), leaf thickness, leaf pH, and stomatal density (SD).
The SPAD was determined using a SPAD-502 chlorophyll meter (Konica Minolta Sensing Europe, London, UK). Measurements were taken at five spots on the leaf blade, and the average of these readings was recorded as the SPAD value [36,37]. The PI and Fv/Fm were measured using a chlorophyll fluorescence meter (Handy PEA, Hansatech, Norfolk, UK), which emits light to excite chlorophyll molecules, causing them to release fluorescence that is quantified as the quantum yield. Before measurement, the leaves were dark-adapted for 15–30 min using special leaf clips to allow for photosystem relaxation, ensuring an accurate assessment of the maximum quantum efficiency of Photosystem II (PSII) [38,39].
The SLA is the ratio of a leaf’s area to its dry mass (g) and is expressed in cm2 g−1 [21]. The SLA is positively correlated with growth, reflecting the light-capturing efficiency and growth rate [40]. The leaf area was measured using ImageJ (Version 1.54p, Rasband, W.S., ImageJ, U.S. National Institutes of Health, Bethesda, MD, USA) [41]. The same leaf was then oven-dried at 75 °C for 48 h and weighed using an analytical balance with a precision of three decimal places (Precisa Model XT 620M, Precisa Gravimetrics AG, Dietikon, Switzerland) [42]. The leaf thickness (mm) was measured using a thickness gauge (Model 547, Mitutoyo Corporation, Kawasaki, Japan). Measurements were taken by placing the gauge’s jaws on either side of the leaf blade, avoiding the main veins to ensure uniformity [43,44,45].
The leaf pH was measured by grinding approximately 5 g of fresh leaves and mixing them with 40 mL of deionized water in a 1:8 ratio. The mixture was allowed to equilibrate before the pH was measured using a handheld pH meter (Model PCSTestr 35, Eutech Instruments Pte Ltd., Singapore). The stomatal density (SD, stomata mm−2) was determined using the nail-polish imprint method [46], where clear nail polish was applied at three locations (base, middle, and tip) on the abaxial (lower) leaf surface. Once the nail polish had dried, a piece of sellotape was pressed onto the leaf, peeled off, and mounted on a glass slide. Photographs were captured using a digital light microscope (10–40X zoom), and the SD was estimated using ImageJ software.

2.5. Data Analysis

Leaf functional traits among the three locations in Thailand were compared using a one-way analysis of variance (ANOVA), followed by post hoc mean comparisons with least square differences (LSDs), implemented via the ’agricolae’ package in R [47], at a significance level of p-value ≤ 0.05. A principal component analysis (PCA) was performed on the environmental and soil data using the ‘FactoMineR’ package [48]. The first two principal components (PCs), which contributed the most to the total dataset variability, were used as proxies to identify the distribution of significant traits along environmental gradients.
Non-Metric Multidimensional Scaling (NMDS) was used to determine any significant influence of environmental and soil variables on leaf traits, using the Bray–Curtis distance metric [49] via the metaMDS function in the ’vegan’ package [50]. Stress values were evaluated to ensure a good fit, with values below 0.10 considered acceptable. Environmental and soil variables were fitted to the NMDS ordination using the envfit function, with 10,000 permutations to assess significance. Variables were considered significant at p-value ≤ 0.05. Both significant and non-significant vectors were plotted as a triplot, representing environmental and soil variables, traits, and sample locations across the three regions. Additionally, contour plots of significant environmental and soil variables were generated using the ordisurf function, with significant variables overlaid to visualize sample clustering by region. All analyses were conducted in R statistical software [51].

3. Results

3.1. Soil Conditions

Soil samples from the three regions exhibited significant variation in several variables (Table 2). The VW was significantly higher in the S region (0.38 ± 0.09) compared to the NE region (0.15 ± 0.03), while the C region (0.45 ± 0.09) had intermediate values, indicating higher water retention in soils sampled from the S region (p-value < 0.001). The BD was highest in the S region (1.36 ± 0.14 g cm−3), followed by the C region (1.24 ± 0.13 g cm−3) and the NE region (1.17 ± 0.02 g cm−3), although the differences were not statistically significant (p-value = 0.110). Porosity was highest in the NE region (55.89 ± 0.96%), suggesting better aeration and drainage, followed by the C (53.31 ± 4.83%) and S regions (48.66 ± 5.38%; p-value = 0.089). The soil pH was mildly acidic across all regions, ranging from 5.31 ± 0.16 in the S region to 5.48 ± 0.88 in the C region, with no significant differences observed (p-value = 0.867).
OM and total carbon were highest in the S region (1.41 ± 0.32%) and lowest in the NE region (0.91 ± 0.25%) but did not differ significantly across the regions (p-value = 0.257 and p-value = 0.218, respectively). The total nitrogen content was similar across the regions, with values ranging from 0.20 ± 0.02% in the NE region to 0.23 ± 0.09% in the C region (p-value = 0.649). However, the available phosphorus varied significantly, with the C region exhibiting the highest levels (44.04 ± 46.53 mg kg−1), followed by the S region (22.76 ± 20.99 mg kg−1), and the NE region exhibiting the lowest levels (1.85 ± 0.23 mg kg−1; p-value < 0.001). The exchangeable potassium levels were also significantly different, with the C region (173.31 ± 115.72 mg kg−1) having the highest levels, followed by the NE (42.62 ± 23.59 mg kg−1) and S regions (30.28 ± 6.23 mg kg−1; p-value < 0.001).
Exchangeable calcium and magnesium exhibited similar trends, with significantly higher levels in the C region (1634.44 ± 713.36 mg kg−1 and 303.52 ± 60.84 mg kg−1, respectively) compared to the NE (241.44 ± 48.66 mg kg−1 and 89.71 ± 19.74 mg kg−1, respectively) and S regions (252.36 ± 159.24 mg kg−1 and 27.48 ± 15.86 mg kg−1, respectively; p-value < 0.001 for both). In summary, the S region had higher water retention and organic matter levels, the C region had significantly greater nutrient availability, and the NE region exhibited higher porosity but lower water retention and essential nutrient levels.

3.2. Kratom Growth

The girth, height, and crown area of the sampled trees from the three regions ranged within 15.5–92.0 cm, 4.0–15.0 m, and 2.7–41.8 m2, respectively. Tree sizes varied significantly across the three regions, with trees in the S region exhibiting the highest average girth at breast height (GBH) of 70.30 ± 24.58 cm. The C region had a lower average GBH of 51.64 ± 18.86 cm, while the NE region had the lowest average GBH of 18.12 ± 4.13 cm.

3.3. Leaf Functional Traits

Growth-related leaf physiological traits across the three regions are presented in Table 3. The SLA, leaf thickness, SPAD, and SD were not significantly different among the three regions (p-value > 0.05). The SLA ranged between 152.89 and 165.32 cm2 g−1, the leaf thickness between 0.16 and 0.17 mm, the SPAD between 31.66 and 33.79, and the SD between 308.64 and 352.40 stomata mm−2 (Table 3). However, the leaf pH varied significantly (p-value = 0.014), with the NE region having the highest pH (4.72 ± 0.12), followed by the C region (4.44 ± 0.14) and the S region (4.34 ± 0.25). The PI was also significantly different (p-value = 0.001), with the highest values for trees sampled from the S region (3.26 ± 1.24) and the lowest for those in the NE region (1.55 ± 0.38).
The quantum yield (Fv/Fm) varied significantly across the three regions (p-value < 0.001). The values in the S and C regions averaged around 0.8 (±0.01), while a significant reduction was observed in the NE region (0.72 ± 0.02), suggesting a possible decline in PSII efficiency. The observed reduction was likely influenced by environmental stresses on leaf physiology, including lower soil water, phosphorus, and calcium contents (see Table 2), along with higher elevation (314 m on average, compared to 8–20 m in the C and S regions).
Figure 2 presents the correlation matrix between growth and physiological traits, highlighting only the significant correlations. The correlations between tree growth parameters (i.e., height and GBH, as well as crown cover and GBH) were significantly positive (r = 0.8). Fv/Fm had strong positive correlations with all the growth parameters, including GBH, height, and crown area (r = 0.5–0.7), and negative correlations with leaf thickness and leaf pH. These findings suggest that kratom trees with higher growth rates experience lower stress, as indicated by higher Fv/Fm values. Moreover, healthier trees tended to have thinner, more acidic leaves. Trait differences across the regions could have been influenced by environmental variations. Therefore, the relationship between environmental factors and leaf physiological traits was analyzed further.

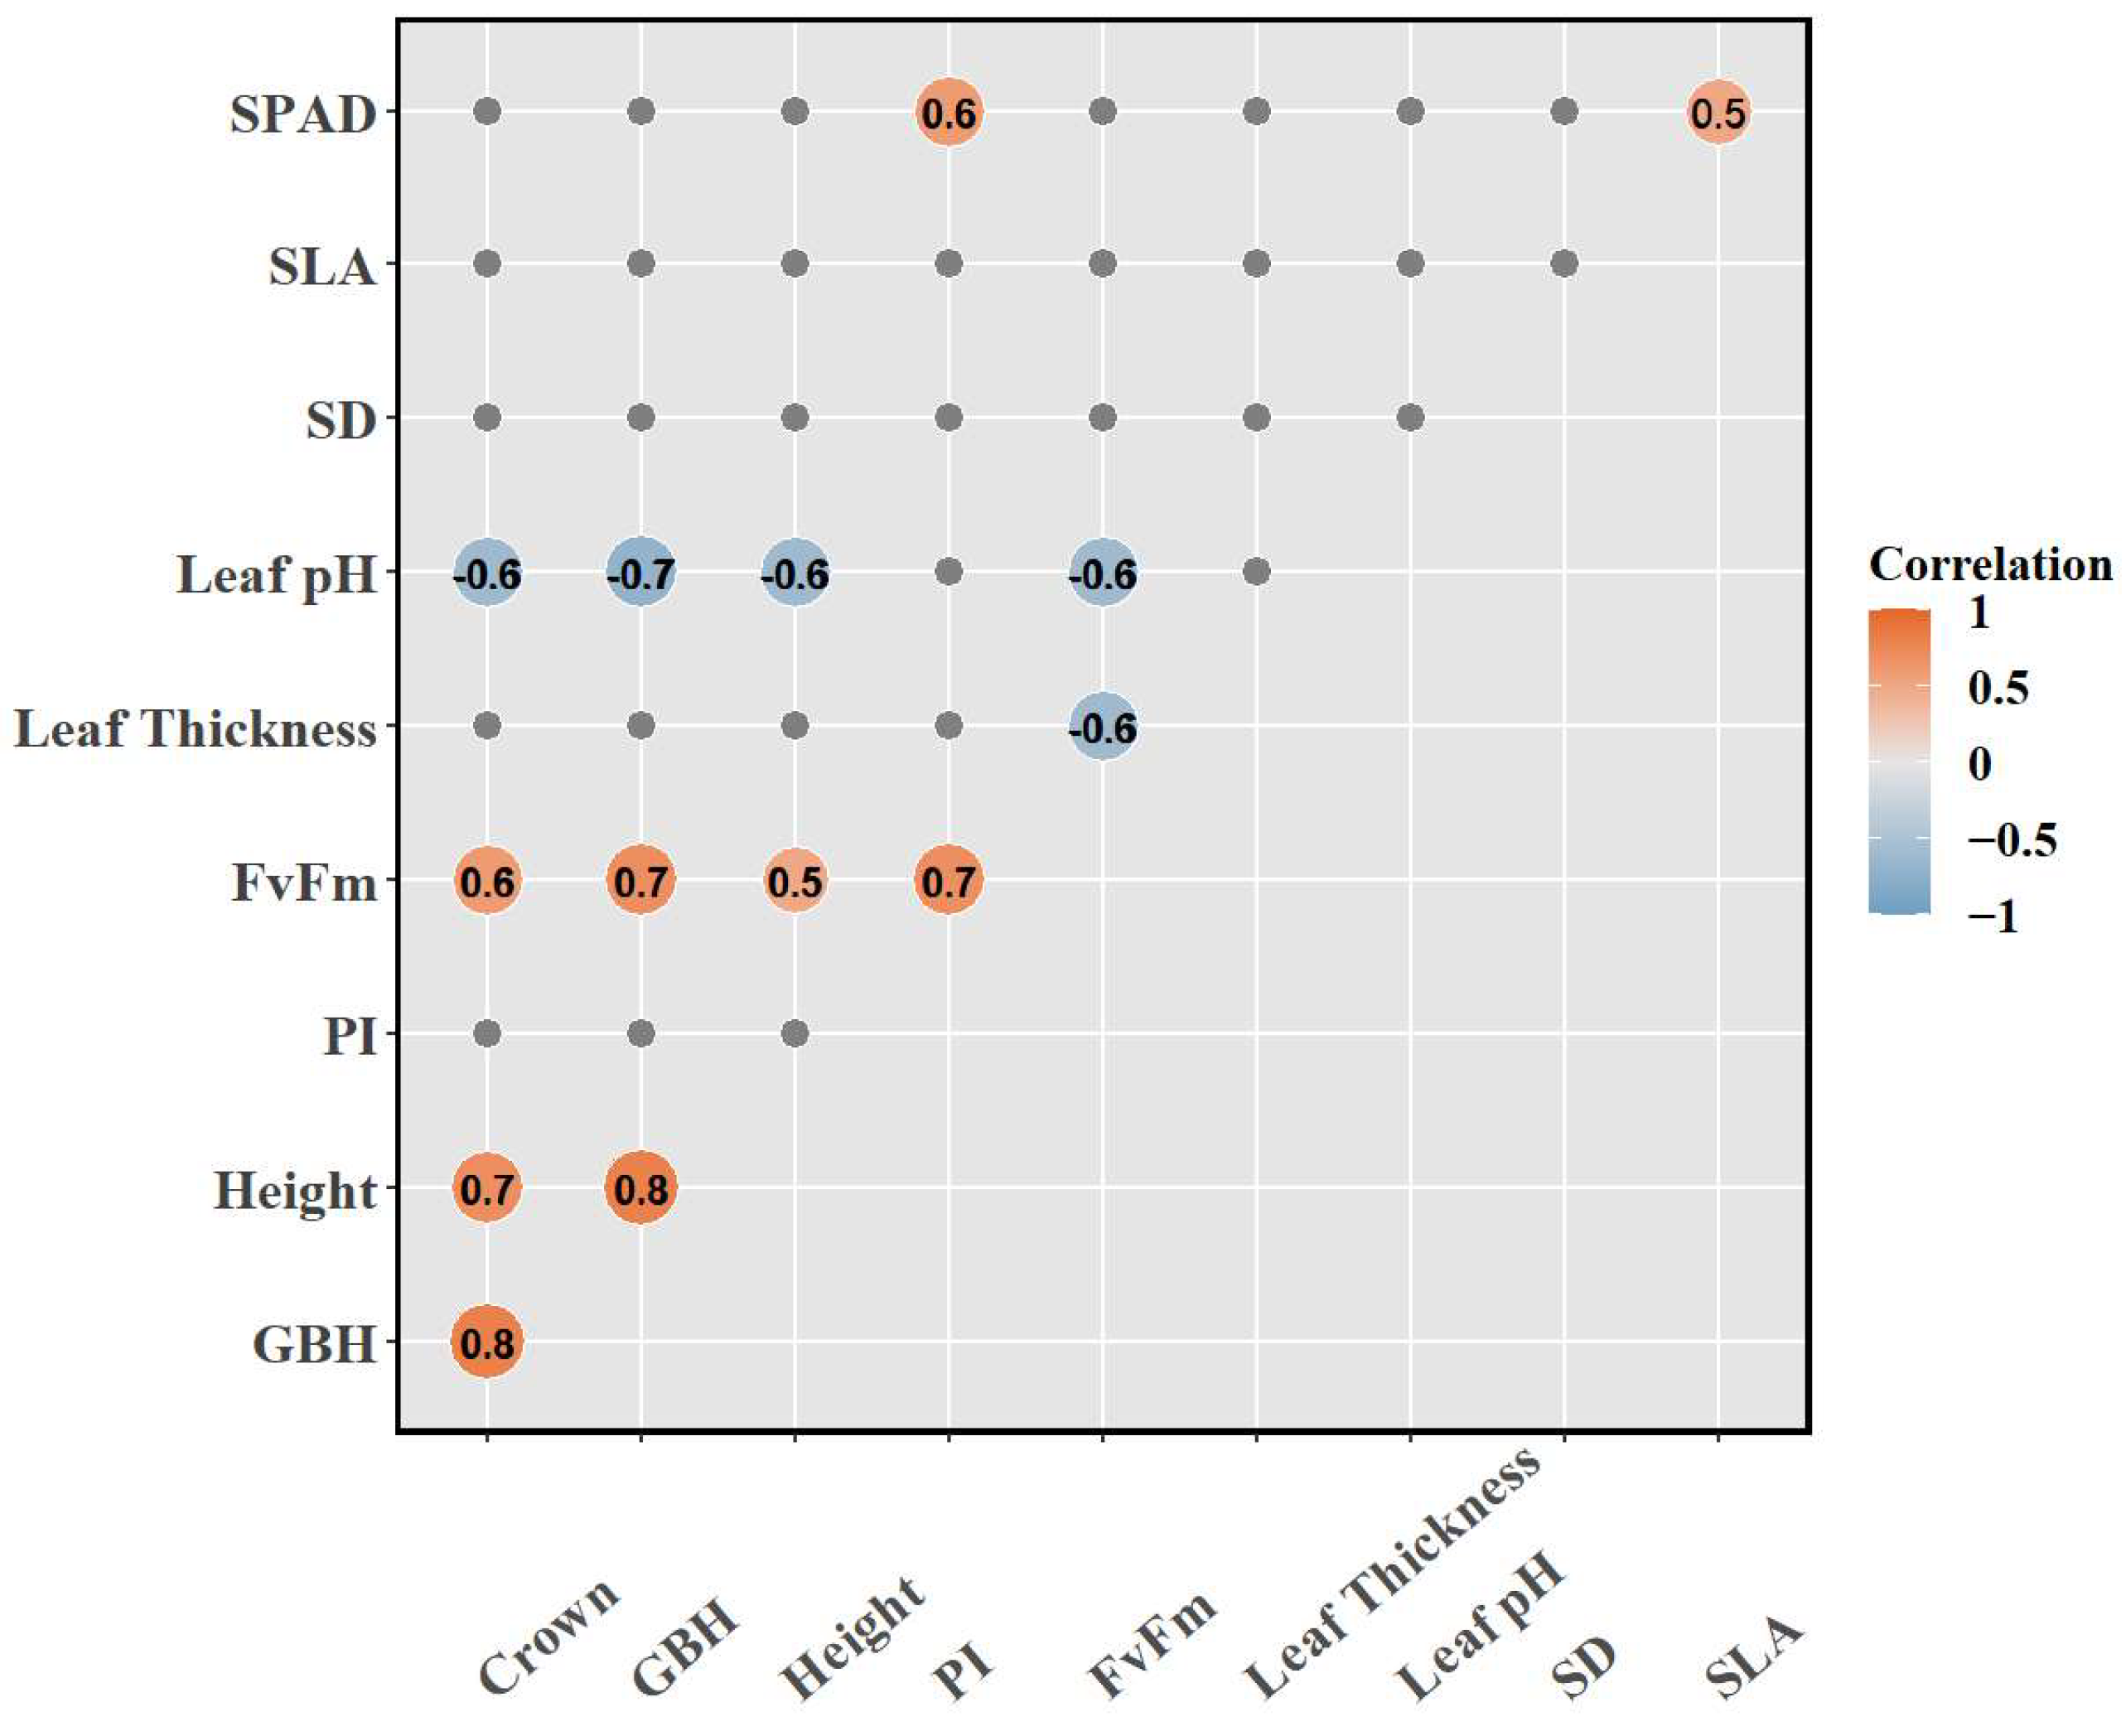
3.4. Principal Component Analysis (PCA)

PCA plots were generated to map significant physiological traits along regional environmental gradients (see Table 3 and Figure 3). The first two principal components, PC1 (positively correlated with temperature, r = 0.8512, p-value < 0.0001, and negatively correlated with elevation, r = −0.8148, p-value = 0.0002) and PC2 (negatively correlated with rainfall, r = −0.8174, p-value = 0.0002), explained nearly 70% of the total variance. Trees in the S region, located at lower elevations with higher rainfall, had a greater GBH, height, and crown area, along with near-optimal Fv/Fm values (~0.8), indicating favorable photosynthetic performance and growth. In contrast, trees in the NE region, located at high elevations and receiving lower rainfall, had a smaller GBH, height, and crown area, as well as lower Fv/Fm values (~0.72), indicative of physiological stress. The C region exhibited intermediate traits, aligning with transitional environmental conditions. Traits such as the pH and PI showed less variation, suggesting lower sensitivity to environmental gradients and more localized adaptations.

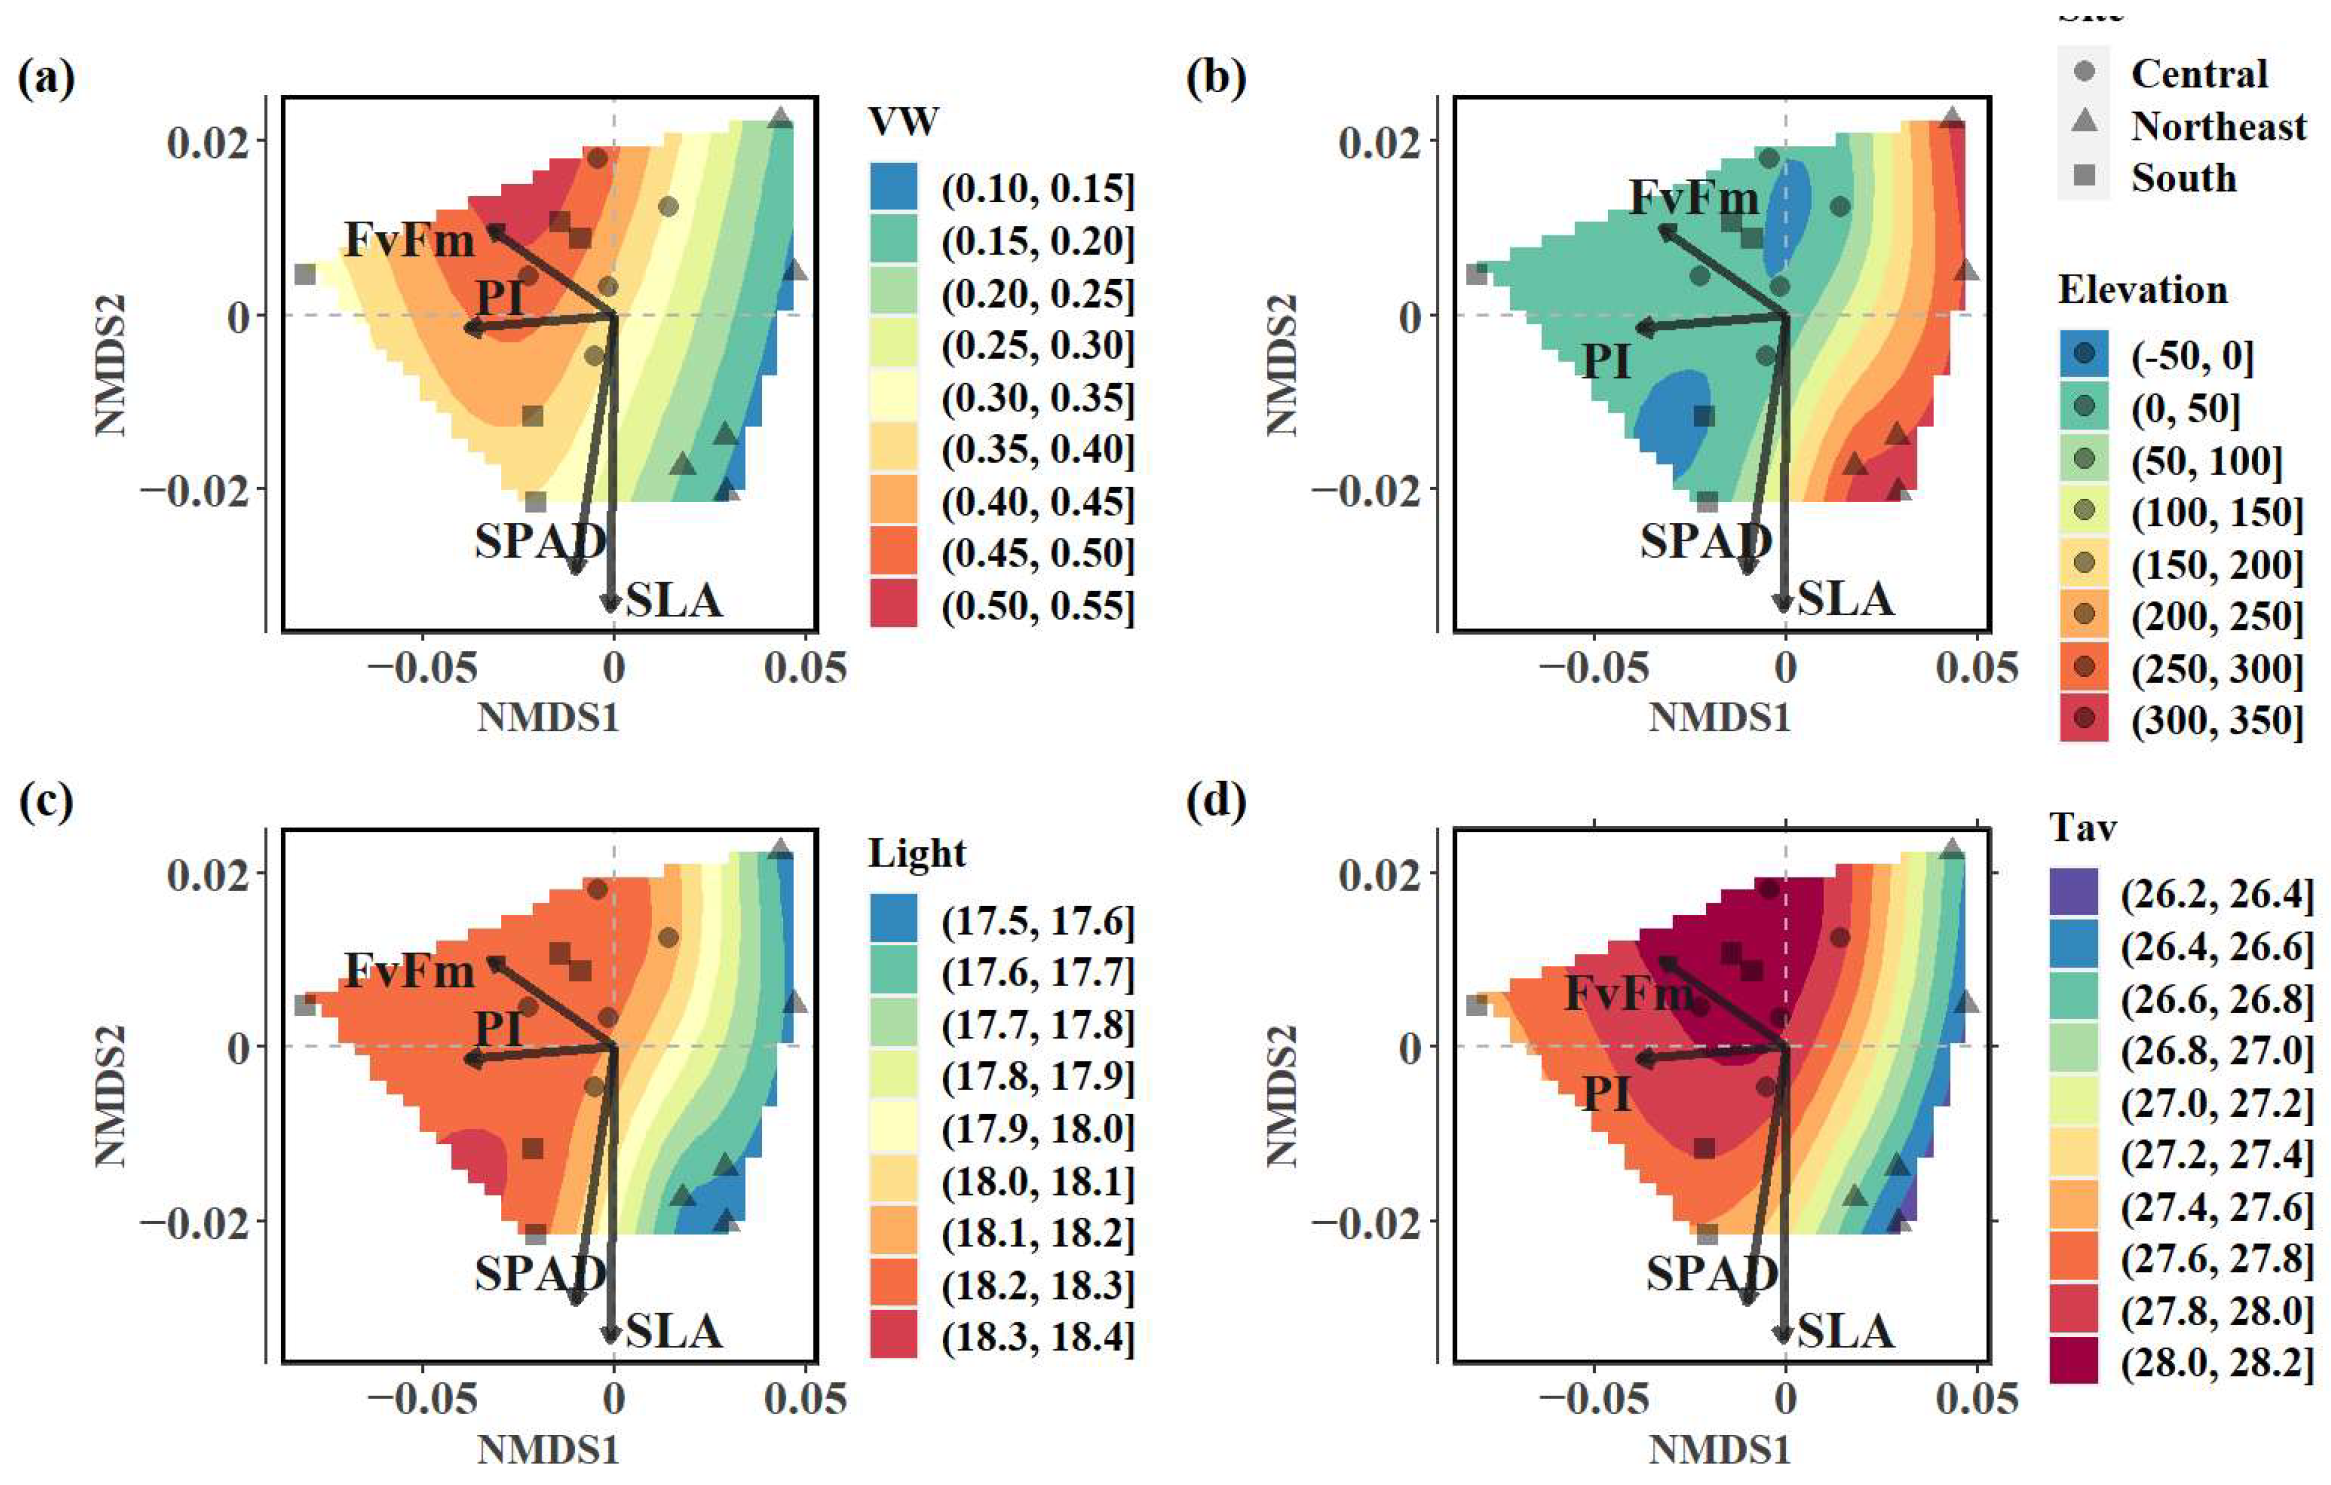
3.5. Non-Metric Multidimensional Scaling (NMDS)

The NMDS ordination plot (Figure 4) visualizes any significant associations (p-value < 0.05) among key plant traits (blue vectors), significant environmental and soil variables (red vectors), insignificant environmental and soil variables (gray vectors, see Table 2), and site locations (C, NE, and S; represented by colored filled circles). The vectors’ directions and lengths represent the relationships between these variables and the NMDS axes, where longer vectors indicate stronger influences. The stress value for the model was approximately 0.09, indicating a good fit. Fv/Fm and the PI were correlated with the negative NMDS1 axis, while both the SPAD and SLA were associated with the negative NMDS2 axis. As shown in the figure, leaf traits from the NE region were distinctly separated from those of the C and S regions. This separation was driven by the light intensity, average temperature, volumetric soil water content, and elevation, suggesting that regional environmental differences influenced kratom leaf traits. The SLA, PI, SPAD, and Fv/Fm were identified as significant traits, represented by blue arrows, highlighting their strong association with the sample distribution. In contrast, the SD, leaf thickness, and leaf pH were insignificant and are not shown in the figure. The light intensity was strongly correlated with Fv/Fm and negatively correlated with elevation, suggesting that higher light intensities and lower elevations were associated with higher (optimal or low-stress) Fv/Fm values.
Contour plots of significant air and soil variables (Figure 5) indicate that the NE region was characterized by higher elevations and lower light intensity, whereas the C and S regions were mainly at elevations below 50 m receiving higher light intensity, exceeding 18 MJ m−2 day−1. Being situated at higher elevations, locations in the NE had lower temperatures and VW, whereas the C and S regions had higher average temperatures and VW, indicating generally warmer and wetter conditions. Most trees in the C and S regions were positioned along gradients of decreasing elevation and increasing light, temperature, and VW, exhibiting higher Fv/Fm and PI values. In contrast, trees located in the NE followed the opposite pattern. This suggests that the sampled locations in the C and S regions were generally located at lower elevations, receiving a higher light intensity, greater soil water availability, and warmer conditions compared to the NE. These findings further highlight the role of environmental and soil variables in shaping the observed trait variations across the three regions.

4. Discussion

This study examined variations in kratom leaf traits across three distinct regions of Thailand to identify potential differences or similarities in growth patterns. This information is particularly relevant following the recent legalization of kratom for commercial cultivation in Thailand, given its medicinal and economic value [52]. Understanding leaf trait variations can help local farmers and communities optimize kratom cultivation for higher yields of bioactive metabolites that are valued for their therapeutic applications, including pain relief and opioid withdrawal management [53]. Moreover, understanding these ecological and physiological relationships is crucial for supporting kratom’s therapeutic and pharmaceutical applications, particularly in regions with environmental conditions different from those in its native S region [15,16].
Significantly different growth characteristics and physiological leaf traits across the regions indicated distinct environmental and soil influences on species development and adaptability. Among the functional leaf traits, the SLA, SPAD, leaf thickness, and SD were not significantly different across the regions, suggesting minimal variation in these parameters despite differing environmental conditions. However, the PI and Fv/Fm, which are key indicators of water stress and photosynthetic performance [54,55], exhibited significant variability. Fv/Fm represents the maximum quantum efficiency of Photosystem II (PSII) and is calculated as the ratio of variable fluorescence (Fv) to maximum fluorescence (Fm), reflecting the photochemical efficiency of PSII under non-stressed conditions [56]. It is a widely used indicator of plant photosynthetic performance, with optimal values (~0.80) reflective of healthy, unstressed plants, while reductions indicate stress due to photoinhibition [57].
Significant differences in Fv/Fm among the three regions suggest optimal photosynthetic efficiency in non-stressed plants growing in the S and C regions [56]. This trend aligns with the maximum photosynthetic quantum yield, enabling plants to sustain efficient photochemical processes under favorable conditions, including higher rainfall, moderate temperatures, and nutrient-rich soils [57]. Conversely, suboptimal values in the NE region reflect the impact of environmental stressors, including higher temperatures, reduced precipitation, and nutrient limitations [58]. This decline, often indicative of PSII damage, can disrupt the balance between light capture and energy utilization in chloroplasts [59], affecting growth and leaf yields.
The tree girth, height, and crown area were notably greater in the S region than in the C and NE regions, suggesting optimal growth conditions, including high VW [60] and elevated organic matter contents in the soil. Additionally, trees in the S region had the highest PI values, indicating superior photochemical efficiency and favorable soil properties, corresponding with previous observations of conditions favoring growth [61]. In contrast, the NE region, situated at higher elevations, had the highest porosity and lowest BD, suggesting improved aeration and drainage [62], but limited water and nutrient availability, particularly with regard to phosphorus. This was evidenced by the lowest GBH, reflecting the region’s harsher environmental conditions, which constrain kratom productivity in nutrient-poor soils without supplementation [63]. Furthermore, trees in this region exhibited the lowest PI and Fv/Fm values, indicating reduced photosynthetic efficiency [54]. The C region, with intermediate growth traits and the highest levels of phosphorus, potassium, calcium, and magnesium, presented favorable conditions for maximizing plant growth, biomass production, and the synthesis of secondary metabolites [15,43,64]. The soil pH was slightly acidic in all the locations, suggesting that acidity is unlikely to limit kratom growth [65].
Further NMDS analyses reinforced these observations, identifying Fv/Fm and the PI, SLA, and SPAD as key growth traits influenced by environmental factors such as the elevation, light intensity, VW, and temperature. Locations sampled in the NE were distinctly separated from those in the C and S regions in the NMDS plot, emphasizing the impact of reduced light availability on leaf traits, in contrast to the favorable low-elevation, well-lit, and moisture-rich environments of the S and C regions [66]. A positive correlation between Fv/Fm and light intensity, along with a negative association with elevation, further highlighted the role of light availability in sustaining photosynthetic efficiency, consistent with observations in other tropical species [67].
The observed resilience of kratom to diverse environmental conditions suggests its potential for cultivation beyond its native habitat in southern Thailand. However, conditions in the NE region require careful management to mitigate stress from environmental extremes, as suboptimal factors can reduce growth and productivity [68]. These findings have practical implications for farmers and stakeholders seeking to expand kratom cultivation beyond its native range, informing them about the optimal environmental conditions and key functional leaf traits [69] essential for maximizing yield and maintaining leaf quality. Furthermore, this study highlights the importance of light availability, soil water retention, and nutrient variability in supporting successful kratom cultivation, enhancing its potential for pharmaceutical and economic applications [16].
As part of their adaptive response to biotic and abiotic stresses, plants often increase their accumulation of secondary metabolites, including alkaloids, phenolics, and terpenes [70]. These metabolites play a crucial role in mitigating stress, enhancing resilience, and deterring herbivory. Investigating the correlation between secondary metabolites and abiotic stress across regions could further enhance our understanding of kratom’s ecological strategies.

5. Conclusions

This study examined the influence of regional soil and environmental factors on the growth and physiological traits of Mitragyna speciosa (kratom), given a recent interest in its cultivation across Thailand. The S and C regions, with nutrient-rich soils, higher water availability, and optimal light intensity, supported superior growth and photosynthetic efficiency, whereas trees in the NE region struggled with limited water retention, low nutrient levels, and cooler temperatures. Despite these differences, kratom demonstrated remarkable resilience, maintaining stable core functional traits such as SLA, SPAD, and SD across the three regions. NMDS analyses identified key drivers of variability, including elevation, light intensity, and soil moisture, emphasizing the need to manage environmental stressors such as light and water availability. Specifically, targeted nutrient supplementation in the NE region and improved water management in the S region are recommended to enhance growth and metabolite production. The current results can help optimize kratom cultivation for pharmaceutical and economic purposes, given its adaptability beyond its native habitat.

Supplementary Materials

The following supporting information can be downloaded at: https://www.mdpi.com/article/10.3390/ijpb16010024/s1, Table S1 The coordinates of kratom samples from three regions of Thailand.

Author Contributions

S.C.: methodology, software, validation, formal analysis, investigation, data curation, writing—original draft preparation, writing—review and editing, visualization; S.U.: investigation, supervision; C.N.: investigation, supervision; T.A.: methodology, software, validation, formal analysis, investigation, data curation, writing—original draft preparation, writing—review and editing, visualization, supervision; N.L.: conceptualization, methodology, validation, formal analysis, investigation, data curation, writing—original draft preparation, writing—review and editing, visualization, project administration, funding acquisition. All authors have read and agreed to the published version of the manuscript.

Funding

This research was funded by Kasetsart University through the Graduate School Fellowship Program. We would like to thank the Thailand Science Research and Innovation (TSRI) through Kasetsart University Research and Development Institute (KURDI), Project No. FF(KU) 9.64.

Data Availability Statement

Dataset available upon reasonable request from the authors.

Acknowledgments

This research was funded by Kasetsart University through the Graduate School Fellowship Program. We would like to thank the Thailand Science Research and Innovation (TSRI) through Kasetsart University Research and Development Institute (KURDI), Project No. FF(KU) 9.64.

Conflicts of Interest

The authors declare no conflicts of interest. The funders had no role in the design of the study; in the collection, analyses, or interpretation of data; in the writing of the manuscript; or in the decision to publish the results.

References

  1. Firmansyah, A.; Sundalian, M.; Taufiq, M. Kratom (Mitragyna speciosa Korth) for a New Medicinal: A Review of Pharmacological and Compound Analysis. Biointerface Res. Appl. Chem. 2021, 11, 9704–9718. [Google Scholar]
  2. Singh, D.; Müller, C.P.; Vicknasingam, B.K. Kratom (Mitragyna speciosa) Dependence, Withdrawal Symptoms and Craving in Regular Users. Drug Alcohol Depend. 2014, 139, 132–137. [Google Scholar] [CrossRef] [PubMed]
  3. Ngernsaengsaruay, C.; Leksungnoen, N.; Boonthasak, W.; Utharatsamee, S.; Racharak, P.; Leetanasakskul, K.; Pongamorn, P.; Saengbuapuean, A. Additional Knowledge on the Genus Mitragyna (Rubiaceae) in Thailand. Thai For. Bull. 2022, 50, 20–39. [Google Scholar] [CrossRef]
  4. Ghazalli, M.N.; Sah, M.S.M.; Mat, M.; Awang, K.; Jaafar, M.A.; Mirad, R.; Zaini, A.Z.; Nordin, A.R.M.; Rusli, N.M.; Mohamad, S.S.; et al. Leaf Anatomy and Micromorphology Characteristics of Ketum [Mitragyna speciosa (Korth.) Havil.] (Rubiaceae). Trop. Life Sci. Res. 2021, 32, 107. [Google Scholar] [CrossRef] [PubMed]
  5. Kruegel, A.C.; Grundmann, O. The Medicinal Chemistry and Neuropharmacology of Kratom: A Preliminary Discussion of a Promising Medicinal Plant and Analysis of Its Potential for Abuse. Neuropharmacology 2018, 134, 108–120. [Google Scholar] [CrossRef] [PubMed]
  6. Halpenny, G.M. Mitragyna speciosa: Balancing Potential Medical Benefits and Abuse. ACS Med. Chem. Lett. 2017, 8, 897–899. [Google Scholar] [CrossRef]
  7. Grundmann, O. Patterns of Kratom Use and Health Impact in the US—Results from an Online Survey. Drug Alcohol Depend. 2017, 176, 63–70. [Google Scholar] [CrossRef]
  8. Singh, D.; Narayanan, S.; Vicknasingam, B.; Corazza, O.; Santacroce, R.; Roman-Urrestarazu, A. Changing Trends in the Use of Kratom (Mitragyna speciosa) in Southeast Asia. Hum. Psychopharmacol. Clin. Exp. 2017, 32, e2582. [Google Scholar] [CrossRef]
  9. Swogger, M.T.; Smith, K.E.; Garcia-Romeu, A.; Grundmann, O.; Veltri, C.A.; Henningfield, J.E.; Busch, L.Y. Understanding Kratom Use: A Guide for Healthcare Providers. Front. Pharmacol. 2022, 13, 801855. [Google Scholar] [CrossRef] [PubMed]
  10. Coe, M.A.; Pillitteri, J.L.; Sembower, M.A.; Gerlach, K.K.; Henningfield, J.E. Kratom as a Substitute for Opioids: Results from an Online Survey. Drug Alcohol Depend. 2019, 202, 24–32. [Google Scholar] [CrossRef] [PubMed]
  11. Assanangkornchai, S.; Muekthong, A.; Sam-Angsri, N.; Pattanasattayawong, U. The Use of Mitragynine speciosa (“Krathom”), an Addictive Plant, in Thailand. Subst. Use Misuse 2007, 42, 2145–2157. [Google Scholar] [CrossRef]
  12. Chokprajakchat, S.; Techagaisiyavanit, W.; Iyavarakul, T.; Kuanliang, A. When Criminal Diversion Is a Temporary Solution: Rethinking Drug Rehabilitation Policy in Thailand. Curr. Issues Crim. Justice 2022, 34, 418–434. [Google Scholar] [CrossRef]
  13. Charoenratana, S.; Anukul, C.; Aramrattana, A. Attitudes towards Kratom Use, Decriminalization and the Development of a Community-Based Kratom Control Mechanism in Southern Thailand. Int. J. Drug Policy 2021, 95, 103197. [Google Scholar] [CrossRef] [PubMed]
  14. Phromchan, W.; Defri, I.; Saensano, C.; Chookaew, A.; Chiarawipa, R.; Sriwiriyajan, S. Morphological and Physiological Properties of Kratom (Mitragyna speciosa) Leaves: Macronutrients, Phytochemicals, Antioxidants, and Mitragynine Content. Plant Sci. Today 2024, 11, 762–770. [Google Scholar] [CrossRef]
  15. Leksungnoen, N.; Andriyas, T.; Ngernsaengsaruay, C.; Uthairatsamee, S.; Racharak, P.; Sonjaroon, W.; Kjelgren, R.; Pearson, B.J.; McCurdy, C.R.; Sharma, A. Variations in Mitragynine Content in the Naturally Growing Kratom (Mitragyna speciosa) Population of Thailand. Front. Plant Sci. 2022, 13, 1028547. [Google Scholar] [CrossRef] [PubMed]
  16. Zhang, M.; Sharma, A.; León, F.; Avery, B.; Kjelgren, R.; McCurdy, C.R.; Pearson, B.J. Plant Growth and Phytoactive Alkaloid Synthesis in Kratom [Mitragyna speciosa (Korth.)] in Response to Varying Radiance. PLoS ONE 2022, 17, e0259326. [Google Scholar] [CrossRef] [PubMed]
  17. Niinemets, Ü. A Review of Light Interception in Plant Stands from Leaf to Canopy in Different Plant Functional Types and in Species with Varying Shade Tolerance. Ecol. Res. 2010, 25, 693–714. [Google Scholar] [CrossRef]
  18. Dörken, V.M.; Lepetit, B. Morpho-Anatomical and Physiological Differences between Sun and Shade Leaves in Abies Alba Mill.(Pinaceae, Coniferales): A Combined Approach. Plant Cell Environ. 2018, 41, 1683–1697. [Google Scholar] [CrossRef] [PubMed]
  19. Givnish, T.J. Adaptation to Sun and Shade: A Whole-Plant Perspective. Funct. Plant Biol. 1988, 15, 63–92. [Google Scholar] [CrossRef]
  20. Boardman, N.K.T. Comparative Photosynthesis of Sun and Shade Plants. Annu. Rev. Plant Physiol. 1977, 28, 355–377. [Google Scholar] [CrossRef]
  21. Perez-Harguindeguy, N.; Diaz, S.; Garnier, E.; Lavorel, S.; Poorter, H.; Jaureguiberry, P.; Bret-Harte, M.S.; Cornwell, W.K.; Craine, J.M.; Gurvich, D.E.; et al. Corrigendum to: New Handbook for Standardised Measurement of Plant Functional Traits Worldwide. Aust. J. Bot. 2016, 64, 715–716. [Google Scholar] [CrossRef]
  22. Puglielli, G.; Varone, L.; Gratani, L.; Catoni, R. Specific Leaf Area Variations Drive Acclimation of Cistus Salvifolius in Different Light Environments. Photosynthetica 2017, 55, 31–40. [Google Scholar] [CrossRef]
  23. Chaturvedi, R.K.; Raghubanshi, A.S. A Functional Trait Approach for Understanding Woody Species Assemblage in Tropical Deciduous Forest. MOJ Ecol. Environ. Sci. 2018, 3, 167–169. [Google Scholar]
  24. Torres-Leite, F.; Cavatte, P.C.; Garbin, M.L.; Hollunder, R.K.; Ferreira-Santos, K.; Capetine, T.B.; Soares, B.S.; Carrijo, T.T. Surviving in the Shadows: Light Responses of Co-Occurring Rubiaceae Species within a Tropical Forest Understory. Flora 2019, 261, 151487. [Google Scholar] [CrossRef]
  25. Xu, F.; Guo, W.; Xu, W.; Wei, Y.; Wang, R. Leaf Morphology Correlates with Water and Light Availability: What Consequences for Simple and Compound Leaves? Prog. Nat. Sci. 2009, 19, 1789–1798. [Google Scholar] [CrossRef]
  26. Schmitt, S.; Trueba, S.; Coste, S.; Ducouret, E.; Tysklind, N.; Heuertz, M.; Bonal, D.; Burban, B.; Herault, B.; Derroire, G. Seasonal Variation of Leaf Thickness: An Overlooked Component of Functional Trait Variability. Plant Biol. 2022, 24, 458–463. [Google Scholar] [CrossRef]
  27. Leenawarat, D.; Luang-on, J.; Buranapratheprat, A.; Ishizaka, J. Influences of Tropical Monsoon and El Niño Southern Oscillations on Surface Chlorophyll-a Variability in the Gulf of Thailand. Front. Clim. 2022, 4, 936011. [Google Scholar] [CrossRef]
  28. Asanok, L.; Kamyo, T.; Norsaengsri, M.; Salinla-um, P.; Rodrungruang, K.; Karnasuta, N.; Navakam, S.; Pattanakiat, S.; Marod, D.; Duengkae, P.; et al. Vegetation Community and Factors That Affect the Woody Species Composition of Riparian Forests Growing in an Urbanizing Landscape along the Chao Phraya River, Central Thailand. Urban For. Urban Green. 2017, 28, 138–149. [Google Scholar] [CrossRef]
  29. Kunstadter, P.R.; Chapman, E.C.; Sabhasri, S. Farmers in the Forest: Economic Development and Marginal Agriculture in Northern Thailand; University of Hawaii Press: Kolowalu St, HI, USA, 2019. [Google Scholar]
  30. Wiriyakitnateekul, W.; Kerdchana, C. Methods of Soil Analysis and Interpretation for Soil Survey and Classification: Physical Properties; Land Development Department, Bangkok: Bangkok, Thailand, 2016. [Google Scholar]
  31. Toková, L.; Igaz, D.; Aydin, E. Measurement of Volumetric Water Content by Gravimetric and Time Domain Reflectometry Methods at Field Experiment with Biochar and N Fertilizer. Acta Hortic. Regiotect. 2019, 22, 61–64. [Google Scholar] [CrossRef]
  32. Wang, X.; Sun, H.; Wang, C.; Liu, J.; Guo, Z.; Gao, L.; Ma, H.; Yuan, Z.; Yao, C.; Pan, X. Predicting the Soil Bulk Density Using a New Spectral PTF Based on Intact Samples. Geoderma 2024, 449, 117005. [Google Scholar] [CrossRef]
  33. Phogat, V.K.; Tomar, V.S.; Dahiya, R. Soil Physical Properties. Soil Sci. Introd. 2015, 1, 135–171. [Google Scholar]
  34. Sparks, D.L.; Page, A.L.; Helmke, P.A.; Loeppert, R.H. Methods of Soil Analysis, Part 3: Chemical Methods; John Wiley & Sons: Hoboken, NJ, USA, 2020; Volume 14. [Google Scholar]
  35. Walkley, A. A Critical Examination of a Rapid Method for Determining Organic Carbon in Soils—Effect of Variations in Digestion Conditions and of Inorganic Soil Constituents. Soil Sci. 1947, 63, 251–264. [Google Scholar] [CrossRef]
  36. Clemente, A.A.; Maciel, G.M.; Siquieroli, A.C.; Gallis, R.B.; Luz, J.M.; Sala, F.C.; Pereira, L.M.; Yada, R.Y. Nutritional Characterization Based on Vegetation Indices to Detect Anthocyanins, Carotenoids, and Chlorophylls in Mini-Lettuce. Agronomy 2023, 13, 1403. [Google Scholar] [CrossRef]
  37. Leksungnoen, N. Physiological Traits Contributing to Carbon Storage Variation in Monastery Bamboo and Pai Liang in Northeastern Thailand. Songklanakarin J. Sci. Technol. 2017, 39, 215–223. [Google Scholar] [CrossRef]
  38. Viljevac Vuletić, M.; Španić, V. Characterization of Photosynthetic Performance during Natural Leaf Senescence in Winter Wheat: Multivariate Analysis as a Tool for Phenotypic Characterization. Photosynthetica 2020, 58, 301–313. [Google Scholar] [CrossRef]
  39. Sonjaroon, W.; Kaveeta, L.; Chai-arree, W.; Klinsakorn, S.; Suksamrarn, A.; Jutamanee, K. Exogenous 7,8-Dihydro-8α-20-Hydroxyecdysone Application Improves Antioxidative Enzyme System, Photosynthesis, and Yield in Rice under High-Temperature Condition. Acta Physiol. Plant. 2016, 38, 202. [Google Scholar] [CrossRef]
  40. Arasa-Gisbert, R.; Arroyo-Rodríguez, V.; Meave, J.A.; Martínez-Ramos, M.; Lohbeck, M. Forest Loss and Treeless Matrices Cause the Functional Impoverishment of Sapling Communities in Old-Growth Forest Patches across Tropical Regions. J. Appl. Ecol. 2022, 59, 1897–1910. [Google Scholar] [CrossRef]
  41. Gao, J.; Wang, K.; Zhang, X. Patterns and Drivers of Community Specific Leaf Area in China. Glob. Ecol. Conserv. 2022, 33, e01971. [Google Scholar] [CrossRef]
  42. Zheng, Z.; Zhang, Y.; Dong, F.; Chen, L.; Li, Z. Linkage between Leaf Anatomical Structure and Key Leaf Economic Traits across Co-Existing Species in Temperate Forests. Plant Soil 2024, 1–12. [Google Scholar] [CrossRef]
  43. Ye, Y.; Kitayama, K.; Onoda, Y. A Cost--Benefit Analysis of Leaf Carbon Economy with Consideration of Seasonal Changes in Leaf Traits for Sympatric Deciduous and Evergreen Congeners: Implications for Their Coexistence. New Phytol. 2022, 234, 1047–1058. [Google Scholar] [CrossRef]
  44. Lu, Z.; Ren, T.; Li, J.; Hu, W.; Zhang, J.; Yan, J.; Li, X.; Cong, R.; Guo, S.; Lu, J. Nutrition-Mediated Cell and Tissue-Level Anatomy Triggers the Covariation of Leaf Photosynthesis and Leaf Mass per Area. J. Exp. Bot. 2020, 71, 6524–6537. [Google Scholar] [CrossRef] [PubMed]
  45. Pauli, D.; White, J.W.; Andrade-Sanchez, P.; Conley, M.M.; Heun, J.; Thorp, K.R.; French, A.N.; Hunsaker, D.J.; Carmo-Silva, E.; Wang, G.; et al. Investigation of the Influence of Leaf Thickness on Canopy Reflectance and Physiological Traits in Upland and Pima Cotton Populations. Front. Plant Sci. 2017, 8, 1405. [Google Scholar] [CrossRef] [PubMed]
  46. Yin, Q.; Tian, T.; Kou, M.; Liu, P.; Wang, L.; Hao, Z.; Yue, M. The Relationships between Photosynthesis and Stomatal Traits on the Loess Plateau. Glob. Ecol. Conserv. 2020, 23, e01146. [Google Scholar] [CrossRef]
  47. de Mendiburu, F.; de Mendiburu, M.F. Package ‘Agricolae’. R Packag. Version 2019, 1, 1143–1149. [Google Scholar]
  48. Lê, S.; Josse, J.; Husson, F. FactoMineR: An R Package for Multivariate Analysis. J. Stat. Softw. 2008, 25, 1–18. [Google Scholar] [CrossRef]
  49. Bray, J.R.; Curtis, J.T. An Ordination of the Upland Forest Communities of Southern Wisconsin. Ecol. Monogr. 1957, 27, 326–349. [Google Scholar] [CrossRef]
  50. Oksanen, J. Vegan: Community Ecology Package. 2010. Available online: http://vegan.r-forge.r-project.org (accessed on 15 September 2024).
  51. Team, R.C. R: A Language and Environment for Statistical Computing, R Foundation for Statistical. Computing 2023. [Google Scholar]
  52. Sengnon, N.; Vonghirundecha, P.; Chaichan, W.; Juengwatanatrakul, T.; Onthong, J.; Kitprasong, P.; Sriwiriyajan, S.; Chittrakarn, S.; Limsuwanchote, S.; Wungsintaweekul, J. Seasonal and Geographic Variation in Alkaloid Content of Kratom (Mitragyna speciosa (Korth.) Havil.) from Thailand. Plants 2023, 12, 949. [Google Scholar] [CrossRef] [PubMed]
  53. Veltri, C.; Grundmann, O. Current Perspectives on the Impact of Kratom Use. Subst. Abuse Rehabil. 2019, 10, 23–31. [Google Scholar] [CrossRef]
  54. Murchie, E.H.; Lawson, T. Chlorophyll Fluorescence Analysis: A Guide to Good Practice and Understanding Some New Applications. J. Exp. Bot. 2013, 64, 3983–3998. [Google Scholar] [CrossRef] [PubMed]
  55. Živčák, M.; Brestič, M.; Olšovská, K.; Slamka, P. Performance Index as a Sensitive Indicator of Water Stress in Triticum aestivum L. Plant Soil. Env. 2008, 54, 133–139. [Google Scholar] [CrossRef]
  56. Björkman, O.; Demmig, B. Photon Yield of O2 Evolution and Chlorophyll Fluorescence Characteristics at 77 K among Vascular Plants of Diverse Origins. Planta 1987, 170, 489–504. [Google Scholar] [CrossRef]
  57. Maxwell, K.; Johnson, G.N. Chlorophyll Fluorescence—A Practical Guide. J. Exp. Bot. 2000, 51, 659–668. [Google Scholar] [CrossRef] [PubMed]
  58. Flexas, J.; Bota, J.; Loreto, F.; Cornic, G.; Sharkey, T.D. Diffusive and Metabolic Limitations to Photosynthesis under Drought and Salinity in C3 Plants. Plant Biol. 2004, 6, 269–279. [Google Scholar] [CrossRef]
  59. Krause, A.G.H.; Weis, E. Chlorophyll Fluorescence and Photosynthesis: The Basics. Annu. Rev. Plant Biol. 1991, 42, 313–349. [Google Scholar] [CrossRef]
  60. Klesse, S.; Wohlgemuth, T.; Meusburger, K.; Vitasse, Y.; von Arx, G.; Lévesque, M.; Neycken, A.; Braun, S.; Dubach, V.; Gessler, A.; et al. Long-Term Soil Water Limitation and Previous Tree Vigor Drive Local Variability of Drought-Induced Crown Dieback in Fagus Sylvatica. Sci. Total Environ. 2022, 851, 157926. [Google Scholar] [CrossRef] [PubMed]
  61. Luo, Y.; Zhao, X.; Qu, H.; Zuo, X.; Wang, S.; Huang, W.; Luo, Y.; Chen, M. Photosynthetic Performance and Growth Traits in Pennisetum centrasiaticum Exposed to Drought and Rewatering under Different Soil Nutrient Regimes. Acta Physiol. Plant. 2014, 36, 381–388. [Google Scholar] [CrossRef]
  62. Wall, A.; Heiskanen, J. Soil—Water Content and Air-Filled Porosity Affect Height Growth of Scots Pine in Afforested Arable Land in Finland. For. Ecol. Manage. 2009, 257, 1751–1756. [Google Scholar] [CrossRef]
  63. Osman, K.T.; Osman, K.T. Plant Nutrients and Soil Fertility Management. Soils Princ. Prop. Manag. 2013, 129–159. [Google Scholar]
  64. Zhang, Y.; Zhang, Q.; Wang, Y.; Lin, S.; Chen, M.; Cheng, P.; Du, M.; Jia, X.; Ye, J.; Wang, H. Study on the Effect of Magnesium on Leaf Metabolites, Growth and Quality of Tea Tree. Front. Plant Sci. 2023, 14, 1192151. [Google Scholar] [CrossRef] [PubMed]
  65. Kidd, P.S.; Proctor, J. Why Plants Grow Poorly on Very Acid Soils: Are Ecologists Missing the Obvious? J. Exp. Bot. 2001, 52, 791–799. [Google Scholar] [CrossRef]
  66. Sevillano, I.; Short, I.; Grant, J.; O’Reilly, C. Effects of Light Availability on Morphology, Growth and Biomass Allocation of Fagus sylvatica and Quercus robur Seedlings. For. Ecol. Manag. 2016, 374, 11–19. [Google Scholar] [CrossRef]
  67. Posada Hostettler, J.M.R.; Lechowicz, M.J.; Kitajima, K. Optimal Photosynthetic Use of Light by Tropical Tree Crowns Achieved by Adjustment of Individual Leaf Angles and Nitrogen Content. Ann. Botany 2009, 103, 795–805. [Google Scholar] [CrossRef]
  68. Brown, P.N.; Lund, J.A.; Murch, S.J. A Botanical, Phytochemical and Ethnomedicinal Review of the Genus Mitragyna Korth: Implications for Products Sold as Kratom. J. Ethnopharmacol. 2017, 202, 302–325. [Google Scholar] [CrossRef]
  69. Bloomfield, K.J.; Prentice, I.C.; Cernusak, L.A.; Eamus, D.; Medlyn, B.E.; Rumman, R.; Wright, I.J.; Boer, M.M.; Cale, P.; Cleverly, J.; et al. The Validity of Optimal Leaf Traits Modelled on Environmental Conditions. New Phytol. 2019, 221, 1409–1423. [Google Scholar] [CrossRef] [PubMed]
  70. Hilal, B.; Khan, M.M.; Fariduddin, Q. Recent Advancements in Deciphering the Therapeutic Properties of Plant Secondary Metabolites: Phenolics, Terpenes, and Alkaloids. Plant Physiol. Biochem. 2024, 211, 108674. [Google Scholar] [CrossRef] [PubMed]
Figure 1. Locations of the kratom trees sampled from the southern (S), central (C), and northeastern (NE) regions of Thailand.
Ijpb 16 00024 g001
Figure 2. Correlation matrix of growth parameters (crown area [Crown], girth at breast height [GBH], and height) with physiological traits (performance index [PI], quantum yield [Fv/Fm], leaf thickness, leaf pH, stomatal density [SD], and specific leaf area [SLA]) in kratom. Only significant correlations (p-value < 0.05) are shown in colored circles, with red indicating positive correlations and blue indicating negative correlations. Numbers in circles represent correlation values ranging from −1 to 1.
Ijpb 16 00024 g002
Figure 3. The first two principal components, PC1 (proxy of decreasing elevation and increasing temperature) and PC2 (proxy of decreasing rainfall), across different physiological and morphological traits of kratom in three regions (C, NE, and S), with colored contours exhibiting gradients for the proxies of the environmental variables (listed in the square brackets) and dots representing individual samples color-coded by region (see legend on top).
Ijpb 16 00024 g003
Figure 4. NMDS ordination triplot with significant plant traits (blue vectors), environmental and soil variables (red vectors), and sampled locations (filled circles). The gray vectors indicate insignificant environmental and soil variables.
Ijpb 16 00024 g004
Figure 5. NMDS plots showing elevation gradients as contour overlays on sampled sites, represented by various shapes for C, NE, and S. Darker colors represent higher values of respective soil and environmental variables: (a) volumetric water content (VW), (b) elevation (Elevation), (c) light intensity (Light), and (d) average temperature (Tav). Vectors represent plant traits significantly associated with air and soil variables.
Ijpb 16 00024 g005
Table 1. Average environmental conditions of the three regions of Thailand, during the years 1991–2020, where the kratom samples were collected.
Characteristics/LocationsSouth (S) (Control)Central (C)Northeast (NE)
1. Temperature (°C)27.6028.3726.40
2. Light intensity (MJ m−2 day−1)18.2618.2017.57
3. Rainfall (mm)345010771507
4. Relative Humidity (RH) (%)797572
Table 2. Comparison of mean soil conditions among the kratom trees sampled from three regions of Thailand.
Characters/LocationsSouth (S) (Control)Central (C)Northeast (NE)p-Value
Volumetric water content (VW) (unitless)0.38 ± 0.09 a0.45 ± 0.09 a0.15 ± 0.03 b<0.001 ***
Bulk density (BD) (g cm−3)1.36 ± 0.141.24 ± 0.131.17 ± 0.020.110 NS
Porosity (%)48.66 ± 5.3853.31 ± 4.8355.89 ± 0.960.089 NS
Soil pH (unitless)5.31 ± 0.165.48 ± 0.885.37 ± 0.180.867 NS
Organic matter (OM) (%)1.41 ± 0.321.29 ± 0.720.91 ± 0.250.257 NS
Total carbon (C) (%)2.54 ± 0.332.60 ± 1.212.12 ± 0.220.218 NS
Total nitrogen (N) (%)0.21 ± 0.030.23 ± 0.090.20 ± 0.020.649 NS
Available phosphorus (P) (mg kg−1)22.76 ± 20.99 a44.04 ± 46.53 a1.85 ± 0.23 b<0.001 ***
Exchangeable potassium (K) (mg kg−1)30.28 ± 6.23 b173.31 ± 115.72 a42.62 ± 23.59 b<0.001 ***
Exchangeable calcium (Ca) (mg kg−1)252.36 ± 159.24 b1634.4 ± 713.36 a241.44 ± 48.66 b<0.001 ***
Exchangeable magnesium (Mg) (mg kg−1)27.48 ± 15.86 c303.52 ± 60.84 a89.71 ± 19.74 b<0.001 ***
Note: The superscripted letters in each row indicate significant differences in the measured traits among the three regions at p-value ≤ 0.05. *** < 0.001, while NS indicates that the differences were not significant.
Table 3. Comparison of leaf functional traits among the kratom trees sampled from three regions of Thailand.
Characters/LocationsSouth (S) (Control)Central (C)Northeast (NE)p-Value
Specific leaf area (SLA) (cm2 g−1)161.83 ± 23.45152.89 ± 14.12165.32 ± 16.430.562 NS
Leaf thickness (mm)0.16 ± 0.010.16 ± 0.020.17 ± 0.010.056 NS
Chlorophyll content (SPAD)33.79 ± 3.5331.66 ± 2.5133.35 ± 3.480.557 NS
Leaf pH (Unitless)4.34 ± 0.25 b4.44 ± 0.14 ab4.72 ± 0.12 a0.014 *
Performance index (PI) (Unitless)3.26 ± 1.24 a2.36 ± 0.32 a1.55 ± 0.38 b0.001 **
Quantum yield (Fv/Fm) (Unitless)0.80 ± 0.01 a0.80 ± 0.01 a0.72 ± 0.02 b<0.001 ***
Stomatal density (SD) (stomata mm−2)352.40 ± 42.80308.64 ± 19.54334.80 ± 42.050.203 NS
Note: Superscripted letters in each row indicate significant differences in the measured traits among the three regions at p-value ≤ 0.05. * 0.05, ** 0.001, *** < 0.001, while NS denotes non-significant differences.
Disclaimer/Publisher’s Note: The statements, opinions and data contained in all publications are solely those of the individual author(s) and contributor(s) and not of MDPI and/or the editor(s). MDPI and/or the editor(s) disclaim responsibility for any injury to people or property resulting from any ideas, methods, instructions or products referred to in the content.

