Abstract
Papaver rhoeas L. has four strikingly red petals with a distinctly black area bordered by a thin white line at the petal base, thus creating a color pattern that makes the center of the flower, where the pollen is located, visually stand out. This paper aims to assess the intra-petal spatial variability in P. rhoeas petal color intensity and hue and associate it with corresponding differences in the amount and type of petal pigments. The distribution of pigments in the petal epidermis was investigated in different petal segments by column chromatography. Fresh petals were extracted with deionized water during blooming, between April and June 2023, in northwestern Greece. UV–visible absorption spectra of the eluted fractions revealed five pigments, with each pigment belonging to a different elution zone. In the black spots of the petals, anthocyanin coexists with a yellow flavonol with a maximum absorption peak at 340 nm. Red petal extract in 70:30 ethanol–water showed a distinct negative Cotton effect at 284 nm, distinct from black segment extract with a negative Cotton effect at 227 nm. The uneven distribution of floral pigments along the petal epidermis creates a unique color palette, enabling UV-reflection, which is key in attracting pollinators responsible for plant reproduction.
1. Introduction
Anthocyanins are flavonoid pigments responsible for many of the red, violet, and purple colors characteristic of fruits and flowers, which function as attractants for pollinators [1]. Flower color patterns mainly depend on the petals’ pigmentation and their usually inhomogeneous pattern [2]. Most insect-pollinated taxa attract pollinators through a combination of visible color patterns, which are also apparent to humans, and ultraviolet patterns, which are only visible to pollinators [3,4]. Human vision is insensitive to UV wavelengths, but many groups of pollinators, bees, hummingbirds, flies, butterflies, beetles, and hawkmoths have UV-photoreceptors (330–360 nm). Bees can see in the ultraviolet, blue, and green parts of the spectrum but cannot perceive red [4]. Butterflies often have broader color vision and can perceive red to some extent [4]. Flies and beetles have a range of visual capabilities depending on the species [3,4]. Color may also act as a cue allowing insects to discriminate among flower species [5]. From a long distance, pollinators identify and choose flowers using a variety of traits, including visual contrast against the green background vegetation. At closer proximity to flowers, pollinators as bees utilize color patterns to move rapidly and directly to the floral reward [5]. Patterning in color traits has been shown to enhance the frequency and quality of pollinator visitation. Non-uniform floral patterning, such as spots, converging lines, and bullseye patterns, has been shown to enhance pollinator attraction, reduce search time, increase visitation rates, and ultimately improve reproductive success [6]. Floral markings such as petal rings help Bombus terrestris locate rewards faster, with nectar-linked patterns improving foraging [7]. In Herpetospermum pedunculosum, bees show a preference for male flowers with UV bullseyes, although this preference may reduce pollen dispersal and male fitness [8]. UV-patternless flowers were associated with most of the pollination systems, while UV-patterned flowers were mainly associated with bee pollination. Changes in UV features in flowers can even be associated with pollinator shifts [9,10]. Research and observations on both flowers and insects have led to the conclusion that all the spatial parameters that flowers offer are relevant to the foraging task and are tuned to the insect’s visual capacities and visually guided behavior.
The annual flowering Papaver rhoeas L. (Ranunculales: Papaveraceae), also known as red or corn poppy, is an iconic species of the Papaveraceae family, deeply embedded in the local culture of the European rural regions. It is a common weed in cereal fields but also a target of conservation projects, as it is threatened by the intensification of farming [11]. Traditionally, parts of the plant have been used in folk medicine for the treatment of inflammation, cough, diarrhea, asthma, insomnia, and pain. The species seeds can also be consumed as food, while its petals are used as a food dye [12,13] and are considered a rich source for many anthocyanins [14,15]. The red poppy flower is hermaphrodite and hypogynous. Its corolla consists of four bright red petals possessing a slightly crenate margin and often a black–purple dot at their base. The pollen is produced by numerous, dark stamens surrounding the ovary. The sexual reproduction of the species depends on insect pollination, although no nectar is secreted by its flowers. It looks similar to a non-uniform coloration that generates high contrast within the flower, creating its own elaborate color pattern. The presence of different colors within flowers, including color in the UV wavelength, acts as an important signal for pollinators. Bees are the main pollinators of poppy plants. They are attracted to bright colors (except red, which they cannot see well. Bees are trichromatic, sensitive to UV, blue, and green, but not red, and can perceive UV patterns (nectar guides) in some flowers, such as poppies. Glaphyrid beetles are sensitive to UV, green, and red light [9]. P. rhoeas has a wide distribution in Europe, adapting to different climate zones, tuned with pollinators’ dissemination, which indicates a biochemical versatility [10]. A previous knowledge of Papaver species, as P. nudicaule (Iceland poppy), shows a highly organized pigment layout: flavonols such as gossypetin and kaempferol are concentrated at the petal base, likely forming UV nectar guides, while nudicaulins and anthocyanins dominate the apical regions, enhancing visual attraction [16]. The in-depth investigation of variation in natural populations will reveal the underlying mechanism of color expression.
It has been hypothesized that differentiated pigment distribution in flowers operates as a honey or nectar guide for pollinators [17]. Honey guides in the genus Papaver generally take the form of pigment blotches on the petals. The pigment in the blotch (i.e., cyanidin as the 3-glucoside) is different from that present in the rest of the petal, which is cyanidin as the 3-sophoroside in P. rhoeas or pelargonidin as the 3-sophoroside in P. orientale [18,19]. Although bees are insensitive to red colors, they still visit red poppies foraging for pollen, guided by UV-absorbing flavones and flavonols, which are also present in these blossoms [20].
The objective of this work is twofold. First, the separation, identification, and localization of the P. rhoeas petal pigments through silica-based column chromatography coupled with UV–visible spectroscopy. Peak identification was made through comparison of our spectral data with those of both authentic pigments from known sources and the literature values. Both the anthocyanidin and the anthocyanin profiles are consistent with previous reports. Our second objective is to assess the intra-petal spatial variability in the color intensity and hue of P. rhoeas petals and link it with corresponding differences in the amount and type of pigments across the petals’ surface. The findings expand the known pigment diversity of Papave rhoeas and establish a foundation for future behavioral assays in the field of pollinator and flower interactions.
2. Materials and Methods
2.1. Plant Material
Poppies were collected from different indigenous populations growing at roadsides adjacent to the University of Ioannina Campus in Greece (coordinates 39.627, 20.844) between April and June 2023. The plant material collected was immediately transferred to the laboratory for further analysis.
2.2. Determination of Color
Six poppy flowers belonging to six different individuals growing in the vicinity of the University of Ioannina Campus were harvested and immediately transferred to the laboratory, where one petal from each flower was removed and used for the analysis. To investigate the color hue and color intensity pattern along the petals’ surface, we sampled nine 0.6 cm-diameter disks per petal using a punch (54 disks in total). We followed a consistent sampling pattern so that the specific sample disc numbers (1–9) corresponded to the same area for all 6 petals. The camera settings, including light intensity, contrast, and white balance, were adjusted for the first disk and remained unchanged until the conclusion of the observations. RGB color information for the 54 images was extracted using an ImageJ software (v1.53e) automatic pipeline. The thresholding technique was used to segment the parts of each image that contained intact petal tissue (Figure 1) and to separate the RGB color space of the segmented images into its three components (red, green, and blue). The extracted results were the mean red, blue, and green intensities (RGB.Red, RGB.Green, and RGB.Blue, respectively) of all segmented pixels. As shown in Figure 2A, the 9 disks per petal could adequately capture the variability in color hue and intensity along the petals’ surface. The sampled disks were mounted on microscope slides, observed, and photographed with a Zeiss AxioStar optical microscope fitted with a digital camera. The magnification used for the observations was 25×.
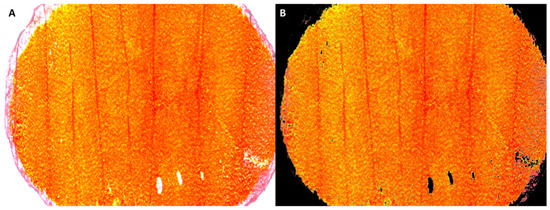
Figure 1.
An example of the original microscopic image of a petal disc (A) and its processed version (B) after segmentation using the thresholding technique in ImageJ. The mean red, green, and blue color intensities of the image are estimated based on the corresponding values of all the non-black pixels of the figure.
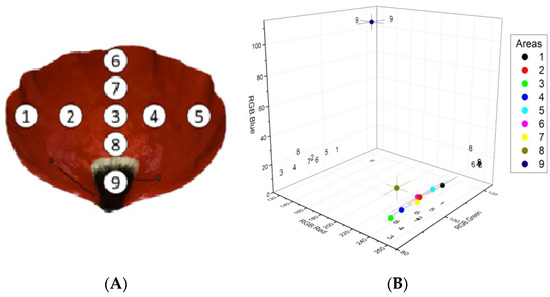
Figure 2.
Sampled areas of interest on poppy petals (A) and RGB color analysis of the sampled areas (B). Filled circles and error bars represent mean values ± SE of red, green, and blue color intensity for each of the nine areas of interest. Numbers represent the projections of the corresponding areas’ mean values on the three planes. n = 6.
2.3. Column Chromatography
The collected petals were segmented to separate their peripheral red zone from the inner zone of the black spot, and the two zones were analyzed separately. A mass of 0.1 g of petal segments per examined zone was ground using a mortar and pestle, and the pigments were extracted with deionized water. The solutions were filtered through a 0.45 μm-diameter pore Millipore filter. A silica gel column with particle size 0.06–200 mm and a pore diameter of 60 Å was prepared for the isolation of the anthocyanins. The silica gel (GAF Corp., New York, NY, USA) was suspended in distilled water and allowed to stand for 10 min. The supernatant containing the fine particles was decanted, and the solid was resuspended in distilled water. This step was repeated until the supernatant was clear. The silica was then resuspended in fresh distilled water, poured into the chromatography column (60 × 2.5 cm), and allowed to settle. The column was washed with distilled water. Crude deionized water extracts of red petal segments and black spot areas were loaded on top of the column. Pigments were eluted with 0.1% (v/v) HCl-acidified methanol. A low pH is essential for the optimum elution of highly retained anthocyanins. Experimental tests were conducted, as the literature shows, with methanol or hydro-methanolic mixtures with no success. No elution was achieved, especially for the highly retained anthocyanins. Hydrogen bonds are formed between the polar column components and the –OH groups of anthocyanins. As the number of hydroxyl groups increases in the anthocyanidin core, the elution of the pigments becomes extremely difficult from the column. Acid methanol competes with silica in order to elute the anthocyanins. Acidic pH is also important to keep the structure of the anthocyanin stable [21]. Under basic conditions, all anthocyanins are less stable (a feature that increases proportionally with the pH) and can undergo different degradation pathways with subsequent loss of coloration [22]. A concentration of 0.1% in methanol is a common solvent for spectroscopic analysis [23,24,25]. The strong color of anthocyanins in acidic media is associated with their high molar extinction coefficient in the visible light range between 500 and 550 nm, depending on the molecule [26].
The eluent solvent was passed through the column after loading 2 mL of the extract. The mobile phase differentially interacted with the phytochemicals present in the extract, causing them to migrate at different rates toward the bottom of the column, based on their affinity towards the stationary phase. Orange–red pigments were moving faster, while purple–blue bands were tightly bound. Yellow flavonoid bands were eluted last. Methanol alone could elute the orange pigments, but the purple–bluish pigments could not be carried down the column prior to the acidification of the mobile phase.
2.4. Thin-Layer Chromatography
Thin-layer chromatography (TLC) of red petal segments was carried out on 2.5 × 7.5 cm silica gel plates (Kieselgel Merck, Darmstadt, Germany). Chromatograms were developed with the elution solvent system BAW (n-butanol: CH3COOH: H2O (4:1:5 by volume, upper phase).
2.5. Absorption Spectroscopy
Spectral measurements of column chromatography extracts were recorded over the wavelength range 240–800 nm in steps of 0.1 nm with a Jasco V-630 double beam spectrophotometer (Jasco Inc., Tokyo, Japan). A scan from 240 to 800 nm (ultraviolet to near infrared region) was performed to generate the characteristic absorption spectra of the extracts.
2.6. Circular Dichroism Spectroscopy
Circular dichroism (CD) spectra were obtained in the UV and visible (210–650 nm) range using a Jasco J-1500 spectropolarimeter (Jasco Inc., Tokyo, Japan) equipped with a circulation thermostat unit (Jasco Inc., Tokyo, Japan CTU-100), using a range of different dilutions of the extracts. Petal segments were extracted in a 70:30 ethanol–water mixture. Near-UV and visible CD spectra were recorded with a 0.1 cm (linear) path length quartz cuvette, a 1 nm bandwidth, and a scan rate of 100 nm min−1, according to the measured high tension (HT) voltage in each sample. For each spectrum, three scans were averaged, and the poppy extract concentration was checked by UV and visible absorption spectra. CD spectra of the appropriate blanks (70:30 ethanol–water) were used as a baseline and subtracted from the petal extract spectra in the same solvent.
2.7. Statistical Analysis
Given the small sample size, the Central Limit Theorem criteria are not met, and thus, the use of parametric tests is not recommended, since the test results might not be very meaningful. Further, as the measurement areas are in the same petal per case, the individual measurements should not be considered independent. Instead, they represent repeated measurements within each of the six independent subjects (i.e., petals). To account for this within-subject structure, we used Friedman’s Test (non-parametric counterpart of one-way RM-ANOVA), which ranks the values within each petal, allowing it to detect consistent differences across the different petal areas while controlling for variation between petals. Regarding multiple comparisons, due to the increased number of pairwise comparisons per case, the Stepwise Step-down method was chosen, rather than All Pairwise, to avoid excessively strict alpha levels because of the Bonferroni Correction.
3. Results
3.1. Color Analysis
The discs sampled from the periphery on the petals (i.e., areas 1, 5, and 6 in Figure 2A) displayed, on average, a higher green color intensity compared with the rest of the disks sampled from the red part of the petal (i.e., areas 2, 3, 4, 7, and 8, Figure 2B, 3). The higher green intensity at the petal periphery could be attributed to spatial differences in pigment composition and/or concentration.
The analysis also showed that, as we move towards the base of the petal (i.e., areas 8 and 9), the blue color intensity increases, while the dark spot at the base displays the lowest red color intensity and the highest blue and green color intensities compared with the rest of the sampled areas (Figure 2B).
Friedman’s Test showed that, overall, the distributions of the individual RGB channel values differ significantly between the measurement areas (pRGBB = 0.016, pRGBG = 0.025, and pRGBR = 0.019, Table 1). The multiple comparisons procedure (Table 2) indicates that for the distributions of the RGBB and RGBR channels, Area 9 differs significantly from all other areas which do not differ between them (except RGBR Areas 9 and 5 and RGBB Areas 9 and 8, which appear to be the same, albeit marginally so, adjusted p = 0.063 for each subset). Regarding channel RGBG, only Areas 3 and 9 seem to be different.

Table 1.
Summary of Friedman’s Test results.
Table 2.
Results of multiple comparisons (Stepwise Step-down) procedure for the Friedman’s Test. Groups of individual values not appearing in the same subset (column) differ significantly.
3.2. Column Chromatography Elution Profile
Vividly colored bands appeared in the column. More intense purple and blueish pigments are highly retained and are the most diffused in the column material. Five pigments were separated in the extracts of the fully red petal segments (Figure 3). Uneven distribution of the pigments was observed after column chromatography of different segments of the petals. Column chromatography of black spot extracts revealed an anthocyanin and a pale-yellow flavonoid compound successively (Figure 4).
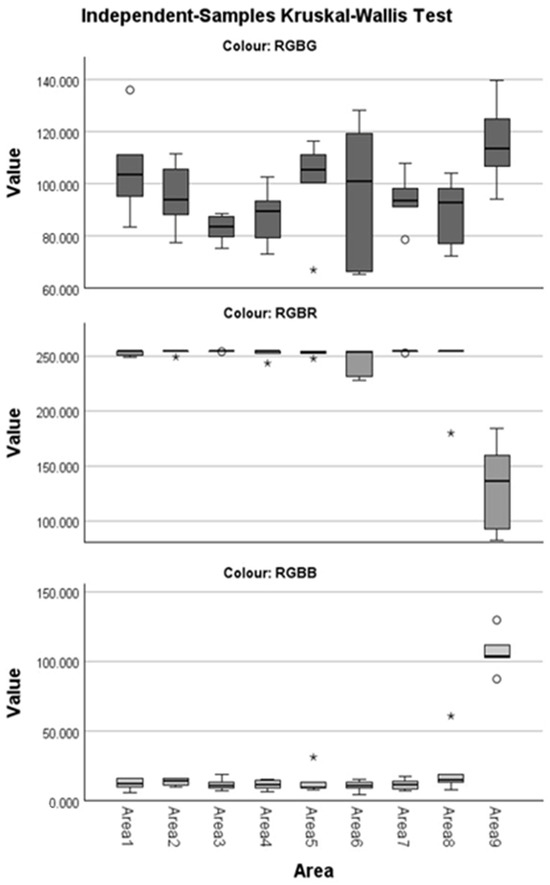
Figure 3.
Boxplots by component RGBR, RGBG, and RGBB. A circle indicates mild outliers (Q1 − 1.5 IQR or Q3 +1.5 IQR), and with an asterisk, the extreme outliers (Q1 − 3 IQR or Q3 + 3 IQR).
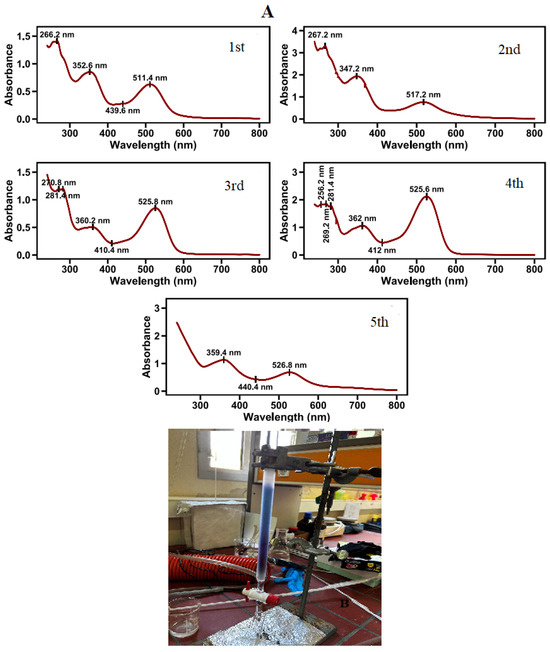
Figure 4.
Absorption spectra of pigments in water extracts of red petal segments, after chromatographic separation in acidified methanol, as described in the materials and methods (A). Photo of column chromatography separation of fully red petals (B).
3.3. UV–vis Spectral Analysis
The UV–vis absorption spectra of eluted fractions can provide useful information about the structure of anthocyanins and flavonoids contained therein. Although a mass or NMR spectrometer is more frequently used for precise structural elucidation of anthocyanins [27], the UV–vis absorption spectral data are still useful to characterize unsaturation and the presence of functional groups in the various components of the anthocyanin structure [28]. Optical absorption bands in the UV–vis region arise from transitions of electrons in a ground to various excited states; the peak band wavelength indicates the energy difference between ground and excited states, while the strength of the absorption depends mostly on the existence of a sizeable transition electric dipole moment (i.e., linear movement of the electron) [29]. Anthocyanin structure is challenging even for anthocyanins that share the same aglycone modifications in the structure, as the number, the location, and the nature of sugars bonded to the molecule core, the number and the type of aromatic and aliphatic acids linked to the sugar cause red or blue shifts in the wavelength maxima. The three main classes of anthocyanins, those based on pelargonidin (Pg), cyanidin (Cy), and delphinidin (Dp), are well differentiated spectrally, which reflects on their characteristically different colors in elution solvents [23]. Anthocyanidins within each class have similar spectral characteristics (e.g., cyanidin and peonidin have similar spectral characteristics, and delphinidin, petunidin, and malvidin also have similar spectral characteristics [30]. The basic anthocyanidin structure is composed of two aromatic rings (A and B) linked by a central heterocyclic ring. Colors ranging from red to purple and blue, as well as diverse intermediate hues, naturally occurring in plants, are produced by different patterns of hydroxylation, methylation, glycosylation, and possible acylation of the anthocyanidins [31]. Spectral acquisition provided information about (1) the nature of the aglycone, (2) the sugar substitution pattern, and (3) the presence or absence of hydroxy aromatic organic acids. The position of the visible maxima, the existence of UV-A absorbance, and the percentage intensity of absorption at 440 nm compared with that at the maximum visible range wavelength (i.e., between 500 and 550 nm) were measured, and the results were collected.
3.3.1. Anthocyanins in Red Petal Segments
Five pigments were separated with column chromatography from the red areas of poppy petals (Figure 4). The most abundant pigment is the one eluted fourth. Cyanidin glucosides are in greater proportion in the pigment mixture [32]. The positions of UV and visible wavelength maxima (λmaxUV and λmaxVis, respectively) and the ratio of A440 to AmaxVis, absorbance are presented in Table 3.
Table 3.
Spectral characteristics of column chromatography-eluted pigments from red segments of P. rhoeas petals.
The spectral characteristics of isolated pigments, combined with their elution order, provide valuable structural information. All five pigments show absorption peaks in the 340–360 nm region, indicating anthocyanin–flavonol covalent complexes [34,35]. In the past, a few compounds have been reported where an anthocyanin was attached covalently to a flavonoid co-pigment [36,37,38]. The anthocyanidins elute from polar columns in the order corresponding to the hydroxylation pattern in the B ring. As the number of free hydroxyl groups increases, retention on the polar stationary phase column also increases [39]. For identical glycosides, the elution order is as follows (listed from the earliest eluting or least retained to the latest eluting, or most retained): malvidin, peonidin, pelargonidin, petunidin, cyanidin, delphinidin [40]. In general, for the same aglycone, diglycosides are eluted more rapidly than monoglycosides, which in turn are eluted more rapidly than the aglycone. The type of sugar also greatly affects retention. A previous study of several Vaccinium species showed that for the same aglycone, in reverse phase chromatography, the 3-galactoside eluted before the 3-glucoside, which in turn eluted before the 3-arabinoside [41], while for pigments extracted from petals of Gladiolus cultivars, the elution order is the following: 3-sophoroside; 3-galactoside; 3-glucoside; 3-rutinoside [41]. In acidic methanol solutions, pelargonidin 3-glycosides exhibit an λmaxVis at about 505 nm, cyanidin and peonidin 3-glycosides have an λmaxVis at 520–526 nm, and delphinidin derivatives (delphinidin, malvidin, and petuinidin) at 532–537 nm [30]. Methoxy substitution on the B ring causes a bathochromic shift to the visible spectra, and a methoxy group on the C3’ position on the B ring had a greater impact on the bathochromic shift than that on the C5’ position [42].
UV spectral data also provide information about the number and types of glycosylations. The A440/AmaxVis ratio is two times higher when the glycosidic substitution occurs at position 3 than at position 5 or at both positions 3 and 5. In general, an A440/Amaxvis absorptivity ratio of 0.29–0.35 indicates a monoside, a lower value of 0.15–0.24 is observed for a bioside, whereas higher ratios equal to 50 were recorded in less common structures such as the 4-substituted monoglycosylated cyanidin derivative [43]. The glycosylation ratio of the pigments contained in the analyzed red petal segments ranges between 0.30 and 0.62 (Table 3). This is consistent with previous research results where 3-monoglycosides or 3-diglucosides were detected in P. rhoeas petals [33,44].
Elution order is related to pigment polarity. The first eluted compound has fewer polar groups, while the most polar compound is more tightly bound because of the hydrogen bonds it forms with the hydroxyl groups of the silica stationary phase. The first eluted pigment of red petal segments could be assigned to either peonidin or pelargonidin, yet its low λmaxVis points towards a glycoside of pelargonidin. Peonidin glycosides are less polar than pelargonidin glycosides, but their peonidin and cyanidin have similar λmaxVis. The later eluted pigments, based on their spectral characteristics in the visible spectrum, could be assigned to glycosides attached to cyanidin. Glycosides can display different hydrophilicity, and this is consistent with their elution order in column chromatography. The second eluted pigment in our column chromatography has a λmaxVis of 517 nm and stands out for its bright red color.
The last three compounds eluted in our column chromatography, displayed similar λmaxVis between 525 and 527 nm. Cyanidin 3-monoglucoside displays a λmaxVis at 525 nm, while cyanidin 3-rhamnoglucoside or cyanidin-3-xyloglucoside displays λmaxVis values at 523 nm in 0.01% acidic methanolic solution [20]. Among cyanidin glucosides, polarity increases from rutinoside to monoglucoside and finally sophorose so that they may elute from column chromatography in reverse order. Cyanidin 3-rutinoside, cyanidin 3-glycoside, and cyanidin 3-sophoroside have been previously reported to appear in P. rhoeas flowers [24,44,45].
3.3.2. Anthocyanins in the Black Basal Area
The black spot at the base of the flower petals exhibits a totally different pigment profile compared with the remainder of the petals. In the black spots of the six petals, a more bluish anthocyanin showed a bathochromic shift on spectra (λmaxVis = 530 nm), compared with that of corresponding cyanidin glycosides (Table 3), while a yellow flavonoid displays an absorption peak at 344 nm (Figure 5C,D). TLC silica gel plate chromatography of the black spot region aqueous extracts prior to column chromatography shows a deep purple spot at the starting line and a yellow spot at the solvent front. TLC results further confirm the co-occurrence of a flavonol glycoside and a new anthocyanin in the black spot areas of poppy petals (Figure 5B). The new anthocyanin has spectral characteristics of delphinidin derivatives (delphinidin, malvidin, and petunidin) and an aromatic acylation agent (λmax in UVB at 330 nm) [30]. In addition to our λmax findings, the pronounced absorbance at ~530 nm, the pigment’s immobility (Rf = 0) on silica gel TLC in BAW, suggests the presence of a highly retained pigment [46]. This behavior supports the hypothesis that a strongly polar or structurally complex anthocyanin derivative is involved—characteristics consistent with a delphinidin-based pigment [47].
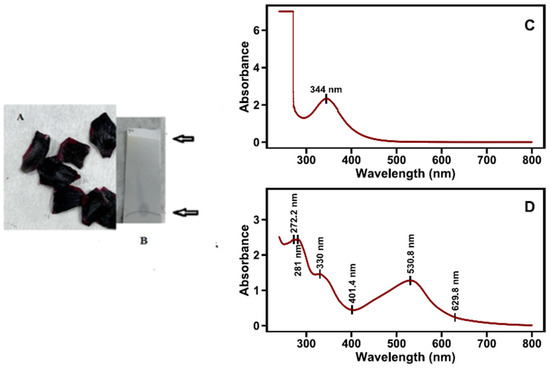
Figure 5.
The black spot region of poppy petals (A), TLC of aq. black spot extract (B). Absorption spectra of the two separated fractions after column chromatography (top, yellow, flavonol, (C); bottom, intense dark blue, (D)).
The coexistence of flavonoids and anthocyanins usually gives rise to a co-pigmentation phenomenon because of intermolecular forces [48,49,50].
The spectrum of the yellow flavonol follows the trend of strong absorption in the long wavelength Band I region, 320–385 nm, with significant tailing in the 400–450 nm region [51]. This is consistent with the argument that East Mediterranean flower petals contain high amounts of UV-absorbing flavonol glycosides [10]. Anthocyanin–flavonoid complexes have been related to inter- or intramolecular co-pigmentation, presumably caused by vertical π-π stacking of the anthocyanin and the flavone/flavonol substituent [34,52]. This fact is consistent with color analysis (Figure 2), which also showed that, as we move towards the base of the petal (i.e., areas 8 and 9), the blue color intensity increases.
3.3.3. Pigments in the Lateral Peripheral Area of Poppy Petals
Segments of the lateral peripheral area of poppy petals (corresponding to the area between the 4 and 5 sampling areas in Figure 2A) were extracted and then subjected to column chromatography (Figure 5, photo inset). Two major pigments were eluted. The pigment with the lower concentration in the mixture is the one eluted first. Its spectral characteristics include a λmaxUV at 266 nm, a λmaxVis at 507 nm, two plateaus around 353 nm and 425 nm, and an A440/AmaxVis ratio equal to 0.60. Although the A440/AmaxVis is quite high, the λmaxVis corresponds with a pelargonidin derivative at a different λmax (511.4 nm). This is in agreement with previous studies, which prove the existence of pelargonidin in P. rhoeas flowers [33]. The most abundant pigment in the lateral peripheral area of poppy petals is the last eluted cyanidin-based pigment with λmax values at 281 and 526 nm, with an A440/AmaxVis ratio equal to 0.28 (Figure 6). A cyanidin glycosylation ratio value of 0.28 is under the limit of 0.30, leading to the possibility of a 5-glycoside or 3,5 diglycoside [43].
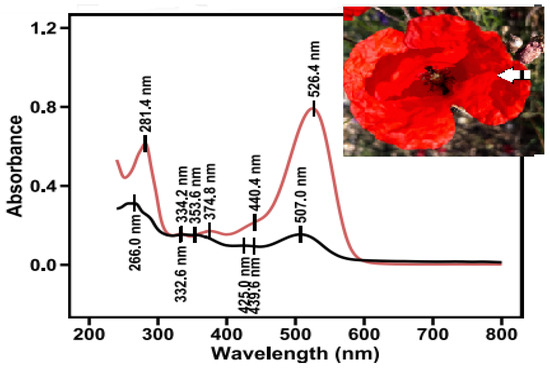
Figure 6.
Absorption spectra of pigments from the lateral peripheral area of red petal segments, after separation by column chromatography. The arrow indicates the peripheral segment.
3.4. Circular Dichroism Spectra
Circular dichroism is the result of the differential absorption by a substance of left vs. right circularly polarized light [29]. This can happen when there are certain electronic transitions in a substance with a magnetic transition dipole moment (essentially, some circular movement of the electron during the transition) [29]. Such “magnetically allowed” electronic transitions are not evidenced in UV–vis absorption spectroscopy [29]. The phenomenon of circular dichroism can further arise from the coupling of electronic transitions among different or identical substances in the same solution and in close proximity to one another. Simply put, circular dichroism of a mixture of compounds in solution (as in the case of flower pigment extracts) can arise from 1. The coupling of an electrically allowed with a magnetically allowed transition in the same substance. 2. The coupling of the electric transition dipole moments between two or more substances. 3. The coupling of the electric transition dipole moment of one substance with the magnetic transition dipole moment of a different substance. The absorption and circular dichroic spectra in the UV–vis region (650–210 nm) of 70% ethanolic aqueous extracts of red petals and their dark base are quite distinct from each other (Figure 7). This is as expected because of their distinct constituent composition, as shown in the present and previous studies using column chromatography and TLC (Figure 4 and Figure 5) [19].
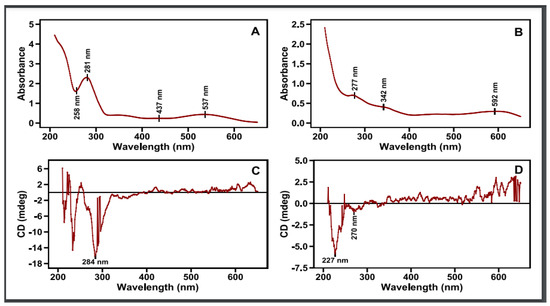
Figure 7.
UV–vis spectrum (up) (A,B) and (C,D) spectrum (bottom) of petals’ red (left) and black (right) zones of the respective extracts in 70:30 ethanol–water solvent mixture.
The absorption spectrum of the red petal ethanolic extract with a dark red coloration shows a broad peak centered at 537 nm and a minor less broad at 437 nm, in the visible spectrum, with a more intense spectrum in the UV region: a peak at 281 and a more intense one at 211 nm with a minimum at 258 nm. As this cannot arise from any simple and linear combination of the spectra of the constituent parts (Figure 4 and Figure 6), it must be the product of various interactions among the several chromophores in the red petals of the poppy. The respective circular dichroic (CD) spectrum shows a few small peaks in the visible spectrum at 490 and 548 nm and an intense negative peak at 284 nm, a crossover at 259 nm (CD = 0), and a smaller positive peak at 244 nm. Not much can be said about the region < 230 nm because of its high absorption and the consequent high noise in the CD spectrum. The absence of significant peaks in the CD spectrum in the visible region, despite two obvious broad absorption peaks, in conjunction with the established presence of several pigments in the red petals via chromatography, suggests an arrangement of these pigments that cancels out any resulting interactional optical activities. It is tempting to attribute the negative CD peak centered at ca. 284 nm to the 281 nm absorption peak. Yet the presence of the positive CD peak at 244 nm suggests some type of more complex spectral phenomenon (from a magnetically allowed/electrically forbidden transition to interchromophore interaction(s)).
Turning our attention to the dark blue base extract, we notice that in the absorption spectrum there is a very broad band centered at 592 nm and extending all the way into the visible region, while in the UV region there is a continuous rise in the absorption, with two larger peaks at 342 and 277 nm (Figure 7). Again, this spectrum is more than the sum of its two components, as revealed by chromatography, the dark blue anthocyanin (λmax at 530 and 320 nm) and the yellow flavonol (λmax at 340 nm) (Figure 5). By contrast, the respective CD spectrum has a broad positive peak centered over 600 nm, smaller positive broad peaks in the visible, and a very sharp negative peak centered at 227 nm. There is also a minor negative peak at 270 nm. The relative dissonance between the occurrence of absorption peaks and CD peaks is consistent with extensive interactions among the component pigments [29]. These differences could be well exploited in the future in distinguishing among cultivars that show differences in the absorption and circular dichroism spectra of their flower extracts and compared with current methods [53].
4. Discussion
The increasing content of several anthocyanins in the red poppy P. rhoeas petals during development of the flower from the closed bud until the fully opened flower has been investigated by Matysik and Benesz, 1991 [54] using simple gradient TLC. This is indicative of uneven rates of biosynthesis of the individual anthocyanins and their transformations. HPLC analysis of poppy extract from southern Serbia revealed a complex anthocyanin profile dominated by cyanidin and delphinidin derivatives, with pelargodin glycosides notably absent. However, that study did not examine the intra-spatial variability in the pigment spectra within the petals [44]. On the University of Ioannina campus, we found poppy populations possessing typical red petals containing several glycosidic cyanidin derivatives with a high aromatic component. As a general trend in absorption spectra, an increasing number of hydroxyl groups (pelargonidin → cyanidin → delphinidin) might be responsible for a bathochromic shift, whereas increased methylation (cyanidin → peonidin → malvidin) could result in a hypsochromic shift [43]. The color of petals differs in the blooming period depending on the blooming stage and the petal age. We found that the typical red petals of poppies contain the highest proportion of cyanidin derivatives (cyanidin and peonidine absorb in the same region of the electromagnetic spectrum). Orange coloration is also observed in natural populations, and this is the result of a differential pigment composition dominated by different pelargonidin glycosides with varied λmaxVis, a lower percentage of cyanidin derivatives, and the presence of flavonols (unpublished data). We detected flavonol or flavanol glycosides in the black spot areas of poppy petals. This agrees with previous reports, where several flavonol glycosides, single phenolic compounds, and depsides were isolated and identified in the ethyl acetate fraction of P. rhoeas petals [15]. The absorption and CD spectra of 70% ethanolic deep red extracts of red petals and the dark blue base are consistent with extensive interactions among the several constituent components. Further analysis of various dilutions and comparison with constituent absorption and CD spectra will be necessary (especially in the case of the dark base, where we are dealing with only two component pigments) in order to better specify the nature of such interactions. CD spectra provide insight into pigment–pigment interactions, enabling the interpretation of their three-dimensional structure that leads to the unique color. In the red portion of the petal, five distinct pigments with different individual colors combine to yield an intense red coloration, whereas the dark blue basal region contains two pigments, one yellow flavonol and a cyanic anthocyanin, which in situ combine to result in a dark blue, almost black color.
Column chromatography is an inexpensive, easy, and reproducible technique. Silica gel as a stationary phase can be used for the separation of anthocyanins based on their polarity. Column chromatography is used as a first step for screening the distribution across the petals, and especially in the black spot. Detailed spectral analysis reveals the fingerprint of hydroxylation pattern, mono- or di-glycosidic substitution, and the presence of aromatic moieties. Any changes in pigment biosynthesis during the developmental stages of the poppy blossom or in different populations in the area of Epirus can be easily documented by this approach.
Flavonols have a dual function in the red poppy flower due to their antioxidant and UV-screening functions, which make them critical for plant adaptation to climate change, especially in the Mediterranean area [48,55,56]. Extraordinary absorption maxima in the UV region at 340–360 nm were detected in the eluted pigments from the red petal extract. Red petal segments indicate a case of flavonols covalently attached to anthocyanin molecules. Instead, in the spectra of anthocyanin in black spot, the UV max is located at 330 nm, indicating aromatic acylation. A UV pattern is observed with fluctuations in UV maxima between the red petals and the black spot area. Similar findings have been previously reported for the blue flowers of Agapanthus, where both types of co-pigment agents, an aromatic acyl group and a flavonoid co-pigment, are attached covalently to the anthocyanin [36]. It has been hypothesized that noncovalent (supramolecular) forces appear between covalent anthocyanin–flavonol complexes and were presumed to maintain a stable intramolecular association between anthocyanin and flavonol units, similar to those observed between anthocyanin and hydroxycinnamic acid residues in polyacylated anthocyanins [48].
In the dark spot region of P. rhoeas petals, the coexistence of a flavonol and an anthocyanin with spectral characteristics of delphinidin derivatives (delphinidin, malvidin, and petunidin) may hint at a new co-pigmentation effect when compared with the pigment composition of the red petal areas, with a likely enhancement of the black spot area color because of intermolecular forces. Underlying mechanisms may include stacking hydrophobic forces, van der Waals forces, hydrogen bonding, and ionic interactions [50,57]. All these types of interactions have been suggested for this type of arrangement with either the flavylium cation or the quinoidal base form of anthocyanins [52]. The nature and strength of all these interactions can only be deciphered by X-ray crystallography or NMR imaging of pigment assemblies [49,58]. The detection of flavonols in the black spot region may suggest a bullseye pattern in the UV spectrum in poppy flowers [3]. The bullseye pattern is known to increase pollinator attraction. Many such guides consist of patterns of differential ultraviolet (UV) reflection, making them visible to most pollinating insects but invisible to humans [59]. The red areas of poppy petals possess more complex anthocyanin profiles with a high aromatic acylation component and a glycosylation ratio similar to monoglucosides. UV–visible absorption spectra of the examined petal areas differ in terms of absorption maxima and overall shape, demonstrating that the red color of the flower is due to an inhomogeneously distributed mixture of flavonoids across the entire petal. The black spot region at the base of the petal contains an anthocyanin and a yellow flavonol, which likely interact in an unknown way to give rise to a co-pigmentation effect (non-additivity of individual absorption spectra). The flavonoid branch of phenylpropanoid biochemical pathways that produces visible and UV-spectral anthocyanins, flavonoids, is well characterized, which has enabled elaborate studies about the evolution of floral color. This is fundamental for the understanding of the underlying molecular genetics [6,60]. R2R3-MYB transcription factors are key regulators of variation in overall floral color and floral pigment patterning (e.g., anthocyanic lines and spots) in a variety of distantly related angiosperms [61]. The chromatographically separated anthocyanin pigments were positively identified, in addition to their chromatographic characteristics, via UV–vis spectrophotometry. All five pigments show absorption peaks in the 340–360 nm in the UV, consistent with the presence of acylated aromatic derivatives, and between 512 and 527 nm in the visible region of the spectrum. The analysis of the dark spot at the base of the petal revealed a new, more bluish anthocyanin with a λmax in the visible region at 530 nm and a yellow flavonol with a λmax at 344 nm. The RGB color analysis is consistent with spectral and spatial variation in the petals’ surface, with increasing blue color intensity from the top to the base.
5. Conclusions
Our analytical work examining the absorption spectra of chromatographically isolated anthocyanin pigments of P. rhoeas petals (looking at slightly distinct petal colorations, as well as different areas of the petals) revealed the presence of cyanidin, pelargonidin, and delphinidin-conjugated glycosides and yellow flavonoids. The UV–visible absorption spectra of the eluted fractions in the red petal revealed five pigments, each pigment belonging to a different elution zone. Our column chromatography analysis results revealed a new, previously unreported anthocyanin localized in the black basal area of the petal, distinct from the pigments in the red portion of the petal. The anthocyanin exhibits λmax = 530 nm, and the pigment’s immobility (Rf = 0) on silica gel TLC in BAW suggests the presence of a highly retained polar pigment such as a delphinidine derivative. The RGB color analysis gave distinct chromatic zones across the petal, with the blue component increasing towards the basal area of the petal. This gradient correlates with the localization of the pigments’ composition mixture. The absorption and circular dichroism spectra of red petal and deep blue base aqueous extracts reveal possible patterns of pigment interaction giving rise to the given colors. The distribution of pigments throughout the petals engenders a unique biochemical versatility to the color pattern, which can act as a communication signal and form identification patterns for pollinators [3,62]. In this sense, it is suggested that the content and the role of flavonols in the UV-reflectance floral pattern of poppy should be further investigated.
Author Contributions
Conceptualization, P.M.; methodology, P.M.; software, O.G., E.S., D.K., and N.M.; validation, V.P. and S.M.; formal analysis, V.P. and P.M.; investigation, P.M., C.Y., V.P., and SM.; resources, S.M.; data curation, P.M.; writing—original draft preparation, C.Y., V.P., and S.M.; writing—review and editing, C.Y., V.P., and S.M.; visualization, C.Y., O.G., E.S., D.K., N.M., V.P., and S.M.; supervision, S.M. All authors have read and agreed to the published version of the manuscript.
Funding
This research received no external funding.
Institutional Review Board Statement
Not applicable.
Informed Consent Statement
Not applicable.
Data Availability Statement
The data presented in this study are available on request from the corresponding authors, P.M. and S.M.
Acknowledgments
This research was conducted from general purpose university funds and received no specific grant from any funding agency in the public, commercial, or not-for-profit sectors. The authors thank George K. Papadopoulos, from the Technological Institute of Epirus, Faculty of Agricultural Technology, for his substantial contribution to flower color research and constructive suggestions. Also, the authors express gratitude to Michaela Patila, Postdoctoral Researcher in the Laboratory of Biotechnology at the Department of Biological Applications and Technology, who was responsible for the acquisition of the CD spectra.
Conflicts of Interest
The authors declare no conflicts of interest.
References
- Santos, E.L.; Maia, B.H.L.N.S.; Ferriani, A.P.; Teixeira, S.D. Flavonoids: Classification, Biosynthesis and Chemical Ecology. Flavonoids-Biosynth. Hum. Health 2017, 78–94. [Google Scholar] [CrossRef]
- van der Kooi, C.J.; Stavenga, D.G. Vividly Coloured Poppy Flowers Due to Dense Pigmentation and Strong Scattering in Thin Petals. J. Comp. Physiol. A 2019, 205, 363–372. [Google Scholar] [CrossRef]
- Koski, M.H.; Ashman, T.L. An Altitudinal Cline in UV Floral Pattern Corresponds with a Behavioral Change of a Generalist Pollinator Assemblage. Ecology 2015, 96, 3343–3353. [Google Scholar] [CrossRef]
- Richter, R.; Dietz, A.; Foster, J.; Spaethe, J.; Stöckl, A. Flower Patterns Improve Foraging Efficiency in Bumblebees by Guiding Approach Flight and Landing. Funct. Ecol. 2023, 37, 763–777. [Google Scholar] [CrossRef]
- Dafni, A.; Lehrer, M.; Keyan, P.G. Spatial Flower Parameters and Insect Spatial Vision. Biol. Rev. 1997, 72, 239–282. [Google Scholar] [CrossRef]
- Grotewold, E. The Genetics and Biochemistry of Floral Pigments. Annu. Rev. Plant Biol. 2006, 57, 761–780. [Google Scholar] [CrossRef] [PubMed]
- Smith, J.A.; Brown, L.T. The impact of floral spot and ring markings on pollinator foraging dynamics. J. Pollinat. Ecol. 2021, 15, 112–120. [Google Scholar] [CrossRef]
- Wu, J.-F.; Chen, Z.-Q.; Wang, X.-L.; Tu, Y.-L.; Wang, L.-L.; Yang, Y.-P.; Meng, L.-H.; Duan, Y.-W. From a Bee’s Eye: Effects of UV Bullseye Size on Reproductive Success in a Dioecious Vine Herpetospermum pedunculosum (Cucurbitaceae). Plant Divers. 2024, 46, 766–773. [Google Scholar] [CrossRef]
- Tunes, P.; Camargo, M.G.G.; Guimarães, E. Floral UV Features of Plant Species from a Neotropical Savanna. Front. Plant Sci. 2021, 12, 618028. [Google Scholar] [CrossRef]
- Dudek, B.; Schneider, B.; Hilger, H.H.; Stavenga, D.G.; Martínez-Harms, J. Highly Different Flavonol Content Explains Geographic Variations in the UV Reflecting Properties of Flowers of the Corn Poppy, Papaver rhoeas (Papaveraceae). Phytochemistry 2020, 178, 112457. [Google Scholar] [CrossRef]
- Pinke, G.; Kapcsándi, V.; Czúcz, B. Iconic Arable Weeds: The Significance of Corn Poppy (Papaver rhoeas), Cornflower (Centaurea cyanus), and Field Larkspur (Delphinium consolida) in Hungarian Ethnobotanical and Cultural Heritage. Plants 2023, 12, 84. [Google Scholar] [CrossRef]
- Butnariu, M.; Quispe, C.; Herrera-Bravo, J.; Pentea, M.; Sarac, I.; Küşümler, A.S.; Özçelik, B.; Painuli, S.; Semwal, P.; Imran, M.; et al. Papaver Plants: Current Insights on Phytochemical and Nutritional Composition Along with Biotechnological Applications. Oxid. Med. Cell Longev. 2022, 2022, 2041769. [Google Scholar] [CrossRef]
- Oh, J.H.; Ha, I.J.; Lee, M.Y.; Kim, E.O.; Park, D.; Lee, J.H.; Lee, S.G.; Kim, D.W.; Lee, T.H.; Lee, E.J.; et al. Identification and Metabolite Profiling of Alkaloids in Aerial Parts of Papaver rhoeas by Liquid Chromatography Coupled with Quadrupole Time-of-Flight Tandem Mass Spectrometry. J. Sep. Sci. 2018, 41, 2517–2527. [Google Scholar] [CrossRef]
- Grauso, L.; de Falco, B.; Motti, R.; Lanzotti, V. Corn Poppy, Papaver rhoeas, L.: A Critical Review of Its Botany, Phytochemistry and Pharmacology. Phytochem. Rev. 2021, 20, 227–248. [Google Scholar] [CrossRef]
- Hillenbrand, M.; Zapp, J.; Becker, H. Depsides from the Petals of Papaver rhoeas. Planta Med. 2004, 70, 380–382. [Google Scholar] [CrossRef] [PubMed]
- Dudek, B.; Warskulat, A.-C.; Schneider, B. The Occurrence of Flavonoids and Related Compounds in Flower Sections of Papaver nudicaule. Plants 2016, 5, 28. [Google Scholar] [CrossRef]
- Lunau, K.; Ren, Z.X.; Fan, X.Q.; Trunschke, J.; Pyke, G.H.; Wang, H. Nectar Mimicry: A New Phenomenon. Sci. Rep. 2020, 10, 7039. [Google Scholar] [CrossRef] [PubMed]
- Harborne, J.B. Biochemistry of Plant Pollination. In Introduction to Ecological Biochemistry; Academic Press: Cambridge, UK; London, UK, 1993; pp. 36–70. [Google Scholar] [CrossRef]
- McNaughton, I.H.; Harper, J.L. The comparative biology of closely related species living in the same area. New Phytol. 1960, 59, 15–26. [Google Scholar] [CrossRef]
- Abrol, D.P. Biochemical Basis of Plant-Pollination Interaction. In Pollination Biology; Springer: Dordrecht, The Netherlands, 2012; pp. 413–458. [Google Scholar] [CrossRef]
- Xue, H.; Zhao, J.; Wang, Y.; Shi, Z.; Xie, K.; Liao, X.; Tan, J. Factors Affecting the Stability of Anthocyanins and Strategies for Improving Their Stability: A Review. Food Chem. X 2024, 24, 101883. [Google Scholar] [CrossRef] [PubMed]
- Cruz, L.; Basílio, N.; Mateus, N.; De Freitas, V.; Pina, F. Natural and Synthetic Flavylium-Based Dyes: The Chemistry behind the Color. Chem. Rev. 2022, 122, 1416–1481. [Google Scholar] [CrossRef]
- Harborne, J.B. Spectral Methods of Characterizing Anthocyanins. Biochem. J. 1958, 70, 22–28. [Google Scholar] [CrossRef]
- Harborne, J.B.; Williams, C.A. Anthocyanins and Other Flavonoids. Nat. Prod. Rep. 2001, 18, 310–333. [Google Scholar] [CrossRef]
- Taghavi, T.; Patel, H.; Rafie, R. Comparing PH Differential and Methanol-Based Methods for Anthocyanin Assessments of Strawberries. Food Sci. Nutr. 2022, 10, 2123–2131. [Google Scholar] [CrossRef]
- Mattioli, R.; Francioso, A.; Mosca, L.; Silva, P. Anthocyanins: A Comprehensive Review of Their Chemical Properties and Health Effects on Cardiovascular and Neurodegenerative Diseases. Molecules 2020, 25, 3809. [Google Scholar] [CrossRef]
- Carlomagno, T. NMR in Natural Products: Understanding Conformation, Configuration and Receptor Interactions. Nat. Prod. Rep. 2012, 29, 536–554. [Google Scholar] [CrossRef] [PubMed]
- Dong, W.; Yang, X.; Zhang, N.; Chen, P.; Sun, J.; Harnly, J.M.; Zhang, M. Study of UV–Vis Molar Absorptivity Variation and Quantitation of Anthocyanins Using Molar Relative Response Factor. Food Chem. 2024, 444, 138653. [Google Scholar] [CrossRef] [PubMed]
- Schellman, J.A. Symmetry Rules for Optical Rotation. Acc. Chem. Res. 1968, 1, 144–151. [Google Scholar] [CrossRef]
- Hong, V. Characterization of Anthocyanins in Fruit Juices and Natural Colorants. Ph.D. Thesis, Oregon State University, OR, USA, 1987. [Google Scholar]
- Kovinich, N.; Kayanja, G.; Chanoca, A.; Riedl, K.; Otegui, M.S.; Grotewold, E. Not All Anthocyanins Are Born Equal: Distinct Patterns Induced by Stress in Arabidopsis. Planta 2014, 240, 931–940. [Google Scholar] [CrossRef]
- Giusti, M.M.; Wrolstad, R.E. Characterization and Measurement of Anthocyanins by UV-Visible Spectroscopy. Curr. Protoc. Food Anal. Chem. 2001, 1, F1.2.1–F1.2.13. [Google Scholar] [CrossRef]
- Harborne, J.B. Anthocyanins and Their Sugar Components. Fortschr. Chem. Org. Naturst. 1962, 20, 165–199. [Google Scholar] [CrossRef]
- Fossen, T.; Rayyan, S.; Holmberg, M.H.; Nimtz, M.; Andersen, Ø.M. Covalent Anthocyanin–Flavone Dimer from Leaves of Oxalis Triangularis. Phytochemistry 2007, 68, 652–662. [Google Scholar] [CrossRef] [PubMed]
- Toki, K.; Saito, N.; Iimura, K.; Suzuki, T.; Honda, T. (Delphinidin 3-Gentiobiosyl) (Apigenin 7-Glucosyl) Malonate from the Flowers of Eichhornia Crassipes. Phytochemistry 1994, 36, 1181–1183. [Google Scholar] [CrossRef]
- Bloor, S.J.; Falshaw, R. Covalently Linked Anthocyanin–Flavonol Pigments from Blue Agapanthus Flowers. Phytochemistry 2000, 53, 575–579. [Google Scholar] [CrossRef] [PubMed]
- Takeda, K.; Harborne, J.B.; Waterman, P.G. Malonylated Flavonoids and Blue Flower Colour in Lupin. Phytochemistry 1993, 34, 421–423. [Google Scholar] [CrossRef]
- Wang, J.; Zhao, Y.; Sun, B.; Yang, Y.; Wang, S.; Feng, Z.; Li, J. The Structure of Anthocyanins and the Copigmentation by Common Micromolecular Copigments: A Review. Food Res. Int. 2024, 176, 113837. [Google Scholar] [CrossRef]
- Chandra Singh, M.; Probst, Y.; Price, W.E.; Kelso, C. Relative Comparisons of Extraction Methods and Solvent Composition for Australian Blueberry Anthocyanins. J. Food Compos. Anal. 2022, 105, 104232. [Google Scholar] [CrossRef]
- Andersen, Ø.M. Anthocyanins in Fruits of Vaccinium oxycoccus L. (Small Cranberry). J. Food Sci. 1989, 54, 383–384. [Google Scholar] [CrossRef]
- Strack, D.; Akavia, N.; Reznik, H. High Performance Liquid Chromatographic Identification of Anthocyanins. Z. Naturforschung-Sect. C J. Biosci. 1980, 35, 533–538. [Google Scholar] [CrossRef]
- Han, F.L.; Xu, Y. Effect of the Structure of Seven Anthocyanins on Self-Association and Colour in an Aqueous Alcohol Solution. S. Afr. J. Enol. Vitic. 2015, 36, 105–116. [Google Scholar] [CrossRef]
- Saha, S.; Singh, J.; Paul, A.; Sarkar, R.; Khan, Z.; Banerjee, K. Anthocyanin Profiling Using UV-Vis Spectroscopy and Liquid Chromatography Mass Spectrometry. J. AOAC Int. 2020, 103, 23–39. [Google Scholar] [CrossRef]
- Velickovic, J.M.; Mitic, M.N.; Arsic, B.B.; Paunovic, D.Đ.; Stojanovic, T.; Veljkovic, J.N.; Dimitrijevic, D.S.; Stevanovic, S.D.; Kostic, D.A. HPLC Analysis of Extracts of Fresh Petals of Papaver rhoeas L. Stud. UBB Chem. 2019, 64, 239–247. [Google Scholar] [CrossRef]
- Tanchev, S.; Ioncheva, N. Products of Thermal Degradation of the Anthocyanins Cyanidin-3-Glucoside, Cyanidin-3-Rutinoside and Cyanidin-3-Sophoroside. Food / Nahr. 1976, 20, 889–893. [Google Scholar] [CrossRef]
- Santos, D.T.; Cavalcanti, R.N.; Rostagno, M.A.; Queiroga, C.L.; Eberlin, M.N.; Meireles, M.A.A. Extraction of Polyphenols and Anthocyanins from the Jambul (Syzygium cumini) Fruit Peels. Int. J. Mol. Sci. 2010, 11, 4066–4078. [Google Scholar] [CrossRef]
- Cabrita, L.; Fossen, T.; Andersen, Ø.M. Colour and Stability of the Six Common Anthocyanidin 3-Glucosides in Aqueous Solutions. Food Chem. 2000, 68, 101–107. [Google Scholar] [CrossRef]
- Trouillas, P.; Sancho-García, J.C.; De Freitas, V.; Gierschner, J.; Otyepka, M.; Dangles, O. Stabilizing and Modulating Color by Copigmentation: Insights from Theory and Experiment. Chem. Rev. 2016, 116, 4937–4982. [Google Scholar] [CrossRef] [PubMed]
- Yoshida, K.; Oyama, K.I.; Kondo, T. Structure of Polyacylated Anthocyanins and Their UV Protective Effect. Recent Adv. Polyphen. Res. 2016, 5, 171–192. [Google Scholar] [CrossRef]
- Gençdağ, E.; Özdemir, E.E.; Demirci, K.; Görgüç, A.; Yılmaz, F.M. Copigmentation and Stabilization of Anthocyanins Using Organic Molecules and Encapsulation Techniques. Curr. Plant Biol. 2022, 29, 100238. [Google Scholar] [CrossRef]
- Taniguchi, M.; LaRocca, C.A.; Bernat, J.D.; Lindsey, J.S. Digital Database of Absorption Spectra of Diverse Flavonoids Enables Structural Comparisons and Quantitative Evaluations. J. Nat. Prod. 2023, 86, 1087–1119. [Google Scholar] [CrossRef]
- Houghton, A.; Appelhagen, I.; Martin, C. Natural Blues: Structure Meets Function in Anthocyanins. Plants 2021, 10, 726. [Google Scholar] [CrossRef] [PubMed]
- Wang, H.; Fan, Y.; Yang, Y.; Zhang, H.; Li, M.; Sun, P.; Zhang, X.; Xue, Z.; Jin, W. Classification of rose petal colors based on optical spectrum and pigment content analyses. Hortic. Environ. Biotechnol. 2023, 64, 153–166. [Google Scholar] [CrossRef]
- Matysik, G.; Benesz, M. Thin-Layer Chromatography and Densitometry of Anthocyanins in the Petals of Red Poppy during Development of the Flowers. Chromatographia 1991, 32, 19–22. [Google Scholar] [CrossRef]
- Laoué, J.; Fernandez, C.; Ormeño, E. Plant Flavonoids in Mediterranean Species: A Focus on Flavonols as Protective Metabolites under Climate Stress. Plants 2022, 11, 172. [Google Scholar] [CrossRef] [PubMed]
- Shomali, A.; Das, S.; Arif, N.; Sarraf, M.; Zahra, N.; Yadav, V.; Aliniaeifard, S.; Chauhan, D.K.; Hasanuzzaman, M. Diverse Physiological Roles of Flavonoids in Plant Environmental Stress Responses and Tolerance. Plants 2022, 11, 3158. [Google Scholar] [CrossRef] [PubMed]
- Enaru, B.; Drețcanu, G.; Pop, T.D.; Stǎnilǎ, A.; Diaconeasa, Z. Anthocyanins: Factors Affecting Their Stability and Degradation. Antioxidants 2021, 10, 1967. [Google Scholar] [CrossRef] [PubMed]
- Yoshida, K.; Mori, M.; Kondo, T. Blue Flower Color Development by Anthocyanins: From Chemical Structure to Cell Physiology. Nat. Prod. Rep. 2009, 26, 884–915. [Google Scholar] [CrossRef]
- Turatbekova, A.; Nazarova, O.; Khujaev, O.; Ergashev, O.; Turapov, S.; Allenova, I.; Kuvvatova, N.; Khudayberganov, E. Study on the Frequency of Ultraviolet (UV) Light Reflectance and Absorption in Native and Nonnative Flowering Plants. E3S Web Conf. 2023, 434, 03004. [Google Scholar] [CrossRef]
- Yan, H.; Pei, X.; Zhang, H.; Li, X.; Zhang, X.; Zhao, M.; Chiang, V.L.; Sederoff, R.R.; Zhao, X. MYB-Mediated Regulation of Anthocyanin Biosynthesis. Int. J. Mol. Sci. 2021, 22, 3103. [Google Scholar] [CrossRef]
- Brock, M.T.; Lucas, L.K.; Anderson, N.A.; Rubin, M.J.; Cody Markelz, R.J.; Covington, M.F.; Devisetty, U.K.; Chapple, C.; Maloof, J.N.; Weinig, C. Genetic Architecture, Biochemical Underpinnings and Ecological Impact of Floral UV Patterning. Mol. Ecol. 2016, 25, 1122–1140. [Google Scholar] [CrossRef]
- Martínez-Harms, J.; Hadar, R.; Márquez, N.; Menzel, R.; Shmida, A.; Stavenga, D.G.; Vorobyev, M. Enhanced UV-Reflection Facilitated a Shift in the Pollination System of the Red Poppy, Papaver rhoeas (Papaveraceae). Plants 2020, 9, 927. [Google Scholar] [CrossRef]


Disclaimer/Publisher’s Note: The statements, opinions and data contained in all publications are solely those of the individual author(s) and contributor(s) and not of MDPI and/or the editor(s). MDPI and/or the editor(s) disclaim responsibility for any injury to people or property resulting from any ideas, methods, instructions or products referred to in the content. |
© 2025 by the authors. Licensee MDPI, Basel, Switzerland. This article is an open access article distributed under the terms and conditions of the Creative Commons Attribution (CC BY) license (https://creativecommons.org/licenses/by/4.0/).