Next Article in Journal
Detection of Polystyrene Nanoplastics in Biological Tissues with a Fluorescent Molecular Rotor Probe
Previous Article in Journal
Effects of Copper on the Early Development of Xenopus laevis: The case of CuSO4 and Bordeaux Mixture Solutions
 
 
Journal of Xenobiotics is published by MDPI from Volume 10 Issue 1 (2020). Previous articles were published by another publisher in Open Access under a CC-BY (or CC-BY-NC-ND) licence, and they are hosted by MDPI on mdpi.com as a courtesy and upon agreement with PAGEPress.
Article

An Amplicon-Based Sequencing Approach for the Study of Aeromycology †

by
Hamza Mbareche
1,2,*,
Marc Veillette
1,
Guillaume J. Bilodeau
3 and
Caroline Duchaine
1,2
1
Centre de Recherche de l’Institut Universitaire de Cardiologie et de Pneumologie de Québec, Quebec City, QC, Canada
2
Département de Biochimie, de Microbiologie et de Bio-informatique, Faculté des Sciences et de Génie, Université Laval, Quebec City, QC, Canada
3
Pathogen Identification Research Lab, Canadian Food Inspection Agency (CFIA), Ottawa, Canada
*
Author to whom correspondence should be addressed.
Conference presentation: part of this paper was presented at the Saint-Lawrence Chapter-SETAC Meeting, June 2018, Québec, Canada.
J. Xenobiot. 2018, 8(1), 7810; https://doi.org/10.4081/xeno.2018.7810 (registering DOI)
Submission received: 6 September 2018 / Accepted: 17 October 2018 / Published: 29 October 2018

Introduction

Fungal spores are ubiquitous in indoor and outdoor air and their diversity and biomass quantity vary depending on the geographical location, environmental conditions, and the presence of sources such as hay, agricultural crops or growth on building material [1,2]. Fungal exposure can be explained by the presence of decaying materials like, peat, wood dust, manure, biosolids, and organic wastes like compost [3]. Waste treatment plants and dairy farms are locations with high fungal exposure [4,5,6]. The health effects linked to this exposure are likely underestimated due to the presence of undocumented fungi [7]. Culture methods are still widely used to describe fungal aerosols. However, there are inherent biases associated with these methods when applied to fungal diversity analyses because most fungal species are difficult to isolate from culture. Amplicon-based sequencing is a good alternative that offers a more detailed analysis of the microbial composition of aerosol samples due to the millions of sequences produced. Amplicon-based sequencing approaches depend on the critical choice of which DNA region is used as the barcode. Universal markers are based on different criteria such as their presence across taxa and sufficient sequence variation between taxa. For fungi, the internal transcribed spacer (ITS) region of rDNA is considered the best barcode for most fungal groups [8,9,10]. The ITS region is composed of three parts: ITS1-5.8S-ITS2. The limitations imposed by the sequencers in term of amplicon size forces the use of ITS1 or ITS2 to study fungal diversity of bioaerosols.
The objective of this work is to use air samples from waste treatment facilities and dairy farms to make a systematic comparison of the performance of ITS1 and ITS2 in determining the fungal diversity of bioaerosols.

Materials and Methods

Various air samples were collected: composting sites, biomethanization facilities and dairy farms. In each environment, the sampling sites were chosen according to where workers were most exposed to bioaerosols. Each composting plant treats different raw materials: household green waste (domestic), manure and hay (vegetal), and pig carcasses and placenta (animal). All of the composting plants were located in the province of Quebec, Canada. Samples were also collected from two biomethanization facilities. One facility processes primary and secondary sludge from wastewater treatment plants, as well as industrial waste. The second one handles municipal waste from domestic sources. Air samples were collected from five dairy farms in Eastern Canada during summer 2016. The buildings at each farm exhibited differences in building type and building characteristics (age, volume, ventilation), the number of animals presents (cows), the methods of milking (automatic or manual) and types of animal feed animals were given. For the three environments, and during each visit, three samples were taken: at the beginning, the middle and the end of work shifts.
A liquid cyclonic impactor Coriolis µ® (Bertin Technologies, Montigny-le-Bretonneux, France) was used for collecting air samples. The sampler was set at 300 L/min for 10 minutes (3m3 of air per sample) and placed within 1-2 meters of the source. The air flow in the sampler creates a vortex through which air particles enter the Coriolis cone and are impacted in the liquid. Fifteen milliliters of a phosphate buffer saline (PBS) solution with a concentration of 50 mM and a pH of 7.4 were used to fill the sampling cone.
A MoBio PowerLyser® Powersoil® Isolation DNA kit (Carlsbad, CA, U.S.A) was used to extract the total genomic DNA from the samples following the manufacturer’s instructions. Then, DNA was eluted in a 100µl MoBio buffer and the isolated DNA samples were stored at -20°C until subsequent analyses.
Amplification of the fungal ITS1 and ITS2 regions, equimolar pooling and sequencing were performed at the Genomic analysis platform (IBIS, Université Laval, Quebec City, Canada). Detailed information about the protocols used for MiSeq Illumina Sequencing is presented in the original study report (Mbareche et al., 2018. ITS1 or ITS2 for metabarcoding analyses of fungal aerosol populations? [unpublished materials]).
The bioinformatics workflow used to treat the sequences and analyze the diversity was based on the one previously described study [4].

Results and Discussion

In compost samples, 3 871 313 raw reads clustered into 1 208 OTUs (Operational Taxonomic Units) after quality filtering for ITS1, and 3 680 926 raw reads clustered into 772 OTUs for ITS2. In biomethanization samples, 675,642 raw reads clustered into 1142 OTUs and 730,688 sequences into 330 OTUs for ITS1 and ITS2, respectively. In dairy farm samples, 354,262 sequences led to 1015 OTUs and 310,362 sequences led to 218 OTUs for ITS1 and ITS2, respectively.
The ITS1 barcode produced significantly higher richness and diversity measures (Observed OTUs, Chao1, Shannon, Simpson) per sample compared to the ITS2 barcode in the three environments (data not shown). These results suggest ITS1 is a better diversity indicator than ITS2. The taxonomic profiles were analyzed more carefully to compare classes of fungi across samples according to the barcode used in each one of the three environments studied. The results presented in Figure 1 include all three environments combined. Of the 20 classes of fungi represented, Dothideomycetes, Eurotiomycetes, Saccharomycetes, Sordariomycetes and Agaricomycetes are the most dominant accounting for 90% of the total relative abundance. The most striking difference between ITS1 and ITS2 was in the class Saccharomycetes. It was 2.5 times more abundant in results from ITS2 (20%) compared to ITS1 (8%). Of the less abundant taxa, Wallemiomycetes, Exobasidiomycetes and Taphrinomycetes were detected only when the ITS1 region was used and Glomeromycetes, Tritirachiomycetes, Mucoromycotina, Rozellomycota and Lecanoromycetes were detected only by ITS2. Saccharomycetes were detected in all three environments when the ITS2 region was used while no Saccharomycetes were detected with the ITS1 region. This discrepancy may be linked to a 3’ terminal mismatch associated with ITS1 primers [11]. For example, the ITS1F forward primer specific to fungi is known to have mismatches with some classes of fungi including Chytridiomycota, Saccharomycetes and some genera of Dothideomycetes. The occurrence of introns between primer sites in many taxonomic groups of Ascomycota could also explain the difference in results obtained using the ITS1 and ITS2 regions [12,13,14].
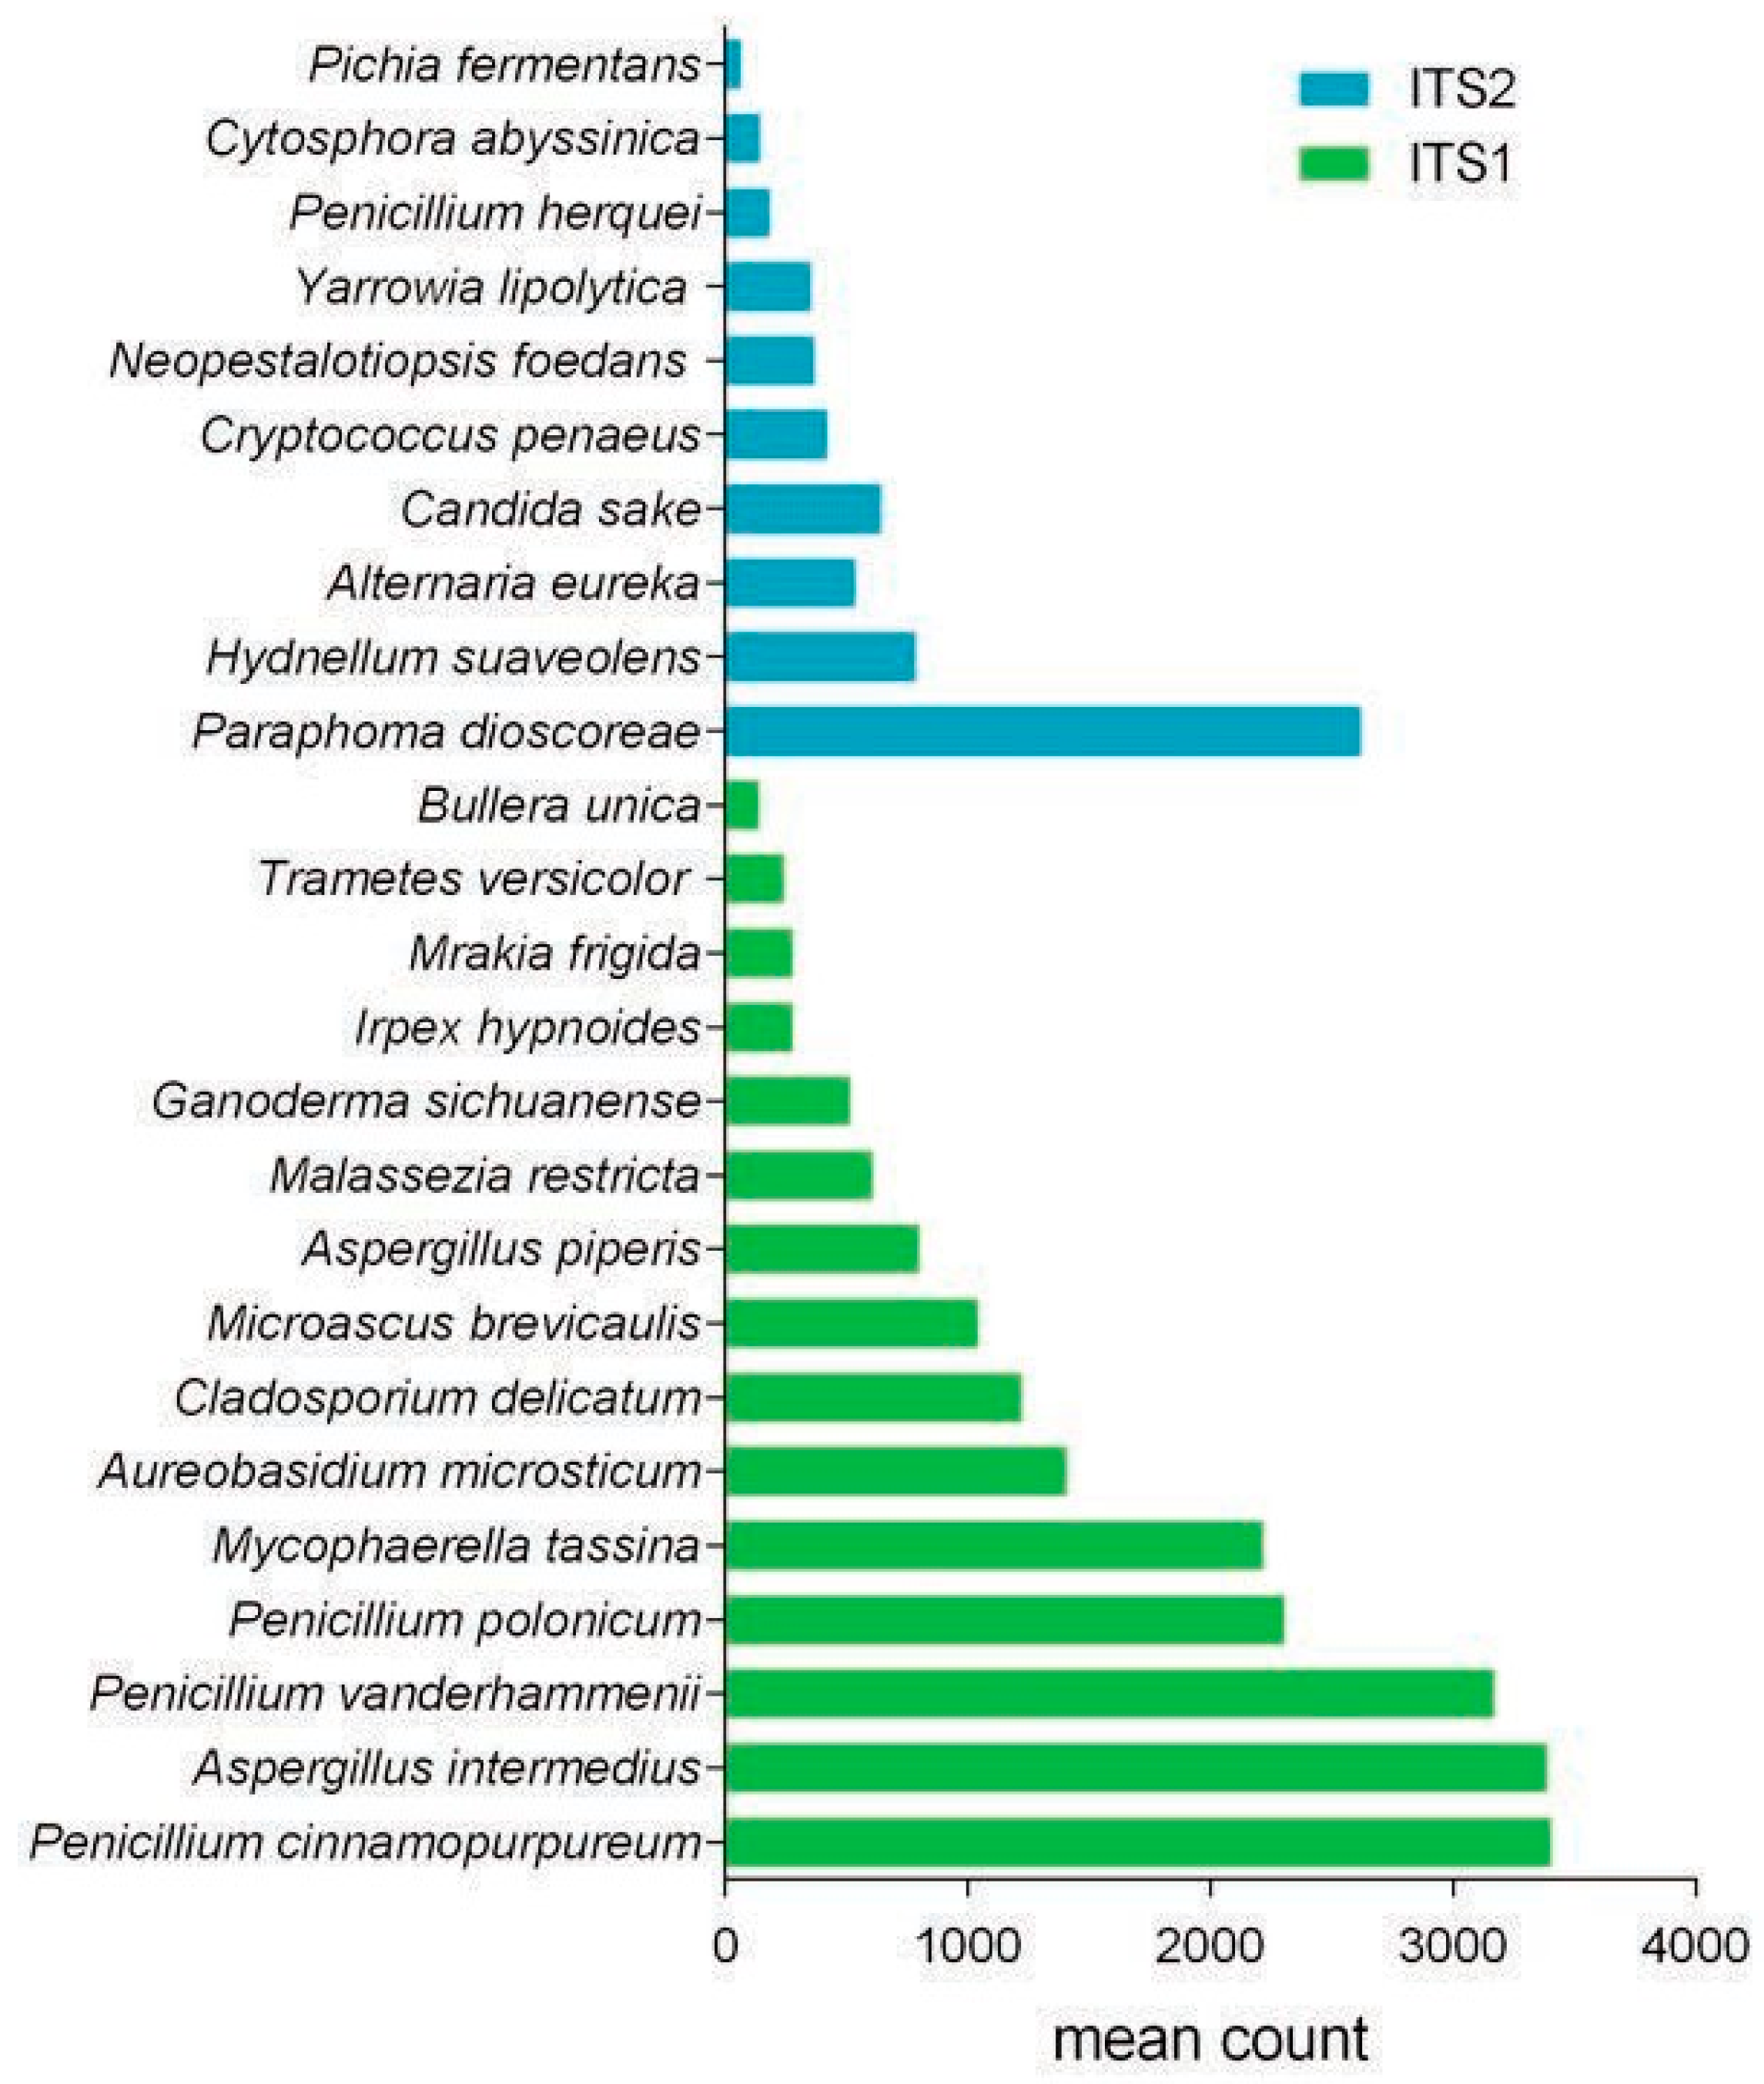
Figure 2 presents a summary of the species that were consistently (in the three environments) more abundant when either ITS1 or ITS2 was used (based on Man-Whitney U test). Abundance comparisons for all of the species in Figure 2 are significant at P<0.005. The fungal species that were found exclusively when used with either the ITS1 or ITS2 barcode should be examined more closely when designing a study of fungal diversity in bioaerosols. The differential abundance results presented herein are not exhaustive. All of the information is presented in the supporting material associated with the original study report (Mbareche et al., 2018. ITS1 or ITS2 for metabarcoding analyses of fungal aerosol populations? [unpublished materials]). Primer mismatch could explain the potential biases linked to the taxa identified only by ITS1 or ITS2 but not both [15,16].
Other factors may impact the performance of ITS1 and ITS2 as fungal barcodes in amplicon-based sequencing studies. For example, the GC content is known to have an effect on PCR and sequencing efficiencie [17]. While the GC content was not addressed in this work, a recent study used sequences from an ITS database to examine the GC content of ITS1 and ITS2 sequences. ITS1 had significantly lower GC content than ITS2 in the taxa studied which may be advantageous for amplification and sequencing compared to ITS2 [18]. Bioinformatics analyses can also impact diversity analyses depending on the clustering algorithms, the percent identity threshold and taxonomy assignment tools (BLASTn vs Naïve Bayesian Classifier). In this work, the performances of ITS1 and ITS2 were evaluated using the same bioinformatics tools in order to avoid adding any further biases to the diversity analyses.

Conclusions

The results presented in this conference paper are a short summary of a more exhaustive analysis comparing ITS1 and ITS2 barcodes in air samples from different environments as well as an analysis of the use of the culture approach to describe fungi in bioaerosols. The goal of this work is to offer aerosol scientists a guide for designing studies to address the fungal populations in aerosols using molecular approaches. Although ITS1 outperformed ITS2 in richness measures, the results obtained suggest that neither one of the barcodes evaluated is perfect in terms of distinguishing all species. Using both barcodes offers a wider view of the fungal aerosol population present. However, we strongly recommend the use of the ITS1 region as a universal fungal barcode for quicker general analyses of diversity and when limited financial resources are available.

Author Contributions

H.M. designed the study, performed all experiments, including field sampling, analyzed the data and wrote the paper; M.V. performed field sampling and designed the study; G.J.B. and C.D. designed the study; and all authors edited the manuscript.

Funding

this work was supported by the Institut de Recherche Robert-Sauvé en Santé et en Sécurité du Travail (2014-0057).

Conflicts of Interest

the authors declare no potential conflict of interest.

References

  1. Ruzer, L.S.; Harley, N.H. Aerosols hand-book: measurement, dosimetry and health effects; CRC Press: Boca Raton, FL, USA, 2005. [Google Scholar]
  2. Kakde, U.B. Fungal bioaerosols: global diversity, distribution and its impact on human beings and agricultural crops. Bionano Front 2012, 5, 323–9. [Google Scholar]
  3. Gilbert, Y.; Duchaine, C. Bioaerosols in industrial environments: a review. Canad J Civil Engin 2009, 36, 1873–86. [Google Scholar] [CrossRef]
  4. Mbareche, H.; Veillette, M.; Bonifait, L.; Dubuis, M.E.; Bernard, Y.; Marchand, G.; et al. A next generation sequencing approach with a suitable bioinformatics workflow to study fungal diversity in bioaerosols released from two different types of compost plants. Sci Total Environ 2017, 601–2. [Google Scholar] [CrossRef] [PubMed]
  5. Mbareche, H.; Veillette, M.; Dubuis, M.E.; Bakhiyi, B.; Zayed, J.; Lavoie, J.; et al. Fungal bioaerosols in biomethanization facilities. J Air Waste Manag Assoc 2018, 1–13. [Google Scholar] [CrossRef] [PubMed]
  6. Mbareche, H.; Veillette, M.; Bilodeau, G.J.; Duchaine, C. Fungal bioaerosols at five dairy farms: a novel approach to describe workers’ exposure. 2018. Available online: https://www.biorxiv.org/content/early/2 018/04/26/308825.full.pdf+html.
  7. Tischer, C.G.; Heinrich, J. Exposure assessment of residential mould, Fungi and microbial components in relation to children’s health: Achievements and challenges. Int J Hyg Environ Health 2013, 216, 109–14. [Google Scholar] [CrossRef] [PubMed]
  8. Roe, A.D.; Rice, A.V.; Bromilow, S.E.; Cooke, J.E.; Sperling, F.A. Multilocus species identification and fungal DNA barcoding: insights from blue stain fungal symbionts of the mountain pine beetle. Molec Ecol Resour 2010, 10, 946–59. [Google Scholar] [CrossRef] [PubMed]
  9. Dentinger, B.T.; Didukh, M.Y.; Moncalvo, J.M. Comparing COI and ITS as DNA barcode markers for mushrooms and allies (Agaricomycotina). PLoS ONE 2011, 6, e25081. [Google Scholar] [CrossRef] [PubMed]
  10. Schoch, C.L.; Seifert, K.A.; Huhndorf, S.; Robert, V.; Spouge, J.L.; Levesque, C.A.; et al. Nuclear ribosomal internal transcribed spacer (ITS) region as a universal DNA barcode marker for Fungi. Proc Nation Acad Sci Unit States Am 2012, 109, 6241–6. [Google Scholar]
  11. Tedersoo, L.; Anslan, S.; Bahram, M.; Polme, S.; Riit, T.; Liiv, I.; et al. Shotgun metagenomes and multiple pair-barcode combinations of amplicons reveal biases in metabarcoding analyses of fungi. MycoKeys 2015, 10, 1–43. [Google Scholar] [CrossRef]
  12. Perotto, S.; Nepote-Fus, P.; Saletta, L.; Bandi, C.; Young, J.P.W. W. A diverse population of introns in the nuclear ribosomal genes of ericoid mycorrhizal fungi includes elements with sequence similarity to endonuclease-coding genes. Mol Biol Evol 2000, 17, 44–59. [Google Scholar] [PubMed]
  13. Bhattacharya, D.; Lutzoni, F.; Reeb, V.; Simon, D.; Nason, J.; Fernandez, F. Widespread occurrence of spliceosomal introns in the rDNA genes of Ascomycetes. Molec Biol Evol 2000, 17, 1971–84. [Google Scholar] [CrossRef] [PubMed]
  14. Vrålstad, T.; Myhre, E.; Schumacher, T. ; Schumacher, T. Molecular diversity and phylogenetic affinities of symbiotic root-associated ascomycetes of the Helotiales in burnt and metal polluted habitats. New Phytol 2002, 155, 131–48. [Google Scholar] [PubMed]
  15. Bellemain, E.; Carlsen, T.; Brochmann, C.; Coissac, E.; Taberlet, P.; Kauserud, H. ITS as an environmental DNA barcode for fungi: an in silico approach reveals potential PCR biases. BMC Microbiology 2010, 10, 189. [Google Scholar] [CrossRef] [PubMed]
  16. Han, J.; Zhu, Y.; Chen, X.; Liao, B.; Yao, H.; Song, J.; et al. The short ITS2 sequence serves as an efficient taxonomic sequence tag in comparison with the full-length, I.T.S. T.S. BioMed Res Int 2013, 741476. [Google Scholar] [CrossRef] [PubMed]
  17. McDowell, D.G.; Burns, N.A.; Parkes, H.C. Localised sequence regions possessing high melting temperatures prevent the amplification of a DNA mimic in competitive PCR. Nucl Acid Res 1998, 26, 3340–7. [Google Scholar] [CrossRef] [PubMed]
  18. Wang, X.C.; Liu, C.; Huang, L.; Bengtsson-Palme, J.; Chen, H.; Zhang, J.H.; et al. ITS1: a DNA barcode better than ITS2 in eukaryotes? Molec Ecol Resour 2015, 15, 573–86. [Google Scholar] [CrossRef] [PubMed]
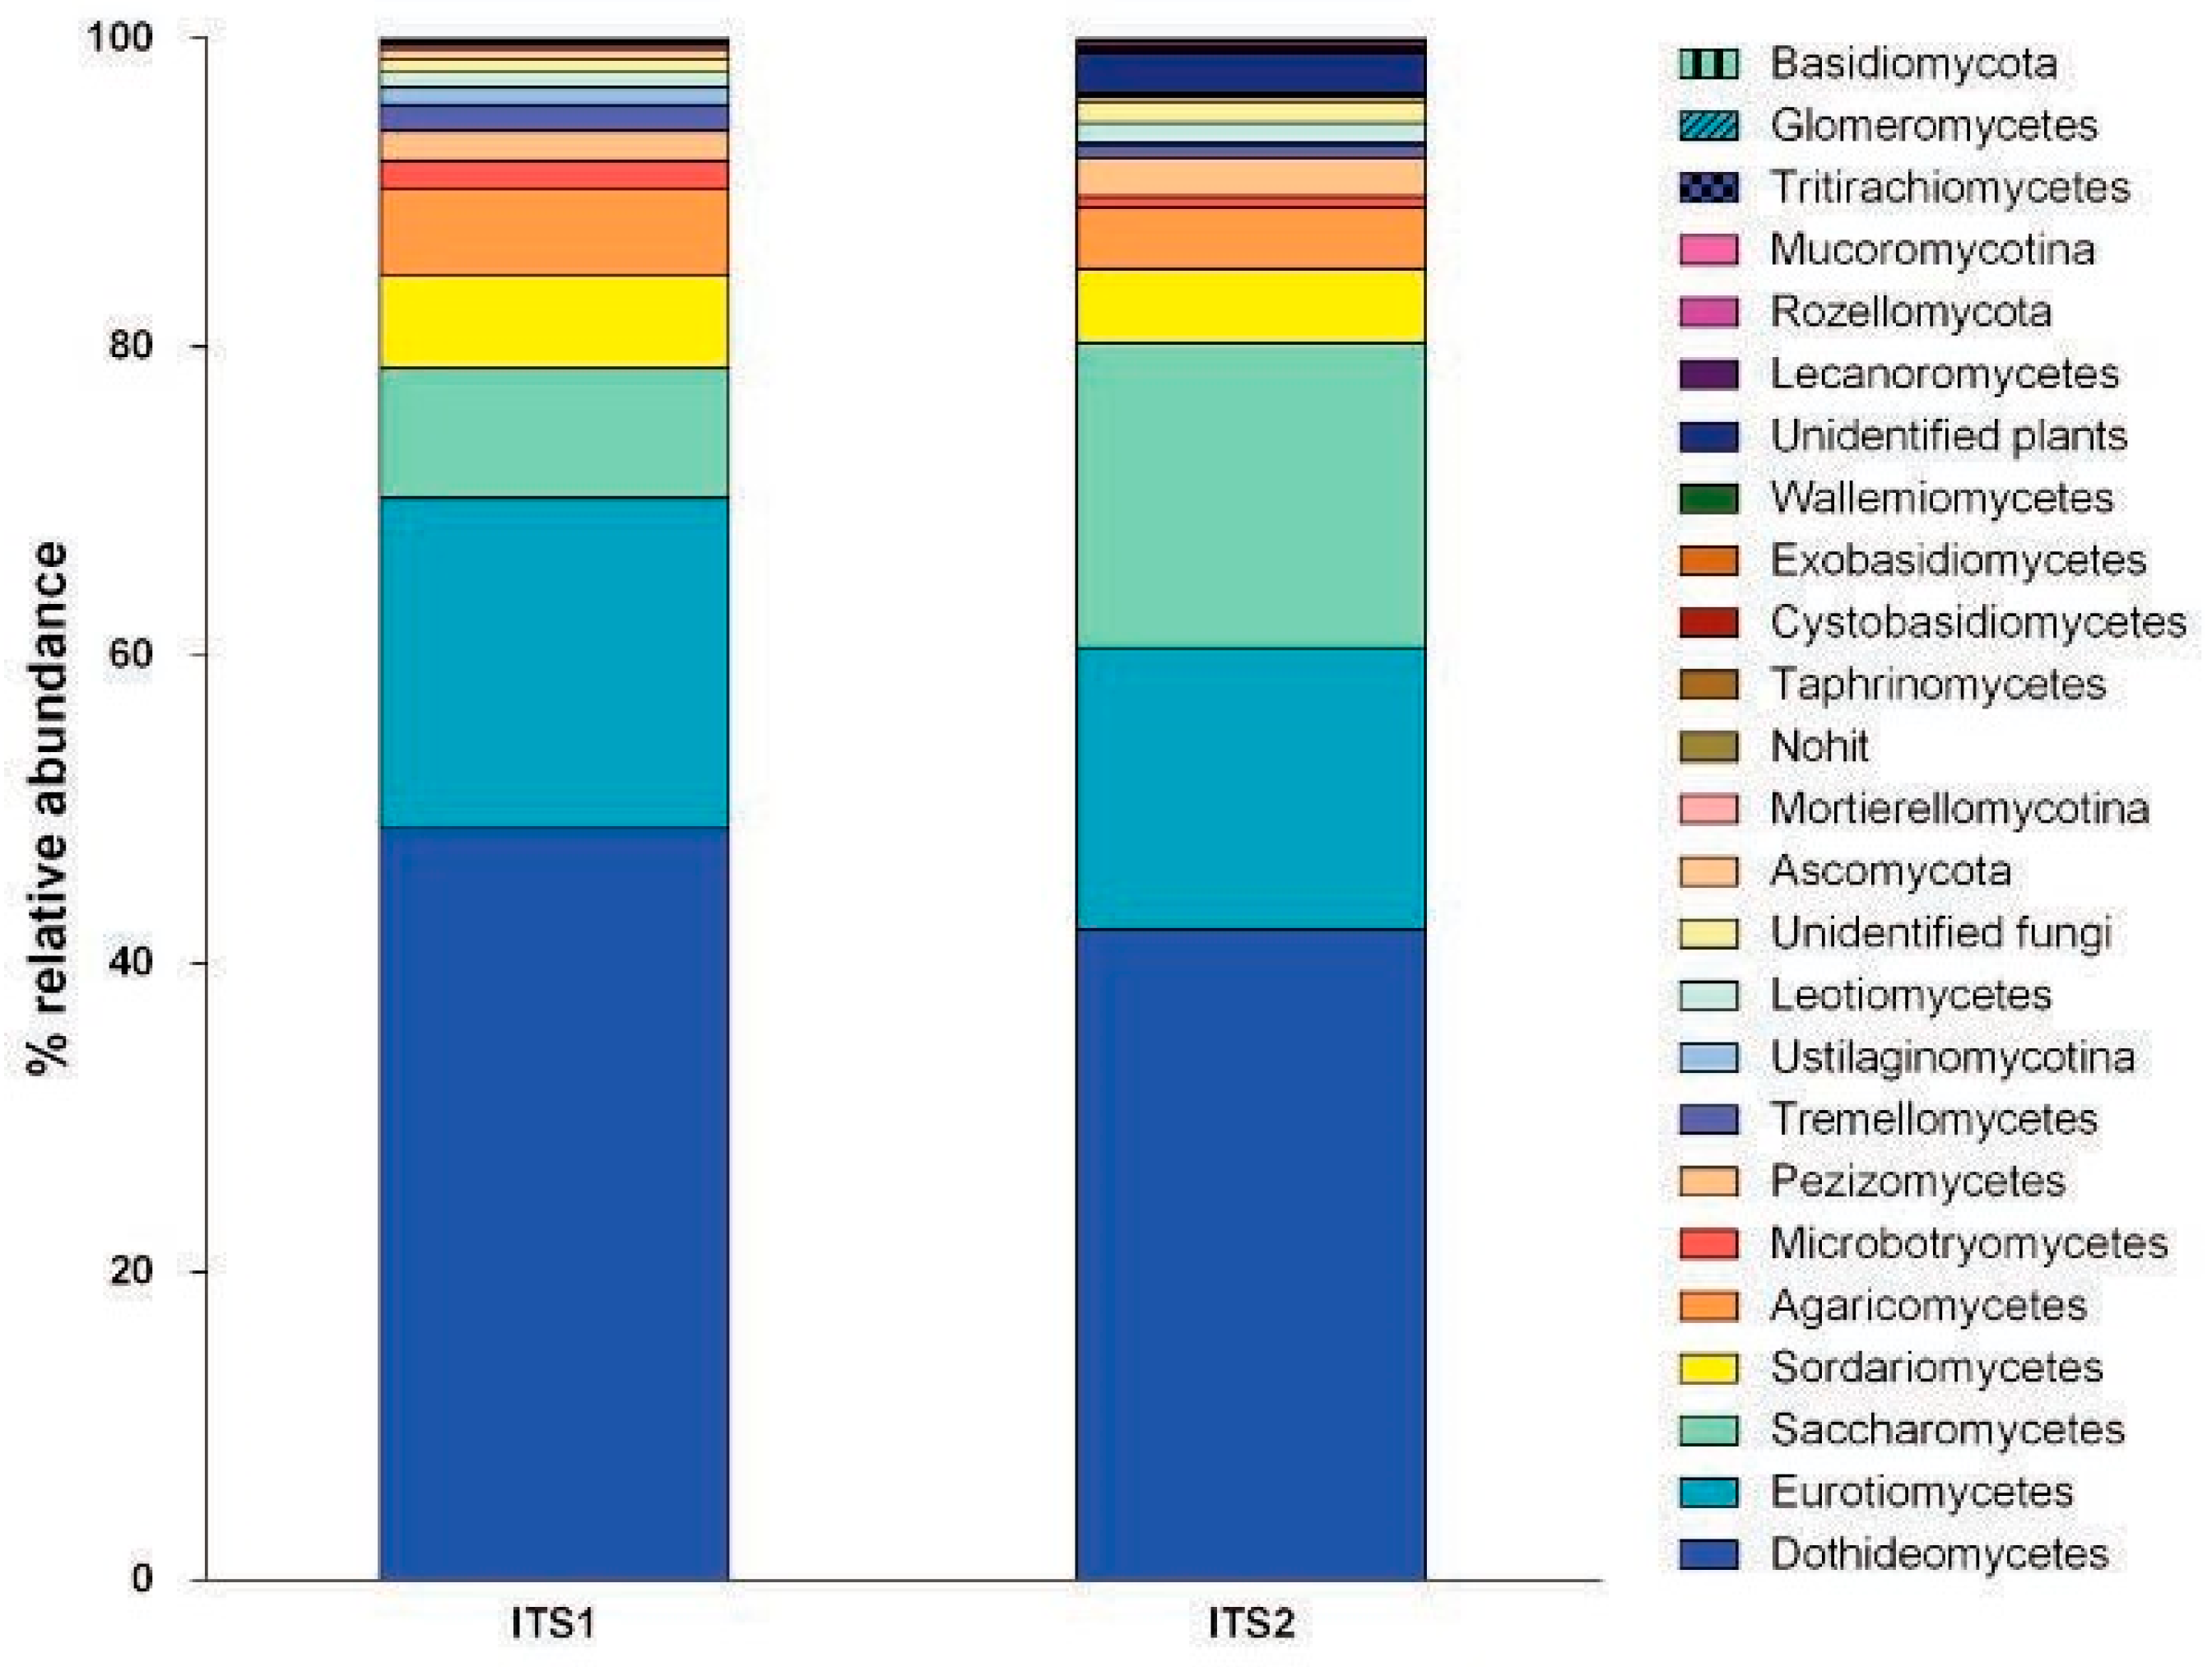
Figure 1. Relative abundance of the classes of fungi detected in the three environments (compost, biomethanization and dairy farms). Samples were compared based on the barcode used. The Blastn tool and the UNITE database were used for taxonomy assignment.
Jox 08 07810 g001
Figure 2. Fungal species with statistically significant differential abundances across samples from compost, biomethanization and dairy farms targeting ITS1 or ITS2 barcodes. From the bottom to the top: 15 species that were consistently (throughout the three environments) more abundant using ITS1 and 10 that were consistently more abundant using ITS2.
Jox 08 07810 g002