Global Research on Syndromic Surveillance from 1993 to 2017: Bibliometric Analysis and Visualization


Abstract
:1. Introduction
2. Materials and Methods
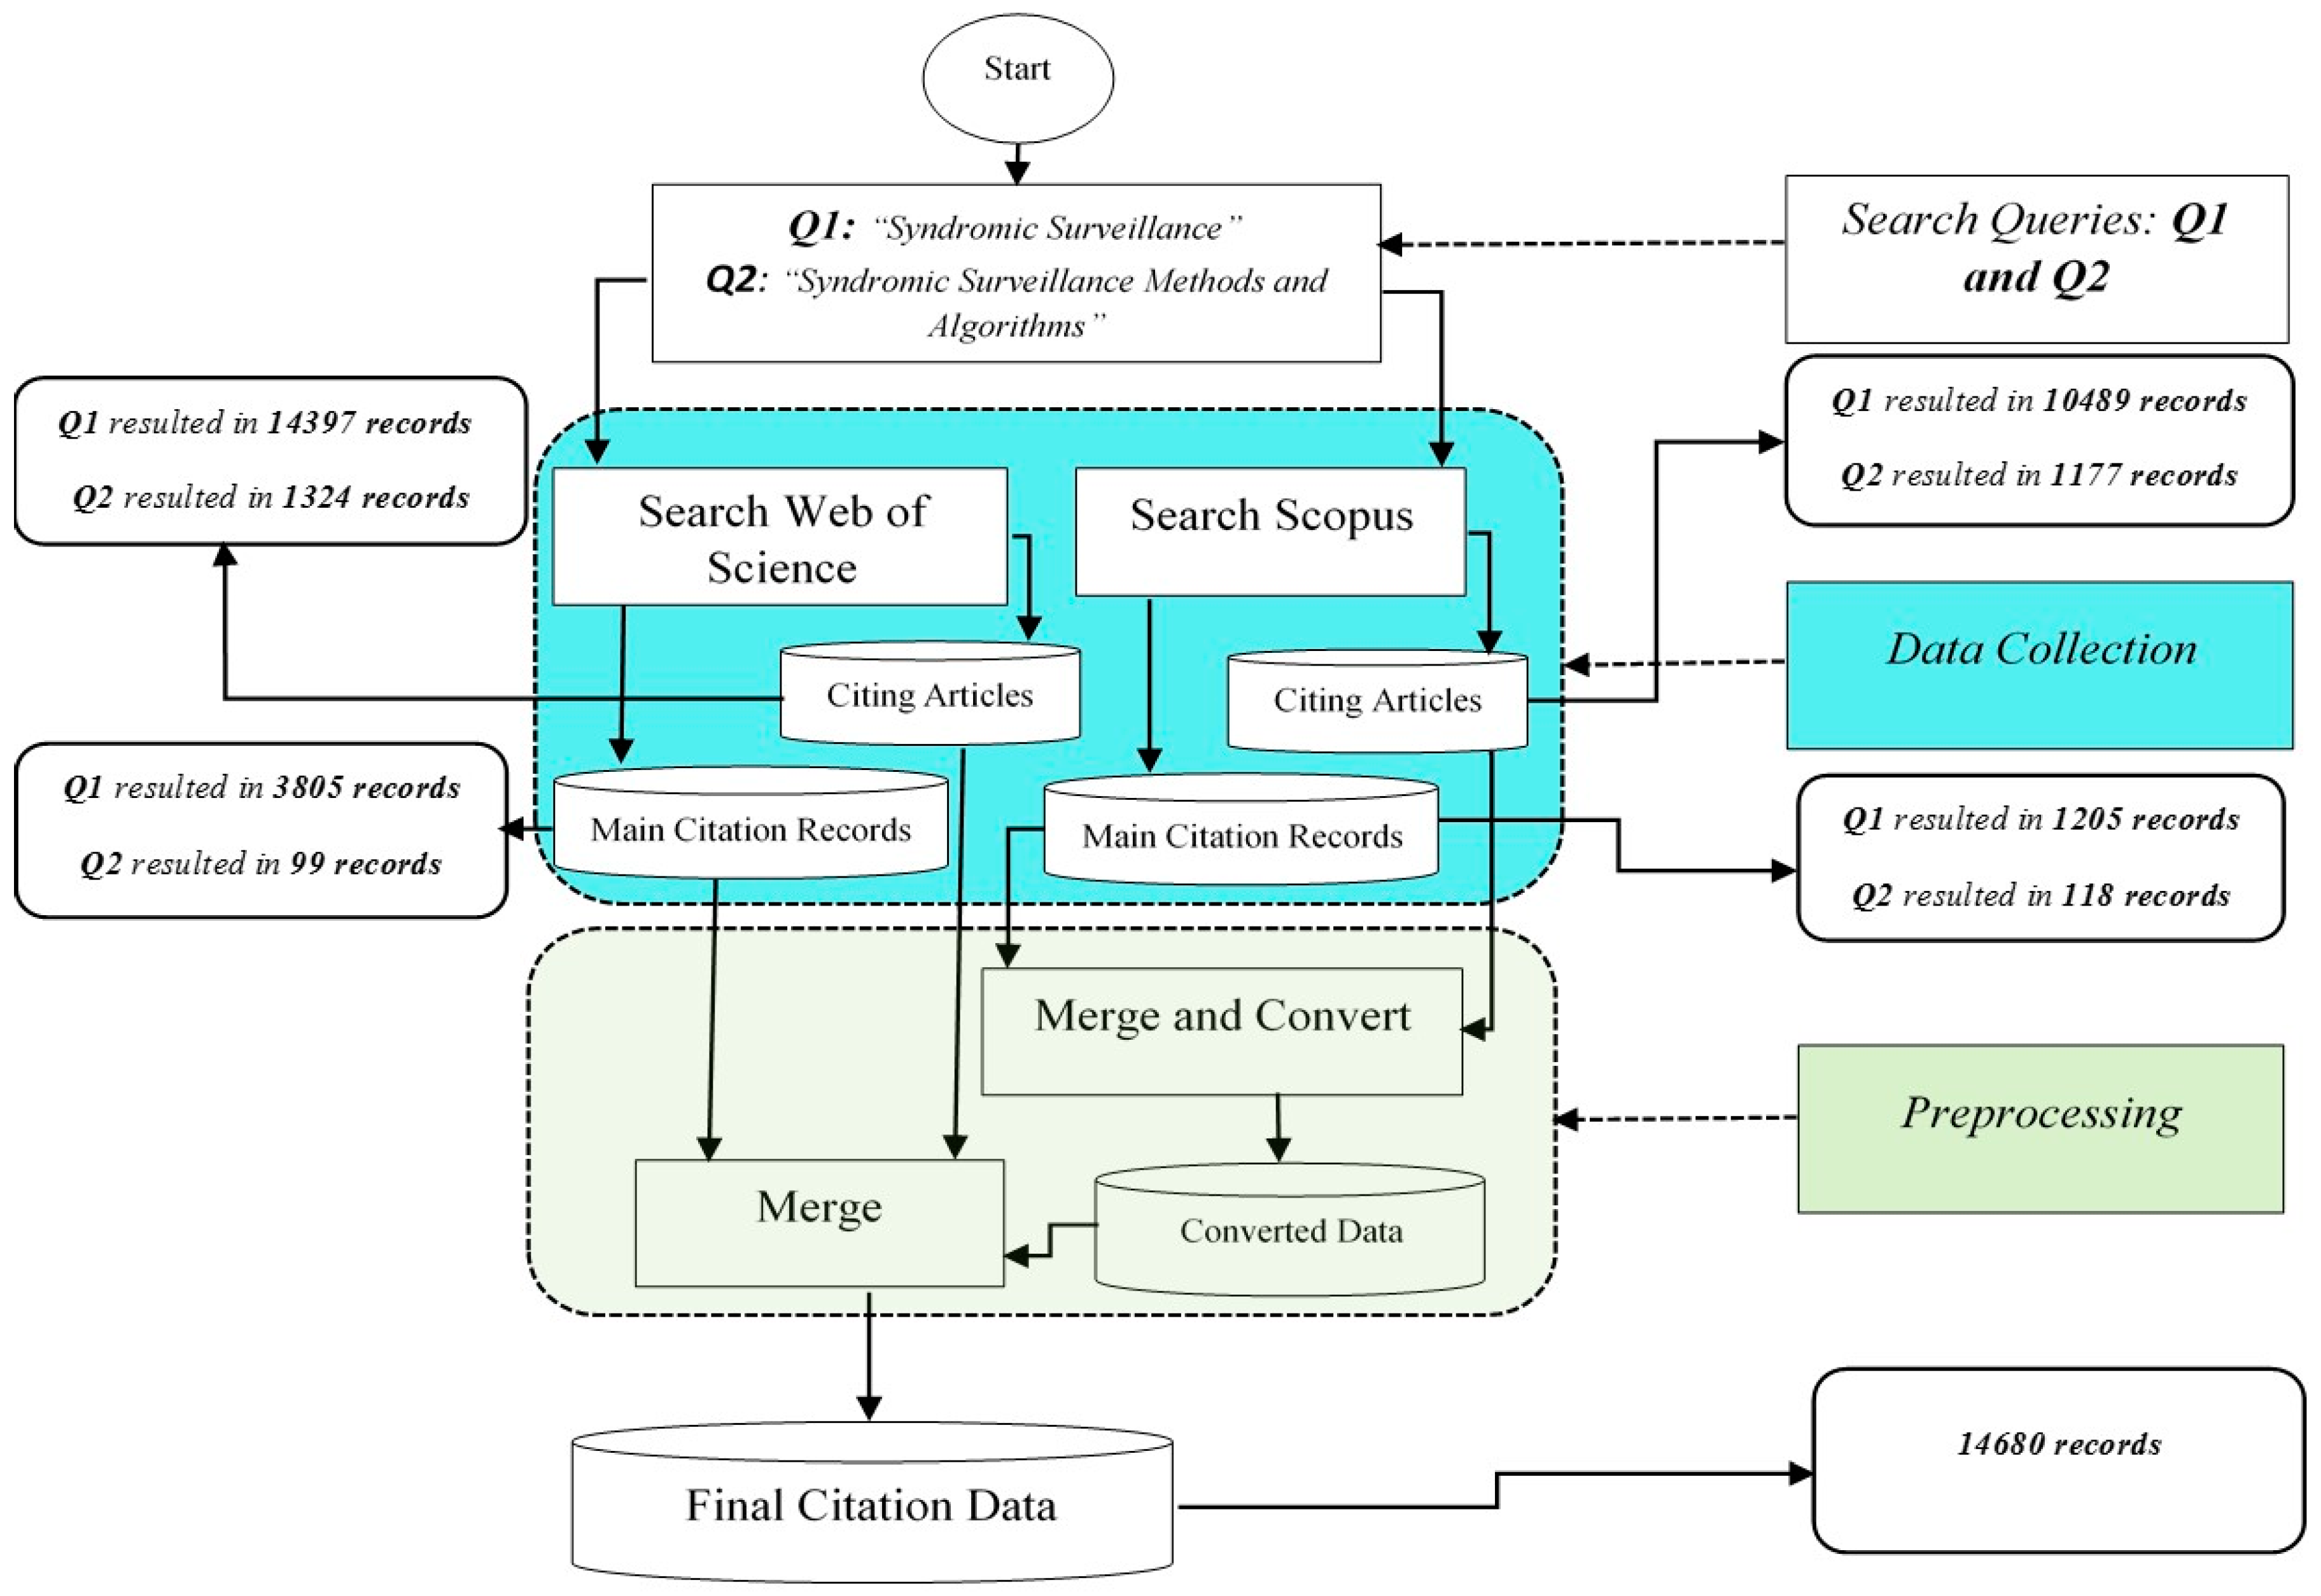
2.1. Data Collection and Preprocessing
2.2. Bibliometric Analysis and Tools
3. Results
3.1. Countries and Institutions
3.2. Reference Co-Citation Analysis
3.3. Keyword Cooccurrence Analysis
4. Discussion
- (1)
- (2)
- (3)
- The study has uncovered three major clusters of research, namely Disease Surveillance, EWMA Control Charts, and Crowd-Sourced. The papers within these clusters resemble the intellectual base of the subfield which can be labeled as the cluster label. For example, a careful investigation of Table 6 shows that the second largest cluster (i.e., research field) has 48 papers as its intellectual base. This cluster is concerned with the applications of the Statistical Process Control (SPC) methods for the purpose of disease surveillance. The papers which cite elements of this cluster can be viewed as research fronts. For example, the work in [62] can be considered as a current research front which builds on the intellectual base of Crowd-Sourced methods for disease surveillance.
5. Conclusions
Author Contributions
Funding
Acknowledgments
Conflicts of Interest
References
- Teutsch, S.M.; Churchill, R.E. Principles and Practice of Public Health Surveillance; Oxford University Press: New York, NY, USA, 2000. [Google Scholar]
- Henning, K.J. What is syndromic surveillance? Morb. Mortal. Wkly. Rep. 2004, 53, 7–11. [Google Scholar]
- Vogt, R.L.; LaRue, D.; Klaucke, D.N.; Jillson, D.A. Comparison of an active and passive surveillance system of primary care providers for hepatitis, measles, rubella, and salmonellosis in Vermont. Am. J. Public Health 1983, 73, 795–797. [Google Scholar] [CrossRef] [PubMed]
- Yang, E.; Cho, S. The status of enhanced syndromic surveillance system in South Korea. Public Health Wkly. Rep. 2015, 8, 1255–1258. [Google Scholar]
- Yang, E.; Park, H.W.; Choi, Y.H.; Kim, J.; Munkhdalai, L.; Musa, I.; Ryu, K.H. A simulation-based study on the comparison of statistical and time series forecasting methods for early detection of infectious disease outbreaks. Int. J. Environ. Res. Public Health 2018, 15, 966. [Google Scholar] [CrossRef] [PubMed]
- Wang, Z.; Chen, Y.; Cai, G.; Jiang, Z.; Liu, K.; Chen, B.; Jiang, J.; Gu, H. A bibliometric analysis of pubmed literature on Middle East respiratory syndrome. Int. J. Environ. Res. Public Health 2016, 13, 583. [Google Scholar] [CrossRef] [PubMed]
- Pleger, N.; Kloft, B.; Quarcoo, D.; Zitnik, S.; Mache, S.; Klingelhoefer, D.; Groneberg, D.A. Bacterial meningitis: A density-equalizing mapping analysis of the global research architecture. Int. J. Environ. Res. Public Health 2014, 11, 10202–10214. [Google Scholar] [CrossRef] [PubMed]
- Zongyi, Y.; Dongying, C.; Baifeng, L. Global regulatory T-cell research from 2000 to 2015: A bibliometric analysis. PLoS ONE 2016, 11, e0162099. [Google Scholar] [CrossRef] [PubMed]
- Liao, H.; Tang, M.; Luo, L.; Li, C.; Chiclana, F.; Zeng, X.J. A bibliometric analysis and visualization of medical big data research. Sustainability 2018, 10, 166. [Google Scholar] [CrossRef]
- Chen, C. How to Use CiteSpace; Leanpub: Victoria, BC, Canada, 2016. [Google Scholar]
- Van Cappelle, F. StatPlanet User´s Guide; UNESCO-IIEP: Paris, France, 2009. [Google Scholar]
- Freedman, D.O.; Weld, L.H.; Kozarsky, P.E.; Fisk, T.; Robins, R.; von Sonnenburg, F.; Keystone, J.S.; Pandey, P.; Cetron, M.S. Spectrum of disease and relation to place of exposure among ill returned travelers. N. Engl. J. Med. 2006, 354, 119–130. [Google Scholar] [CrossRef] [PubMed]
- Ginsberg, J.; Mohebbi, M.H.; Patel, R.S.; Brammer, L.; Smolinski, M.S.; Brilliant, L. Detecting influenza epidemics using search engine query data. Nature 2009, 457, 1012. [Google Scholar] [CrossRef] [PubMed]
- Eysenbach, G. Infodemiology and infoveillance: Framework for an emerging set of public health informatics methods to analyze search, communication and publication behavior on the Internet. J. Med. Internet Res. 2009, 11, e11. [Google Scholar] [CrossRef] [PubMed]
- Carneiro, H.A.; Mylonakis, E. Google trends: A web-based tool for real-time surveillance of disease outbreaks. Clin. Infect. Dis. 2009, 49, 1557–1564. [Google Scholar] [CrossRef] [PubMed]
- Frumkin, H.; Hess, J.; Luber, G.; Malilay, J.; McGeehin, M. Climate change: The public health response. Am. J. Public Health 2008, 98, 435–445. [Google Scholar] [CrossRef] [PubMed]
- Heffernan, R.; Mostashari, F.; Das, D.; Karpati, A.; Kulldorff, M.; Weiss, D. Syndromic surveillance in public health practice, New York City. Emerg. Infect. Dis. 2004, 10, 858–864. [Google Scholar] [CrossRef] [PubMed]
- East, J.E.; Saunders, B.P.; Jass, J.R. Sporadic and syndromic hyperplastic polyps and serrated adenomas of the colon: Classification, molecular genetics, natural history, and clinical management. Gastroenterol. Clin. N. Am. 2008, 37, 25–46. [Google Scholar] [CrossRef] [PubMed]
- Mandl, K.D.; Overhage, J.M.; Wagner, M.M.; Lober, W.B.; Sebastiani, P.; Mostashari, F.; Pavlin, J.A.; Gesteland, P.H.; Treadwell, T.; Koski, E.; et al. Implementing syndromic surveillance: A practical guide informed by the early experience. J. Am. Med. Inform. Assoc. 2004, 11, 141–150. [Google Scholar] [CrossRef] [PubMed]
- Tarpey, P.S.; Raymond, F.L.; Nguyen, L.S.; Rodriguez, J.; Hackett, A.; Vandeleur, L.; Smith, R.; Shoubridge, C.; Edkins, S.; Stevens, C.; et al. Mutations in UPF3B, a member of the nonsense-mediated mRNA decay complex, cause syndromic and nonsyndromic mental retardation. Nat. Genet. 2007, 39, 1127. [Google Scholar] [CrossRef] [PubMed]
- Yu, D.; Xu, Z.; Pedrycz, W.; Wang, W. Information Sciences 1968–2016: A retrospective analysis with text mining and bibliometric. Inf. Sci. 2017, 418, 619–634. [Google Scholar] [CrossRef]
- Gesteland, P.H.; Wagner, M.M.; Chapman, W.W.; Espino, J.U.; Tsui, F.C.; Gardner, R.M.; Rolfs, R.T.; Dato, V.; James, B.C.; Haug, P.J. Rapid deployment of an electronic disease surveillance system in the state of Utah for the 2002 Olympic Winter Games. In Proceedings of the American Medical Informatics Association (AMIA) Symposium, San Antonio, TX, USA, 9–13 November 2002; pp. 285–289. [Google Scholar]
- Lombardo, J.S.; Burkom, H.; Pavlin, J. ESSENCE II and the framework for evaluating syndromic surveillance systems. Morb. Mortal. Wkly. Rep. 2004, 53, 159–165. [Google Scholar]
- Silk, B.J.; Berkelman, R.L. A review of strategies for enhancing the completeness of notifiable disease reporting. J. Public Health Manag. Pract. 2005, 11, 191–200. [Google Scholar] [CrossRef] [PubMed]
- Milinovich, G.J.; Williams, G.M.; Clements, A.C.; Hu, W. Internet-based surveillance systems for monitoring emerging infectious diseases. Lancet Infect. Dis. 2014, 14, 160–168. [Google Scholar] [CrossRef]
- Wu, T.S.J.; Shih, F.Y.F.; Yen, M.Y.; Wu, J.S.J.; Lu, S.W.; Chang, K.C.M.; Hsiung, C.; Chou, J.H.; Chu, Y.T.; Chang, H.; et al. Establishing a nationwide emergency department-based syndromic surveillance system for better public health responses in Taiwan. BMC Public Health 2008, 8, 18. [Google Scholar] [CrossRef] [PubMed] [Green Version]
- Gesteland, P.H.; Gardner, R.M.; Tsui, F.C.; Espino, J.U.; Rolfs, R.T.; James, B.C.; Chapman, W.W.; Moore, A.W.; Wagner, M.M. Automated syndromic surveillance for the 2002 Winter Olympics. J. Am. Med. Inform. Assoc. 2003, 10, 547–554. [Google Scholar] [CrossRef] [PubMed]
- Mostashari, F.; Hartman, J. Syndromic surveillance: A local perspective. J. Urban Health 2003, 80, i1. [Google Scholar] [CrossRef] [PubMed]
- Abrams, A.M.; Kleinman, K.; Kulldorff, M. Gumbel based p-value approximations for spatial scan statistics. Int. J. Health Geogr. 2010, 9, 61. [Google Scholar] [CrossRef] [PubMed] [Green Version]
- Kulldorff, M.; Heffernan, R.; Hartman, J.; Assunçao, R.; Mostashari, F. A space–time permutation scan statistic for disease outbreak detection. PLoS Med. 2005, 2, e59. [Google Scholar] [CrossRef] [PubMed] [Green Version]
- Tsui, F.C.; Espino, J.U.; Dato, V.M.; Gesteland, P.H.; Hutman, J.; Wagner, M.M. Technical description of RODS: A real-time public health surveillance system. J. Am. Med. Inform. Assoc. 2003, 10, 399–408. [Google Scholar] [CrossRef] [PubMed]
- Lazarus, R.; Kleinman, K.P.; Dashevsky, I.; DeMaria, A.; Platt, R. Using automated medical records for rapid identification of illness syndromes (syndromic surveillance): The example of lower respiratory infection. BMC Public Health 2001, 1, 9. [Google Scholar] [CrossRef] [Green Version]
- Lober, W.B.; Karras, B.T.; Wagner, M.M.; Overhage, J.M.; Davidson, A.J.; Fraser, H.; Trigg, L.J.; Mandl, K.D.; Espino, J.U.; Tsui, F.C. Roundtable on bioterrorism detection: Information system–based surveillance. J. Am. Med. Inform. Assoc. 2002, 9, 105–115. [Google Scholar] [CrossRef] [PubMed]
- Harrison, A.; Wilkinson, D.; Lurie, M.; Connolly, A.M.; Karim, S.A. Improving quality of sexually transmitted disease case management in rural South Africa. Aids 1998, 12, 2329–2335. [Google Scholar] [CrossRef] [PubMed] [Green Version]
- Jernigan, J.A.; Stephens, D.S.; Ashford, D.A.; Omenaca, C.; Topiel, M.S.; Galbraith, M.; Tapper, M.; Fisk, T.L.; Zaki, S.; Popovic, T.; et al. Bioterrorism-related inhalational anthrax: The first 10 cases reported in the United States. Emerg. Infect. Dis. 2001, 7, 933. [Google Scholar] [CrossRef] [PubMed]
- Wagner, M.M.; Tsui, F.C.; Espino, J.U.; Dato, V.M.; Sittig, D.F.; Caruana, R.A.; McGinnis, L.F.; Deerfield, D.W.; Druzdzel, M.J.; Fridsma, D.B. The emerging science of very early detection of disease outbreaks. J. Public Health Manag. Pract. 2001, 7, 51–59. [Google Scholar] [CrossRef] [PubMed]
- Grosskurth, H.; Todd, J.; Mwijarubi, E.; Mayaud, P.; Nicoll, A.; Newell, J.; Mabey, D.; Hayes, R.; Mosha, F.; Senkoro, K.; et al. Impact of improved treatment of sexually transmitted diseases on HIV infection in rural Tanzania: Randomised controlled trial. Lancet 1995, 346, 530–536. [Google Scholar] [CrossRef]
- Clericuzio, C.; Johnson, C. Screening for Wilms tumor in high-risk individuals. Hematol. Oncol. Clin. N. Am. 1995, 9, 1253–1265. [Google Scholar] [CrossRef]
- Davidson, B.J.; Kulkarny, V.; Delacure, M.D.; Shah, J.P. Posterior triangle metastases of squamous cell carcinoma of the upper aerodigestive tract. Am. J. Surg. 1993, 166, 395–398. [Google Scholar] [CrossRef]
- Rasmussen, S.A.; Moore, C.A.; Khoury, M.J.; Cordero, J.F. Descriptive epidemiology of holoprosencephaly and arhinencephaly in metropolitan Atlanta, 1968–1992. Am. J. Med. Genet. 1996, 66, 320–333. [Google Scholar] [CrossRef]
- Ivanov, O.; Wagner, M.M.; Chapman, W.W.; Olszewski, R.T. Accuracy of three classifiers of acute gastrointestinal syndrome for syndromic surveillance. In Proceedings of the American Medical Informatics Association (AMIA) Symposium, San Antonio, TX, USA, 9–13 November 2002; p. 345. [Google Scholar]
- Vergis, E.N.; Akbas, E.; Victor, L.Y. Legionella as a cause of severe pneumonia. Semin. Respir. Crit. Care Med. 2000, 21, 295–304. [Google Scholar] [CrossRef] [PubMed]
- Croen, L.A.; Shaw, G.M.; Lammer, E.J. Holoprosencephaly: Epidemiologic and clinical characteristics of a California population. Am. J. Med. Genet. 1996, 64, 465–472. [Google Scholar] [CrossRef]
- Kura, M.M.; Hira, S.; Kohli, M.; Dalal, P.J.; Ramnani, V.; Jagtap, M. High occurrence of HBV among STD clinic attenders in Bombay, India. Int. J. STD AIDS 1998, 9, 231–233. [Google Scholar] [CrossRef] [PubMed]
- Wilkinson, D.; Connolly, A.M.; Harrison, A.; Lurie, M.; Karim, S.A. Sexually transmitted disease syndromes in rural South Africa: Results from health facility surveillance. Sex. Transm. Dis. 1998, 25, 20–23. [Google Scholar] [CrossRef] [PubMed]
- Wong, W.K.; Moore, A.; Cooper, G.; Wagner, M. WSARE: What´s strange about recent events? J. Urban Health 2003, 80, i66–i75. [Google Scholar] [PubMed]
- Kulldorff, M. A spatial scan statistic. Commun. Stat. Theory Methods 1997, 26, 1481–1496. [Google Scholar] [CrossRef]
- Harrison, A.; Karim, S.A.; Floyd, K.; Lombard, C.; Lurie, M.; Ntuli, N.; Wilkinson, D. Syndrome packets and health worker training improve sexually transmitted disease case management in rural South Africa: Randomized controlled trial. Aids 2000, 14, 2769–2779. [Google Scholar] [CrossRef] [PubMed]
- Espino, J.U.; Wagner, M.M. Accuracy of ICD-9-coded chief complaints and diagnoses for the detection of acute respiratory illness. In Proceedings of the American Medical Informatics Association (AMIA) Symposium, Washington, DC, USA, 3–7 November 2001; p. 164. [Google Scholar]
- Pollock, D.A.; Adams, D.L.; Bernardo, L.M.; Bradley, V.; Brandt, M.D.; Davis, T.E.; Garrison, H.G.; Iseke, R.M.; Johnson, S.; Kaufmann, C.R.; et al. Data elements for emergency department systems, Release 1.0 (DEEDS): A summary report. J. Emerg. Nurs. 1998, 31, 264–273. [Google Scholar] [CrossRef]
- Mayaud, P.; Mosha, F.; Todd, J.; Balira, R.; Mgara, J.; West, B.; Rusizoka, M.; Mwijarubi, E.; Gabone, R.; Gavyole, A.; et al. Improved treatment services significantly reduce the prevalence of sexually transmitted diseases in rural Tanzania: Results of a randomized controlled trial. Aids 1997, 11, 1873–1880. [Google Scholar] [CrossRef] [PubMed]
- Rotz, L.D.; Khan, A.S.; Lillibridge, S.R.; Ostroff, S.M.; Hughes, J.M. Public health assessment of potential biological terrorism agents. Emerg. Infect. Dis. 2002, 8, 225. [Google Scholar] [CrossRef] [PubMed]
- Garcia, P.J.; Gotuzzo, E.; Hughes, J.P.; Holmes, K.K. Syndromic management of STDs in pharmacies: Evaluation and randomised intervention trial. Sex. Transm. Infect. 1998, 74, S153–158. [Google Scholar] [PubMed]
- Russell, S.; Ryff, K.; Gould, C.; Martin, S.; Johansson, M. Detecting local Zika virus transmission in the continental United States: A comparison of surveillance strategies. PLOS Curr. Outbreaks 2017. [Google Scholar] [CrossRef] [PubMed]
- Brownstein, J.S.; Freifeld, C.C.; Madoff, L.C. Digital disease detection—Harnessing the Web for public health surveillance. N. Engl. J. Med. 2009, 360, 2153–2157. [Google Scholar] [CrossRef] [PubMed]
- Santillana, M.; Nguyen, A.T.; Dredze, M.; Paul, M.J.; Nsoesie, E.O.; Brownstein, J.S. Combining search, social media, and traditional data sources to improve influenza surveillance. PLoS Comput. Biol. 2015, 11, e1004513. [Google Scholar] [CrossRef] [PubMed]
- Sweileh, W.M.; Wickramage, K.; Pottie, K.; Hui, C.; Roberts, B.; Sawalha, A.F.; Zyoud, S.H. Bibliometric analysis of global migration health research in peer-reviewed literature (2000–2016). BMC Public Health 2018, 18, 777. [Google Scholar] [CrossRef] [PubMed]
- Buckeridge, D.L.; Burkom, H.; Moore, A.; Pavlin, J.; Cutchis, P.; Hogan, W. Evaluation of syndromic surveillance systems—Design of an epidemic simulation model. Morb. Mortal. Wkly. Rep. 2004, 53, 137–143. [Google Scholar]
- Broniatowski, D.A.; Paul, M.J.; Dredze, M. National and local influenza surveillance through twitter: An analysis of the 2012–2013 influenza epidemic. PLoS ONE 2013, 8, e83672. [Google Scholar] [CrossRef] [PubMed]
- Yuan, Q.; Nsoesie, E.O.; Lv, B.; Peng, G.; Chunara, R.; Brownstein, J.S. Monitoring influenza epidemics in China with search query from Baidu. PLoS ONE 2013, 8, e64323. [Google Scholar] [CrossRef] [PubMed]
- Singh, B.K.; Savill, N.J.; Ferguson, N.M.; Robertson, C.; Woolhouse, M.E. Rapid detection of pandemic influenza in the presence of seasonal influenza. BMC Public Health 2010, 10, 726. [Google Scholar] [CrossRef] [PubMed] [Green Version]
- Xu, Q.; Gel, Y.R.; Ramirez, L.L.; Nezafati, K.; Zhang, Q.; Tsui, K.L. Forecasting influenza in Hong Kong with Google search queries and statistical model fusion. PLoS ONE 2017, 12, e0176690. [Google Scholar] [CrossRef] [PubMed]
- Bravata, D.M.; McDonald, K.M.; Smith, W.M.; Rydzak, C.; Szeto, H.; Buckeridge, D.L.; Haberland, C.; Owens, D.K. Systematic review: Surveillance systems for early detection of bioterrorism-related diseases. Ann. Intern. Med. 2004, 140, 910–922. [Google Scholar] [CrossRef] [PubMed]
- Buehler, J.W. Review of the 2003 National Syndromic Surveillance Conference? lessons learned and questions to be answered. Morb. Mortal. Wkly. Rep. 2004, 24, 18–22. [Google Scholar]
- Marsden-Haug, N.; Foster, V.B.; Gould, P.L.; Elbert, E.; Wang, H.; Pavlin, J.A. Code-based syndromic surveillance for influenzalike illness by International Classification of Diseases, Ninth Revision. Emerg. Infect. Dis. 2007, 13, 207. [Google Scholar] [CrossRef] [PubMed]
- Buckeridge, D.L. Outbreak detection through automated surveillance: A review of the determinants of detection. J. Biomed. Inform. 2007, 40, 370–379. [Google Scholar] [CrossRef] [PubMed]
- Buehler, J.W.; Berkelman, R.L.; Hartley, D.M.; Peters, C.J. Syndromic surveillance and bioterrorism-related epidemics. Emerg. Infect. Dis. 2003, 9, 1197. [Google Scholar] [CrossRef] [PubMed]
- Lewis, M.D.; Pavlin, J.A.; Mansfield, J.L.; O’Brien, S.; Boomsma, L.G.; Elbert, Y.; Kelley, P.W. Disease outbreak detection system using syndromic data in the greater Washington DC area1. Am. J. Prev. Med. 2002, 23, 180–186. [Google Scholar] [CrossRef]
- Lazarus, R.; Kleinman, K.; Dashevsky, I.; Adams, C.; Kludt, P.; DeMaria, A., Jr.; Platt, R. Use of automated ambulatory-care encounter records for detection of acute illness clusters, including potential bioterrorism events. Emerg. Infect. Dis. 2002, 8, 753. [Google Scholar] [CrossRef] [PubMed] [Green Version]
- Irvin, C.B.; Nouhan, P.P.; Rice, K. Syndromic analysis of computerized emergency department patients’ chief complaints: An opportunity for bioterrorism and influenza surveillance. Ann. Emerg. Med. 2003, 41, 447–452. [Google Scholar] [CrossRef] [PubMed]
- Reis, B.Y.; Mandl, K.D. Time series modeling for syndromic surveillance. BMC Med. Inf. Decis. Mak. 2003, 3, 2. [Google Scholar] [CrossRef] [Green Version]
- Lombardo, J.; Burkom, H.; Elbert, E.; Magruder, S.; Lewis, S.H.; Loschen, W.; Sari, J.; Sniegoski, C.; Wojcik, R.; Pavlin, J. A systems overview of the electronic surveillance system for the early notification of community-based epidemics (ESSENCE II). J. Urban Health 2003, 80, i32–i42. [Google Scholar] [PubMed]
- Muscatello, D.J.; Churches, T.; Kaldor, J.; Zheng, W.; Chiu, C.; Correll, P.; Jorm, L. An automated, broad-based, near real-time public health surveillance system using presentations to hospital Emergency Departments in New South Wales, Australia. BMC Public Health 2005, 5, 141. [Google Scholar] [CrossRef] [PubMed]
- Reis, B.Y.; Pagano, M.; Mandl, K.D. Using temporal context to improve biosurveillance. Proc. Natl. Acad. Sci. USA 2003, 100, 1961–1965. [Google Scholar] [CrossRef] [PubMed] [Green Version]
- Hutwagner, L.; Thompson, W.; Seeman, G.M.; Treadwell, T. The bioterrorism preparedness and response early aberration reporting system (EARS). J. Urban Health 2003, 80, i89–i96. [Google Scholar] [PubMed]
- Chapman, W.W.; Christensen, L.M.; Wagner, M.M.; Haug, P.J.; Ivanov, O.; Dowling, J.N.; Olszewski, R.T. Classifying free-text triage chief complaints into syndromic categories with natural language processing. Artif. Intell. Med. 2005, 33, 31–40. [Google Scholar] [CrossRef] [PubMed]
- Goldenberg, A.; Shmueli, G.; Caruana, R.A.; Fienberg, S.E. Early statistical detection of anthrax outbreaks by tracking over-the-counter medication sales. Proc. Natl. Acad. Sci. USA 2002, 99, 5237–5240. [Google Scholar] [CrossRef] [PubMed] [Green Version]
- Begier, E.M.; Sockwell, D.; Branch, L.M.; Davies-Cole, J.O.; Jones, L.H.; Edwards, L.; Casani, J.A.; Blythe, D. The national capitol regions emergency department syndromic surveillance system: Do chief complaint and discharge diagnosis yield different results? Emerg. Infect. Dis. 2003, 9, 393. [Google Scholar] [CrossRef] [PubMed]
- Yih, W.K.; Caldwell, B.; Harmon, R.; Kleinman, K.; Lazarus, R.; Nelson, A.; Nordin, J.; Rehm, B.; Richter, B.; Ritzwoller, D.; et al. National bioterrorism syndromic surveillance demonstration program. Morb. Mortal. Wkly. Rep. 2004, 53, 43–46. [Google Scholar]
- Tsui, F.C.; Wagner, M.M.; Dato, V.; Chang, C. Value of ICD-9 coded chief complaints for detection of epidemics. In Proceedings of the American Medical Informatics Association (AMIA) Symposium, Washington, DC, USA, 3–7 November 2001; p. 711. [Google Scholar]
- Beitel, A.J.; Olson, K.L.; Reis, B.Y.; Mandl, K.D. Use of emergency department chief complaint and diagnostic codes for identifying respiratory illness in a pediatric population. Pediatr. Emerg. Care 2004, 2, 355–360. [Google Scholar] [CrossRef]
- Miller, B.; Kassenborg, H.; Dunsmuir, W.; Griffith, J.; Hadidi, M.; Nordin, J.D.; Danila, R. Syndromic surveillance for influenza like illness in ambulatory care setting. Emerg. Infect. Dis. 2004, 10, 1806–1811. [Google Scholar] [CrossRef] [PubMed]
- Reingold, A. If syndromic surveillance is the answer, what is the question? Biosecur. Bioterror. 2003, 1, 77–81. [Google Scholar] [CrossRef] [PubMed]
- Chapman, W.W.; Dowling, J.N.; Wagner, M.M. Classification of emergency department chief complaints into 7 syndromes: A retrospective analysis of 527,228 patients. Ann. Emerg. Med. 2005, 46, 445–455. [Google Scholar] [CrossRef] [PubMed]
- Stoto, M.A.; Schonlau, M.; Mariano, L.T. Syndromic surveillance: Is it worth the effort? Chance 2004, 17, 19–24. [Google Scholar] [CrossRef]
- Hutwagner, L.; Browne, T.; Seeman, G.M.; Fleischauer, A.T. Comparing Aberration Detection Methods with Simulated Data. Emerg. Infect. Dis. 2005, 11, 314–316. [Google Scholar] [CrossRef] [PubMed] [Green Version]
- Kaufmann, A. The economic impact of a bioterrorist attack: Are prevention and postattack intervention programs justifiable? Emerg. Infect. Dis. 1997, 3, 83–94. [Google Scholar] [CrossRef] [PubMed]
- Hogan, W.R.; Tsui, F.C.; Ivanov, O.; Gesteland, P.H.; Grannis, S.; Overhage, J.M.; Robinson, J.M. Detection of pediatric respiratory and diarrheal outbreaks from sales of over-the-counter electrolyte products. J. Am. Med. Inform. Assoc. 2003, 10, 555–562. [Google Scholar] [CrossRef] [PubMed]
- Wein, L.M.; Craft, D.L.; Kaplan, E.H. Emergency response to an anthrax attack. Proc. Natl. Acad. Sci. USA 2003, 100, 4346–4351. [Google Scholar] [CrossRef] [PubMed] [Green Version]
- Lober, W.B.; Trigg, L.J.; Karras, B.T.; Bliss, D.; Ciliberti, J.; Stewart, L.; Duchin, J.S. Syndromic surveillance using automated collection of computerized discharge diagnoses. J. Urban Health 2003, 80, i97–i106. [Google Scholar] [PubMed]
- Morse, S.S. Public Health Surveillance and Infectious Disease Detection. Biosecur. Bioterror. 2012, 10, 6–16. [Google Scholar] [CrossRef] [PubMed]
- Loonsk, J. BioSense—A National Initiative for Early Detection and Quantification of Public Health Emergencies. Morb. Mortal. Wkly. Rep. 2004, 53, 53–55. [Google Scholar]
- Bourgeois, F.T.; Olson, K.L.; Brownstein, J.S.; McAdam, A.J.; Mandl, K.D. Validation of syndromic surveillance for respiratory infections. Ann. Emerg. Med. 2006, 47, 265. [Google Scholar] [CrossRef] [PubMed]
- Barthell, E.N.; Cordell, W.H.; Moorhead, J.C.; Handler, J.; Feied, C.; Smith, M.S.; Cochrane, D.G.; Felton, C.W.; Collins, M.A. The Frontlines of Medicine Project: A proposal for the standardized communication of emergency department data for public health uses including syndromic surveillance for biological and chemical terrorism. Ann. Emerg. Med. 2002, 39, 422–429. [Google Scholar] [CrossRef] [PubMed]
- Zheng, W.; Aitken, R.; Muscatello, D.J.; Churches, T. Potential for early warning of viral influenza activity in the community by monitoring clinical diagnoses of influenza in hospital emergency departments. BMC Public Health 2007, 7, 250. [Google Scholar] [CrossRef] [PubMed]
- Inglesby, T.V.; Henderson, D.A.; Bartlett, J.G.; Ascher, M.S.; Eitzen, E.; Friedlander, A.M.; Hauer, J.; McDade, J.; Osterholm, M.T.; O’Toole, T.; et al. Anthrax as a biological weapon. JAMA 1999, 281, 1735. [Google Scholar] [CrossRef] [PubMed]
- Wagner, M.M.; Robinson, J.M.; Tsui, F.C.; Espino, J.U.; Hogan, W.R. Design of a national retail data monitor for public health surveillance. J. Am. Med. Inform. Assoc. 2003, 10, 409–418. [Google Scholar] [CrossRef] [PubMed]
- Rotz, L.D.; Hughes, J.M. Advances in detecting and responding to threats from bioterrorism and emerging infectious disease. Nat. Med. 2004, 10, S130. [Google Scholar] [CrossRef] [PubMed]
- Heffernan, R.; Mostashari, F.; Das, D.; Besculides, M.; Rodriguez, C.; Greenko, J. New York City syndromic surveillance systems. Morb. Mortal. Wkly. Rep. 2004, 53, 25–27. [Google Scholar]
- Sosin, D.M. Syndromic surveillance: The case for skillful investment. Biosecur. Bioterror. 2003, 1, 247–253. [Google Scholar] [CrossRef] [PubMed]
- Hope, K.; Durrheim, D.N.; d’Espaignet, E.T.; Dalton, C. Syndromic surveillance: Is it a useful tool for local outbreak detection? J. Epidemiol. Commun. Health 2006, 60, 374. [Google Scholar] [CrossRef]
- Hutwagner, L.C.; Thompson, W.W.; Seeman, G.M.; Treadwell, T. A simulation model for assessing aberration detection methods used in public health surveillance for systems with limited baselines. Stat. Med. 2005, 24, 543–550. [Google Scholar] [CrossRef] [PubMed]
- Travers, D.A.; Haas, S.W. Evaluation of emergency medical text processor, a system for cleaning chief complaint text data. Acad. Emerg. Med. 2004, 11, 1170–1176. [Google Scholar] [CrossRef] [PubMed]
- Sosin, D.M.; Thomasis, J.D. Evaluation challenges for syndromic surveillance—Making incremental progress. Morb. Mortal. Wkly. Rep. 2004, 53, 125–129. [Google Scholar]
- Kleinman, K.; Abrams, A.; Yih, W.K.; Platt, R.; Kulldorff, M. Evaluating spatial surveillance: Detection of known outbreaks in real data. Stat. Med. 2006, 25, 755–769. [Google Scholar] [CrossRef] [PubMed]
- Mocny, M. A comparison of two methods for biosurveillance of respiratory disease in the emergency department: Chief complaint vs icd9 diagnosis code. Acad. Emerg. Med. 2003, 10, 513. [Google Scholar] [CrossRef]
- Burkom, H.S.; Murphy, S.P.; Shmueli, G. Automated time series forecasting for biosurveillance. Stat. Med. 2007, 26, 4202–4218. [Google Scholar] [CrossRef] [PubMed]
- Rolland, E.; Moore, K.M.; Robinson, V.A.; McGuinness, D. Using Ontario’s “Telehealth” health telephone helpline as an early-warning system: A study protocol. BMC Health Serv. Res. 2006, 6, 10. [Google Scholar] [CrossRef] [PubMed]
- Widdowson, M.A.; Bosman, A.; van Straten, E.; Tinga, M.; Chaves, S.; van Eerden, L.; van Pelt, W. Automated, laboratory-based system using the internet for disease outbreak detection, the Netherlands. Emerg. Infect. Dis. 2003, 9, 1046–1052. [Google Scholar] [CrossRef] [PubMed]
- Zelicoff, A.; Brillman, J.; Forslund, D.W.; George, J.E.; Zink, S.; Koenig, S.; Staab, T.; Simpson, G.; Umland, E.; Bersell, K. The rapid syndrome validation project (RSVP). In Proceedings of the American Medical Informatics Association (AMIA) Symposium, Washington, DC, USA, 3–7 November 2001; pp. 771–775. [Google Scholar]
- Miller, J.R.; Mikol, Y. Sur veillance for diarrheal disease in New York City. J. Urban Health 1999, 76, 388–390. [Google Scholar] [CrossRef] [PubMed] [Green Version]
- Meltzer, M.; Damon, I.; LeDuc, J.W.; Millar, J.D. Modeling potential responses to smallpox as a bioterrorist weapon. Emerg. Infect. Dis. 2001, 7, 959–969. [Google Scholar] [CrossRef] [PubMed]
- Green, M.S.; Kaufman, Z. Surveillance for early detection and monitoring of infectious disease outbreaks associated with bioterrorism. Isr. Med. Assoc. J. 2002, 4, 503–506. [Google Scholar] [PubMed]
- Roush, S.; Birkhead, G.; Koo, D.; Cobb, A.; Fleming, D. Mandatory reporting of diseases and conditions by health care professionals and laboratories. JAMA 1999, 282, 164–170. [Google Scholar] [PubMed]
- Hripcsak, G.; Wilcox, A. Reference standards, judges, and comparison subjects: Roles for experts in evaluating system performance. J. Am. Med. Inform. Assoc. 2002, 9, 1–15. [Google Scholar] [CrossRef] [PubMed]
- Mitchell, T. Machine Learning; McGraw Hill: Burr Ridge, IL, USA, 1997. [Google Scholar]
- Kuehnert, M.J.; Doyle, T.J.; Hill, H.A.; Bridges, C.B.; Jernigan, J.A.; Dull, P.M.; Reissman, D.B.; Ashford, D.A.; Jernigan, D.B. Clinical features that discriminate inhalational anthrax from other acute respiratory illnesses. Clin. Infect. Dis. 2003, 36, 328–336. [Google Scholar] [CrossRef] [PubMed]
- Quénel, P.; Dab, W. Influenza A and B epidemic criteria based on time-series analysis of health services surveillance data. Eur. J. Epidemiol. 1998, 14, 275–285. [Google Scholar] [CrossRef] [PubMed]
- Broome, C.V.; Pinner, R.W.; Sosin, D.M.; Treadwell, T.A. On the threshold. Am. J. Prev. Med. 2002, 23, 229–230. [Google Scholar] [CrossRef]
- Jorm, L.R. Watching the Games: Public health surveillance for the Sydney 2000 Olympic Games. J. Epidemiol. Community Health 2003, 57, 102–108. [Google Scholar] [CrossRef] [PubMed]
- Rodman, J.S.; Frost, F. Using nurse hot line calls for disease surveillance. Emerg. Infect. Dis. 1998, 4, 329–332. [Google Scholar] [CrossRef] [PubMed]
- Chapman, W.W.; Dowling, J.N.; Wagner, M.M. Generating a reliable reference standard set for syndromic case classification. J. Am. Med. Inform. Assoc. 2005, 12, 618–629. [Google Scholar] [CrossRef] [PubMed]
- Pavlin, J.A.; Mostashari, F.; Kortepeter, M.G.; Hynes, N.A.; Chotani, R.A.; Mikol, Y.B.; Ryan, M.A.; Neville, J.S.; Gantz, D.T.; Writer, J.V.; et al. Innovative surveillance methods for rapid detection of disease outbreaks and bioterrorism: Results of an interagency workshop on health indicator surveillance. Am. J. Public Health 2003, 93, 1230–1235. [Google Scholar] [CrossRef] [PubMed]
- Wagner, M.M.; Dato, V.; Dowling, J.N.; Allswede, M. Representative threats for research in public health surveillance. J. Biomed. Inform. 2003, 36, 177–188. [Google Scholar] [CrossRef]
- Greenko, J.; Mostashari, F.; Fine, A.; Layton, M. Clinical evaluation of the Emergency Medical Services (EMS) ambulance dispatch-based syndromic surveillance system, New York City. J. Urban Health 2003, 80, i50–i56. [Google Scholar] [PubMed]
- Pavlin, J.A. Investigation of disease outbreaks detected by syndromic´ surveillance systems. J. Urban Health 2003, 80, i107–i114. [Google Scholar] [PubMed]
- Cassa, C.A.; Grannis, S.J.; Overhage, J.M.; Mandl, K.D. A context-sensitive approach to anonymizing spatial surveillance data: Impact on outbreak detection. J. Am. Med. Inform. Assoc. 2006, 13, 160–165. [Google Scholar] [CrossRef] [PubMed]
- Waller, L.A.; Gotway, C.A. Applied Spatial Statistics for Public Health Data; John Wiley & Sons, Inc.: Hoboken, NJ, USA, 2004. [Google Scholar]
- Ryan, A.G.; Woodall, W.H. Control charts for poisson count data with varying sample sizes. J. Qual. Technol. 2010, 42, 260–275. [Google Scholar] [CrossRef]
- Sonesson, C.; Bock, D. A review and discussion of prospective statistical surveillance in public health. J. R. Stat. Soc. Ser. A Stat. Soc. 2003, 166, 5–21. [Google Scholar] [CrossRef]
- Patil, G.P.; Taillie, C. Geographic and network surveillance via scan statistics for critical area detection. Stat. Sci. 2003, 18, 457–465. [Google Scholar] [CrossRef]
- Mei, Y.; Han, S.W.; Tsui, K.L. Early detection of a change in Poisson rate after accounting for population size effects. Stat. Sin. 2011, 21, 597–624. [Google Scholar] [CrossRef]
- Sonesson, C. A CUSUM framework for detection of space–time disease clusters using scan statistics. Stat. Med. 2007, 26, 4770–4789. [Google Scholar] [CrossRef] [PubMed]
- Sweeney, L. Guaranteeing anonymity when sharing medical data, the Datafly System. In Proceedings of the Conference of the American Medical Informatics Association (AMIA) Annual Fall Symposium, Nashville, TN, USA, 25–29 October 1997; pp. 51–55. [Google Scholar]
- Franz, D.R.; Jahrling, P.B.; Friedlander, A.M.; McClain, D.J.; Hoover, D.L.; Bryne, W.R.; Pavlin, J.A.; Christopher, G.W.; Eitzen, E.M. Clinical recognition and management of patients exposed to biological warfare agents. J. Am. Med. Assoc. 1997, 278, 399–411. [Google Scholar] [CrossRef]
- Buckeridge, D.L.; Musen, M.A.; Switzer, P.; Crubézy, M. An analytic framework fo space-time aberrancy detection in public health surveillance data. In Proceedings of the Conference of the American Medical Informatics Association (AMIA) Annual Fall Symposium, Washington, DC, USA, 8–12 November 2003; pp. 120–124. [Google Scholar]
- Dórea, F.C.; Sanchez, J.; Revie, C.W. Veterinary syndromic surveillance: Current initiatives and potential for development. Prev. Vet. Med. 2011, 101, 1–17. [Google Scholar] [CrossRef] [PubMed]
- Hutwagner, L.C.; Maloney, E.K.; Bean, N.H.; Slutsker, L.; Martin, S.M. Using laboratory-based surveillance data for prevention: An algorithm for detecting salmonella outbreaks. Emerg. Infect. Dis. 1997, 3, 395–400. [Google Scholar] [CrossRef] [PubMed]
- Ozonoff, A.; Jeffery, C.; Manjourides, J.; White, L.F.; Pagano, M. Effect of spatial resolution on cluster detection: A simulation study. Int. J. Health Geogr. 2007, 6, 52. [Google Scholar] [CrossRef] [PubMed] [Green Version]
- Duczmal, L.; Assunção, R. A simulated annealing strategy for the detection of arbitrarily shaped spatial clusters. Comput. Stat. Data Anal. 2004, 45, 269–286. [Google Scholar] [CrossRef]
- Buckeridge, D.L.; Burkom, H.; Campbell, M.; Hogan, W.R.; Moore, A.W. Algorithms for rapid outbreak detection: A research synthesis. J. Biomed. Inform. 2005, 38, 99–113. [Google Scholar] [CrossRef] [PubMed]
- Kulldorff, M.; Zhang, Z.; Hartman, J.; Heffernan, R.; Huang, L.; Mostashari, F. Benchmark Data and Power Calculations for Evaluating Disease Outbreak Detection Methods. Morb. Mortal. Wkly. Rep. 2004, 53, 144–151. [Google Scholar]
- Kleinman, K.P.; Abrams, A.M.; Kulldorff, M.; Platt, R. A model-adjusted space–time scan statistic with an application to syndromic surveillance. Epidemiol. Infect. 2005, 133, 409–419. [Google Scholar] [CrossRef] [PubMed] [Green Version]
- Lawson, A.B.; Kleinman, K. (Eds.) Spatial and Syndromic Surveillance for Public Health; John Wiley & Sons, Ltd.: Hoboken, NJ, USA, 2005. [Google Scholar]
- Kulldorff, M. Prospective time periodic geographical disease surveillance using a scan statistic. J. R. Stat. Soc. Ser. A Stat. Soc. 2001, 164, 61–72. [Google Scholar] [CrossRef]
- Lawson, A.B. Large scale: Surveillance. In Statistical Methods in Spatial Epidemiology; John Wiley & Sons, Ltd.: Hoboken, NJ, USA, 2013; pp. 293–312. [Google Scholar]
- Kleinman, K.; Lazarus, R.; Platt, R. A generalized linear mixed models approach for detecting incident clusters of disease in small areas, with an application to biological terrorism. Am. J. Epidemiol. 2004, 159, 217–224. [Google Scholar] [CrossRef] [PubMed]
- Jensen, W.A.; Jones-Farmer, L.A.; Champ, C.W.; Woodall, W.H. Effects of parameter estimation on control chart properties: A literature review. J. Qual. Technol. 2006, 38, 349–364. [Google Scholar] [CrossRef]
- Han, S.W.; Tsui, K.L.; Ariyajunya, B.; Kim, S.B. A comparison of CUSUM, EWMA, and temporal scan statistics for detection of increases in poisson rates. Qual. Reliab. Eng. Int. 2010, 26, 279–289. [Google Scholar] [CrossRef]
- Kulldorff, M.; Mostashari, F.; Duczmal, L.; Yih, W.K.; Kleinman, K.; Platt, R. Multivariate scan statistics for disease surveillance. Stat. Med. 2007, 26, 1824–1833. [Google Scholar] [CrossRef] [PubMed] [Green Version]
- Gordis, L. Ethical and professional issues in the changing practice of epidemiology. J. Clin. Epidemiol. 1991, 44, 9–13. [Google Scholar] [CrossRef]
- Kulldorff, M.; Tango, T.; Park, P.J. Power comparisons for disease clustering tests. Comput. Stat. Data Anal. 2003, 42, 665–684. [Google Scholar] [CrossRef]
- Assunção, R.; Costa, M.; Tavares, A.; Ferreira, S. Fast detection of arbitrarily shaped disease clusters. Stat. Med. 2006, 25, 723–742. [Google Scholar] [CrossRef] [PubMed]
- Williamson, G.D.; Weatherby Hudson, G. A monitoring system for detecting aberrations in public health surveillance reports. Stat. Med. 1999, 18, 3283–3298. [Google Scholar] [CrossRef]
- Rogerson, P.A.; Yamada, I. Approaches to syndromic surveillance when data consist of small regional counts. Morb. Mortal. Wkly. Rep. 2004, 53, 79–85. [Google Scholar]
- Cowling, B.J.; Wong, I.O.L.; Ho, L.M.; Riley, S.; Leung, G.M. Methods for monitoring influenza surveillance data. Int. J. Epidemiol. 2006, 35, 1314–1321. [Google Scholar] [CrossRef] [PubMed] [Green Version]
- Rolka, H.; Burkom, H.; Cooper, G.F.; Kulldorff, M.; Madigan, D.; Wong, W.K. Issues in applied statistics for public health bioterrorism surveillance using multiple data streams: Research needs. Stat. Med. 2007, 26, 1834–1856. [Google Scholar] [CrossRef] [PubMed]
- Mostashari, F.; Kulldorff, M.; Hartman, J.J.; Miller, J.R.; Kulasekera, V. Dead bird clusters as an early warning system for west nile virus activity. Emerg. Infect. Dis. 2003, 9, 641–646. [Google Scholar] [CrossRef] [PubMed]
- Kulldorff, M.; Nagarwalla, N. Spatial disease clusters: Detection and inference. Stat. Med. 1995, 14, 799–810. [Google Scholar] [CrossRef] [PubMed]
- Shmueli, G.; Burkom, H. Statistical challenges facing early outbreak detection in biosurveillance. Technometrics 2010, 52, 39–51. [Google Scholar] [CrossRef]
- Patil, G.P.; Taillie, C. Upper level set scan statistic for detecting arbitrarily shaped hotspots. Environ. Ecol. Stat. 2004, 11, 183–197. [Google Scholar] [CrossRef] [Green Version]
- Fienberg, S.E.; Shmueli, G. Statistical issues and challenges associated with rapid detection of bio-terrorist attacks. Stat. Med. 2005, 24, 513–529. [Google Scholar] [CrossRef] [PubMed]
- Jackson, M.L.; Baer, A.; Painter, I.; Duchin, J. A simulation study comparing aberration detection algorithms for syndromic surveillance. BMC Med. Inf. Decis. Mak. 2007, 7, 6. [Google Scholar] [CrossRef] [PubMed]
- Dafni, U.G.; Tsiodras, S.; Panagiotakos, D.; Gkolfinopoulou, K.; Kouvatscas, G.; Tsourti, Z. Algorithm for statistical detection of peaks—Syndromic surveillance system for the Athens 2004 Olympic Games. Morb. Mortal. Wkly. Rep. 2004, 53, 86–94. [Google Scholar]
- Unkel, S.; Farrington, C.P.; Garthwaite, P.H.; Robertson, C.; Andrews, N. Statistical methods for the prospective detection of infectious disease outbreaks: A review. J. R. Stat. Soc. Ser. A Stat. Soc. 2012, 175, 49–82. [Google Scholar] [CrossRef]
- Brookmeyer, R.; Johnson, E.; Bollinger, R. Public health vaccination policies for containing an anthrax outbreak. Nature 2004, 432, 901–904. [Google Scholar] [CrossRef] [PubMed] [Green Version]
- Cançado, A.L.; Duarte, A.R.; Duczmal, L.H.; Ferreira, S.J.; Fonseca, C.M.; Gontijo, E.C. Penalized likelihood and multi-objective spatial scans for the detection and inference of irregular clusters. Int. J. Health Geogr. 2010, 9, 55. [Google Scholar] [CrossRef] [PubMed] [Green Version]
- Neill, D.B.; Cooper, G.F. A multivariate Bayesian scan statistic for early event detection and characterization. Mach. Learn. 2009, 79, 261–282. [Google Scholar] [CrossRef] [Green Version]
- Duarte, A.R.; Duczmal, L.; Ferreira, S.J.; Cançado, A.L. Internal cohesion and geometric shape of spatial clusters. Environ. Ecol. Stat. 2010, 17, 203–229. [Google Scholar] [CrossRef]
- Duczmal, L.; Tavares, R.; Patil, G.; Cançado, A.L. Testing spatial cluster occurrence in maps equipped with environmentally defined structures. Environ. Ecol. Stat. 2010, 17, 183–202. [Google Scholar] [CrossRef]
- Gangnon, R.E. A model for space-time cluster detection using spatial clusters with flexible temporal risk patterns. Stat. Med. 2010, 29, 2325–2337. [Google Scholar] [CrossRef] [PubMed]
- Gómez-Rubio, V.; López-Quílez, A. Statistical methods for the geographical analysis of rare diseases. In Rare Diseases Epidemiology; Springer: Dordrecht, The Netherlands, 2010; pp. 151–171. [Google Scholar]
- Chimka, J.R. Gamma regressive individuals control charts for influenza activity. Qual. Eng. 2009, 21, 182–189. [Google Scholar] [CrossRef]
- Rakitzis, A.C.; Castagliola, P.; Maravelakis, P.E. A new memory-type monitoring technique for count data. Comput. Ind. Eng. 2015, 85, 235–247. [Google Scholar] [CrossRef]
- Han, S.W.; Jiang, W.; Shu, L.; Tsui, K.L. A comparison of likelihood-based spatiotemporal monitoring methods under non-homogenous population size. Commun. Stat. Simul. Comput. 2014, 44, 14–39. [Google Scholar] [CrossRef]
- Han, S.W.; Zhong, H. A comparison of MCUSUM-based and MEWMA-based spatiotemporal surveillance under non-homogeneous populations. Qual. Reliab. Eng. Int. 2014, 31, 1449–1472. [Google Scholar] [CrossRef]
- Han, S.W.; Lee, K.J.; Zhong, H.; Kim, S.B. A comparison of spatiotemporal surveillance methods for nonhomogeneous change size. Commun. Stat. Simul. Comput. 2014, 44, 2714–2730. [Google Scholar] [CrossRef]
- Saghir, A.; Lin, Z. Control charts for dispersed count data: An overview. Qual. Reliab. Eng. Int. 2014, 31, 725–739. [Google Scholar] [CrossRef]
- Shu, L.; Jiang, W.; Tsui, K.L. A comparison of weighted CUSUM procedures that account for monotone changes in population size. Stat. Med. 2010, 30, 725–741. [Google Scholar] [CrossRef] [PubMed]
- Wilson, J.G.; Ballou, J.; Yan, C.; Fisher-Hoch, S.P.; Reininger, B.; Gay, J.; Salinas, J.; Sanchez, P.; Salinas, Y.; Calvillo, F.; et al. Utilizing spatiotemporal analysis of influenza-like illness and rapid tests to focus swine-origin influenza virus intervention. Health Place 2010, 16, 1230–1239. [Google Scholar] [CrossRef] [PubMed] [Green Version]
- Zhao, H.; Shu, L.; Tsui, K.L. A window-limited generalized likelihood ratio test for monitoring Poisson processes with linear drifts. J. Stat. Comput. Simul. 2014, 85, 2975–2988. [Google Scholar] [CrossRef]
- Das, D.; Weiss, D.; Mostashari, F.; Treadwell, T.; McQuiston, J.; Hutwagner, L.; Karpati, A.; Bornschlegel, K.; Seeman, M.; Turcios, R.; et al. Enhanced drop-in syndromic surveillance in New York City following September 11, 2001. J. Urban Health 2003, 80, i76–i88. [Google Scholar] [PubMed]
- Khan, A.S.; Fleischauer, A.; Casani, J.; Groseclose, S.L. The next public health revolution: Public health information fusion and social networks. Am. J. Public Health 2010, 100, 1237–1242. [Google Scholar] [CrossRef] [PubMed]
- Scherm, H.; Thomas, C.; Garrett, K.; Olsen, J. Meta-analysis and other approaches for synthesizing structured and unstructured data in plant pathology. Annu. Rev. Phytopathol. 2014, 52, 453–476. [Google Scholar] [CrossRef] [PubMed]
- Thompson, L.H.; Malik, M.T.; Gumel, A.; Strome, T.; Mahmud, S.M. Emergency department and ‘Google flu trends’ data as syndromic surveillance indicators for seasonal influenza. Epidemiol. Infect. 2014, 142, 2397–2405. [Google Scholar] [CrossRef] [PubMed]
- Turbelin, C.; Boelle, P.Y. Open data in public health surveillance systems: A case study using the French Sentinelles network. Int. J. Med. Inform. 2013, 82, 1012–1021. [Google Scholar] [CrossRef] [PubMed]
- Salathé, M.; Khandelwal, S. Assessing Vaccination Sentiments with Online Social Media: Implications for Infectious Disease Dynamics and Control. PLoS Comput. Biol. 2011, 7, e1002199. [Google Scholar] [CrossRef] [PubMed]
- Chretien, J.P.; George, D.; Shaman, J.; Chitale, R.A.; McKenzie, F.E. Influenza forecasting in Human populations: A scoping review. PLoS ONE 2014, 9, e94130. [Google Scholar] [CrossRef] [PubMed]
- Kang, M.; Zhong, H.; He, J.; Rutherford, S.; Yang, F. Using google trends for influenza surveillance in South China. PLoS ONE 2013, 8, e55205. [Google Scholar] [CrossRef] [PubMed]
- Butler, D. When google got flu wrong. Nature 2013, 494, 155–156. [Google Scholar] [CrossRef] [PubMed]
- Eysenbach, G. Infodemiology and Infoveillance. Am. J. Prev. Med. 2011, 40, S154–S158. [Google Scholar] [CrossRef] [PubMed]
- McIver, D.J.; Brownstein, J.S. Wikipedia usage estimates prevalence of influenza-like illness in the United States in near real-time. PLoS Comput. Biol. 2014, 10, e1003581. [Google Scholar] [CrossRef] [PubMed] [Green Version]
- Calain, P. From the field side of the binoculars: A different view on global public health surveillance. Health Policy Plan. 2007, 22, 13–20. [Google Scholar] [CrossRef] [PubMed]
- Shaman, J.; Karspeck, A. Forecasting seasonal outbreaks of influenza. Proc. Natl. Acad. Sci. USA 2012, 109, 20425–20430. [Google Scholar] [CrossRef] [PubMed] [Green Version]
- Dugas, A.F.; Hsieh, Y.H.; Levin, S.R.; Pines, J.M.; Mareiniss, D.P.; Mohareb, A.; Gaydos, C.A.; Perl, T.M.; Rothman, R.E. Google flu trends: Correlation with emergency department influenza rates and crowding metrics. Clin. Infect. Dis. 2012, 54, 463–469. [Google Scholar] [CrossRef] [PubMed]
- Ayers, J.W.; Althouse, B.M.; Allem, J.P.; Rosenquist, J.N.; Ford, D.E. Seasonality in seeking mental health information on Google. Am. J. Prev. Med. 2013, 44, 520–525. [Google Scholar] [CrossRef] [PubMed]
- Santillana, M.; Zhang, D.W.; Althouse, B.M.; Ayers, J.W. What can digital disease detection learn from (an external revision to) google flu trends? Am. J. Prev. Med. 2014, 47, 341–347. [Google Scholar] [CrossRef] [PubMed]
- Chew, C.; Eysenbach, G. Pandemics in the age of twitter: Content analysis of tweets during the 2009 h1n1 outbreak. PLoS ONE 2010, 5, e14118. [Google Scholar] [CrossRef] [PubMed]
- Freifeld, C.C.; Mandl, K.D.; Reis, B.Y.; Brownstein, J.S. HealthMap: Global infectious disease monitoring through automated classification and visualization of internet media reports. J. Am. Med. Inform. Assoc. 2008, 15, 150–157. [Google Scholar] [CrossRef] [PubMed]
- Lazer, D.; Kennedy, R.; King, G.; Vespignani, A. The parable of google flu: Traps in big data analysis. Science 2014, 343, 1203–1205. [Google Scholar] [CrossRef] [PubMed] [Green Version]
- Ortiz, J.R.; Zhou, H.; Shay, D.K.; Neuzil, K.M.; Fowlkes, A.L.; Goss, C.H. Monitoring influenza activity in the United States: A comparison of traditional surveillance systems with google flu trends. PLoS ONE 2011, 6, e18687. [Google Scholar] [CrossRef] [PubMed]
- Polgreen, P.M.; Chen, Y.; Pennock, D.M.; Nelson, F.D. Using internet searches for influenza surveillance. Clin. Infect. Dis. 2008, 47, 1443–1448. [Google Scholar] [CrossRef] [PubMed]
- Brownstein, J.S.; Freifeld, C.C.; Reis, B.Y.; Mandl, K.D. Surveillance sans frontières: Internet-based emerging infectious disease intelligence and the healthmap project. PLoS Med. 2008, 5, e151. [Google Scholar] [CrossRef] [PubMed]
- Salathé, M.; Bengtsson, L.; Bodnar, T.J.; Brewer, D.D.; Brownstein, J.S.; Buckee, C.; Campbell, E.M.; Cattuto, C.; Khandelwal, S.; Mabry, P.L.; et al. Digital epidemiology. PLoS Comput. Biol. 2012, 8, e1002616. [Google Scholar] [CrossRef] [PubMed] [Green Version]
- Hulth, A.; Rydevik, G.; Linde, A. Web queries as a source for syndromic surveillance. PLoS ONE 2009, 4, e4378. [Google Scholar] [CrossRef] [PubMed]
- Jones, K.E.; Patel, N.G.; Levy, M.A.; Storeygard, A.; Balk, D.; Gittleman, J.L.; Daszak, P. Global trends in emerging infectious diseases. Nature 2008, 451, 990–993. [Google Scholar] [CrossRef] [PubMed] [Green Version]
- Signorini, A.; Segre, A.M.; Polgreen, P.M. The use of twitter to track levels of disease activity and public concern in the U.S. during the influenza A H1N1 pandemic. PLoS ONE 2011, 6, e19467. [Google Scholar] [CrossRef] [PubMed]
- Chunara, R.; Andrews, J.R.; Brownstein, J.S. Social and news media enable estimation of epidemiological patterns early in the 2010 Haitian cholera outbreak. Am. J. Trop. Med. Hyg. 2012, 86, 39–45. [Google Scholar] [CrossRef] [PubMed]
- Dugas, A.F.; Jalalpour, M.; Gel, Y.; Levin, S.; Torcaso, F.; Igusa, T.; Rothman, R.E. Influenza forecasting with google flu trends. PLoS ONE 2013, 8, e56176. [Google Scholar] [CrossRef] [PubMed]
- Seifter, A.; Schwarzwalder, A.; Geis, K.; Aucott, J. The utility of “Google Trends” for epidemiological research: Lyme disease as an example. Geospat. Health 2010, 4, 135. [Google Scholar] [CrossRef] [PubMed] [Green Version]
- Cook, S.; Conrad, C.; Fowlkes, A.L.; Mohebbi, M.H. Assessing google flu trends performance in the United States during the 2009 influenza virus A (H1N1) pandemic. PLoS ONE 2011, 6, e23610. [Google Scholar] [CrossRef] [PubMed]
- Flahault, A.; Blanchon, T.; Dorléans, Y.; Toubiana, L.; Vibert, J.F.; Valleron, A.J. Virtual surveillance of communicable diseases: A 20-year experience in France. Stat. Methods Med. Res. 2006, 15, 413–421. [Google Scholar] [CrossRef] [PubMed]
- Pelat, C.; Turbelin, C.; Bar-Hen, A.; Flahault, A.; Valleron, A.J. More diseases tracked by using google trends. Emerg. Infect. Dis. 2009, 15, 1327–1328. [Google Scholar] [CrossRef] [PubMed]
- Shaman, J.; Karspeck, A.; Yang, W.; Tamerius, J.; Lipsitch, M. Real-time influenza forecasts during the 2012–2013 season. Nat. Commun. 2013, 4, 2837. [Google Scholar] [CrossRef] [PubMed] [Green Version]
- Wilson, K.; Brownstein, J.S. Early detection of disease outbreaks using the internet. Can. Med. Assoc. J. 2009, 180, 829–831. [Google Scholar] [CrossRef]
- Olson, D.R.; Konty, K.J.; Paladini, M.; Viboud, C.; Simonsen, L. Reassessing google flu trends data for detection of seasonal and pandemic influenza: A comparative epidemiological study at three geographic scales. PLoS Comput. Biol. 2013, 9, e1003256. [Google Scholar] [CrossRef] [PubMed]
- Eysenbach, G. Infodemiology: Tracking flu-related searches on the web for syndromic surveillance. In Proceedings of the Conference of the American Medical Informatics Association (AMIA) Annual Fall Symposium, Washington, DC, USA, 2006; pp. 244–248. [Google Scholar]
- Olson, K.L.; Grannis, S.J.; Mandl, K.D. Privacy protection versus cluster detection in spatial epidemiology. Am. J. Public Health 2006, 96, 2002–2008. [Google Scholar] [CrossRef] [PubMed]
- Kulldorff, M.; Huang, L.; Pickle, L.; Duczmal, L. An elliptic spatial scan statistic. Stat. Med. 2006, 25, 3929–3943. [Google Scholar] [CrossRef] [PubMed]
- Generous, N.; Fairchild, G.; Deshpande, A.; Valle, S.Y.D.; Priedhorsky, R. Global disease monitoring and forecasting with wikipedia. PLoS Comput. Biol. 2014, 10, e1003892. [Google Scholar] [CrossRef] [PubMed]
- Martin, L.J.; Xu, B.; Yasui, Y. Improving google flu trends estimates for the united states through transformation. PLoS ONE 2014, 9, e109209. [Google Scholar] [CrossRef] [PubMed]
- Nagar, R.; Yuan, Q.; Freifeld, C.C.; Santillana, M.; Nojima, A.; Chunara, R.; Brownstein, J.S. A case study of the new york city 2012–2013 influenza season with daily geocoded twitter data from temporal and spatiotemporal perspectives. J. Med. Internet Res. 2014, 16, e236. [Google Scholar] [CrossRef] [PubMed]
- Al-Tawfiq, J.A.; Zumla, A.; Gautret, P.; Gray, G.C.; Hui, D.S.; Al-Rabeeah, A.A.; Memish, Z.A. Surveillance for emerging respiratory viruses. Lancet Infect. Dis. 2014, 14, 992–1000. [Google Scholar] [CrossRef]
- Araz, O.M.; Bentley, D.; Muelleman, R.L. Using Google Flu Trends data in forecasting influenza-like–illness related ED visits in Omaha, Nebraska. Am. J. Emerg. Med. 2014, 32, 1016–1023. [Google Scholar] [CrossRef] [PubMed]
- Debin, M.; Turbelin, C.; Blanchon, T.; Bonmarin, I.; Falchi, A.; Hanslik, T.; Levy-Bruhl, D.; Poletto, C.; Colizza, V. Evaluating the feasibility and participants’ representativeness of an online nationwide surveillance system for influenza in france. PLoS ONE 2013, 8, e73675. [Google Scholar] [CrossRef] [PubMed]
- Domnich, A.; Panatto, D.; Signori, A.; Lai, P.L.; Gasparini, R.; Amicizia, D. Age-related differences in the accuracy of web query-based predictions of influenza-like illness. PLoS ONE 2015, 10, e0127754. [Google Scholar] [CrossRef] [PubMed]
- Nuti, S.V.; Wayda, B.; Ranasinghe, I.; Wang, S.; Dreyer, R.P.; Chen, S.I.; Murugiah, K. The use of google trends in health care research: A systematic review. PLoS ONE 2014, 9, e109583. [Google Scholar] [CrossRef] [PubMed]
- Timpka, T.; Spreco, A.; Dahlstrom, O.; Eriksson, O.; Gursky, E.; Ekberg, J.; Blomqvist, E.; Stromgren, M.; Karlsson, D.; Eriksson, H.; et al. Performance of ehealth data sources in local influenza surveillance: A 5-year open cohort study. J. Med. Internet Res. 2014, 16, e116.236. [Google Scholar] [CrossRef] [PubMed]
- Viboud, C.; Charu, V.; Olson, D.; Ballesteros, S.; Gog, J.; Khan, F.; Grenfell, B.; Simonsen, L. Demonstrating the use of high-volume electronic medical claims data to monitor local and regional influenza activity in the US. PLoS ONE 2014, 9, e102429. [Google Scholar] [CrossRef] [PubMed]
- Held, L.; Meyer, S.; Bracher, J. Probabilistic forecasting in infectious disease epidemiology: The 13th Armitage lecture. Stat. Med. 2017, 36, 3443–3460. [Google Scholar] [CrossRef] [PubMed]
- Pollett, S.; Boscardin, W.J.; Azziz-Baumgartner, E.; Tinoco, Y.O.; Soto, G.; Romero, C.; Kok, J.; Biggerstaff, M.; Viboud, C.; Rutherford, G.W. Evaluating google flu trends in latin america: Important lessons for the next phase of digital disease detection. Clin. Infect. Dis. 2016, 64, 34–41. [Google Scholar] [CrossRef] [PubMed]
- Yang, S.; Kou, S.C.; Lu, F.; Brownstein, J.S.; Brooke, N.; Santillana, M. Advances in using Internet searches to track dengue. PLoS Comput. Biol. 2017, 13, e1005607. [Google Scholar] [CrossRef] [PubMed]
- Li, Z.; Liu, T.; Zhu, G.; Lin, H.; Zhang, Y.; He, J.; Deng, A.; Peng, Z.; Xiao, J.; Rutherford, S.; et al. Dengue baidu search index data can improve the prediction of local dengue epidemic: A case study in Guangzhou, China. PLoS Negl. Trop. Dis. 2017, 11, e0005354. [Google Scholar] [CrossRef] [PubMed]
- McGough, S.F.; Brownstein, J.S.; Hawkins, J.B.; Santillana, M. Forecasting zika incidence in the 2016 Latin America outbreak combining traditional disease surveillance with search, social media, and news report data. PLoS Negl. Trop. Dis. 2017, 11, e0005295. [Google Scholar] [CrossRef] [PubMed]
- Yan, S.; Chughtai, A.; Macintyre, C. Utility and potential of rapid epidemic intelligence from internet-based sources. Int. J. Infect. Dis. 2017, 63, 77–87. [Google Scholar] [CrossRef] [PubMed]
- Althouse, B.M.; Scarpino, S.V.; Meyers, L.A.; Ayers, J.W.; Bargsten, M.; Baumbach, J.; Brownstein, J.S.; Castro, L.; Clapham, H.; Cummings, D.A.; et al. Enhancing disease surveillance with novel data streams: Challenges and opportunities. EPJ Data Sci. 2015, 4, 17. [Google Scholar] [CrossRef] [PubMed]
- Fung, I.C.; Fu, K.W.; Ying, Y.; Schaible, B.; Hao, Y.; Chan, C.H.; Tse, Z.T. Chinese social media reaction to the MERS-CoV and avian influenza A (H7N9) outbreaks. Infect. Dis. Poverty 2013, 2, 31. [Google Scholar] [CrossRef] [PubMed] [Green Version]
- Gesualdo, F.; Stilo, G.; Agricola, E.; Gonfiantini, M.V.; Pandolfi, E.; Velardi, P.; Tozzi, A.E. Influenza-like illness surveillance on twitter through automated learning of naive language. PLoS ONE 2013, 8, e82489. [Google Scholar] [CrossRef] [PubMed]
- Harsha, A.K.; Schmitt, J.E.; Stavropoulos, S.W. Know your market: Use of online query tools to quantify trends in patient information-seeking behavior for varicose vein treatment. J. Vasc. Interv. Radiol. 2014, 25, 53–57. [Google Scholar] [CrossRef] [PubMed]


| Rank | Countries | Institutions | ||
|---|---|---|---|---|
| Frequency | Country | Frequency | Institution | |
| 1 | 4388 | USA | 346 | The US Centers for Disease Control and Prevention (CDC) |
| 2 | 1158 | England | 317 | Harvard University |
| 3 | 723 | Canada | 146 | Johns Hopkins University |
| 4 | 703 | France | 127 | The University of Toronto |
| 5 | 696 | Australia | 118 | The London School of Hygiene and Tropical Medicine |
| 6 | 651 | China | 117 | University of Washington |
| 7 | 460 | Germany | 112 | University of North Carolina |
| 8 | 412 | Netherlands | 108 | Emory University |
| 9 | 349 | Italy | 101 | Colombia University |
| 10 | 319 | Spain | 100 | Public Health England (PHE) |
| Freq | First Author | Journal | ID |
|---|---|---|---|
| 400 | Freedman [12] | New England Journal of Medicine | 7 |
| 314 | Ginsberg [13] | Nature | 2 |
| 165 | Eysenbach [14] | Journal of Medical Internet Research | 2 |
| 163 | Carneiro [15] | Clinical Infectious Diseases | 2 |
| 158 | Frumkin [16] | American Journal of Public Health | 18 |
| 112 | Heffernan [17] | Emerging Infectious Diseases | 0 |
| 110 | East [18] | Gastroenterology Clinics | 5 |
| 108 | Mandl [19] | American Medical Informatics Association | 0 |
| 102 | Tarpey [20] | Nature genetics | 23 |
| ID | Size | Silhouette | Label (TFIDF) | Label (LLR) | Label (MI) | Mean (Cited Year) |
|---|---|---|---|---|---|---|
| 0 | 98 | 0.827 | Syndromic | Olympic Winter Game | Disease/Surveillance | 2002 |
| Surveillance | ||||||
| 1 | 48 | 0.902 | Syndromic | ESSENCE II | EWMA Control Chart | 2004 |
| Surveillance | ||||||
| 2 | 42 | 0.965 | Social Media | Google Flu Trend | Crowd-Sourced | 2011 |
| References | Year | Strength | Begin | End |
|---|---|---|---|---|
| Tsui [31] | 2003 | 19.9434 | 2003 | 2009 |
| Lazarus [32] | 2001 | 15.8522 | 2003 | 2007 |
| Lober Wb [33] | 2002 | 15.2485 | 2003 | 2007 |
| Harrison [34] | 1998 | 13.4989 | 1999 | 2004 |
| Jernigan [35] | 2001 | 10.7473 | 2003 | 2007 |
| Wagner [36] | 2001 | 9.3688 | 2003 | 2009 |
| Grosskurth [37] | 1995 | 9.1135 | 1998 | 2003 |
| Tsui [31] | 2001 | 8.6241 | 2003 | 2007 |
| Clericuzio [38] | 1995 | 7.7979 | 1996 | 2003 |
| Davidson [39] | 1993 | 7.4926 | 1993 | 2000 |
| Jernigan [35] | 2001 | 6.6318 | 2002 | 2006 |
| Rasmussen [40] | 1996 | 6.081 | 1998 | 2004 |
| Ivanov [41] | 2002 | 5.938 | 2003 | 2005 |
| Vergis [42] | 2000 | 5.5716 | 2001 | 2004 |
| Croen [43] | 1996 | 4.9109 | 2000 | 2004 |
| Kura [44] | 1998 | 4.5936 | 2000 | 2003 |
| Wilkinson [45] | 1998 | 4.5826 | 1999 | 2003 |
| Wong [46] | 2003 | 4.5603 | 2003 | 2007 |
| Kulldorff [47] | 1997 | 4.1548 | 2003 | 2005 |
| Harrison [48] | 2000 | 3.7672 | 2003 | 2004 |
| Espino [49] | 2001 | 3.7672 | 2003 | 2004 |
| Pollack [50] | 1998 | 3.7672 | 2003 | 2004 |
| Mayaud [51] | 1997 | 3.6727 | 1999 | 2004 |
| Rotz [52] | 2002 | 3.5607 | 2003 | 2005 |
| Garcia [53] | 1998 | 3.4266 | 2000 | 2001 |
| Terms | Year | Strength | Begin | End |
|---|---|---|---|---|
| Zika Virus | 1993 | 36.737 | 2016 | 2018 |
| Pandemic Influenza | 1993 | 23.3972 | 2010 | 2013 |
| Open Access Article | 1993 | 22.4153 | 2015 | 2018 |
| Social Media | 1993 | 16.7639 | 2013 | 2018 |
| Big Data | 1993 | 16.0939 | 2015 | 2018 |
| Seasonal Influenza | 1993 | 15.6979 | 2009 | 2012 |
| Spatial Distribution | 1993 | 15.5906 | 2014 | 2016 |
| Principal Finding | 1993 | 15.3541 | 2010 | 2014 |
| Google Trends | 1993 | 15.316 | 2016 | 2018 |
| General Practitioners | 1993 | 15.1149 | 2007 | 2011 |
| Dengue Virus | 1993 | 14.8885 | 2016 | 2018 |
| Phylogenetic Analysis | 1993 | 13.1798 | 2016 | 2018 |
| Degrees C | 1993 | 13.1199 | 2013 | 2016 |
| Previous Study | 1993 | 13.066 | 2016 | 2018 |
| HIV Infection | 1993 | 12.6955 | 2007 | 2010 |
| Mean Age | 1993 | 12.4425 | 2016 | 2018 |
| Syndromic Surveillance | 1993 | 12.3479 | 2001 | 2006 |
| Influenza B | 1993 | 12.1712 | 2015 | 2016 |
| H1N1 Pandemic | 1993 | 11.5065 | 2012 | 2013 |
| Influenza Pandemic | 1993 | 10.3439 | 2011 | 2014 |
| Disease Outbreaks | 1993 | 10.2445 | 2009 | 2012 |
| High Prevalence | 1993 | 10.1678 | 2012 | 2014 |
| Influenza Season | 1993 | 9.8004 | 2008 | 2012 |
| Neisseria Gonorrhoeae | 1993 | 9.5824 | 2013 | 2014 |
| Antimicrobial Resistance | 1993 | 9.3477 | 2013 | 2014 |
© 2018 by the authors. Licensee MDPI, Basel, Switzerland. This article is an open access article distributed under the terms and conditions of the Creative Commons Attribution (CC BY) license (http://creativecommons.org/licenses/by/4.0/).
Share and Cite
Musa, I.; Park, H.W.; Munkhdalai, L.; Ryu, K.H. Global Research on Syndromic Surveillance from 1993 to 2017: Bibliometric Analysis and Visualization. Sustainability 2018, 10, 3414. https://doi.org/10.3390/su10103414
Musa I, Park HW, Munkhdalai L, Ryu KH. Global Research on Syndromic Surveillance from 1993 to 2017: Bibliometric Analysis and Visualization. Sustainability. 2018; 10(10):3414. https://doi.org/10.3390/su10103414
Chicago/Turabian StyleMusa, Ibrahim, Hyun Woo Park, Lkhagvadorj Munkhdalai, and Keun Ho Ryu. 2018. "Global Research on Syndromic Surveillance from 1993 to 2017: Bibliometric Analysis and Visualization" Sustainability 10, no. 10: 3414. https://doi.org/10.3390/su10103414