Article

Optimal Pricing and Service for the Peak-Period Bus Commuting Inefficiency of Boarding Queuing Congestion

1
School of Transportation, Southeast University, Nanjing 210096, China
2
College of Civil Science and Engineering, Yangzhou University, Yangzhou 225009, China
3
Department of Civil and Environmental Engineering, University of Wisconsin-Madison, Madison, WI 53706, USA
4
School of Economics and Management, Beihang University, Beijing 100191, China
5
MOE Key Laboratory for Urban Transportation Complex Systems Theory and Technology, Beijing Jiaotong University, Beijing 100044, China
*
Author to whom correspondence should be addressed.
Sustainability 2018, 10(10), 3497; https://doi.org/10.3390/su10103497
Submission received: 1 September 2018 / Revised: 22 September 2018 / Accepted: 27 September 2018 / Published: 29 September 2018
(This article belongs to the Special Issue Sustainable Road Transportation Planning)

Abstract

:
This paper proposes an equilibrium bus boarding model to investigate optimal pricing and service for peak-period bus commuting inefficiency of boarding queuing congestion. Commuters are assumed to choose their optimal time-of-use decision from home or the workplace to the bus. We found that: (1) when the earliest commuter boards the bus as soon as the bus arrives at the bus station, the dynamic boarding queuing congestion toll that eliminates the boarding queuing congestion creates social optimal equilibrium and the optimal bus departure interval during the peak period; (2) the optimal bus departure interval during the peak period is the time that the preceding bus riders spend on boarding, which means the relationship between service frequency and ridership does not conform to the square root principle: the optimal bus frequency is proportional to the square root of the number of commuters.

1. Introduction

Bus transit commuting is a mode of sustainable travel that effectively suppresses traffic congestion. However, the peak-period bus commuting inefficiency of boarding queuing congestion is a problem to be solved. During the peak period, the commuter is usually not willing to depart early, but also does not want to depart too late and miss the bus. Therefore, when the commuter has to board the bus, in determining their departure time, the commuter faces a tradeoff between time spent in the boarding queue and the cost of early boarding delay. For the boarding commuter that departs later, they risk a higher boarding queuing time cost and lower early boarding delay cost, and vice versa. Therefore, an efficient peak-period bus boarding process occurs when the boarding time and the early boarding delay cost are the same, which would eliminate boarding queuing congestion by changing the commuter’s departure time choice with optimal pricing and service. To this end, based on real traffic phenomena, we propose an equilibrium bus boarding model to investigate the peak-period bus commuting inefficiency of boarding queuing congestion. By studying its equilibrium mechanisms, we obtain optimal pricing and service to eliminate congestion and improve bus boarding efficiency during the peak period. Among our findings, two stand out. When the earliest commuter boards the bus as soon as the bus arrives at the bus station, the dynamic boarding queuing congestion toll that eliminates the boarding queuing congestion indicates the social optimal equilibrium and the optimal bus departure interval during the peak period. Secondly, the optimal bus departure interval during the peak period is the time that the preceding bus riders spend on boarding, which means the relationship between service frequency and ridership does not conform to the square root principle.
The main contributions of this paper are: (1) an equilibrium bus boarding model during the peak-period commuting is proposed; (2) the equilibrium mechanisms of the peak-period bus commuting inefficiency of boarding queuing congestion are investigated and clarified, and optimal pricing and service are obtained to eliminate congestion; and (3) the optimal bus departure intervals during the peak period are obtained, which do not conform to the square root principle.
The remainder of this paper is organized as follows. Section 2 provides a brief review of some relevant research. Section 3 proposes the equilibrium bus boarding model during peak periods. Section 4 investigates optimal pricing and service for the peak-period bus commuting inefficiency of boarding queuing congestion with the new model using the analytical analysis. Section 5 completes the numerical analysis. Finally, Section 6 concludes the paper.

2. Literature Review

In deciding when to use a congestible facility, an individual normally faces a tradeoff, such as the tradeoff between using the facility at a convenient time when congestion is relatively high and using the facility at a less convenient time with relatively high schedule delay costs when the facility is less congested. Recent theoretical work on the economics of congestible facilities has been increasingly concerned with this tradeoff. In 1969, Vickrey [1] deduced the first dynamic model of vehicle congestion during the morning rush hour, the classical bottleneck model, which used the commuter’s departure time as the endogenous variable, and at equilibrium, the commuter could not unilaterally reduce their travel cost by altering their departure time. With identical individuals, this means that the costs are constant at all times that commuters are departing. Since then, many scholars performed related investigations contributing to the development of Vickrey’s highway bottleneck model, in which commuters face a tradeoff between the schedule delay cost of arriving at work at a time other than the most preferred time, and the cost of time spent queuing behind a highway bottleneck [2,3,4,5,6,7,8,9,10,11,12]. Some scholars investigated other congestible facilities and traffic congestion situations [13,14,15,16].
To the best of our knowledge, only limited attention has been paid to optimal pricing and service for the peak period of bus commuting inefficiency during boarding queuing congestion. The basic model of optimal pricing and service in urban mass transit is Mohring’s bus line model [17]. In Mohring’s model, passenger arrivals at an origin stop are assumed to be uniform over the peak period and considering bus size as given, Mohring analyzed the socially optimal service frequency for a given number of passengers and proposed the square root principle for the determination of optimal bus service frequency. Using this principle, the optimal bus frequency is proportional to the square root of the number of commuters. This classical model was useful for transit service planning in a static sense. Jansson [18] extended the square root principle to a model in which service frequency is simultaneously optimized with bus size. Sumi et al. [19] presented a stochastic model for optimizing commuter departure time and route choices in a mass transit system. They assumed that departure time is mainly dependent on the system’s operational features and the travelers’ appointed time of arrival at the destination. Alfa and Chen [20] examined a public transportation system with multiple origins and destinations and proposed an algorithm for calculating the peak-hour departure time of commuters, where commuters rode on the first coming bus in a random order. Tian et al. [21] assumed that the commuters had full information about the transit system timetable from everyday learning and therefore the queuing time at the station was zero for simplicity. They developed an equilibrium model for peak-period commuting for a mass transit line and analyzed the equilibrium properties of the morning peak-period commuting pattern on a many-to-one transit system with in-vehicle crowding and schedule delay costs in a monocentric city. The model offered useful information for optimal transit service planning and operations. Kraus and Yoshida [22] provided economic analyses about the commuters’ time-of-use decision, the optimal pricing, and the service in urban mass transit. In their model, a group of identical commuters was considered, each having the same desired arrival time at work. The model was closely related to the bottleneck model, with queuing time at a transit stop treated analogously to queuing time at a bottleneck, and the difference arose in the intermittent nature of mass transit capacity provision. In addition, they assumed that a commuter who was scheduled to arrive earlier had the relative priority of boarding, and under the optimal pattern of arrivals, which could be decentralized with an appropriate run-dependent fare, no queuing actually occurred (passengers were assumed to know the schedule, so queuing could be avoided). Kraus [23,24] analyzed the second-best policy problem that occurs when auto travel was priced below its marginal cost and introduced a substitute mass transit model by combining the model of a rail line based on Kraus and Yoshida [22] with the classic bottleneck model. Kraus [23] established that the second-best level was higher, but only as a local result that did not necessarily represent the best optimum. Kraus [24] extended this to a global result applied to discretely underpriced auto travel and obtained much stronger results in a richer model, which could be directly applied to road pricing. The fact that Kraus’ results [24] are global permits Kraus’ results [24] can be used to the road pricing which is not possible with the local results of Kraus [23]. Ruiz et al. [25] proposed a bus frequency optimization methodology to improve harmonization between service level and social equity in public transport. Al Kheder et al. [26] investigated the optimal number of buses for Kuwait Public Transport Company and developed an integer linear programing model for the general problem. Wang et al. [27] investigated how to design limited stop service operation strategies from the combined bus operator’s and users’ perspective. Stockholm, Sweden introduced congestion pricing in 2006, and Börjesson et al. [28] used these data to model how the optimal pricing, frequency, bus size, and number of bus lanes for a corridor depend on the presence of congestion pricing for cars.
Some scholars have studied the bus boarding process and its influencing factors. Sun et al. [29] presented the first use of smart card data to study bus passenger boarding behavior and its impact on bus dwell time. Tirachini and Hensher [30] investigated the effects of four alternative payment methods: on-board payment with (1) cash, (2) a magnetic strip, (3) a contactless card, and (4) off-board payment (on the station). Other factors, such as the number and width of doors, the existence of steps to board, the type of bus, and the number of seats and space for standees [31,32,33,34,35,36], also influence the dynamics of bus boarding. D’Souza et al. [37] investigated effects of low-floor bus interior configuration and passenger crowding on boarding and disembarking efficiency and safety. Wu et al. [38] modeled bus bunching and holding control with vehicle overtaking and distributed passenger boarding behavior. Ji et al. [39] provided a simulation model based on the social force paradigm and incorporated five different forces that drive individual agents’ boarding and alighting.
A more specific description of the methodologies related to optimal pricing and service for the peak-period bus commuting inefficiency of boarding queuing congestion is provided by Table 1.
It is clear that recent theoretical work on the economics of congestible facilities, the bus boarding process, and its influencing factors is increasing; however, only few studies have focused on optimal pricing and service for the peak-period bus commuting inefficiency of boarding queuing congestion.

3. Peak Period Equilibrium Bus Boarding Model

3.1. Problem Description

This paper aimed to investigate optimal pricing and service for peak-period bus commuting inefficiency during boarding queuing congestion. According to our research purpose and for simplicity without loss of generality, we take a single bus whose departure time is given during the peak period as an example and analyse the equilibrium of the single bus commuters’ boarding queuing congestion during the peak period. Thus, we investigated the following traffic situation: during the peak period, N identical commuters’ boarding process of a single bus considering boarding queuing congestion.
Commuters were assumed to make their optimal time-of-use decision and choose their departure time, and their departing, arrival, and boarding were assumed to be continuous. Furthermore, we assumed the bus supply is sufficient and therefore the commuter arrives at the bus station no earlier than the bus that they can board arrives. When the commuter arrives at the bus station, they queue for boarding the bus that can be boarded at once and do not need to wait for the bus. The commuter departing earliest boards the bus when they arrive at the bus station; the leave time of the bus is given. The bus leaves at the leave time regardless of whether or not the bus is fully loaded. This is also the time when the last boarding commuter boards the bus. The commuter departing earlier arrives at the bus station and boards the bus earlier, meaning the boarding queuing at the bus station is first-in, first-out (FIFO) queuing.

3.2. Symbols

The symbols and their meanings and description used in this paper are represented in Table 2.

3.3. The Model

We define the boarding queuing time as follows: as the commuter arrive at the bus station no earlier than the bus that they can board arrives, the boarding queuing time is the time that elapses from the time the commuter arrives at the bus station to the time they board the bus.
Late arrival is prohibited and the origin is the commuter’s home (for the morning peak-period commuter) or workplace (for the evening peak-period commuter), and the destination is the bus. Thus, the timeline of the boarding commuter departing at time t during the peak-period bus commuting is shown in Figure 1.
According to the definition, for the commuter departing at time t , the boarding queuing time is T ( t ) = T o ( t ) ( t + T f ) and the early boarding delay is E D ( t ) = t l T o ( t ) . Thus, the equilibrium bus boarding model is proposed as follows:
C ( t ) = α [ T ( t ) + T f ] + β [ t l T o ( t ) ] + p 0
where C ( t ) is the travel cost of the commuter departing at time t , α is the unit travel time cost, and β is the unit early boarding delay cost. According to Small [40], we set α > β , and p 0 is the static fare. All boarding commuters choose their departing time to travel, and at equilibrium, they could not unilaterally alter their departing time to reduce their travel cost, which means their travel costs are identical and are constant at all times that commuters are departing, so that C ( t ) / t = 0 , t [ t a , t b ] .

4. Analysis

4.1. No-Toll Equilibrium Analysis

In this section, we perform a no-toll equilibrium analysis. The commuter departing earliest does not encounter bus boarding queuing congestion and boards the bus earliest; the commuter departing latest encounters the longest bus boarding queuing and boards the bus when the bus leaves. The bus door runs at full capacity during [ t a + T f , t l ] , so we have:
C ( t a ) = α T f + β [ t l t a T f ] + p 0
C ( t b ) = α [ t l t b ] + p 0
t l t a T f = N s b
t r t a + T f = T o ( t a ) , t b + T f t l = T o ( t b )
Combining at equilibrium, C ( t ) / t = 0 , t [ t a , t b ] , we have:
t a = t l N s b T f
t b = t l β N α s b T f
C = β N s b + α T f + p 0 ,    t a t t b
where C is the equilibrium travel cost. Let s c be the commuter’s departure rate, and for all boarding commuters N , t [ t a , t b ] . Therefore:
( t b t a ) s c = N
Combining Equations (6), (7), and (9), we have:
s c = α s b α β
The boarding queuing time of the commuter departing at time t is:
T ( t ) = β α β ( t t a ) ,    t a t t b
and the boarding queuing length at a different time is:
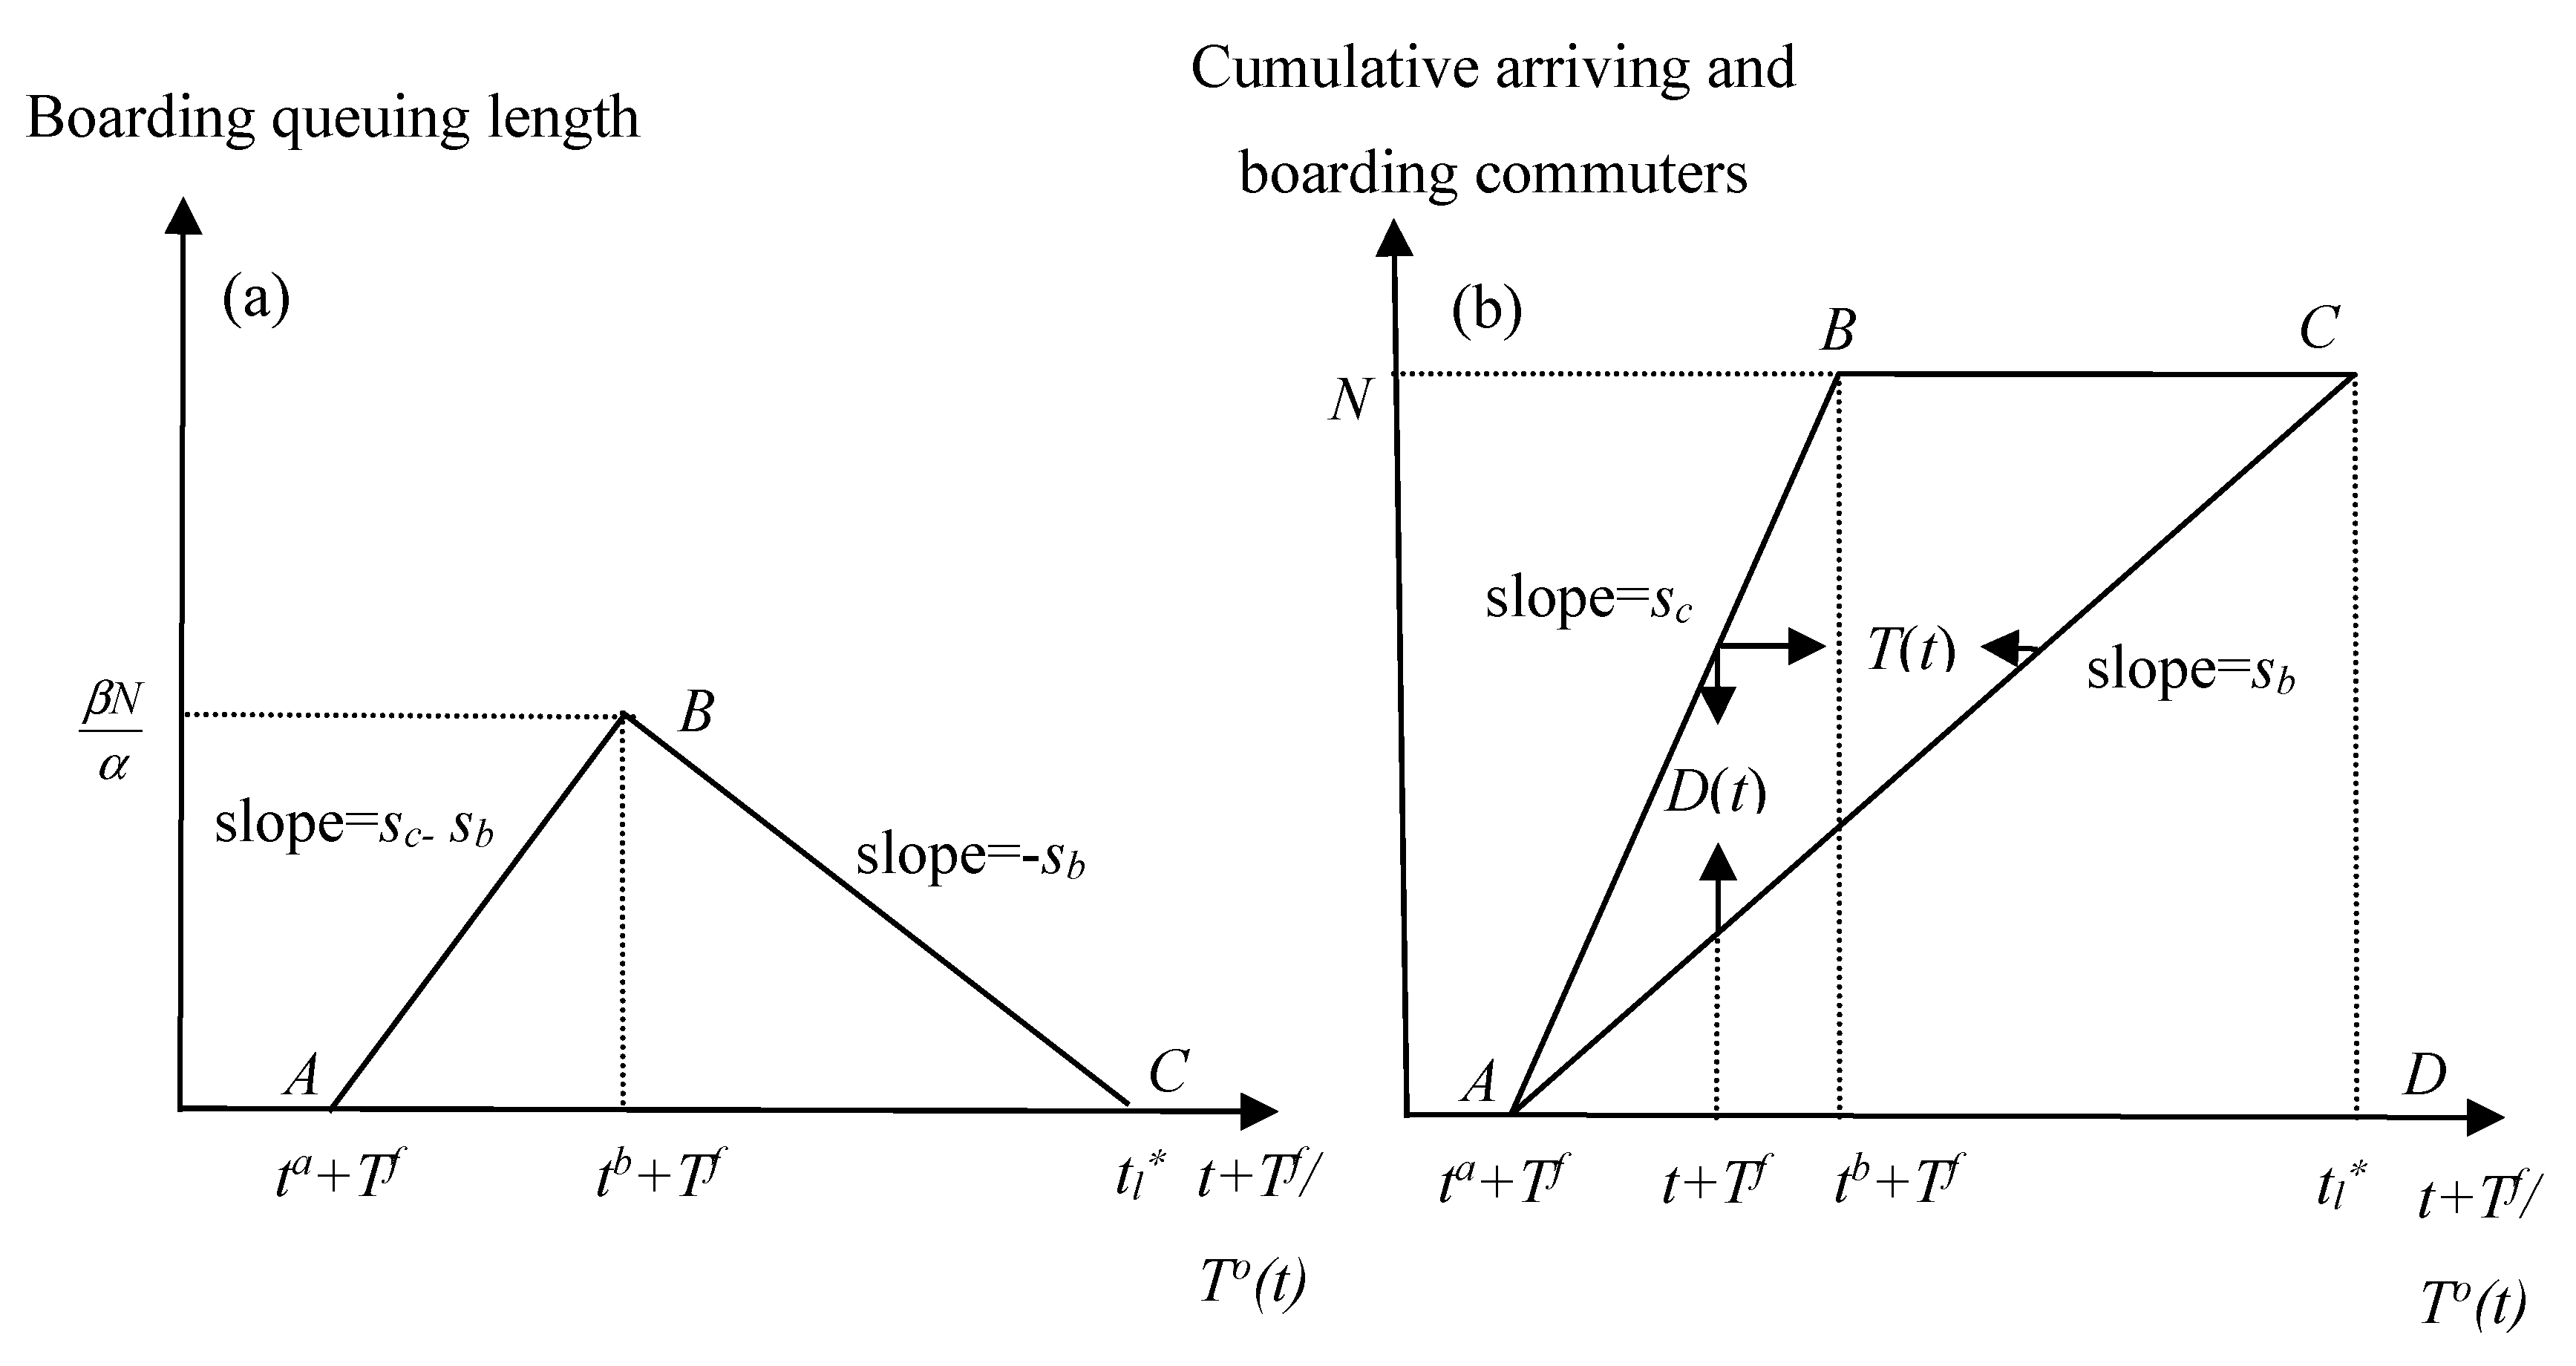
D ( t ) = { ( s c s b ) ( t t a ) = β s b α β ( t t a ) = s b T ( t ) ,    t a + T f t + T f t b + T f β N α s b ( t t b ) ,    t b + T f t + T f t l
Therefore, we obtained the boarding queuing diagram (Figure 2a) and the boarding no-toll equilibrium diagram (Figure 2b). Figure 2a depicts the boarding queuing diagram and Figure 2b depicts the boarding no-toll equilibrium diagram where for the horizontal axes, t + T f [ t a + T f , t b + T f ] represents the time when the commuter arrives at the bus station and T o ( t ) [ t a + T f , t l ] represents the time when the commuter boards the bus. Note that according to Kraus [23], after t b + T f , there are only commuters boarding the bus, but no commuter arrives at the bus station, so it is infeasible that a commuter switches their departure time to t l T f and arrives at the bus station at t l to reduce travel cost. In Figure 2a, the vertical axis represents the boarding queue length at different times, and curve A B shows the boarding queuing length firstly increasing linearly with the ratio s c s b from zero at t a + T f to the maximum at t b + T f . Curve B C shows the boarding queuing length then reduces with the ratio s b from the maximum at t b + T f to zero at t l . In Figure 2b, the vertical axis represents the cumulative arriving and boarding commuters at different times. More specifically, curve A B C shows the cumulative arriving commuters of the bus, which increases linearly with the ratio s c from zero at t a + T f to the maximum at t b + T f and then remains unchanged. Curve A C shows the cumulative boarding commuters of the bus, which increase linearly with the ratio s b from zero at t a + T f to the maximum at t l . Figure 2 shows that at t l , the cumulative boarding commuters of the bus, is equal to the cumulative arriving commuters of the bus, and the boarding queuing length of the bus is zero. Therefore, the no-toll equilibrium was obtained. By combining Figure 2b, it was easy to obtain the total boarding queuing time of all commuters of the bus as:
T T = a r e a ( A B C A ) = β N 2 2 α s b
The total early boarding delay cost of all commuters of the bus is:
S D C = β a r e a ( A C D A ) = β N 2 2 s b
The total equilibrium travel cost of all commuters of the bus is:
T C = N α T f + α T T + S D C + N p 0 = N α T f + β N 2 s b + N p 0 = N C

4.2. Social Optimal Equilibrium Analysis

In this section, we outline our social optimal equilibrium analysis. Under the optimal pattern of departing and arrival, which can be decentralized with an appropriate dynamic boarding queuing congestion toll, no boarding queuing congestion actually occurs (the commuters are assumed to know the schedule, so the boarding queuing congestion can be avoided) [3,5,22]. Suppose the transit authority collects the dynamic boarding queuing congestion toll τ ( t ) to eliminate the deadweight loss of the boarding queuing congestion during the peak period. At this time, the commuters change their departure time decision to eliminate boarding queuing congestion, which means with τ ( t ) , T ( t ) = 0 . Based on the above analysis, we present the following proposition on the social optimal equilibrium and optimal bus departure interval during the peak period:
Proposition 1.
When the earliest commuter boards the bus as soon as the bus arrives at the bus station, the dynamic boarding queuing congestion toll, which eliminates the boarding queuing congestion, indicates the social optimal equilibrium and the optimal bus departure interval during the peak period.
Proof. 
The dynamic boarding queuing congestion toll τ ( t ) eliminates the boarding queuing congestion, which means with τ ( t ) :
T ( t ) = T o ( t ) ( t + T f ) = 0 ,    t a t t b
and T o ( t ) = t + T f means the commuter boards the bus as soon as they arrive at the bus station. Therefore:
t r T o ( t a ) = t a + T f
t l = T o ( t b ) = t b + T f
and therefore,
T o ( t b ) T o ( t a ) = N s b = t b + T f t a T f = N s c
s c = s b
which means the commuter’s arrival rate is equal to the boarding capacity of the bus door. With τ ( t ) , T ( t ) = 0 , t r T o ( t a ) = t a + T f , t l = T o ( t b ) = t b + T f and s c = s b . However, when t r < T o ( t a ) = t a + T f and T b w ( t a ) = t a + T f t r > 0 , there is deadweight loss of the bus waiting for the commuter, so only when t r = T o ( t a ) = t a + T f do we have the social optimal equilibrium. Combining t l = T o ( t b ) = t b + T f and the commuters’ departing time is assumed to be continuous, so the optimal bus departure interval during the peak period is obtained, which is the one that ensures the following bus arrives at the bus station as soon as the preceding bus leaves the bus station. Specifically, with the assumption that the time that every bus spends on arriving at the bus station from the last bus station is the same, the optimal bus departure interval during the peak period is the time that the preceding bus riders spend on boarding, and when the number of boarding commuters and boarding capacity of every bus are the same, which are N and s b , respectively, the optimal bus departure interval during the peak period is N / s b , which means the relationship between service frequency and ridership does not conform to the square root principle. For the derivation process, please see Appendix A. □
Proposition 1 shows that in order to obtain social optimal equilibrium during the peak period, the transit authority should impose a dynamic boarding queuing congestion toll τ ( t ) on the commuter and ensure t r = T o ( t a ) = t a + T f , and then obtain the optimal bus departure interval during the peak period. With τ ( t ) and T ( t ) = 0 , which is demonstrated in the no-toll equilibrium diagrams in Figure 2b, curve A B C reduces to curve A C , so curve A C represents both the cumulative arriving commuters and the cumulative boarding commuters. At this time, the slope s c = s b , T ( t ) = 0 , and T T = a r e a ( A B C A ) = 0 . Since the dynamic boarding queuing congestion toll does not change the commuter’s boarding time, the total early boarding delay cost of all commuters of the bus is still S D C = β a r e a ( A C D A ) = β N 2 2 s b .
The dynamic boarding queuing congestion toll τ ( t ) eliminates the boarding queuing time, T ( t ) = 0 , so we have:
C = β N s b + α T f + p 0 = α T f + β ( t l t T f ) + p 0 + τ ( t )
τ ( t ) = β N s b β ( t l t T f ) ,    t a t t b
With τ ( t ) and T o ( t ) = t + T f , and combining T o ( t a ) = t a + T f and t l = T o ( t b ) = t b + T f , we have the total dynamic boarding queuing congestion toll of all commuters of the bus:
T τ = t a + T f t l s b τ ( T o ( t ) ) d T o ( t ) = β N 2 2 s b = α T T
Equation (23) means the total dynamic toll of eliminating the deadweight loss of the boarding queuing congestion is equal to the deadweight loss. Equation (21) means the dynamic toll does not increase the commuter’s travel cost; therefore, the transit authority can convert the deadweight loss of boarding queuing congestion into government toll revenue that can be used to improve the commuter’s boarding efficiency, obtain the social optimal equilibrium during the peak period, and adjust the bus departure intervals to the optimal bus departure interval during the peak period.
Based on the above analysis and in order to improve the peak-period bus commuting inefficiency of boarding queuing congestion, a dynamic boarding queuing congestion toll τ ( t ) should be imposed on commuters, which makes the commuter’s arrival rate s c equal to the bus door boarding capacity s b . Therefore, the bus boarding queuing congestion is eliminated. In order to collect the dynamic boarding queuing congestion toll more conveniently, the transit authority can convert the static fare into a dynamic fare that includes the dynamic boarding queuing congestion toll, which can be collected by the automated fare collection system. The dynamic fare can be set as follows:
p ( t ) = p 0 + τ ( t ) = p 0 + β N s b β ( t l t T f ) ,    t a t t b
How to implement the dynamic fare scheme requires further investigation.

5. Numerical Analysis

In this section, we outline our numerical analysis to verify the analytical analysis of the equilibrium bus boarding model for the peak-period bus commuting inefficiency of boarding queuing congestion. We take the numerical analysis of the morning peak-period bus commuting as an example. The following parameters values were used: α = 0.25   ( $ / min ) , β = 0.125   ( $ / min ) , s b = 20   ( person / min ) , t l m = 7 : 00 , T m f = 15   ( min ) , and p 0 = 0.75   ( $ ) , where the subscript m represents the morning peak-period bus commuting. In the numerical analysis, we use N = 120   ( person ) and N = 80   ( person ) as examples.
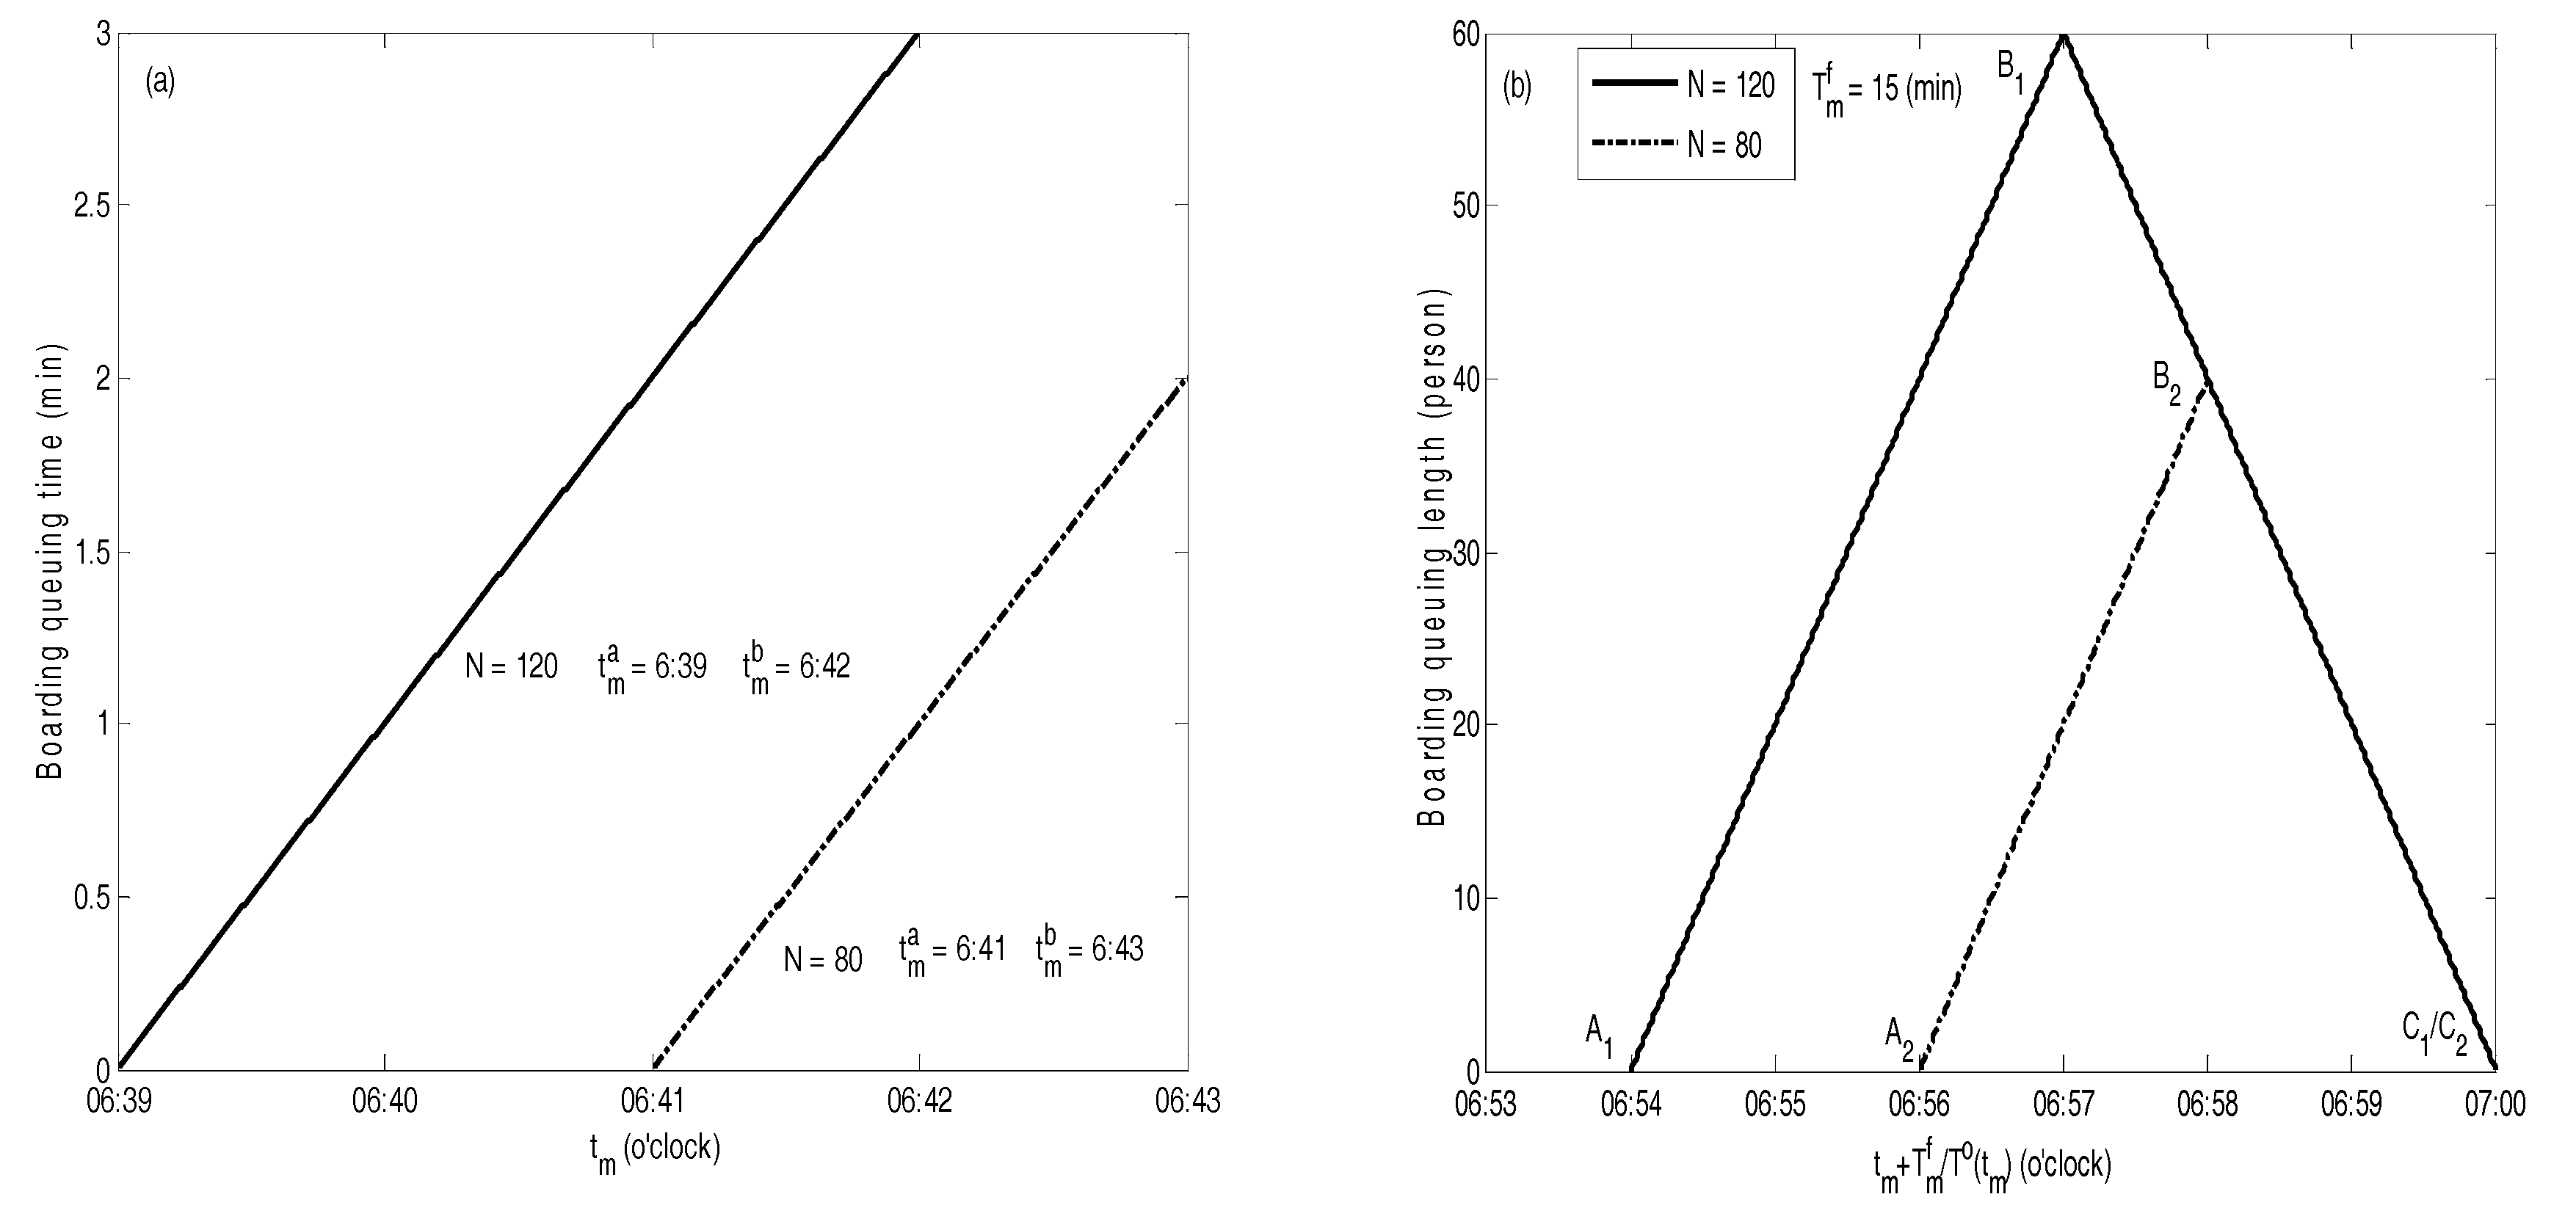
Figure 3a depicts the boarding queuing time and Figure 3b shows the boarding queuing length at different times for all bus commuters. The commuter departing earliest does not encounter a boarding queue and therefore their boarding queuing time and boarding queuing length are zero. The later the commuter departs, the longer the boarding queuing time and boarding queuing length. For the commuter that departs latest, they encounter the longest boarding queuing time and boarding queuing length. After t m b + T m f , there are only commuters boarding the bus, but no commuter arrives at the bus station, therefore the boarding queuing length reduces linearly with the ratio s b = 20   ( person / min from the maximum at t m b + T m f to zero at t l m = 07 : 00 . At this time, all commuters have boarded the bus, so the no-toll equilibrium for all commuters of the bus is obtained.
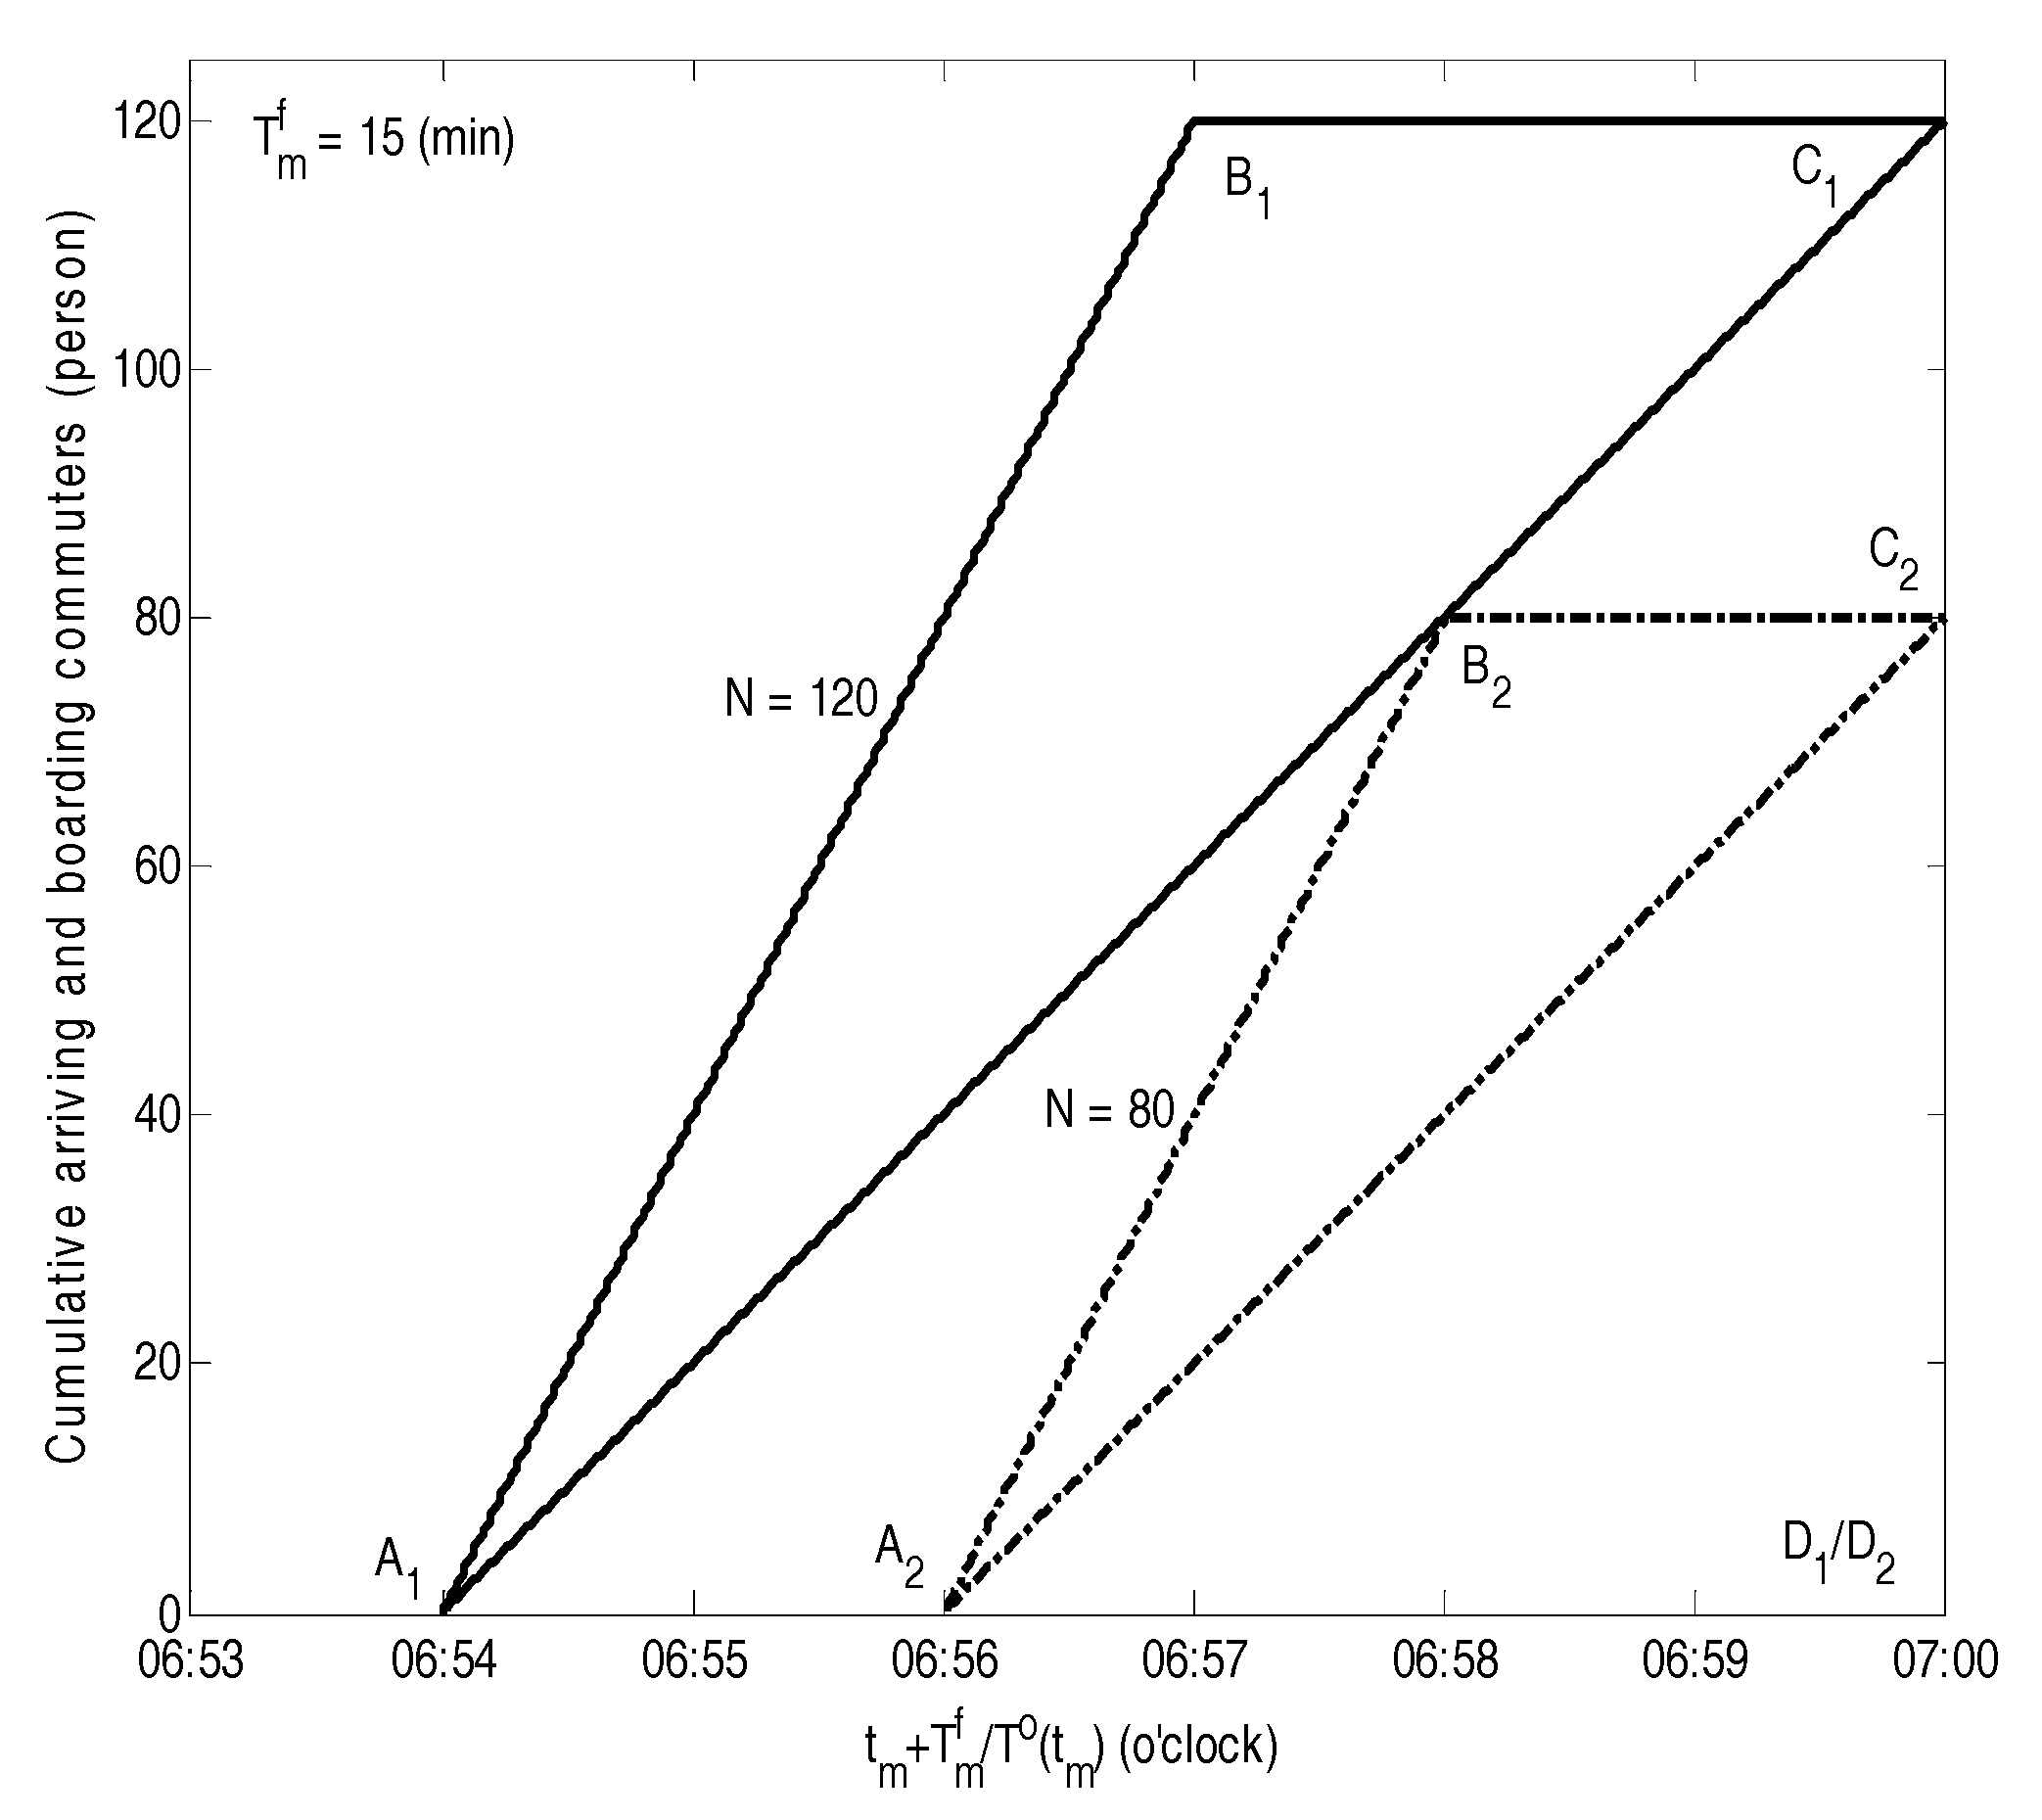
Figure 4 shows the no-toll equilibrium for the case where N = 120   ( person ) is depicted by the solid line and the case where N = 80   ( person ) is depicted by the dotted line. For the case where N = 120   ( person ) , the number of cumulative arriving commuters is shown by curve A 1 B 1 C 1 and the number of cumulative boarding commuters is represented by curve A 1 C 1 . At t l m = 07 : 00 a.m., the number of cumulative arriving commuters is equal to the number of cumulative boarding commuters and all commuters have boarded the bus. Therefore, the no-toll equilibrium is obtained. Furthermore, T T = a r e a ( A 1 B 1 C 1 A 1 ) = 180   ( min ) , and S D C = β a r e a ( A 1 C 1 D 1 A 1 ) = 45 ( $ ) . With the dynamic toll τ ( t ) , the boarding queuing congestion is eliminated, which is shown by curve A 1 B 1 C 1 reducing to curve A 1 C 1 . According to Proposition 1, the optimal bus departure interval during the peak period is N / s b = 6   ( min ) . A similar analysis is conducted for the case where N = 80   ( person ) and the optimal bus departure interval during the peak period is N / s b = 4   ( min ) . Figure 4 is consistent with Proposition 1, our other analytical analysis results, and Figure 2 and Figure 3.
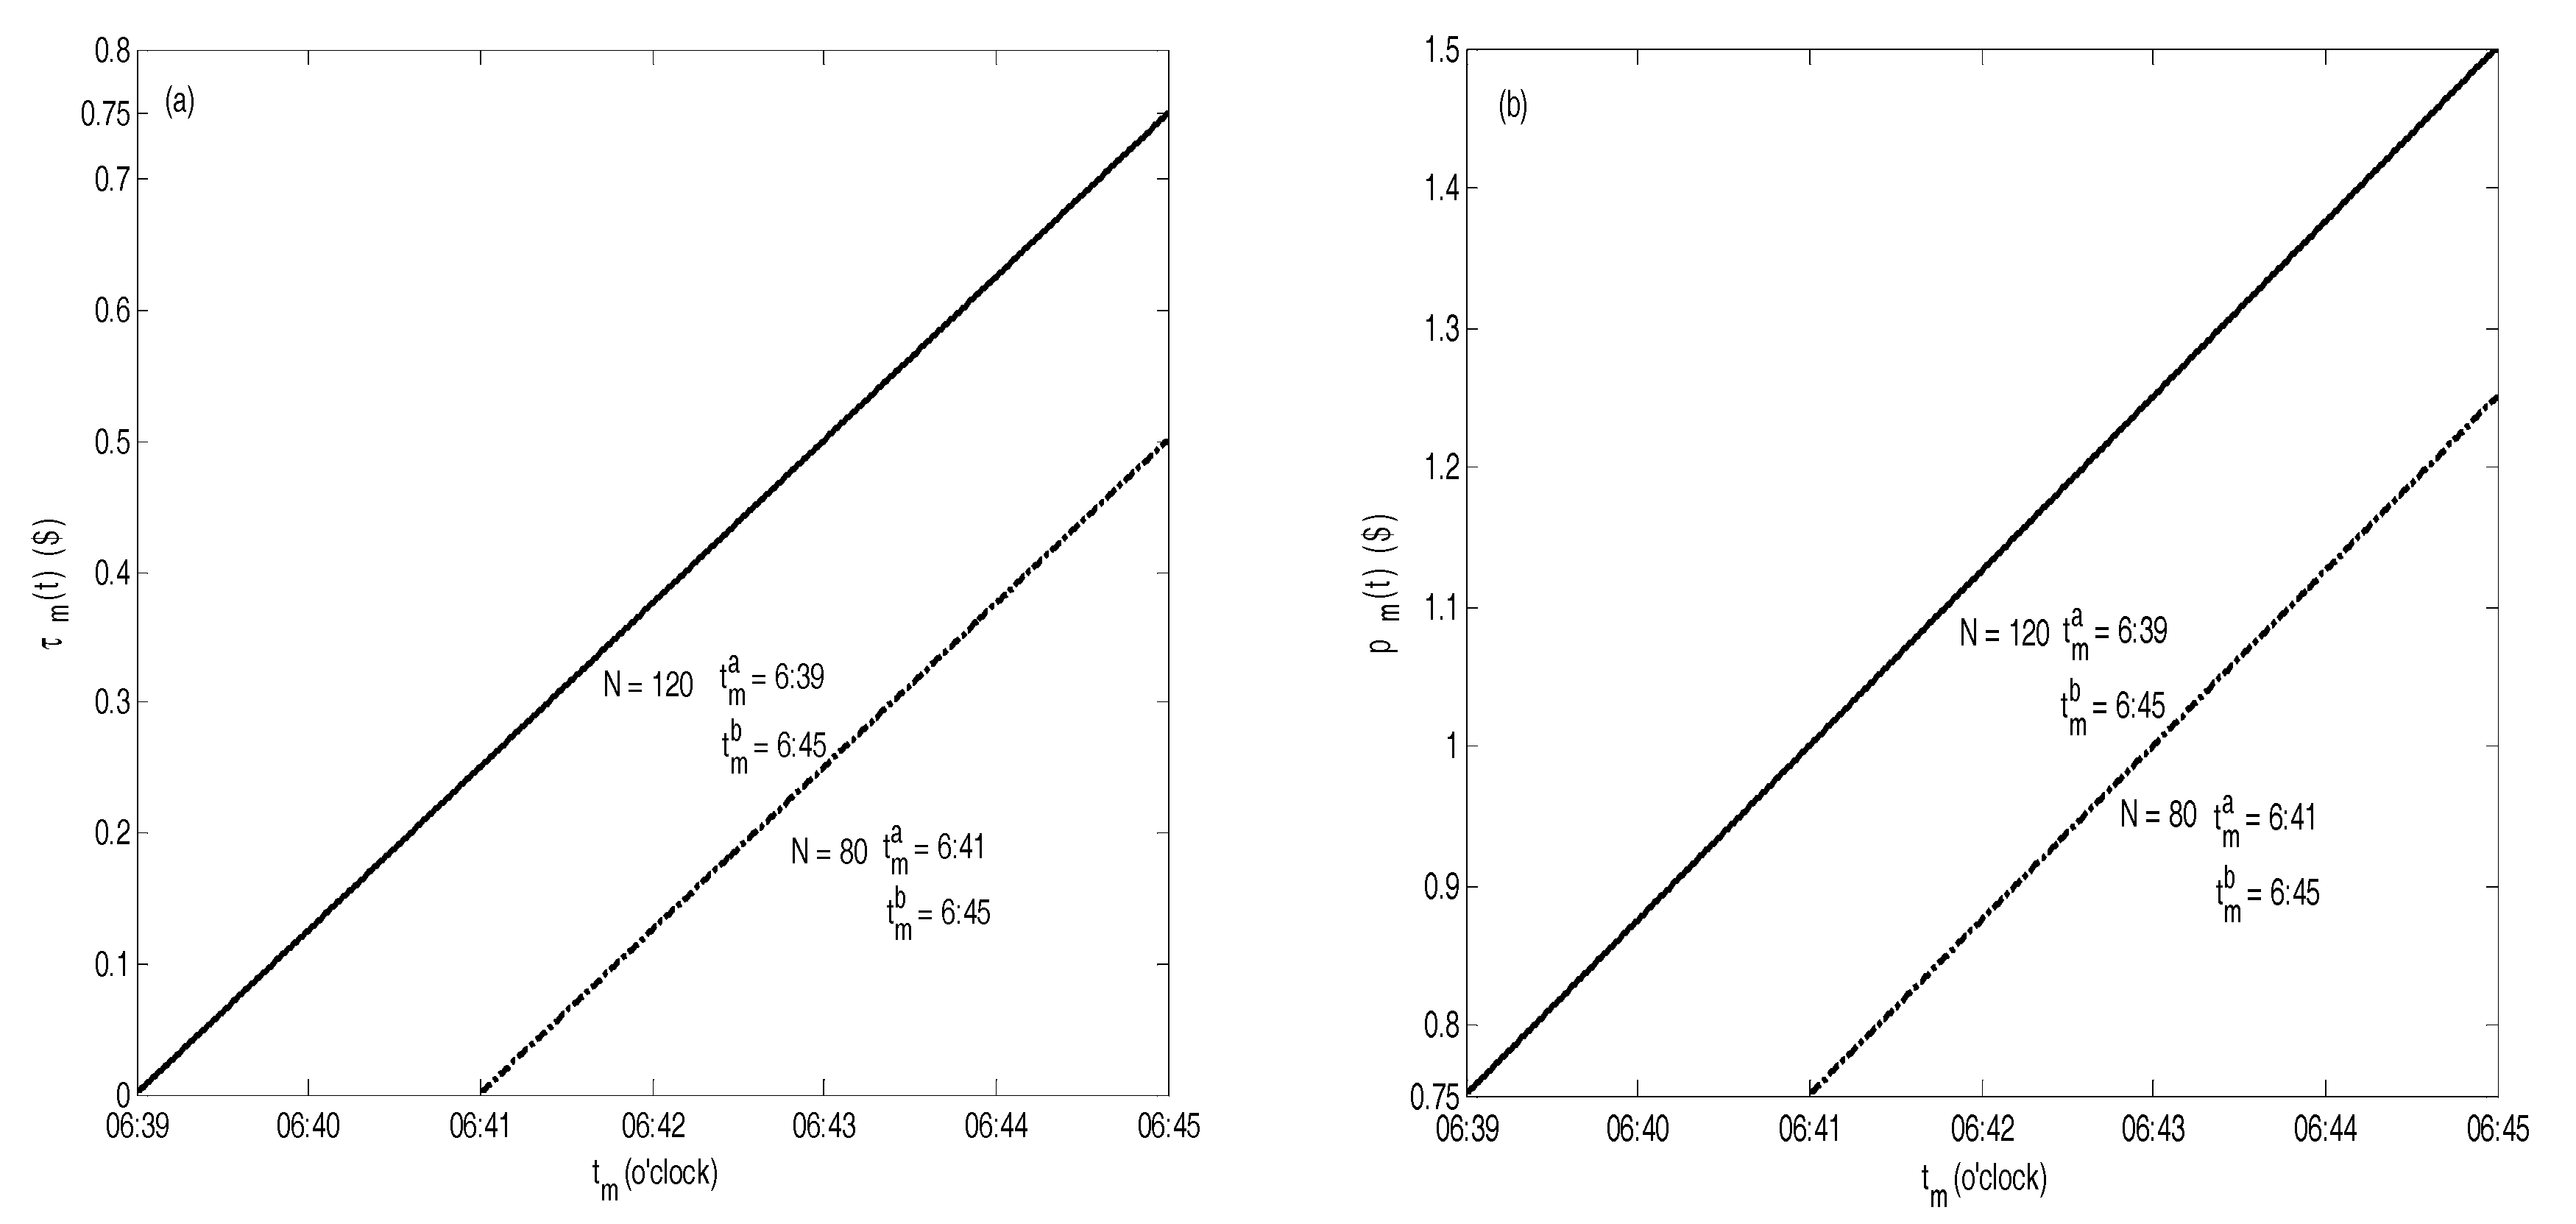
Figure 5a shows the dynamic boarding queuing congestion toll and Figure 5b depicts the corresponding dynamic fare for the commuter departing at different times. With the dynamic boarding queuing congestion toll τ ( t ) , the commuter changes their departing time t = T o ( t ) T f . Therefore, the bus boarding queuing congestion is eliminated, and at this time T o ( t a ) = t a + T f , t l = T o ( t b ) = t b + T f , and s c = s b . Figure 5 shows the commuter departing earliest does not pay the dynamic toll and their dynamic fare is equal to the static fare. The later the commuter departs, the higher the dynamic toll and the higher the dynamic fare. When the commuter depart latest, they pay the highest dynamic toll and dynamic fare, which is consistent with Equations (22) and (24).
We clearly observed that the numerical results confirm our analytical results, which means the numerical analysis verifies the analytical analysis.

6. Conclusions

Bus transit commuting is a mode of sustainable transport and effectively suppresses traffic congestion. However, the peak-period bus commuting inefficiency of boarding queuing congestion is a problem to be solved. Recent theoretical work on the economics of congestible facilities, and the bus boarding process and its influencing factors, has been increasing, but few studies have investigated optimal pricing and service for the peak-period bus commuting inefficiency of boarding queuing congestion. To this end, based on real traffic phenomena, we proposed the equilibrium bus boarding model to investigate it. By studying the equilibrium mechanisms of the peak-period bus commuting inefficiency of boarding queuing congestion, we obtained optimal pricing and service to eliminate the congestion and improve bus boarding efficiency during peak periods. The numerical analysis verified the analytical analysis. There are important managerial implications of the study. For example, the transit authority could eliminate the deadweight loss of the boarding queuing congestion during the peak period using optimal pricing and service, and the deadweight loss of boarding queuing congestion could be converted into the government toll revenue to improve the commuter’s boarding efficiency, obtain social optimal equilibrium during the peak period, and adjust the bus departure interval to the optimal interval during the peak period, which is an important sign of improving management.
Looking at our findings, two stand out. Firstly, when the earliest commuter boards the bus as soon as the bus arrives at the bus station, the dynamic boarding queuing congestion toll that eliminates the boarding queuing congestion indicates the social optimal equilibrium and the optimal bus departure interval during the peak period. Secondly, the optimal bus departure interval during the peak period is the time that the preceding bus riders spend boarding, which means the relationship between service frequency and ridership does not conform to the square root principle.
The following aspects are our study limitations and issues for further study. (1) In this paper, to simplify the analysis and focus on the investigation, we made some assumptions that caused the model to differ from real traffic. Relaxing some assumptions, such as incorporating the commuter’s heterogeneity, the elastic demand, and individual behaviors or characteristics (such as elderly versus young commuters and normal versus disabled commuters) will be our future research direction. (2) Our investigation was qualitative and was not verified empirically by real traffic data, so therefore it is necessary to calibrate our findings based on real traffic data in the future. (3) The bus commuting inefficiency of boarding queuing congestion during the peak period should be examined for simple networks such as corridor networks consisting of a bus transit line and a parallel highway.

Author Contributions

Funding acquisition, Y.-Z.Z. and X.Y.; Investigation, Y.-Z.Z.; Methodology, Y.-Z.Z.; Supervision, B.R. and N.Z.; Writing-original draft, Y.-Z.Z.; Writing-review & editing, Y.-Z.Z., X.Y., J.-J.S. and S.-J.D.

Funding

This study was funded and supported by several projects: the National Natural Science Foundation of China (Grant No. 91746201 and 71621001); the Natural Science Foundation of Jiangsu Province (Grant No. BK20180898); China Postdoctoral Science Foundation (Grant No. 2017M620184); the Natural Science Foundation of the Jiangsu Higher Education Institutions of China (Grant No. 18KJB580017); the Scientific Research Foundation of Yangzhou University (Grant No. 137011111); and Yangzhou University Science and Technology Innovation Incubation Foundation (Grant No. 135030040).

Acknowledgments

The authors would like to thank the anonymous reviewers for their valuable comments and suggestions.

Conflicts of Interest

The authors declare no conflict of interest.

Appendix A. Derivation of the Optimal Bus Departure Interval during the Peak Period

Let N j 1 and N j be the number of the boarding commuter of the preceding bus j 1 and the following bus j , respectively; s b j 1 and s b j be the boarding capacity of the preceding bus j 1 and the following bus j , respectively; t d j 1 and t d j be the departure time of the preceding bus j 1 and the following bus j at the last bus station, respectively; and T b j 1 and T b j be the time the preceding bus j 1 and the following bus j spend on arriving at the bus station from the last bus station, respectively. With the dynamic toll τ ( t ) , in the social optimal equilibrium, t r = T o ( t a ) = t a + T f , t l = T o ( t b ) = t b + T f , and the commuters’ departing time is assumed to be continuous, which means t j a = t ( j 1 ) b , and therefore we have:
t d j + T b j = t j r = t j a + T f = t ( j 1 ) b + T f = t ( j - 1 ) l = t d j 1 + T b j 1 + N j 1 / s b j 1 , j = 1 , 2 , 3...
which means when the bus departure interval Δ t d j = t d j t d j 1 is the optimal bus departure interval during the peak period, it ensures the following bus j arrives at the bus station at time t j r as soon as the preceding bus j 1 leaves the bus station at time t ( j - 1 ) l , t j r = t ( j - 1 ) l , j = 1 , 2 , 3... . Combining the assumption that the time that every bus spends on arriving at the bus station from the last bus station is the same, namely T b j 1 = T b j , j = 1 , 2 , 3... . So,
Δ t d j = t d j t d j 1 = N j 1 / s b j 1 , j = 1 , 2 , 3...
which means the optimal bus departure interval during the peak period is the time that the preceding bus riders spend on boarding. Furthermore, when the number of boarding commuters and the boarding capacity of every bus are assumed to be same, N = N j = N j 1 , j = 1 , 2 , 3... , and s b = s b j 1 = s b j , j = 1 , 2 , 3... respectively, we have:
Δ t d j = t d j t d j 1 = N j 1 / s b j 1 = N / s b , j = 1 , 2 , 3...
This completes the derivation.

References

  1. Vickrey, W.S. Congestion theory and transport investment. Am. Econ. Rev. 1969, 59, 251–260. [Google Scholar]
  2. Arnott, R.; de Palma, A.; Lindsey, R. Schedule delay and departure time decisions with heterogeneous communeters. Transp. Res. Rec. 1988, 1197, 56–67. [Google Scholar]
  3. Arnott, R.; de Palma, A.; Lindsey, R. Economics of a bottleneck. J. Urban Econ. 1990, 27, 111–130. [Google Scholar] [CrossRef]
  4. Arnott, R.; de Palma, A.; Lindsey, R. Route choice with heterogeneous drivers and group-specific congestion costs. Reg. Sci. Urban Econ. 1992, 22, 71–102. [Google Scholar] [CrossRef]
  5. Arnott, R.; de Palma, A.; Lindsey, R. The welfare effects of congestion tolls with heterogeneous commuters. J. Transp. Econ. Policy 1994, 28, 139–161. [Google Scholar]
  6. Arnott, R.; DePalma, E. The corridor problem: Preliminary results on the no-toll equilibrium. Transp. Res. Part B 2001, 45, 743–768. [Google Scholar] [CrossRef]
  7. Lindsey, R. Existence, uniqueness, and trip cost function properties of user equilibrium in the botteneck model with multiple user classes. Transp. Sci. 2004, 38, 293–314. [Google Scholar] [CrossRef]
  8. Van den Berg, V.; Verhoef, E.T. Congestion tolling in the bottleneck model with heterogeneous values of time. Transp. Res. Part B 2011, 45, 60–78. [Google Scholar] [CrossRef]
  9. Li, Z.C.; Lam, W.H.K.; Wong, S.C. Step tolling in an activity-based bottleneck model. Transp. Res. Part B 2017, 101, 306–334. [Google Scholar] [CrossRef]
  10. Guo, R.Y.; Yang, H.; Huang, H.J.; Li, X.W. Day-to-day departure time choice under bounded rationality in the bottleneck model. Transp. Res. Procedia 2017, 23, 551–570. [Google Scholar] [CrossRef]
  11. Knockaert, J.; Verhoef, E.T.; Rouwendal, J. Bottleneck congestion: Differentiating the coarse charge. Transp. Res. Part B 2016, 83, 59–73. [Google Scholar] [CrossRef] [Green Version]
  12. Khan, Z.; Amin, S. Bottleneck model with heterogeneous information. Transp. Res. Part B 2018, 112, 157–190. [Google Scholar] [CrossRef]
  13. de Palma, A.; Arnott, R. The temporal use of a telephone line. Inf. Econ. Policy 1990, 4, 155–174. [Google Scholar] [CrossRef]
  14. Tian, Q.; Huang, H.J.; Yang, H.; Gao, Z.Y. Efficiency and equity of ramp control and capacity allocation mechanisms in a freeway corridor. Transp. Res. Part C 2012, 20, 126–143. [Google Scholar] [CrossRef]
  15. Chen, D.; Zhang, N.; Liu, J. Effect of road traffic congestion on aviation passenger’s flight choice. J. Transp. Syst. Eng. Inf. Technol. 2013, 13, 96–102. [Google Scholar] [CrossRef]
  16. Takayama, K.; Kuwahara, M. Bottleneck congestion and residential location of heterogeneous commuters. J. Urban Econ. 2017, 100, 65–79. [Google Scholar] [CrossRef] [Green Version]
  17. Mohring, H. Optimization and scale economies in urban bus transportation. Am. Econ. Rev. 1972, 62, 591–604. [Google Scholar]
  18. Jansson, J.O. A simple bus line model for optimisation of service frequency and bus size. J. Transp. Econ. Policy 1980, 14, 53–80. [Google Scholar]
  19. Sumi, T.; Matsumoto, Y.; Miyaki, Y. Departure time and route choice of commuters on mass transit systems. Transp. Res. Part B 1990, 24, 247–262. [Google Scholar] [CrossRef]
  20. Alfa, A.S.; Chen, M. Temporal distribution of public transport demand during the peak period. Eur. J. Oper. Res. 1995, 83, 137–153. [Google Scholar] [CrossRef]
  21. Tian, Q.; Huang, H.J.; Yang, H. Equilibrium properties of the morning peak-period commuting in a many-to-one mass transit system. Transp. Res. Part B 2007, 41, 616–631. [Google Scholar] [CrossRef]
  22. Kraus, M.; Yoshida, Y. The commter’s time-of-use decision and optimal pricing and service in urban mass transit. J. Urban Econ. 2002, 51, 170–195. [Google Scholar] [CrossRef]
  23. Kraus, M. A new look at the two-mode problem. J. Urban Econ. 2003, 54, 511–530. [Google Scholar] [CrossRef] [Green Version]
  24. Kraus, M. Road pricing with optimal mass transit. J. Urban Econ. 2012, 72, 81–86. [Google Scholar] [CrossRef] [Green Version]
  25. Ruiz, M.; Segui-Pons, J.M.; Mateu-LLadó, J. Improving Bus Service Levels and social equity through bus frequency modeling. J. Transp. Geogr. 2017, 58, 220–233. [Google Scholar] [CrossRef]
  26. AlKheder, S.; AlRukaibi, F.; Zaqzouq, A. Optimal bus frequency for Kuwait public transportation company: A cost view. Sustain. Cities Soc. 2018, 41, 312–319. [Google Scholar] [CrossRef]
  27. Wang, D.Z.W.; Nayan, A.; Szeto, W.Y. Optimal bus service design with limited stop services in a travel corridor. Transp. Res. Part A 2018, 111, 70–86. [Google Scholar] [CrossRef]
  28. Börjesson, M.; Fung, C.M.; Proost, S. Optimal prices and frequencies for buses in Stockholm. Econ. Transp. 2017, 9, 20–36. [Google Scholar] [CrossRef]
  29. Sun, L.; Tirachini, A.; Axhausen, K.W.; Erath, A.; Lee, D.H. Models of bus boarding and alighting dynamics. Transp. Res. Part A 2014, 69, 447–460. [Google Scholar] [CrossRef]
  30. Tirachini, A.; Hensher, D.A. Bus congestion, optimal infrastructure investment and the choice of a fare collection system in dedicated bus corridors. Transp. Res. Part B 2011, 45, 828–844. [Google Scholar] [CrossRef]
  31. Guenthner, R.P.; Hamat, K. Transit dwell time under complex fare structure. J. Transp. Eng. ASCE 1998, 114, 279–367. [Google Scholar] [CrossRef]
  32. Levine, J.C.; Torng, G.W. Dwell-time effects of low-floor bus design. J. Transp. Eng. ASCE 1994, 120, 914–929. [Google Scholar] [CrossRef]
  33. Dorbritz, R.; Lüthi, M.; Weidmann, U.; Nash, A. Effects of onboard ticket sales on public transport reliability. Transp. Res. Rec. 2009, 2110, 112–119. [Google Scholar] [CrossRef]
  34. Fernández, R.; Zegers, P.; Weber, G.; Tyler, N. Influence of platform height, door width, and fare collection on bus dwell time. Transp. Res. Rec. 2010, 2143, 59–66. [Google Scholar] [CrossRef]
  35. Tirachini, A. Bus dwell time: The effect of different fare collection systems, bus floor level and age of passengers. Transp. A Transp. Sci. 2013, 9, 28–49. [Google Scholar] [CrossRef]
  36. Fletcher, G.; El-Geneidy, A. The effects of fare payment types and crowding on dwell time: A fine-grained analysis. Transp. Res. Rec. 2013, 2351, 124–132. [Google Scholar] [CrossRef]
  37. D’Souza, C.; Paquet, V.; Lenker, J.A.; Steinfeld, E. Effects of transit bus interior configuration on performance of wheeled mobility users during simulated boarding and disembarking. Appl. Ergon. 2017, 62, 94–106. [Google Scholar] [CrossRef] [PubMed]
  38. Wu, W.T.; Liu, R.H.; Jin, W.Z. Modelling bus bunching and holding control with vehicle overtaking and distributed passenger boarding behaviour. Transp. Res. Part B 2017, 104, 175–197. [Google Scholar] [CrossRef]
  39. Ji, Y.J.; Gao, L.P.; Chen, D.D.; Ma, X.W.; Zhang, R.C. How does a static measure influence passengers’ boarding behaviors and bus dwell time? Simulated evidence from Nanjing bus stations. Transp. Res. Part A 2018, 110, 13–25. [Google Scholar] [CrossRef]
  40. Small, K.A. The scheduling of consumer activities: Work trips. Am. Econ. Rev. 1982, 72, 467–479. [Google Scholar]
Figure 1. The timeline of the boarding commuter departing at time t during the peak-period bus commuting.
Sustainability 10 03497 g001
Figure 2. The boarding queuing diagram and the boarding no-toll equilibrium diagram. (a) The boarding queuing diagram; (b) The boarding no-toll equilibrium diagram.
Sustainability 10 03497 g002
Figure 3. The boarding queuing time diagram and the boarding queuing length diagram. (a) The boarding queuing time diagram; (b) The boarding queuing length diagram.
Sustainability 10 03497 g003
Figure 4. The no-toll equilibrium diagram.
Sustainability 10 03497 g004
Figure 5. The dynamic boarding queuing congestion toll and the corresponding dynamic fare of the commuter departing at different time. (a) The dynamic boarding queuing congestion toll at different time; (b) The corresponding dynamic fare of the commuter departing at different time.
Sustainability 10 03497 g005
Table 1. Methodology related to optimal pricing and service for the peak-period bus commuting inefficiency of boarding queuing congestion.
Selected ReferenceMethodologyCharacteristics
Vickrey [1]First bottleneck modelEquilibrium queuing patterns at a single bottleneck on freeways to a work place during the morning peak period
Arnott et al. [3]The extended bottleneck modelQueue delay at the bottleneck can be eliminated by time-varying pricing
Mohring [17]The bus line model: the basic model of optimal pricing and service in urban mass transit The square root principle: the optimal bus frequency is proportional to the square root of the number of commuters
Jansson [18]A model extended the square root principle Service frequency was simultaneously optimized with bus size
Tian et al. [21]An equilibrium model of peak-period commuting for a mass transit lineQueuing time at station is zero for simplicity and the general properties of the equilibrium departure time distribution of commuters
Kraus and Yoshida [22]The rail line model: queuing time at a transit stop is treated analogously to queuing time at a bottleneckEconomic analyses of the commuters’ time-of-use decision, the optimal pricing, and the service in urban mass transit and under the optimal pattern of arrivals decentralized with an appropriate run-dependent fare, no queuing actually occurs
Sun et al. [29]The first use of smart card dataBus passenger boarding behavior and its impact on bus dwell time
This paperThe equilibrium bus boarding model: queuing time at the bus station is treated analogously to queuing time at a bottleneckDynamic boarding queuing congestion toll can indicate the social optimal equilibrium and the optimal bus departure interval during the peak period, which does not conform to the square root principle
Table 2. The symbols and their meanings/description.
SymbolMeaning/Description
N Number of the identical commuters of the bus
t [ t a , t b ] Commuter’s departure time
t a The earliest boarding commuter’s departure time
t b The last boarding commuter’s departure time
T f Travel time of the commuter from the origin to the bus station, which is assumed to be the same for all commuters
t r The time when the bus arrives at the bus station
t l The time when the bus leaves from the bus station
T b w ( t a ) = t a + T f t r The time that the arrival bus waits for the earliest boarding commuter at the bus station
s b Boarding capacity of the bus
T ( t ) Boarding queuing time of the commuter departing at time t at the bus station
T o ( t ) Boarding time of the commuter departing at time t
I Time that elapses from the boarding time of the commuter to the time that the commuter chooses the seat or the standing position in the bus, which is ignored
T ( t ) = T o ( t ) ( t + T f ) Boarding queuing time of the commuter departing at time t
E D ( t ) = t l T o ( t ) Early boarding delay of the commuter departing at time t
C ( t ) Travel cost of the commuter departing at time t
α Unit travel time cost
β Unit early boarding delay cost
p 0 The static fare
C Equilibrium travel cost
s c Commuter departure rate
D ( t ) Boarding queuing length at different time
T T Total boarding queuing time of all commuters on the bus
S D C Total early boarding delay cost of all commuters on the bus
T C Total equilibrium travel cost of all commuters on the bus
τ ( t ) Dynamic boarding queuing congestion toll
T τ Total dynamic boarding queuing congestion toll for all commuters on the bus
p ( t ) Dynamic fare
the subscript m Morning peak-period bus commuting
minMinute
N j 1 , N j Number of commuters on the preceding bus j 1 and the following bus j , respectively
s b j 1 , s b j Boarding capacity of the preceding bus j 1 and the following bus j , respectively
t d j 1 , t d j Departure time of the preceding bus j 1 and the following bus j at the last bus station, respectively
T b j 1 , T b j The time the preceding bus j 1 and the following bus j spend on arriving at the bus station from the last bus station, respectively
t j a The earliest boarding commuter’s departure time of the following bus j
t ( j 1 ) b The last boarding commuter’s departure time of the preceding bus j 1
Δ t d j Bus departure interval, Δ t d j = t d j t d j 1
t j r The time the following bus j arrives at the bus station
t ( j - 1 ) l The time the preceding bus j 1 leaves the bus station