Article

Sustainable Financing for Sustainable Development: Understanding the Interrelations between Public Investment and Sovereign Debt

Division of Sustainable Development, College of Science and Engineering, Hamad bin Khalifa University, Qatar Foundation (QF), Education City, Doha 34110, Qatar
*
Author to whom correspondence should be addressed.
Sustainability 2018, 10(11), 3901; https://doi.org/10.3390/su10113901
Submission received: 15 September 2018 / Revised: 16 October 2018 / Accepted: 23 October 2018 / Published: 26 October 2018
(This article belongs to the Section Economic and Business Aspects of Sustainability)

Abstract

:
This study investigates the causal relationship between public investment and sovereign debt (i.e., external and domestic public debt) with respect to the limits of public-debt sustainability for four countries with the highest GDP (i.e., the United States, China, Japan, Germany) during the period of 2000–2015. In summary, this study establishes quantitative evidence based on empirical findings to support the claim that sovereign debt is harmful to the financing of public infrastructure if it breaches certain thresholds, as proposed in this study, and according to the literature. By this approach, the findings enable us to make recommendations about the need for mobilizing domestic resources and innovating new financial models to promote sustainable development within the limits of sustainable public debt. In short, this paper concludes that performing a project for sustainable development by implementing unsustainable financing models will always end up with unsustainable economic outcomes.

1. Introduction

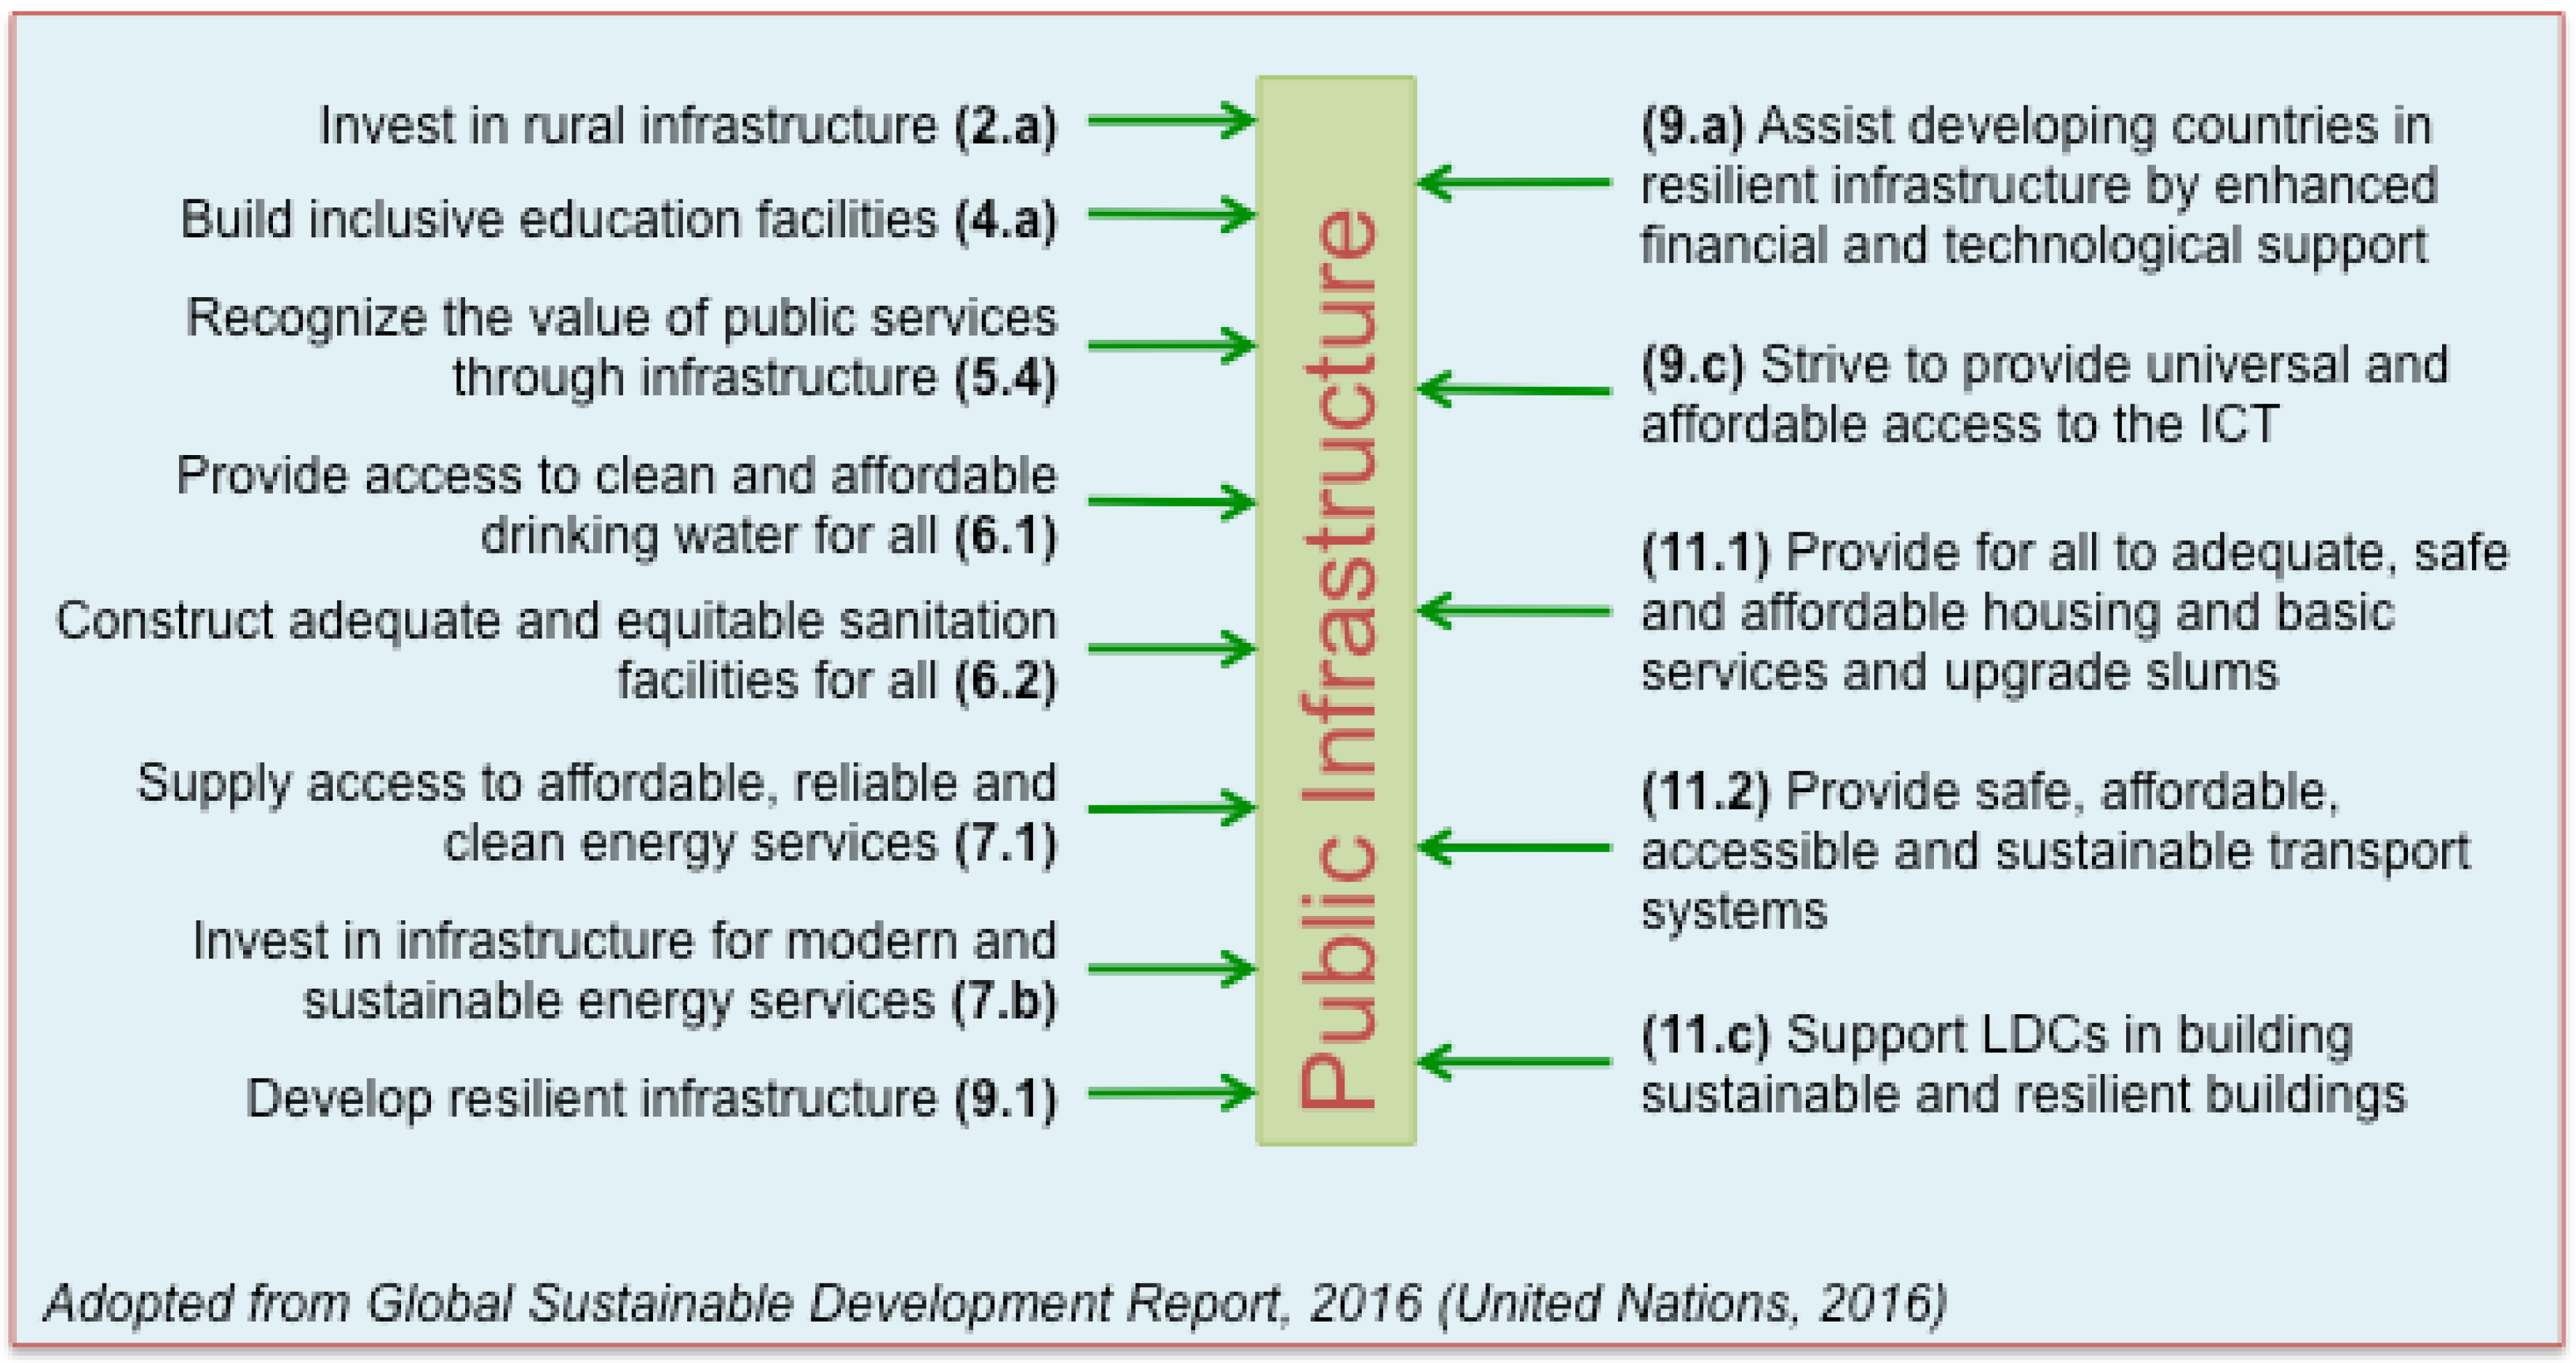
Public infrastructure plays a profound role in ensuring and sustaining the welfare of nations by satisfying almost all goals of the UN’s sustainable development goals (see Figure 1) [1]. In a broader perspective, public investment entails public infrastructures such as energy, water, transportation, communication, health and education along with vital intangible investments in nurturing human development, improving social efficiency, fostering quality of public operations, implementing better management structures, and conducting relevant research and development (R&D). Public infrastructure, and hence public investment, is an expensive concept as it aims to cover the whole of society by providing all needs at an adequate level. It requires substantial up front capital to construct, install, and build, as well as ongoing capital for proper operation and maintenance to ensure basic services and benefits over a long time [2]. If public infrastructure is mainly built with debt-based financing, it may have quite serious and long-term adverse effects on the entire economy and society eventually. This study focuses on trying to understand the boundaries and effects of debt-based financing of public investments.
Thus far, governments have played a prominent role for building, owning, renovating, and operating the public infrastructures such as harnessing energy, generating and distributing electricity and water as well as the facilities of education, health, transportation, communication, sanitation, etc. The main driver for governments’ role in public investments is to protect the public from the formation of natural monopolies [3]. Another reason for government involvement is that the private sector is reluctant to undertake responsibility and associated risks for building and operating large and expensive infrastructure projects with long-term pay back; therefore, such public infrastructure projects are commonly financed by government revenue [4,5], aid-based [6,7], equity-based [8,9], and debt-based financing. Debt-based financing, averaged at 75% of infrastructure projects [10], is commonly used by countries [11] mainly due to fact that many do not have a reliable stream of public revenue [12], and many domestic and external creditors are always inclined to go for the guaranteed returns from a debtor country even with other means of collateral [13,14].
Borrowing enables individuals to balance their income and expenses (consumption) under fluctuations more than estimated levels. It also enables corporations to offset their production and investment when their sales fluctuate in severe and unpredicted levels and times. Additionally, it enables governments to smooth their revenue fluctuations and uncertainties from taxes, other incomes and expenditures. However, governments are warned to avoid borrowing beyond certain thresholds, such as the Maastricht criteria as adopted by the EU [15], to keep their debt at controllable and safe levels providing a buffer zone when extraordinary events happen to push their debt to the levels damaging their long-term economic growth and stability [12]. As debt levels rise beyond the estimated threshold level, borrowers’ ability to pay back their debt decreases and becomes more sensitive to income fluctuations, which puts them into even more vulnerable and risky conditions in the long-run. Furthermore, borrowing more to pay back previous debt becomes progressively more difficult and more expensive than before as interest rates set by lenders/creditors increase exponentially due to increasing risks. In this regard, lenders become unwilling to lend anymore, which leads to severe damages to economic development and the general welfare of society due to critically significant reductions in public investment. Put differently, higher debt levels cause financial volatility, damage financial stability, and reduce economic growth in the long run. As a result, higher public debt decreases economic and financial well-being, which is a main driving force for sustainable development, and this may limit essential government functions eventually affecting society and causing social instability [16].
This study contributes to the literature in several ways. In this paper, we investigate fiscal sustainability of the countries under consideration by performing a causality test between public investment and, separately, domestic-external public debt by considering the public-debt sustainability thresholds. To the best of the authors’ knowledge, this is the first attempt to decipher domestic and external public debt effects on public investment by considering sustainability thresholds, and vice versa. This research also attempts to reveal the structural breaks of sovereign debt, long-term relationships, and causality between external-domestic public debt and public investment in terms of public-debt sustainability during the period of 2000–2015 for the countries under consideration. By conducting this study, the results enable us to make recommendations about the need for mobilizing domestic resources and innovating new financial models to promote sustainable development within public-debt sustainability. This paper concludes that performing a project for sustainable development by implementing unsustainable financing models will always end up with unsustainable economic outcomes.
The rest of this paper proceeds as follows. Section 2 presents an extensive literature review on sovereign debt (domestic and external), relations between sustainable development and public infrastructure, and sustainable debt levels. In Section 3, the methodology is discussed in terms of the selection of countries, unit root tests, structural breaks, and the framework for causality. Section 4 discusses the empirical results and key findings as well as provides recommendations for filling the financial gap by mobilizing domestic resources and innovating new financial models for public infrastructure. Finally, Section 5 concludes that performing a project for sustainable development by implementing unsustainable financing models will always end up with unsustainable economic outcomes.

1.1. Problem Statement

High global debt concentration is a great challenge that needs to be solved for sustainable economic development [17]. Over the last decade, debt to GDP ratio on a global scale has increased relentlessly from 269% in 2007 to over 325% at the end of 2016. In other words, this ratio has risen more than 5.5% per year over the last decade [18,19]. This increase has high-risk for economic growth and financial stability because severe economic and financial crises are more likely to happen when the debt ratios go beyond certain thresholds [20]. However, macroeconomic debt is not always harmful; indeed, it might even be beneficial up to a certain level, as long as it is balanced.
It is well known that the public infrastructure needs of a society are key issues to be met for a prosperous, wealthy and coherent country and world, as quality public infrastructure guarantees social and economic equity among different segments and regions, which is a fundamental pillar for sustainable development [2,21]. Therefore, there exists a constant and urgent need to invest in planning, building and maintenance of public infrastructure, which demands a reliable stream of financing. For example, McKinsey (2013) estimated that US$57 trillion is needed by 2030 for global public infrastructure investments for electricity generation, transmission and distribution, water, telecommunications, and transport [22], while the OECD [23] estimated the figure at US$71 trillion. The European Commission reported that the EU will need around €2 trillion for public infrastructure investments by 2020 [24]. In the United States, if today’s investment gap in public infrastructure is not addressed, the economy is expected to lose almost US$4 trillion in GDP by 2025, and US$18 trillion in GDP by 2040, averaging over US$700 billion per year [25]. As can be seen, there is a huge financial gap to fill in public infrastructure investments. Thus, the main problem that this study aims to investigate and provide evidence for with quantification is the following: If the majority of the financing for public infrastructure comes from debt-based financing sources, either from domestic or external creditors, how may it affect the long-term economic and social development to the benefit of society? Then, the key question being answered eventually would be what are sustainable financing mechanisms to invest in public infrastructure without damaging the long-term sustainable economic and social development?

1.2. Research Questions and Objectives

Based on the discussions and problem statement, the following research questions are determined:
(Q1)
How can the countries be classified for public debt sustainability?
(Q2)
How do the countries behave during economic crises in terms of external and domestic debt?
(Q3)
Do the countries have a long-term relationship between sovereign debt and public investment?
(Q4)
Does any causality exist between sovereign debt and public investment? If so, which directions do the countries have causality between them in terms of public-debt sustainability zones? What is the meaning of these causalities?
(Q5)
Is there any pattern in causality results in terms of public-debt sustainability?
(Q6)
What and why do countries need to do for mobilizing domestic savings and innovating alternative financial models to promote sustainable development?
The main objective of this paper is to evaluate sustainable financing for sustainable development by using the terms of “sovereign debt” and “public investment” in order to analyze how public investment reacts against external and domestic public debts, and to assess the need for mobilizing domestic resources and creating new financial models.
In line with the research questions above, the following specific objectives are set for this study:
(i)
To set debt sustainability levels to classify countries into sustainable, quasi-sustainable, and unsustainable debt zones according to their gross government debt-to-GDP ratios.
(ii)
To investigate the structural breaks of sovereign debt (external and domestic) for obtaining meaningful results on economic crises.
(iii)
To evaluate a long-term relationship between external–domestic public debt and public infrastructure with a cointegration test analysis.
(iv)
To explore the causality between external–domestic public debt and public infrastructure investments for selected countries.
(v)
To conclude with a need for mobilizing domestic savings and innovating alternative financial models to promote sustainable development.
This study’s ultimate aim is to establish empirical evidence with a quantitative methodology to support the idea of filling the financial gap by mobilizing domestic resources and innovating new financial models, rather than pure debt-based financing, before sovereign debt breaches the certain thresholds for public-debt sustainability.

2. Literature Review: Sustainable Infrastructure Investments and Sovereign Debt

2.1. Sustainable Development, Public Investment and Infrastructure

Sustainability and public infrastructure share a common purpose that is to provide sufficient needs of society for the current and long-term period. In 1987, the World Commission on Environment and Development, under the chair of Gro Harlem Brundtland, the former Norwegian Prime Minister, originally defined the sustainable development as follows: “Sustainable development is the development that meets the needs of the present without compromising the ability of future generations to meet their own needs” [26]. As understood from this statement, the main goal of sustainability is to attain the development for both generations together at the same time under the current generation’s responsibility by considering the needs for the next generation without limiting their ability to live, work, and progress. Furthermore, this supports the expression of Eisenhower, the former president of the U.S., in terms of the impact of sovereign debt on future generations as follows: “Personally, I do not feel that any amount can be properly called a surplus as long as the nation is in debt. I prefer to think of such an item as a reduction on our children’s inherited mortgage” [27].
Sustainable investing is the concept taking roots both in the social movements and the environmental protection acts of the 1960s and 1970s, inspired by Rachel Carson’s impressive book Silent Spring written in 1962 [28]. During this period, a growing concern over the high impact of environmental pollution by heavy industrialization induced to the formation of the first Earth Day [29] and the establishment of the number of national environmental agencies such as the United States Environmental Protection Agency in 1970 [30]. However, sustainable financing was out of the scope of the development process till sustainable investing had become a mainstream paradigm of sustainable development since 1992, Agenda 21 [31]. This economic paradigm has important milestones over the period of this economic policy stated by the United Nations (UN) as follow:
  • There are three objectives for the implementation of Agenda 21 as follows: (i) to establish measurement objectives concerning financial activities; (ii) to create new and additional financial resources, which are sufficient and predictable; (iii) to seek qualitative improvement of funding mechanisms to carry out the goals [31].
  • The UN Monterrey Conference has considerably become a reference point for economic development cooperation with six main areas of financing for the development as follows: (i) mobilization of domestic financial resources for development; (ii) mobilization of international financial resources for development; (iii) international trade for development; (iv) increase in international cooperation of finance and technology for development; (v) decrease in external and unsustainable debt; (vi) improving the coherence and consistency of the international monetary, financial and trading systems [32].
  • In Future We Want [33]: Mobilization of domestic capital and effective use of financing are emphasized including the international projections of capital mobilization for achieving sustainable development goals.
  • Sustainable infrastructure investments were addressed in the 2030 Agenda for sustainable development under sustainable development goal (SDG) #9 by building resilient infrastructure, promoting sustainable industrialization and fostering innovation, as well as under each of the other goals such as alleviating poverty, eradicating hunger, supplying energy access for all, providing quality health care and education for all, promoting social equity, and propelling fair economy [34].
Public investment has a prominent role in global infrastructure (such as energy generation and distribution, water supply and sanitation facilities, transport networks, as well as social infrastructure) to meet the profound social and environmental challenges of this century, such as alleviating poverty, operating natural resources sustainably and mitigating dangerous climate change [34]. Societies and investors (i.e., institutional and/or individual), along with their governments, benefit from sustainable infrastructure investment due to the fact that they have a common interest in well-governed and well-functioning economic, social, and environmental systems. Societies benefit because they rely on public infrastructure affecting their quality of life, reducing economic inequity in a society, and propelling economic growth [35]. Individual and/or institutional investors benefit from public infrastructure investments, which usually have inherent-low debt default rates that provide a stable long-term return [36].
Public infrastructure’s quantity and quality have a positive influence on the competitiveness [37], attractiveness [38], sustainability [39], and the economic growth of a country [40]. Public investment brings further business opportunities by promoting trade as well as the growth of existing economic activity [41]. Moreover, public infrastructure also improves the standard of living for all by giving public access to indispensable resources and facilities, such as water, electricity, schools and hospitals [2,35]. This is even further true if the infrastructure investment is developed in sustainable fiscal policy [42].
A sustainable development vision will significantly depend on the development of sustainable infrastructure, which is mainly provided by public investment, such as public schools, hospitals, utilities, roads, communication systems, etc. [10]. The UN report (2017) estimates that the world population will reach 8.5 billion in 2030 and 9.8 billion by 2050 [43]. By 2030, the middle class will reach some 5.5 billion people (more than 70% of today’s global population—7.5 billion) accounting for one-third of the global economy by adding up to 2.5 billion newcomers to 3 billion existing members [44]. This increase will result in a substantial demand for economic and social infrastructure. In this regard, the OECD estimates that infrastructure development in the business-as-usual approach will cause the unsustainable rise in both energy demand (85%) and water consumption (55%) resulting in a potential shortage of global energy and water supply [45]. Furthermore, financial gap for the necessary development [46], global population growth [47], resource scarcity [48], and climate change [49] will require a paradigm shift towards consequent development of sustainable infrastructure [10]. To this end, alternative financial models and mobilizing domestic resources are required to support sustainable infrastructure development [50,51].

2.2. Infrastructure Investments in the Past

Public investment for infrastructure in OECD countries accounted for 2.2% of GNP between 1997 and 2002, compared with 2.6% from 1991 to 1997 [23,52]. A more recent 2015 report shows that the downward trend in government spending on infrastructure continued for the EU countries from 2010 to 2013 was reduced by a further 11% [53]. Furthermore, infrastructure investment has declined to different percentages of GNP for 11 countries of the G20 economies due to the global economic crisis in 2008 [46]. These cutbacks have been apparently observed in the United States, EU, Mexico, and Russia, while Turkey, Canada, and South Africa have increased their infrastructure spending.

2.3. Infrastructure Investments in the Future

From 2016 to 2040, the world is predicted to invest about 3.0% (business-as-usual current trend) to 3.6% (the need for global infrastructure investment, which is 20% more than the current trend) of GDP, or an approximate average of US$3–3.7 trillion a year, for new and existing economic infrastructure: energy (US$1 trillion a year), water (US$230 billion a year), telecommunication (US$300 billion a year) and transportation (US$1.5 trillion in a year) sectors in the current trend [54]. Electricity and roads account for more than two-thirds of global needs on infrastructure while meeting the SDGs for universal access to drinking water, sanitation and electricity increasing the need for global spending on public infrastructure by a further US$3.5 trillion by 2030 [54]. Not only the cost of infrastructure investment itself but also project designing and arranging financial support cost significant amounts by constituting up to 10% of total project costs [55].

2.4. Financial Gap for Public Infrastructure

There is a gap widening throughout the world between the need for financing infrastructure and the capacity of national budgets to meet this demand. The amount of this gap triples by considering the further investment required to meet SDGs [46]. The global shortfall in infrastructure investment is estimated to be at least US$1 trillion per annum [56]. The public sector, which is conventionally responsible for the infrastructure, often claims to have many other priorities preventing the government from closing this gap with necessary funds, which is indispensable for societies in terms of boosting development and prosperity [10].
Not only emerging or developing countries have a financial gap for infrastructure, but also the industrialized and developed countries have a larger gap to fill in with different financing models and resources for upgrading and maintenance. However, among these countries, there exist substantial differences in terms of the political [57] and economic positions [58] and requirements for closing this gap with the contribution of private capital [9,59,60]. For example, economic fluctuations combined with the sovereign debt [14,61,62] and existing tax regulations [4] have a substantial influence on decisions for financing infrastructure. In the countries that impose high-tax, such as Germany or Nordic countries in particular, further tax increase is not a feasible solution for financing infrastructure assets [10]. Moreover, fixed-income securities have a negative impact on the national budget and the financial/credit rating of the country in addition to financing only a limited number of projects [10,63]. These imply that equity-based financing and private investment has a crucial role to play for public infrastructure.
There is a growing interest with private investments for infrastructure. Private investments in listed infrastructure assets have showed a considerable performance for accumulating the total stock by increasing some four-fold from US$600 billion in 2002 to US$2.3 trillion in 2013 [64]. Furthermore, unlisted infrastructure funds exhibit more ambitious growth in the market. A five-fold increase was recorded from US$11 billion in 2006 to US$55 billion approximately in 2016, with a drop to US$6.5 billion in 2009 due to the financial crisis [59]. Since the economic and financial crises in 2008, annual investing on infrastructure has recovered rapidly. For instance, foreign investors increased their investment activities in European infrastructure by four times more from 2010 to 2013 (particularly investors from the Gulf Cooperation Council (GCC), China/Hong Kong, Canada, Japan, and South Korea) [65]. This report also notes that Europeans’ share in global infrastructure financing has reduced more than half in 2013 compared with 2006.

2.5. Public Debt Sustainability

Minea and Villieu [66] provide evidence to support that excessive public debt incurs a shortage of public investment, and does not ensure filling a gap in public investment [66,67]. Public debt has soared for the advanced and emerging countries as a result of the financial crisis of 2008–2009. Reinhart and Rogoff [68] showed that an increase in public debt persists for a long time following the financial crises. In this regard, the levels of public debt have been unsustainable for a number of countries from 2010 to 2040 according to the projections of the public debt-to-GDP ratio [16]. In addition, there are many studies on debt/GDP thresholds from sustainable to unsustainable public debt, with respect to different aspects such as economic growth, primary surplus, private savings and public investment, ranging from 60% to 90% [16,68,69,70]. In contrast, Panizza and Presbitero [71] found that there is no evidence that public debt has a causal effect on economic growth, although there exists a negative correlation between them.
There are many studies that have investigated the sustainability of public debt in different countries from different aspects with different methodology. For instance, Bohn [72] proposed a new method for the sustainability of public debt in the United States by analyzing whether primary surplus with respect to GDP is a linear function of debt-to-GDP ratio; if so, public debt is considered sustainable. Although this is widely used alone in the literature for different countries, this has been complemented by additional tests such as a stationary test with respect to the real deficit of interest payments [73]. For Germany, along with other European countries, following sustainable debt policies has been investigated by testing the public debt-to-GDP ratio with different techniques against economic growth with a number of channels (i.e., private saving, public investment and total factor productivity) [70,74] and primary surplus [73,75]. Many scholars have extensively studied Japanese fiscal policy and debt sustainability [76,77,78,79,80], because it requires thorough research due to the fact that Japan has much higher gross public debt than the other developed countries. Fincke and Greiner [81] have also conducted a comparative study of public debt sustainability in the United States, Germany and Japan. As for China, there exist several studies showing that sustainable debt policies still have been followed by the central government, but it needs to develop and enhance existing policies for the local (city) governments due to the shortage of land finance, which is a considerable financing tool for public investment [82].
There are different definitions for external and domestic debt as follows. If a debt holder is a resident of the country, or debt is issued in domestic currency, then this is called domestic debt, otherwise it is called external debt [83]. So far, most of the existing researches have only considered public debt as an aggregated value of domestic and external public debt. In this research, public debt is decomposed into domestic and external debt to gain more insight into the vulnerabilities of sustainability with respect to public investment. In terms of foreign currency, excessive external debt may lead to severe debt crises faster than domestic borrowing because governments can interfere in domestic debt when it reaches sustainability thresholds by increasing inflation, but external debt has a much narrower set of options [84]. However, the United States is less prone to external debt crises because external borrowing of the US is a large stock of domestic currency, which is in US dollars [83]. There exists a couple of reasons for that: The largest share of global external debt is denominated in US dollars, and world trade is commonly in US dollars, which is the main reserve currency in the world [85].
Countries that have a high level of public debt, such as Japan, present a low level of public investment in OECD countries [67]. Japanese fiscal policy is a unique case in which external and private debt have been transferred to domestic public debt; for example, more than 90% of the private debt of public companies in 1975 declined to below 50% in 1992 by shifting private and mostly external debt into domestic public debt [79]. In this regard, Japan sustained net public debt, which was around 90% in 2007, by increasing primary surplus up to the financial crises of 2008–2009 [77,81]. However, Fincke and Greiner [81] showed that there is no evidence that Japan followed sustainable debt policies in terms of gross public debt, which was around 185% in 2007 and this is much higher than net public debt, even though they found weak net public debt sustainability at the 10% level of significance over the period from 1970 to 2007 by including the high level of assets. Broda and Weinstein [77] stated that Japan’s sustainability problem of public debt is the level of future liabilities, not current debt-to-GDP ratio, after demonstrating that the current debt burden of Japan is less heavy than reported in the literature because net public debt is only half of the gross public debt. In the same paper, the analysis showed that unsustainability takes over due to the political reasons for default and self-fulfilling prophecies.
There exists a number of studies that have been conducted on the fiscal policies of public debt sustainability for European countries in different contexts, namely, with respect to economic growth, primary surplus, private savings, total factor productivity, and public investment [70,73,74,75,78,81]. Germany has followed a sustainable debt policy over the period from 1961 to 2008, even though the debt-to-GDP ratio soared after the German Reunification in 1989/1990 [70,73,81]. This increase in the debt-to-GDP ratio has been well managed by taking corrective actions with dynamic decision making strategy, which are designed to increase primary surplus and decrease government expenditure [75,78]. In this regard, public investment is a kind of expenditure that can be reduced whenever public debt increases; thereby, the decline of public investment in Germany due to the increase in public debt is proven in the literature to provide public debt sustainability [67,74].

3. Methodology

In this section, we explain our approach and criteria to choose countries to be included for further analysis in this study as well as describe an overall framework for data analysis and data-gathering processes. Next, we present unit root tests, along with structural breaks, confirmatory analysis, and cointegration tests to analyze how the data becomes stationary and to investigate long-run relationships by sharing common trends between the datasets for each country considered in this research before providing insights into the causality.
In this regard, two criteria were employed for choosing countries:
(i)
Twenty countries with the largest GDP were taken into consideration as the potential candidates for the analysis due to fact that they constitute a significant amount of economic activity in the World, together consisting of around 80% of global GDP (see Appendix A.1). The debt-to-GDP ratios of these countries are ordered according to the size of their GDP (see Figure 2). They comprise about 60% of total world population (7,523,997,000) in 2017, which is a meaningful domain for our study (see Appendix A.2).
(ii)
These countries were divided into three groups according to their debt-to-GDP ratios. We assumed that there were two sustainability thresholds for sovereign debt-to-GDP ratio as reported in the literature. First, the Treaty on the European Union (i.e., Maastricht Treaty) states in the second criteria of article 121 that, as a reference point, the ratio of gross government debt must not exceed 60% of their GDP at the end of each fiscal year [15]. Second, Cecchetti, Mohanty, and Zampolli [17] reported according to their empirical results that gross government debt should not exceed 85% of the GDP for sustainable economic growth. In this regard, this study assumes that countries fall into three debt zones, which are (a) sustainable (lower than 60% debt/GDP ratio); (b) quasi-sustainable (between 60–85% debt/GDP); and (c) unsustainable (higher than 85% debt/GDP) (see Figure 3).
After dividing these countries with the highest GDP into the public-debt sustainability zones (henceforth called as debt sustainability zones and sustainable debt zones) according to the second criterion, the United States, China, Japan, and Germany were selected to analyze their external and domestic public debt effects on financing public infrastructure depending on their gross government debt-to-GDP ratio (see Figure 3). China (43%), Germany (71%), and the United States (105%) fall respectively into the sustainable, quasi-sustainable, and unsustainable debt zones according to their debt-to-GDP ratios. Furthermore, Japan (248%) is also included in the study due to the fact that it falls definitely into the unsustainable debt zone because of its excessive gross government debt. These are the four pioneer countries in sustainable energy for building more than half of the global renewable power capacity [86] and good representatives for the global economy because they constitute approximately half of the world’s GDP (see Appendix A.2).

3.1. Data Gathering

This study empirically analyses how external and domestic public debt influences public infrastructure investments with respect to debt sustainability zones in the selected countries: China, Germany, USA, and Japan. In this regard, panel data involves public investment, external public debt, and domestic public debt spanning the 2000–2015 time period for each country, except for China (1980–2015 for external, and 1995–2015 for domestic public debt, see Appendix A.3). Public investment is a key input in the creation of physical assets including economic infrastructure (highways, airports, seaports, energy utilities, etc.) and social infrastructure (public schools, universities, hospitals, etc.). The data for public investment was gathered from IMF Fiscal Affairs Department based on annual data for the time period of 1960–2015, which is why our analysis is limited up to 2015 [87,88]. External public debt was collected from the World Bank [89] based on quarterly data considering the last quarter of each year as annual data. Domestic public debt was obtained by subtracting the external public debt from gross government debt [90], thereby domestic public debt data is limited to the time period starting from 2000 (except for China), during which external public debt data is available.

3.2. Framework for Causality

After collecting the data, this study followed the framework as outlined in Figure 4. This framework gives us a holistic approach to analyze the data for causality between public investment and debt for a country by comprising three parts with color-coded representation as shown in Figure 4:
Preparation: In the orange-colored column, the data is prepared for conducting statistical analyses and tests with correlations between the datasets, cleaning the data (i.e., removing outlier and replacing missing values (if there is) with sample mean), and forecasting some missing data points at the beginning or end of the time series in case of the need for having consistent time periods with the same interval for all datasets.
Pretesting: In the blue-colored column, unit root and co-integration tests are performed as a pretest for Granger causality. First, augmented Dickey-Fuller (ADF) [91] and Zivot-Andrew tests [92] are selected as the unit root tests for obtaining the integration number of the time series, namely public investment, external public debt, and domestic public debt. Furthermore, Zivot-Andrew (ZA) test also gives us structural breaks in the datasets. Following ADF and ZA tests, integration numbers are investigated pairwise whether they are equal by confirmatory analysis. Second, Johansen test is chosen as the co-integration test to evaluate the long-run relationship by sharing a common trend between datasets and countries chosen for this the study.
Causality: In the green-colored column, Granger [93] or Toda-Yamamoto Granger causality [94] is applied on the datasets by considering the results in pretesting. If the integration numbers of related datasets are the same with each other and there is no co-integration between them, then conventional Granger causality can be performed, otherwise Toda-Yamamoto Granger causality has to be conducted.

3.3. Unit Root Tests

Granger causality, first, requires pretest for the datasets whether they are stationary or not. In the case of non-stationary, there are two main techniques to make the datasets stationary, namely taking the difference and transforming the data. To this end, all variables were transformed to their conjugate symmetry and were taken the first-difference and second-difference. Afterwards, the augmented Dickey-Fuller [91] and Zivot-Andrew [92] tests, along with endogenous structural breaks, were conducted for a unit root with respect to level, first, and second difference of the data.

3.4. Confirmatory Analysis

Confirmatory analysis is employed to determine whether the time series are stationary in the same integration order for both unit root tests, ADF and ZA. In this analysis, the integration orders (i.e., I(0), I(1), and I(2) show the status of being stationary in the time series in level, 1st difference, and 2nd difference, respectively) obtained by ADF and ZA test were consolidated into a table to assess the stationary status of each time series. In this sense, the datasets (i.e., domestic-external public debt and public investment) for each country may become stationary in different integration orders according to ADF and ZA unit root tests. By the confirmatory analysis, this discrepancy was taken into consideration by approaching from two different angles. First, the integration orders of each time series from both unit root tests (i.e., ADF and ZA) were taken into consideration when the dataset became stationary at the first time without looking at the significance level. Then, this time series was treated as stationary if the numbers of integration were the same with both unit root tests, otherwise the result of confirmatory analysis was considered inconclusive. Second, the integration orders of each time series from both unit root tests (i.e., ADF and ZA) were taken into consideration when the dataset became stationary with the highest significance level. After this, we compared the results from both unit root tests for each time series to determine the stationary status, same as in the first angle. These methods are called first appearance and strong stationary, respectively.

3.5. Co-Integration Test

Existing cointegration requires a long-run relationship among the datasets, implying that the deviations from the equilibrium state for a co-integrated vectors are stationary with finite variance, even if each data set is nonstationary with infinite variance [95]. In case of the existence of a co-integration, there exists at least a unidirectional, or possibly a bidirectional, Granger causality as another important implication of the long-run relationship. Engle and Granger [95], however, demonstrated that a vector autoregression (VAR) model in differences would be spurious due to the fact that the datasets in difference no longer have an invertible moving average if the datasets are co-integrated. Therefore, it is important to determine if the nonstationary datasets share a common trend (i.e., having co-integration) in a level before performing a VAR model for Granger causality. With the existence of co-integration among variables in levels, the VAR model cannot be used for a conventional Granger causality. In this sense, the VAR model must be replaced by either error-correction model (ECM) or by an augmented VAR model (see Section 3.6) with Wald test for a Granger causality [94,95]. For this reason, a Johansen [96] test was applied to determine the existence of the long-run equilibrium relationships between the datasets. In this study, the maximum eigenvalue (λmax) and trace (λtrace) statistics were employed to obtain the cointegration rank (r) which is equivalent to the number of independent cointegrating vectors. The equations for these tests are given as follows:
λ t r a c e ( r ) = T i = r + 1 n ln ( 1 λ i )
λ m a x ( r , r + 1 ) = T   ln ( 1 λ r + 1 )
where λ i and λ r + 1 are the estimated values of eigenvalue ( λ 1 > > λ r > 0 associated with eigenvectors β = ( ν 1 , , ν r ) ) and T is the number of observations.

3.6. Toda-Yamamota (TY) Granger Causality

In economics, the conventional Granger causality (hereafter, Granger causality is considered as the conventional one unless otherwise stated) is the most common method to test for a causal relationship between two time series [93]. This test requires estimating the following basic VAR(p):
Y t = γ + C 1 Y t 1 + + C p Y t p + u t
where Y t and γ are n-dimensional vectors (i.e., each element corresponds to a variable in the datasets), and u t represents an n-dimensional vector for white noise innovation assuming that there is no correlation between them, and C k denotes an n × n matrix of estimated parameters for lag k. The Granger causality plays a prominent role in obtaining meaningful results in terms of relationship, along with its direction between time series for many applications in economics, although it has few limitations.
There are two main preconditions to apply Granger causality for bivariate time series as follows. First, the integration orders of the time series must be the same with each other in the confirmatory analysis. Second, co-integration among the time series must be absent to avoid spurious results; even this implies that there exists at least unidirectional Granger causality. When one of these conditions is not satisfied, Granger [93] causality should not be performed on the time series (there are some exceptions see Reference [97]). Toda and Phillips [98] discussed further other limitations of the conventional Granger causality.
Toda and Yamamoto [94] proposed a powerful, yet simple method requiring the estimation of a modified Wald test (i.e., called modified because of the modified VAR model) based on an augmented VAR(p + dmax) model, where dmax is a maximum integration order among the variables. This test proves that the modified Wald statistic performed in this setting converges through the asymptotic χ2 random variable without depending on neither the integration number nor the co-integration results [94]. In this regard, the co-integration and unit root tests become only an informative form, rather than a pretest for the Granger causality, to avoid the spurious results of pretest. To implement the TY Granger causality test, estimation of the augmented VAR(p + dmax) model to be utilized is as follows:
Y t = γ ^ + C 1 ^ Y t 1 + + C p ^ Y t p + C p + d m a x ^ Y t p d m a x + u t ^
where the circumflex over a variable denotes the estimation of its ordinary least squares; dmax represents the maximum integration number; and C k corresponds to the n × n matrix of the parameters for lag k. In this study, lag order p is selected by SIC technique due to the fact that the true lag order is challenging to know a priori in practice. The null hypothesis of the modified Wald test is given as follows. The jth element of Y t does Granger-cause the ith element of Y t , if the following null hypothesis H0 is rejected:
H 0 : The   ( i , j )   element   of   C k   is   equal   to   zero   for   k = 1 , , p .
TY Granger causality stipulates that the maximum integration order d m a x must be less than or equal to the lag order p . If the variables, however, are cointegrated, then d m a x can be greater than p [94].

4. Empirical Results and Discussion

4.1. Unit Root Tests

To avoid the problem of spurious results, unit root tests were performed for the panel data to ensure that they were stationary in some integration orders before selecting which test (i.e., Toda-Yamamoto Granger causality or the conventional one) was more suitable for the causality. Table 1 reports the results of the ADF test for the panel data consisting of public investment, external public debt, and domestic public debt. The hypothesis of a unit root (i.e., non-stationary time series) for almost all datasets in levels cannot be rejected significantly. This result provides the evidence that these datasets are nonstationary except for Japan’s domestic public debt with a 1% significance level. However, all panel data in the first difference seem to be stationary at least at a 10% level of significance.
Further, the study also investigates the panel data in the second difference to check if there exists a stronger stationary state, particularly for the weaker ones (i.e., a 10% level of significance). Except for the domestic public debt of Germany and Japan, the hypothesis of a unit root for most of the datasets in the second difference can be rejected more significantly than the order of first difference (if a test statistic in second difference is less than the first difference, then it is stronger than the first difference, and vice versa). However, the public investment for China and the external public debt for the United States have weaker stationary in second difference.
Zivot and Andrews (ZA) unit root test, allowing for an endogenous structural break, was also employed to detect the possible shift in regime on the unit root test. Table 2 shows some differences against ADF test results for the external public debt of China and the public investment of USA and Japan that are stationary in second difference rather than the first. Furthermore, the public investment for Germany and the external public debt for the United States have a weak stationary state level. Remaining results are the same with the ADF test. We also conducted the ZA test up to second difference in line with the ADF test to investigate for stronger stationary.
The structural breaks in the external and domestic public debt for the stronger stationary position have mainly occurred around the economic crisis of 2008. Moreover, the results for stronger stationary reveal significantly that the domestic public debt always precedes the external public debt in terms of structural breaks during the economic crises.
As shown in Table 3, relatively, there exist many inconclusive results in the first appearance technique of the confirmatory analysis. For the strong stationary technique, however, there exists only one time series, domestic public debt for China, which is inconclusive. Therefore, the integration orders were used in the study as in the strong stationary afterwards. The inconclusive value was replaced with the integration order in the first appearance since it is conclusive in that technique at I(1).

4.2. Cointegration Test

Engle and Granger [95] showed that a VAR model in differences will lead to spurious results if the variables in the levels are co-integrated. Therefore, the study requires performing co-integration tests if the nonstationary variables in level share common trends before proceeding to the VAR model. In this regard, the VAR(p) model should be replaced either by an error-correction representation (ECM) or augmented VAR(p + dmax) model when there exists a linear combination among nonstationary variables in levels [94,95]. Accordingly, Johansen and Juselius [99] co-integration tests (i.e., maximum eigenvalue and trace test) were conducted to test the long-run equilibrium relationships among the variables. Table 4 reports the cointegration results for both maximal eigenvalue and trace test. For China, there is no cointegration for the external public debt meaning that the long-run relationship may not exist for the same variable at all. Germany has a weak cointegration at 10% significance level for the external public debt. However, remaining datasets for all countries specify a strong cointegration at 1% significance level. These results indicate that all datasets, except for external public debt of China, are required to present at least unidirectional causality.

4.3. TY Granger Causality Test

Using the time series in level, TY Granger causality tests were performed between sovereign debt (explicitly, external and domestic public) and financing public infrastructure for China, Germany, the United States, and Japan after the VAR(p + dmax) models had been constructed for related datasets. As shown in Table 5, the results indicate that there exists at least a unidirectional causality for almost all datasets, conforming to the long-run relationship in the co-integration test. However, the external public debt for China is the only dataset having no causality in any direction, which is consistent with the co-integration. For China, furthermore, there exists a unidirectional causality running from public investment to domestic public debt, implying that financing for public infrastructure leads to domestic public debt. In other words, China is less debt-dependent on public infrastructure because neither external nor domestic public debt does not Granger-cause public investment.
A weak unidirectional causality running from external public debt to public investment can be found at a 10% significance level for Germany, which is consistent with the cointegration results. For Germany, strong bidirectional causality exists between financing for public infrastructure and domestic public debt. In this regard, public investment affects domestic public debt, and this debt also has a direct impact on public investment.
The United States and Japan have strong bidirectional causality between both components of sovereign debt (i.e., external and domestic) and financing for public infrastructure at the 1% significance level. In these countries, the external part of sovereign debt comes into play for spending on public infrastructure. In other words, public investment has a considerable amount of influence over external public debt, and this debt also has a direct response on public investment.

4.4. Key Findings

To the best of our knowledge, this is the first attempt to decipher causal relationships between sovereign (explicitly, external and domestic) debt and public investment approaching from the debt sustainability perspective. In this regard, the key findings in this study can be summarized as follows:
(i)
The integration orders show a discrepancy between ADF and ZA tests for the same time series. This study eliminates these differences by performing the strong stationary technique of confirmatory analysis. These results are used to determine dmax in TY Granger causality.
(ii)
Two salient features are observed for the structural breaks of external and domestic public debts for all countries of interest in this study, which are China, Germany, Japan, and the United States (see Appendix A.3 for the time periods). First, all structural breaks for external public debt and domestic public debt occurred around the 2008 global economic crisis. Second, domestic public debt always occupied structural time breaks before external public debt in a strong stationary state. Moreover, the breaks for domestic public debt are detected in 2005 for China, 2008 for Germany, 2007 for the US, and 2007 for Japan, just before the global financial crisis. Therefore, this result implies that monitoring domestic public debt may help the governments predict possible global economic crises, since GDP of our sample comprises about 50% of the global GDP. Furthermore, the United States, China, and Japan make up the top three of heavily indebted countries in the world (This data is gathered from The World Economic Outlook (WEO) database that was published by IMF on 10 October 2017).
(iii)
This study finds that almost all the datasets share a common stochastic trend in level variables by conducting a Johansen [96] cointegration test; even Germany has a weak cointegration at 10% significance level. As an exception, the external public debt of China shows no cointegration over the period considered.
(iv)
This study deciphers the causal relationships, along with the directions, by performing TY Granger causality between external-domestic public debt and public investment for China, Germany, US, and Japan (see Appendix A.3 for the time periods). China presents only unidirectional TY Granger-causality running from public investment to domestic public debt. For Germany, there exists weak unidirectional TY Granger causality running from external public debt to public investment in addition to strong bidirectional causality between pubic investment and domestic public debt. There is strong unidirectional causality from external public debt to public investment in the US. In Japan, there exists strong unidirectional causality running from domestic public debt to public investment. The findings are quite consistent with both the cointegration results and the country segmentation for debt sustainability (i.e., sustainable, quasi-sustainable, and unsustainable debt zones)
(v)
The assumptions based on debt sustainability zones (i.e., sustainable, quasi-sustainable, and unsustainable debt zones) are confirmed by the results obtained from TY Granger causality. These zones are separated with two thresholds 60% and 85% obtained from the Treaty on European Communities [16] and empirical studies of Cecchetti, Mohanty, and Zampolli [17], respectively. The findings with respect to the sustainability zones can be summarized as follows:
  • Sustainable debt (less than 60%): China has only strong unidirectional causality running from public investment to domestic public debt. This indicates that public investment, which is one of the channels of economic growth, leads to domestic public debt, and thereby it is a less domestic debt-dependent country with respect to the investment, but vice versa is not true. Therefore, this causal relationship supports that of Tu and Padovani [82], who demonstrate that sustainable debt policies still have been followed by the central government, but it needs to develop and enhance existing policies for the local (city) governments due to the shortage of land finance, which is a considerable financing tool for public investment. Furthermore, there is no evidence for a causal relationship between public investment and external public debt. This is parallel with the findings of Panizza and Presbitero [71] that there is no evidence for a causal effect between public debt and economic growth in which public investment is a channel of growth.
  • Quasi-sustainable debt (between 60% and 85%): For Germany, there exists strong bidirectional causality between public investment and domestic public debt. This indicates that financing for public investment affects domestic debt, and vice versa. In other words, this may be considered as a push-and-pull strategy by dynamic decision-making for the fiscal policies of domestic public debt, along with public investment (i.e., government expenditure). This includes corrective actions such as to increase primary surplus demonstrated by Bohn [72], Greiner et al. [75], Fincke and Greiner [81], and to decrease public investment showed by Gong et al. [74], Heinemann [67], and Greiner [78]. However, there exists a weak unidirectional causality running from external public debt to public investment. Put differently, external public debt has appeared to lead public investment but only at a 10% significance level. This delicate situation for Germany requires some policy regulations to take corrective actions as stated in the domestic public debt and alternative financing systems to eliminate external-debt dependency on public infrastructure. Nevertheless, Germany still can be considered as near to a sustainable zone with caution, which is a quasi-sustainable zone. This finding is also consistent with Fincke and Greiner [81], Fincke and Greiner [73], and Checherita-Westphal and Rother [70].
  • Unsustainable debt (more than 85%): The United States has strong bidirectional causality between domestic public debt and public investment. On the one hand, this finding supports that the US has followed sustainable debt policies [81] in terms of domestic public debt by corrective actions including the increase in primary surplus showed by Bohn [72], and the decrease in public investment showed by Heinemann [67]. On the other hand, we obtain evidence on unsustainable debt policies in terms of external public debt by strong unidirectional causality running from external public debt to public investment. However, this unsustainability has incurred less vulnerability to external debt crises than the other countries due to the fact that external borrowing of the US is a large stock of domestic currency, which is in US dollars (Panizza 2008). Furthermore, global external debt is mainly denominated in US dollars, and world trade is commonly in US dollars, which is the main reserve currency in the world (Reinhart et al., 2002). Therefore, the US can tolerate more external public debt than other advanced countries because of the unique status of the US dollar stated above.
    As for Japan, there is strong bidirectional causality between external public debt and public investment. This finding provides evidence that Japan has followed sustainable fiscal policies in terms of the net public debt once the high level of assets are taken into account by corrective actions, implied by bidirectional causality, including the increase in primary surplus showed by Bohn [72], and the decrease in public investment showed by Heinemann [67]. Although gross public debt of Japan is excessive, Japanese fiscal policy is a unique case in which external and private debt have been shifted successfully to domestic public debt since the mid-1970s [77,79]. On the other hand, this study supports unsustainable fiscal policies in terms of domestic public debt by strong unidirectional causality running from domestic public debt to public investment. This is parallel with the findings of Fincke and Greiner [81] that there is no evidence that Japanese fiscal policy considers gross public debt sustainability.

4.5. Discussion and Recommendations

As in the case of a sustainable debt zone, China with a relatively low public debt/GDP ratio (less than 60%) should take necessary precautions such as avoiding excessive and misguided public investment, preventing corruption (it has been shown that the effect of public debt on economic growth is a function of corruption [101]), and balancing public and private infrastructure investments by collaborating with private wealth through different financial and business models to keep its sovereign debt level in this zone before becoming one of the highly indebted countries. The countries in a quasi-sustainable debt zone have dynamic decision-making policies for corrective actions on domestic–external public debt and public investment to offset the sovereign debt-to-GDP ratio to keep it in a certain and safe interval. However, in this sensitive case, countries reach, but do not breach, the second sustainability limit (85%) and may even start to show weak unidirectional causality (at 10% significant level) running from public debt to public investment while struggling to keep the balance between the debt and public investment. This delicate situation, as for Germany, requires some policy regulations and alternative financing systems, rather than pure debt-based financing to reduce debt dependency on public investment, and to be on the safe side of debt sustainability and to eliminate weak debt dependency, if it exists, on public investment.
A clear implication of unsustainable external debt results for the United States and provides evidence to support recommendations in the literature to reduce unsustainable external public debt by mobilizing domestic savings through public investment via fiscal policies to achieve the sustainable development goals [32,102,103,104,105]. For Japan, an unsustainable domestic debt zone indicates a need for innovating alternative financial models against pure debt-based financing (i.e., equity based financing or mixture of debt and equity) to ensure sustainable-domestic public debt by attracting mattress money and foreign direct investment to the domestic market, particularly for the public investment to promote sustainable economic growth; and by transferring domestic resources from nonmonetary financial stocks to the monetary financial system [16,32,33,104,106,107]. In these cases, shifting sovereign debt towards more sustainable-private debt (either, domestic or external) might be an alternative solution to reduce the debt-burden on the countries by creating alternative financial models for financing public infrastructure.
So far, we have discussed public debt sustainability with respect to public investment on four countries with the highest GDP, which are the four pioneer countries in sustainable energy by building renewable power capacity more than half of the global capacity [86] and consisting of around 50% of global GDP (see Appendix A.2), to investigate how they perform in financing for sustainable development. In what follows, we propose several directions for future research. In this work, we only analyze the four counties that are good at sustainable development with the highest GDP. To make a more comprehensive comparison and to reach a broader perspective, we plan to expand this research into the countries with lower GDP in which sustainable development is hindered by public debt. In this study, we only focus on the public debt sustainability by exploring the interrelations between public investment and public debt. Therefore, further research is needed to investigate the private investment and private debt in terms of debt sustainability, which are out of the scope of this research.
Another point to note is that the data coverage of public debt (external and domestic) provided by the World Bank and IMF is limited to around 15 years starting from 2000 for the countries of the United States, China, Germany and Japan [89]. On the other hand, the data coverage of public investment spans up to 2015—even it is available since 1960 [87,88]. This limits our analysis by 15 years because the intersection of public debt and investment is between 2000 and 2015.

5. Conclusions

Although the economic and fiscal policies along with geography, population, and ageing have a broad range of discrepancies in the countries under consideration, they have followed a similar pattern on public investment in terms of sovereign debt. Put differently, either external or domestic public debt becomes considerably influential on public investment when the public debt-to-GDP ratio rises up through the unsustainable debt zone. In this regard, sovereign debt is harmful to financing public infrastructure if it breaches the certain thresholds through the unsustainable debt zone. In other words, public borrowing can be beneficial in the beginning to promote economic growth by building public infrastructures until public debt leads to a debt trap and corruption. Therefore, this paper states that the countries with high public debt should take an immediate action decisively to address their fiscal problems, and the countries with moderate (or low) public debt should take necessary precautions to sustain their debt level before becoming one of the highly indebted countries. In short, this paper concludes that performing a project for sustainable development by implementing unsustainable financing models will always end up with unsustainable economic outcomes.

Author Contributions

Conceptualization, I.A.; Investigation, I.A.; Supervision, M.K.

Funding

This research received no external funding.

Conflicts of Interest

The authors declare no conflict of interest.

Appendix A

Appendix A.1. Top 20 Countries by GDP

Table A1. Top 20 Countries by their GDP (Billions $) in 2017.
Country200020052010201520162017
The US10,284.7513,093.7014,964.4018,120.7018,624.4519,362.13
China1214.912308.796066.3511,226.1911,232.1111,937.56
Japan4887.304755.985700.104379.874936.544884.49
Germany1955.672866.313423.473377.313479.233651.87
U. Kingdom1372.452207.452651.772434.792466.472574.81
India1638.702511.172431.172863.302629.192565.05
France476.64834.221708.462089.872263.792439.01
Brazil655.45891.632208.701801.481798.622080.92
Italy1145.111855.832129.021825.821850.741921.14
Canada742.321169.471613.461552.811529.761640.39
Russia561.60898.141094.501382.761411.041529.74
Korea279.03820.571638.461365.871283.161469.34
Australia399.28734.851249.651229.941261.651390.15
Spain597.151159.261434.261193.561232.601307.17
Indonesia679.63866.351051.131152.271046.931142.45
Mexico179.48310.82755.26861.14932.451010.94
Turkey273.09501.16772.29859.45863.39841.21
Netherlands414.02679.70837.95758.38777.55824.48
Saudi Arabia272.28408.79583.23679.15669.04680.65
Switzerland189.52328.21526.81654.27646.44678.54
Note: GDP data is gathered from The World Economic Outlook (WEO) database that was published by IMF on 10th of October 2017.

Appendix A.2. Populations for Top 20 Countries by GDP

Table A2. Populations for top 20 countries by their GDP in 2017.
Country201520162017
China1,371,220,0001,378,665,0001,383,981,000
India1,309,053,9801,324,171,3541,339,180,000
The United States320,896,618323,127,513325,524,000
Indonesia258,162,113261,115,456263,991,000
Brazil205,962,108207,652,865209,288,000
Russia144,096,870144,342,396144,231,000
Mexico125,890,949127,540,423129,163,000
Japan127,141,000126,994,511126,641,000
Germany81,686,61182,667,68582,581,000
Turkey78,271,47279,512,42680,745,000
France66,624,06866,896,10967,143,000
U. Kingdom65,128,86165,637,23966,013,000
Italy60,730,58260,600,59060,570,000
Korea, Rep.51,014,94751,245,70751,439,000
Spain46,447,69746,443,95946,460,000
Canada35,848,61036,286,42536,613,000
Saudi Arabia31,557,14432,275,68732,938,000
Australia23,789,33824,127,15924,446,000
Netherlands16,939,92317,018,40817,073,000
Switzerland8,282,3968,372,09884,41,000
Note: GDP data is gathered from population estimates and projections database that was published by World Bank on 20th of September 2017.

Appendix A.3. Data Resources

Table A3. Data sources and periods with respect to datasets.
DatasetData SourceCountryData Period
Public InvestmentIMF FAD Investment and Capital Stock DatasetUSA1960–2015
China1960–2015
Japan1960–2015
Germany1960–2015
External Public DebtWorld Bank and IMF (joint), SDDS—Gross External Debt Pos., General Government, All maturities, All instruments, USDUSA2003–2017
China1981–2017
Japan2003–2017
Germany2001–2017
Public DebtIMF—World Economic Outlook, USDUSA2000–2015
China1995–2017
Japan1980–2017
Germany1999–2017
Domestic Public Debt(Public Debt)—(External Public Debt)USA2003–2017
China1995–2017
Japan2003–2017
Germany2001–2017

References

  1. United Nations. Global Sustainable Development Report; United Nations: Geneva, Switzerland, 2016. [Google Scholar]
  2. Fay, M.; Toman, M.; Benitez, D.; Csordas, S.; Kodera, K.; Kwon, H.; Mountford, H. Infrastructure and Sustainable Development. In Postcrisis Growth and Development; World Bank Publications: Washington, DC, USA, 2010; pp. 329–382. [Google Scholar]
  3. Chan, C.; Forwood, D.; Roper, H.; Sayers, C. Public Infrastructure Financing—An International Perspective; Productivity Commission: Melbourne, Australia, 2009.
  4. Glomm, G.; Ravikumar, B. Public investment in infrastructure in a simple growth model. J. Econ. Dyn. Control. 1994, 18, 1173–1187. [Google Scholar] [CrossRef]
  5. Kern, S. Sovereign wealth funds—State investments on the rise. Dtsch. Bank Res. 2007, 10, 1–20. [Google Scholar]
  6. Moss, T.J.; Pettersson, G.; van de Walle, N. An Aid-Institutions Paradox? A Review Essay on Aid Dependency and State Building in Sub-Saharan Africa. SSRN Electron. J. 2006, 74, 1–28. [Google Scholar] [CrossRef]
  7. Pedersen, K.R. Aid, Investment and Incentives. Scand. J. Econ. 1996, 98, 423–437. [Google Scholar] [CrossRef]
  8. UNCTAD. World Investment Report 2016—Investor Nationality: Policy Challenges; UNCTAD: Geneva, Switzerland, 2016. [Google Scholar]
  9. Yildiz, Ö. Financing renewable energy infrastructures via financial citizen participation—The case of Germany. Renew. Energy 2014, 68, 677–685. [Google Scholar] [CrossRef]
  10. Weber, B.; Staub-Bisang, M.; Alfen, H.W. Infrastructure as an Asset Class: Investment Strategy, Sustainability, Project Finance and PPP, 2nd ed.; Wiley: Hoboken, NJ, USA, 2016. [Google Scholar]
  11. Wagenvoort, R.; de Nicola, C.; Kappeler, A.; Engel, E.; Fischer, R.; Galetovic, A.; Strauss, H.; Schumacher, A. Public and Private Financing of Infrastructure; EIB Papers: Luxembourg, 2010. [Google Scholar]
  12. Fischer, S.; Easterly, W. The Economics of the Government Budget Constraint. World Bank Res. Obs. 1990, 5, 127–142. [Google Scholar] [CrossRef]
  13. Mitchener, K.J.; Weidenmier, M.D. Supersanctions and sovereign debt repayment. J. Int. Money Financ. 2010, 29, 19–36. [Google Scholar] [CrossRef]
  14. Bulow, J.; Rogoff, K. Sovereign Debt: Is to forgive to forget? Am. Econ. Rev. 1989, 79, 43–50. [Google Scholar]
  15. European Communities. Treaty on European Union; European Communities: Brussels, Belgium, 1992. [Google Scholar]
  16. Cecchetti, S.G.; Mohanty, M.S.; Zampolli, F. The real effects of debt. Rev. Financ. Stud. 2011, 22, 25–27. [Google Scholar]
  17. PWC. The Long View: How Will the Global Economic Order Change by 2050? Price Waterhouse Coopers: London, UK, 2017. [Google Scholar]
  18. MGI. Debt and (Not. Much) Deleveraging; McKinsey Global Institute: New York, NY, USA, 2015; pp. 1–136. [Google Scholar]
  19. Tiftik, E.; Mahmood, K.; Gibbs, S.; Tran, H. Global Debt Monitor; The Institute of International Finance: Washington, DC, USA, 2017. [Google Scholar]
  20. Reinhart, C.M.; Rogoff, K.S. This Time Is Different: Eight Centuries of Financial Folly; Princeton University Press: Princeton, NJ, USA, 2009. [Google Scholar]
  21. Calderón, C.; Servén, L. Infrastructure, Growth, and Inequality An Overview; World Bank: Washington, DC, USA, 2014. [Google Scholar]
  22. MGI. Infrastructure Productivity: How to Save $1 Trillion a Year; McKinsey Global Institute: New York, NY, USA, 2013. [Google Scholar]
  23. OECD. Infrastructure to 2030 Volume 2 Mapping Policy for Electricity, Water and Transport; OECD: Paris, France, 2007. [Google Scholar]
  24. EU. Commission Staff Working Paper on the Europe 2020 Project Bond Initiative; EU: Brussels, Belgium, 2011. [Google Scholar]
  25. American Society of Civil Engineers. Failure to Act; American Society of Civil Engineers: Reston, VA, USA, 2016. [Google Scholar]
  26. Brundtland, G.H. Our Common Future: Report of the World Commission on Environment and Development; United Nations: Geneva, Switzerland, 1987. [Google Scholar]
  27. Bowen, W.G.; Davis, R.G.; Kopf, D.H. The Public Debt: A Burden on Future Generations? Am. Econ. Rev. 1960, 50, 701–706. [Google Scholar]
  28. Carson, R. Silent Spring; Houghton Mifflin Harcourt: Boston, MA, USA, 2002. [Google Scholar]
  29. Odum, E.P.; Barrett, G.W. Fundamentals of Ecology; Saunders: Philadelphia, PA, USA, 1971. [Google Scholar]
  30. EPA. U.S. Environmental Protection Agency. Available online: https://archive.epa.gov/epa/aboutepa/epa-history-1970-1985.html (accessed on 25 November 2017).
  31. United Nations. Agenda 21; UN: Rio de Janerio, Brazil, 1992. [Google Scholar]
  32. United Nations. Monterrey Consensus; UN: Geneva, Switzerland, 2003. [Google Scholar]
  33. United Nations. The Future We Want (Resolution Adopted by the General Assembly on 27 July 2012); UN: Geneva, Switzerland, 2012. [Google Scholar]
  34. United Nations. Transforming Our World: The 2030 Agenda for Sustainable Development; UN: Geneva, Switzerland, 2015. [Google Scholar]
  35. Calderón, C.; Servén, L. The Effects of Infrastructure Development on Growth and Income Distribution, No. 270; World Bank Publications: Washington, DC, USA, 2004. [Google Scholar]
  36. Default Research: Infrastructure Default and Recovery Rates, 1983–2016; Moody’s: New York, NY, USA, 2017.
  37. Turok, I. Cities, regions and competitiveness. Reg. Stud. 2004, 38, 1069–1083. [Google Scholar] [CrossRef]
  38. Khadaroo, J.; Seetanah, B. The role of transport infrastructure in international tourism development: A gravity model approach. Tour. Manag. 2008, 29, 831–840. [Google Scholar] [CrossRef]
  39. Sahely, H.R.; Kennedy, C.A.; Adams, B.J. Developing sustainability criteria for urban infrastructure systems. Can. J. Civ. Eng. 2005, 32, 72–85. [Google Scholar] [CrossRef]
  40. Munnell, A.H.; Cook, L.M. How does public infrastructure affect regional economic performance? N. Engl. Econ. Rev. 1990, 1990, 11–33. [Google Scholar]
  41. Martin, P.; Rogers, C.A.; Martina, P.; Rogersc, C.A. Industrial location and public infrastructure. J. Int. Econ. 1995, 39, 335–351. [Google Scholar] [CrossRef]
  42. Blanchard, O.; Chouraqui, J.; Hagemann, R.P.; Sartor, N. The Sustainability of Fiscal Policy: New Answers to an Old Question; National Bureau of Economic Research (NBER): Cambridge, MA, USA, 1990. [Google Scholar]
  43. United Nations. Volume I: World Population Prospects (ST/ESA/SER.A/399); UN: Geneva, Switzerland, 2017. [Google Scholar]
  44. Kharas, H. Whe Unprecedented Expansion of the Global Middle Class An Update. Glob. Econ. Dev. Brook. 2017, 100, 1–2. [Google Scholar]
  45. OECD. OECD Environmental Outlook to 2050: The Consequences of Inaction; OECD: Paris, France, 2012. [Google Scholar]
  46. Woetzel, J.; Garemo, N.; Mischke, J.; Hjerpe, M.; Palter, R. Bridging Global Infrastructure Gaps; McKinsey Global Institute: New York, NY, USA, 2016. [Google Scholar]
  47. Damania, R.; Russ, J.; Wheeler, D.; Barra, A.F. The Road to Growth: Measuring the Tradeoffs between Economic Growth and Ecological Destruction. World Dev. 2018, 101, 351–376. [Google Scholar] [CrossRef]
  48. Korhonen, J.M. Overcoming Scarcities through Innovation: What do Technologists do When Faced with Constraints? Ecol. Econ. 2018, 145, 115–125. [Google Scholar] [CrossRef]
  49. Forzieri, G.; Bianchi, A.; Feyen, L.; Silva, F.B.; Marin, M.; Lavalle, C.; Leblois, A. Increasing impacts of climate extremes on critical infrastructures in Europe. Geophys. Res. 2016, 18, 97–107. [Google Scholar]
  50. OECD. Infrastructure Financing Instruments and Incentives; OECD: Paris, France, 2015; pp. 1–74. [Google Scholar]
  51. OECD. Development Co-Operation Report 2014: Mobilising Resources for Sustainable Development; OECD: Paris, France, 2014. [Google Scholar]
  52. OECD. Infrastructure to 2030: Telecom, Land Transport, Water and Electricity; OECD: Paris, France, 2006. [Google Scholar]
  53. Ammermann, H. Squaring the Circle—Improving European Infrastructure Financing; United Europe and Roland Berger Consultants: Munich, Germany, 2015. [Google Scholar]
  54. Global Infrastucture Hub. Global Infrastructure Outlook; Global Infrastucture Hub: Sydney, Australia, 2017. [Google Scholar]
  55. Suzuki, T.; Miyaki, K.; Pace, J.T. Infrastructure Financing Trends; International Finance Corporation: Washington, DC, USA, 2016. [Google Scholar]
  56. World Economic Forum. Infrastructure Investment Policy Blueprint; WEF: Geneva, Switzerland, 2014. [Google Scholar]
  57. Alesina, A.; Tabellini, G. A Positive Theory of Fiscal Deficits and Government Debt. Rev. Econ. Stud. 1990, 57, 403–414. [Google Scholar] [CrossRef] [Green Version]
  58. Reinhart, C.M.; Rogoff, K.S. The Forgotten History of Domestic Debt; National Bureau of Economic Research (NBER): Cambridge, MA, USA, 2007; pp. 319–350. [Google Scholar]
  59. PWC/GIIA. Global Infrastructure Investment: The Role of Private Capital in the Delivery of Essential Assets and Services; International Finance Corporation: Washington, DC, USA, 2017. [Google Scholar]
  60. Rizzi, J.V. Back to the Future Again: Private Equity after the Crisis. J. Appl. Financ. 2009, 19, 1–13. [Google Scholar]
  61. Diamond, P.A. National debt in a neoclassical growth model. Am. Econ. Rev. 1965, 55, 1126–1150. [Google Scholar]
  62. Reinhart, C.; Trebesch, C. Sovereign Debt Relief and its Aftermath. J. Eur. Assoc. 2015, 14, 215–251. [Google Scholar] [CrossRef]
  63. Hariton, D.P. Distinguishing between equity and debt in the new financial environment. Tax L. Rev. 1993, 49, 499. [Google Scholar]
  64. AMP Capital. Listed Infrastructure—Have Investors Missed the Boat? 2014. Available online: http://www.ampcapital.com/ampcapitalglobal/media/contents/news-and-research/insights/pdf/20140210-insights-listed-infrastructure-have-investors-missed-the-boat.pdf?ext=.pdf (accessed on 28 November 2017).
  65. Linklaters. Set to Revive: Investing in Europe’s Infrastructure; Linklaters: London, UK, 2014. [Google Scholar]
  66. Minea, A.; Villieu, P. Borrowing to finance public investment? the ‘golden rule of public finance’ reconsidered in an endogenous growth setting. Fisc. Stud. 2009, 30, 103–133. [Google Scholar] [CrossRef]
  67. Heinemann, F. Factor Mobility, Government Debt and the Decline in Public Investment; Centre for European Economic Research: Mannheim, Germany, 2002; pp. 2–19. [Google Scholar]
  68. Reinhart, B.C.M.; Rogoff, K.S. Growth in a Time of Debt. Am. Econ. Rev. 2010, 100, 2. [Google Scholar] [CrossRef] [Green Version]
  69. Caner, M.; Grennes, T.J.; Fritzi, F.; Köhler-Geib, N. Finding the Tipping Point—When Sovereign Debt Turns Bad; World Bank: Washington, DC, USA, 2010. [Google Scholar]
  70. Checherita-Westphal, C.; Rother, P. The impact of high government debt on economic growth and its channels: An empirical investigation for the euro area. Eur. Econ. Rev. 2012, 56, 1392–1405. [Google Scholar] [CrossRef]
  71. Panizza, U.; Presbitero, A.F. Public debt and economic growth: Is there a causal effect? J. Macroecon. 2014, 41, 21–41. [Google Scholar] [CrossRef]
  72. Bohn, H. The Behavior of U. S. Public Debt and Deficits. Q. J. Econ. 1998, 113, 949–963. [Google Scholar] [CrossRef]
  73. Fincke, B.; Greiner, A. How to assess debt sustainability? Some theory and empirical evidence for selected Euro area countries. Appl. Econ. 2012, 44, 3717–3724. [Google Scholar] [CrossRef]
  74. Gong, G.; Greiner, A.; Semmler, W. Growth Effects of Fiscal Policy and Debt Sustainability in the EU. Empirica 2001, 28, 3–19. [Google Scholar] [CrossRef]
  75. Greiner, A.; Köllert, U.; Semmler, W. Debt sustainability in the European Monetary Union: Theory and empirical evidence for selected countries. Oxf. Econ. Pap. 2007, 59, 194–218. [Google Scholar] [CrossRef]
  76. Ihori, T.; Doi, T.; Kondo, H. Japanese fiscal reform: Fiscal reconstruction and fiscal policy. Jpn. World Econ. 2001, 13, 351–370. [Google Scholar] [CrossRef]
  77. Broda, C.; Weinstein, D.E. Happy News from the Dismal Science: Reassessing Japanese Fiscal Policy and Sustainability; National Bureau of Economic Research (NBER): Cambridge, MA, USA, 2004. [Google Scholar]
  78. Greiner, A. An endogenous growth model with public capital and sustainable government debt. Jpn. Econ. Rev. 2007, 58, 345–361. [Google Scholar] [CrossRef]
  79. Hoshi, T.; Kashyap, A.; Scharfstein, D. The Choice between Public and Private Debt: An Analysis of Post-Deregulation Corporate Financing in Japan; National Bureau of Economic Research (NBER): Cambridge, MA, USA, 1993. [Google Scholar]
  80. Shirasu, Y.; Xu, P. The choice of financing with public debt versus private debt: New evidence from Japan after critical binding regulations were removed. Jpn. World Econ. 2007, 19, 393–424. [Google Scholar] [CrossRef]
  81. Fincke, B.; Greiner, A. Do large industrialized economies pursue sustainable debt policies? A comparative study for Japan, Germany and the United States. Jpn. World Econ. 2011, 23, 202–213. [Google Scholar] [CrossRef]
  82. Tu, L.; Padovani, E. A research on the debt sustainability of china’s major city governments in post-land finance era. Sustainability 2018, 10, 1606. [Google Scholar] [CrossRef]
  83. Panizza, U. Domestic and External Public Debt in Developing Countries; UN: Geneva, Switzerland, 2008. [Google Scholar]
  84. Reinhart, C.M.; Rogoff, K.S. Financial and Sovereign Debt Crises: Some Lessons Learned and Those Forgotten; IMF: Washington, DC, USA, 2013. [Google Scholar]
  85. Reinhart, K.; Ramkishen, S.R.; Glass, A.; Davis, L. Fear of floating. Q. J. Econ. 2002, 117, 379–408. [Google Scholar] [CrossRef]
  86. REN 21. Renewables 2017 Global Status Report; REN 21: Paris, France, 2017. [Google Scholar]
  87. International Monetary Fund. Fad Investment and Capital Stock Database 2017: Estimating Public, Private, and PPP Capital Stocks This; IMF: Washington, DC, USA, 2017. [Google Scholar]
  88. International Monetary Fund. Estimating the Stock of Public Capital in 170 Countries; IMF: Washington, DC, USA, 2017. [Google Scholar]
  89. World Bank. Quarterly External Debt Statistics (QEDS). 2017. Available online: https://data.worldbank.org/data-catalog/quarterly-external-debt-statistics-ssds. (accessed on 10 October 2017).
  90. International Monetary Fund. World Economic Outlook Database. 2017. Available online: https://www.imf.org/external/pubs/ft/weo/2017/01/weodata/index.aspx. (accessed on 10 October 2017).
  91. Dickey, D.A.; Fuller, W.A. Likelihood Ratio Statistics for Autoregressive Time Series with a Unit Root. Econometrica 1981, 49, 1057–1072. [Google Scholar] [CrossRef]
  92. Zivot, E.; Andrews, D.W.K. Further Evidence on the Great Crash, the Oil Price Shock, and the Unit Root Hypothesis. J. Bus. Econ. Stat. 1992, 10, 251–270. [Google Scholar]
  93. Granger, C.W.J. Investigating Causal Relations by Econometric Models and Cross-spectral Methods. Econometrica 1969, 37, 424–438. [Google Scholar] [CrossRef]
  94. Toda, H.Y.; Yamamoto, T. Statistical inference in vector autoregressions with possibly integrated processes. J. Econ. 1995, 66, 225–250. [Google Scholar] [CrossRef]
  95. Engle, R.F.; Granger, C.W.J. Co-Integration and Error Correction: Representation, Estimation, and Testing. Econometrica 1987, 55, 251–276. [Google Scholar] [CrossRef]
  96. Johansen, S. Testing weak exogeneity and the order of cointegration in UK money demand data. J. Policy Model. 1992, 14, 313–334. [Google Scholar] [CrossRef]
  97. Enders, W. Applied Econometric Time Series, 4th ed.; Wiley: Hoboken, NJ, USA, 2014. [Google Scholar]
  98. Toda, H.Y.; Phillips, P.C.B. Vector autoregressions and causality: A theoretical overview and simulation study. Econ. Rev. 1994, 13, 37–41. [Google Scholar] [CrossRef]
  99. Johansen, S.; Juselius, K. Maximum Likelihood Estimation and Inference on Cointegration—With Applications to the Demand for Money. Oxf. Bull. Econ. Stat. 1990, 52, 169–210. [Google Scholar] [CrossRef]
  100. Akaike, H. A New Look at the Statistical Model Identification. IEEE Trans. Automat. Contr. 1974, 19, 716–723. [Google Scholar] [CrossRef]
  101. Kim, E.; Ha, Y.; Kim, S. Public Debt, Corruption and Sustainable Economic Growth. Sustainability 2017, 9, 433. [Google Scholar] [CrossRef]
  102. International Monetary Fund. Developing Government Bond. Markets: A Handbook; IMF: Washington, DC, USA, 2001. [Google Scholar]
  103. Agénor, P.; Moreno-Dodson, B. Public Infrastructure and Growth: New Channels and Policy Implications; World Bank: Washington, DC, USA, 2006. [Google Scholar]
  104. Berg, A.; Portillo, R.; Buffie, E.F.; Pattillo, C.A.; Zanna, L.-F. Public Investment, Growth, and Debt Sustainability: Putting Together the Pieces; IMF: Washington, DC, USA, 2012. [Google Scholar]
  105. United Nations Environment Programme. Annual Report 2015; UNEP: Geneva, Switzerland, 2016. [Google Scholar]
  106. Abbas, S.M.A.; Christensen, J.E. The Role of Domestic Debt Markets in Economic Growth: An Empirical Investigation for Low-Income Countries and Emerging Markets; IMF: Washington, DC, USA, 2010. [Google Scholar]
  107. Organisation for Economic Co-Operation and Development. Blended Finance Vol. 1: A Primer for Development Finance and Philanthropic Funders An Overview of the Strategic Use of Development Finance and Philanthropic Funds to Mobilize Private Capital for Development; OECD: Paris, France, 2015. [Google Scholar]
Figure 1. Sustainable Development Goals (SDGs) directly related to public infrastructure.
Sustainability 10 03901 g001
Figure 2. Debt-to-GDP ratios of the top 20 countries in 2017 ordered by GDP and two thresholds for debt sustainability, 60% and 85%. The green, orange and red columns represent respectively sustainable, quasi-sustainable and unsustainable debt zones.
Sustainability 10 03901 g002
Figure 3. Sustainable debt thresholds for gross government debt-to-GDP.
Sustainability 10 03901 g003
Figure 4. Framework for testing causality.
Sustainability 10 03901 g004
Table 1. ADF unit root tests (with SC criteria).
LevelFirst DifferenceSecond Difference
Test ValueTest ValueTest Value
China
Public investment−0.9904(3)−7.4292(2) ***−6.0432(4) ***
External public d.−2.3867(3)−4.2700(1) **−8.4869(1) ***
Domestic public d.−0.5915(1)−5.0591(1) ***−8.6524(1) ***
Germany
Public investment−2.4393(1)−6.0077(3) ***−6.6063(3) ***
External public d.−0.8817(3)−3.5374(2) *−4.3529(2) ***
Domestic public d.0.6708(3)−4.0497(1) **−1.8462(2)
The United States
Public investment−2.3269(3)−3.8656(2) **−5.8578(1) ***
External public d.−1.6351(4)−5.6789(3) ***−3.0068(3) **
Domestic public d.−2.0224(1)−3.7465(1) **−5.8283(1) ***
Japan
Public investment−1.1309(2)−3.8626(1) **−6.9769(1) ***
External public d.−0.8817(1)−3.5374(2) *−4.3529(2) ***
Domestic public d.−4.5353(3) ***−4.6473(4) ***−2.8852(1)
Notes: 1. *, ** and *** indicate significance level at the 10%, 5% and 1%, respectively; 2. The numbers in parentheses are the lag orders which are selected based on the SIC; 3. The cells of stronger stationary position are colored.
Table 2. ZA (1992) unit root tests (with SC criteria).
LevelFirst DifferenceSecond Difference
Test ValueBreak (Year)Test ValueBreak (Year)Test ValueBreak (Year)
China
Public investment−2.6895(3)1983−9.2542(2) ***2007−7.5548(4) ***1967
External public d.−3.0694(3)1992−4.2371(2)1999−9.5815(1) ***2009
Domestic public d.−2.5909(1)2004−10.551(1) ***2005−8.8986(1) ***2004
Germany
Public investment−4.1358(1) *2011−6.6330(3) ***2008−7.2544(3) ***1966
External public d.−2.5177(3)2012−5.7735(2) ***2008−8.0384(2) ***2009
Domestic public d.−4.6097(1)2014−5.3308(1) ***2008−3.3025(2)2012
The United States
Public investment−3.4527(3)1979−4.3296(2)1965−6.6625(3) ***1969
External public d.−4.8631(4) *2009−5.8205(3) ***2010−3.6977(3)2007
Domestic public d.−3.3242(1)2006−5.2408(1) **2006−9.0244(3) ***2007
Japan
Public investment−2.6868(2)1974−4.3277(1)1995−6.1771(3) ***1983
External public d.−4.6290(3)2010−5.7735(2) ***2008−8.0384(2) ***2009
Domestic public d.−6.9301(3) ***2012−11.119(4) ***2007−3.9054(1)2005
Notes: 1. *, ** and *** indicate significance level at the 10%, 5% and 1%, respectively; 2. The numbers in parentheses are the lag orders which are selected based on the SIC; 3. The cells of stronger stationary position are colored.
Table 3. Confirmatory analysis of integration orders.
First AppearanceStrong Stationary
ADFZAResultADFZAResult
China
PII(1)I(1)I(1)I(1)I(1)I(1)
EDI(1)I(2)XI(2)I(2)I(2)
DDI(1)I(1)I(1)I(2)I(1)X
Germany
PII(1)I(0)XI(2)I(2)I(2)
EDI(1)I(1)I(1)I(2)I(2)I(2)
DDI(1)I(1)I(1)I(1)I(1)I(1)
United S.
PII(1)I(2)XI(2)I(2)I(2)
EDI(1)I(0)XI(1)I(1)I(1)
DDI(1)I(1)I(1)I(2)I(2)I(2)
Japan
PII(1)I(2)XI(2)I(2)I(2)
EDI(1)I(1)I(1)I(2)I(2)I(2)
DDI(0)I(0)I(0)I(1)I(1)I(1)
Notes: 1. PI, ED, and DD stand for public investment, external public debt, and domestic public debt, respectively; 2. The X represents inconclusive results; 3. I(0), I(1), and I(2) corresponds the integration orders in level, 1st difference, and 2nd difference, respectively.
Table 4. Co-integration test results.
Maximal Eigenvalue TestTrace Test
r = 0r = 1r = 0r = 1
External Public D.China11.30233.040314.34253.0403
Germany18.4107 *9.274727.6854 **9.2748
The United States58.8384 ***18.0798 ***76.9182 ***18.0798 ***
Japan67.3582 ***25.4211 ***92.7793 ***25.4211 ***
Domestic Public D.China56.7342 ***9.287866.0220 ***9.2878
Germany49.9115 ***11.776 *61.6873 ***11.7758 *
The United States48.4706 ***14.3789 **62.8495 ***14.3789 **
Japan51.1412 ***22.2432 ***73.3844 ***22.2432 ***
Notes: 1. *, ** and *** indicate significance level at the 10%, 5% and 1%, respectively; 2. The lag orders are selected based on the SIC.
Table 5. Results for TY Granger causality test (with SC criteria).
PerioddmaxkNull hypothesisChi2p-Value
China1981–201524PI ≠> ED0.465300.976789
24ED ≠> PI0.911970.922836
1995–201514PI ≠> DD13.5981 ***0.008694
14DD ≠> PI0.820090.935734
Germany2000–201523PI ≠> ED2.599620.457556
23ED ≠> PI7.09099 *0.069053
2000–201524PI ≠> DD16.7617 ***0.002150
24DD ≠> PI33.3380 ***0.000001
US2000–201524PI ≠> ED7.378710.117178
24ED ≠> PI80.4153 ***1.11E-16
2000–201524PI ≠> DD12.1089 **0.016559
24DD ≠> PI34.8940 ***4.88E-07
Japan2000–201524PI ≠> ED21.9875 ***0.000202
24ED ≠> PI14.8829 ***0.004950
2000–201523PI ≠> DD1.852430.603592
23DD ≠> PI9.62984 **0.021989
Notes: 1. PI, ED, and DD stand for public investment, external public debt, and domestic public debt, respectively; 2. The augmented lag order k equals dmax + p. Except for PI ≠> DD and DD ≠> PI for China, the lag parameters p are selected based on SIC. The study employed Akaike information criterion for related dataset, namely PI ≠> DD and DD ≠> PI [100]; 3. *, ** and *** indicate significance level at 10%, 5% and 1%, respectively; 4. The null hypothesis X ≠> Y means variable X does not Granger cause variable Y; 5. The condition d m a x p must be satisfied only for external public debt of China due to the cointegration results; 6. The maximum integration numbers ( d m a x ) are taken from a stronger stationary state in the confirmatory analysis.

