Abstract
Drought flow as the minimum flow rate required for restoration of the Mokgamcheon stream was calculated by the Storm Water Management Model (SWMM) V.5.0. The adequacy of drought flow to guarantee the minimum ecological environment was assessed using suitable low-flows not exceeding the maximum pollution concentration of the ecosystem calculated by Design FLOWs (DFLOW) V.4.1. Fish flows, which provide proper ecological habitat for fish, were calculated using Physical HABitat SIMulation (PHABSIM) V.1.5.2 to provide proper ecological habitat for target fishes such as Carassius auratus and Zacco platypus. The monthly expected instream flows were determined as the largest value between drought flow and fish flow. In most cases, instream flows were determined by drought flows exceeding fish flows that satisfy the condition of species habitat, but in the case of Carassius auratus, drought flows were less than fish flows in April, September, and October. Thus, structural measures for the supply of additional discharge were required. Instead, when natural environment-friendly instream structures, such as stepping stones were used, affordable ecological restoration that met the preferred conditions for discharge and depth of Carassius auratus was possible. The stepping stones were assessed using River2D V.0.95a to measure their effectiveness compared to other structural measures that would be costly and time-consuming to secure shortage of fish flow. Finally, the stability of the habitat was assessed through flood analysis; in case of a flood discharge of 5.2 m3/s obtained from time-series analysis, it was evaluated that the stability of habitats could be reasonable.
Keywords:
drought flow; Carassius auratus; Zacco platypus; fish flow; instream flow; stepping stones 1. Introduction
River management projects all over the world, such as channel modifications and channel adjustments, typically focus on only hydraulic engineering practices that are designed to supply water and prevent flooding. In general, a lack of concern for conservation of the ecosystem and preservation of pristine water systems has resulted in these projects changing the physical habitat of rivers [1,2,3,4] and environmental conditions, which has adversely affected water quality [2,3,5] and thereby hampered the ecosystem and the quality of aquatic habitat. Accordingly, stream restoration attempts and related endeavors in the last two decades have focused on two related aspects: (1) rehabilitation of the ecological condition of urban streams that have been affected by ecological degradation and (2) preservation of integrity of the ecosystem and the environmental system. However, there is increasing concern about river restoration technologies that combine hydraulics and ecological engineering because such projects find it difficult to meet the planned ecological goals as they are biased by hydraulic or environmental restoration [6,7].
The restoration of the ecosystem involves complex approaches that combine field survey, analysis, planning, construction, and maintenance of the instream habitat with its requirements of selected target species [8], such as total fish abundance, species richness, diversity, and equitability, which are crucial for habitat reach [9]. Such a process is only possible if the minimum amount of flow rate is first obtained from the ecological stream restoration project [10]. In order to determine the minimum flow rate that can sustain a stream, the amount of runoff from the watershed must be measured or estimated accurately. However, for most small- and medium-sized streams, the amount of runoff is conducted through rainfall runoff analysis because there are not enough observational data [11]. The minimum flow rate of stream is defined as the drought flow of stream that would be estimated using runoff data. According to various goals of stream restoration, the minimum flow rate for maintaining stream and the required flow rate (ecological flow) are both necessary. Generally, ecological flows can include multiple purposes, such as the abundance and variety of aquatic ecosystems, the assurance of water quality, the provision of scenery, ship navigation, water recreation activities, the maintenance of underground water level, and fishing [12,13]. When river restoration is performed, ecological flow chosen for the main purpose, as well as drought flow, are secured and designed according to the restoration goal. In the past decades, there have been considerations and attempts for the restoration of rivers in these different areas. Despite all these diverse river restoration purposes, various measures have been established for stream restoration by giving priority to the restoration of aquatic organisms, securing sufficient flow rates, and improvement of water quality [13].
Generally, the method of water quality analysis requires a very complex task that involves input of many meteorological and water quality factors; however, it is difficult to predict the results of an accurate water quality model [13]. In the United States, a minimum amount of water to preserve the aquatic ecosystem has been sought based on extensive ecosystem observations without conducting additional water quality analysis. Accordingly, the minimum flow rate considering the water ecology conditions has been proposed as the low-flow [14,15]. During a low-flow event, related aquatic criteria, such as water quality and quantity, become more important because aquatic organisms can only tolerate certain concentrations of pollutants for short periods. The US water quality criteria for aquatic life are derived on the basis of the best ecological, biological, and toxicological information available regarding the effects of contaminants on aquatic organisms [14,15]. However, there is no standard for aquatic life—except that concerning human health—in Korea [16].
If sufficient flow rate has been secured in the stream, an evaluation of the adequacy of the ecological habitat site in terms of aquatic ecosystem is required for the dominant or target species of the stream [11]. The evaluation of ecological flow, such as fish flow, is essential for the analysis of fish habitats for target species during restoration [11,17,18,19,20,21,22]. In case of an one-dimensional ecological habitat model, the ecological habitat area is approximated when it is not appropriate to evaluate the spatial distribution of ecological habitats needed for detailed river restoration. Because of the limitations of the one-dimensional model, a two-dimensional model that is able to predict the distribution of the ecological habitat for target species and assess the suitability of ecosystem conditions is needed [23,24].
This restoration of the stream in terms of water quality and water ecology is possible when sufficient flow is ensured. However, in the case of urban streams, water shortages have occurred due to climate change and changes of water usage patterns, and the depletion of stream flow in urban streams have not only resulted in water shortages but often adversely affected the aquatic environment and water quality as well [11]. Accordingly, various countermeasures using water resource management have been studied over the past decades. This includes the Integrated Watershed Management (IWM) or the Integrated Water Resources Management (IWRM) approach, which has been studied as a representative method of water security. Although previous studies have suggested the use of integrated watershed planning and management as a reasonable decision-making process for the sustainable development of watersheds [11,13], the actual cost analysis of structural measures was not specific and the actual policy implementation required enormous cost and duration. The application of IWM has been evaluated as a useful measure of urban streams for large-scale watersheds. However, for streams in small- and medium-sized basins, a method to replace IWM is needed as relatively simple, environmental friendly and inexpensive methods are required in these situations rather than methods that entail huge budgets and long periods of construction. Thus, some small- and medium-sized basins with limited water supply capabilities need different measures of restoration.
The use of instream structures for channel stabilization has become increasingly popular due to their potential cost effectiveness as well as ecological benefits. When properly designed and maintained, these structures help to protect channels from erosion and lateral migration and may also provide grade control [25]. In addition, instream structures may improve the habitats of fish and macroinvertebrate by increasing the hyporheic exchange [26,27]. By stabilizing a stream for various flow events, instream structures may also engender greater ecological benefits [26]. The protection of infrastructures from erosive conditions, as well as the improvement of refuge and spawning grounds needed to enhance species diversity and biomass, is possible by enhancing the flow diversity that is typically encountered in meandering streams and pool-riffle arrangements within natural streams [27,28]. Spurs and rock weirs, which are intended for prevention of stream bank erosion, have also created new and stable habitats for fishes and other organisms [27,28,29,30]. Above all, the construction of stepping stones as a design planning element aimed at enhancement of the habitat quality has been chosen as one of the simpler instream structures that increase macroinvertebrates’ biodiversity and the habitat of fishes [9,23].
This study suggests the application and evaluation of the stream restoration design approach on a target fish species. It is an effective and economical approach to improve aquatic ecosystem on the basis of hydrodynamic characteristics and to rehabilitate the ecosystem based on environmental criteria, such as the Criterion Continuous Concentration (CCC) and the Criterion Maximum Concentration (CMC) without direct calculation of water quality [14,15]. The alternatives of urban watershed management, such as large-scale construction projects (e.g., the installation of interceptor, the construction of local wastewater treatment plant and combined sewer separation, etc.), should be considered and is needed to rehabilitate and secure water as most of the urbanized watersheds lead to stream flow depletion. This is contrary to the previous direct application of watershed management [10,11,13].
Our proposed approach for ecological restoration will employ a more cost-effective restoration technique to rehabilitate the distorted hydrologic cycle in a target stream. The stepping stone structure is a representative method that can improve fish habitats very effectively without leading to any increase in the stream flow in view of hydraulic engineering. Therefore, this study aims to create effective habitats for the target species in a less expensive way based on stream ecosystem simulations in order to improve the assurance of water quality and the abundance of aquatic ecosystems without considering additional water quality simulation and structural measures for securing water quantity.
2. Methodology
The approach illustrated in Figure 1 consists of four steps: (1) Calculating the drought flow by the flow-duration curve using the results of a surface runoff simulation. (2) Computing the low-flow with a hydrologically and biologically based design flow method using Design FLOWs (DFLOW) Version 4.1 (US Environmental Protection Agency, Washington, DC, USA) [15] and assessing the adequacy of drought flow by comparing the low-flow (if the water shortage is very great, the structural measures of IWM should be considered selectively). (3) Determining the fish flow to herald the ecological stream restoration and obtaining the instream flow by finding the maximum flow through evaluation of the fish flow and the drought flow. (4) Suggesting an instream structure to improve fish habitats under the condition of an aquatic ecosystem where the difference (i.e., the flow rate shortage of instream flow) between fish flow and drought flow is lacking.
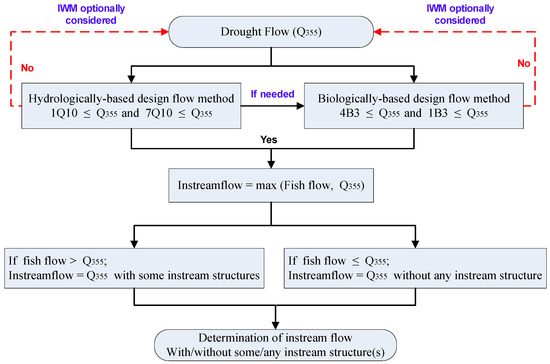
Figure 1.
Flow chart to form and determine the aquatic habitats: is drought flow; 1Q10 is the lowest 1-day average flow in a 10-year return period; 7Q10 is the lowest 7-day average flow in a 10-year return period; 4B3 is a biologically based 4-day average flow that occurs once every three years; 1B3 is a biologically 1-h average flow that occurs once every three years and used to protect aquatic life from acute effects.
2.1. Drought Flow
Drought flow is the minimum flow required to keep the function of streams in Korea. It is defined as the mean value of annual daily flows that are exceeded by 355 days of a year, signified as (i.e., 355th daily flow in the flow-duration curve) or as the annual average daily flow with 97% of flow-duration curve. The standard drought flow is an annual daily flow with a 10-year recurrent interval. However, the drought flow has to be estimated using surface runoff simulation because the historical flow records are not sufficiently long; there is no exception in most watersheds in Korea in this regard [11,13]. Therefore, in this case, the surface runoff is computed by the Storm Water Management Model (SWMM) Version 5.0 (US Environmental Protection Agency, Cincinnati, OH, USA) [31], which is capable of both single-event and continuous simulations of runoff quantity to supply the flow hydrograph.
2.2. Low-Flow
Low-flows can be estimated using hydrologically and biologically based design flow methods [14,15]. A hydrologically based design flow using statistical method is estimated based on selecting and identifying the extreme values (using Log-Pearson Type III flow estimating technique) such as the 1Q10 (i.e., the lowest 1-day average flow in a 10-year return period) and the 7Q10 (i.e., the lowest 7-day average flow in a 10-year return period). On the other hand, biologically based design flow is based on frequencies and durations specified in water quality criteria for each pollutant and whole effluents. Thus, they are based on the available ecological, toxicological, and biological information concerning the stresses that aquatic ecosystems and organisms can tolerate. This method directly uses site-specific durations and frequencies specified in the aquatic life criteria, such as 4 days and 3 years for CCC and 1 day and 3 years for CMC. According to CCC, the lower concentration for 4B3 should not exceed more than once every year but 4B3 can be as long as 30 days if it is used to protect aquatic life from chronic effects. According to CMC, the higher concentration for 1B3 should not exceed more than once every three years if it is used to protect aquatic life from acute effects. For toxic waste load allocation studies, US EPA recommends the use of 1Q10 and 1B3 as the design flows for CMC and the 7Q10 and 4B3 as the design flows for CCC.
DFLOW using the criteria is a very useful way of estimating not only the low-flow () but also the aquatic life criteria using either a hydrologically or biologically based design flow method including the water quality standards. However, in Korea, the average or standard drought flow is used instead of the low-flow. Thus, the relationship between the low-flow and the drought flow needs to be identified by comparing the flow rate to apply to Korea’s streams.
2.3. Fish Flow and Instream Flow
Although Physical HABitat SIMulation (PHABSIM) Version 1.5.2 (US Department of the Interior Fish and Wildlife Service Research and Development, Washington, DC, USA) [22] has a few limitations regarding the determination of population size of aquatic species, it is a very useful tool to estimate the fish flow, which provides a suitable habitat environment for fish [17]. Habitat simulation transforms information regarding channel structure, modeled water surface levels, and velocities into an index containing the quantity of the available habitat using the Habitat Suitability Criteria (HSC). This index is referred to as the Weighted Usable Area (WUA), which is the arithmetic sum of the available habitat in each cell for a given discharge and target species [22].
The instream flow is defined as the minimum flow rate required in a stream to preserve its function. As the ecological habitat of fish is a very important element of ecological restoration, we chose fish flow as an ecological flow. Therefore, the instream flow was determined as the maximum value between drought flow and fish flow depending on seasonal variation at a particular reach of stream. The evaluation of instream flow is given in Equation (1):
where is the instream flow, is the fish flow, and is the drought flow.
2.4. Instream Structures
In this study, stepping stones were the simplest instream structures applied to enhance fish habitats using River2D V.0.95a (University of Alberta, Edmonton, AB, Canada) [24]. Thus, River2D was implemented to evaluate its habitats for the target species and calculate the critical tractive force to check stability analysis for the material size of the instream structures (i.e., stepping stones, pool-riffle, cross vane, etc.). River2D is a hydrodynamic habitat model containing two-dimensional, depth-averaged de Saint-Venant equations in a conservative form, and it consists of three components: R2D_Bed, R2D_Mesh, and River2D. To implement a detailed restoration design, River2D comprises a more effective method that computes the calculated WUA as the product of a Composite Suitability Index (CSI). Within this model, the habitat Suitability of Use Index (SI) curves for each fish species, the life stage of interest, and the channel index defined over the entire computational mesh are used to evaluate the WUA for one species/life cycle at a specified flow.
2.5. Numerical Modeling
Figure 2 shows a flow chart of the numerical model input and the output data to determine the ecological stream restoration planning with respect to not only the hydrologic aspect but also the ecological one. The drought flow () is computed by evaluating the hydrologic data (i.e., the analysis of flow-duration curve) that are input into the SWMM; it is a mathematical model for simulation of urban runoff quantity and quality in natural stream and storm and combined sewer system. DFLOW determines the low-flow () that satisfies the aquatic life criteria (i.e., CCC and CMC). The calculated flow rate in SWMM is used as the input boundary condition of the Hydrologic Engineering Center River Analysis System (HEC-RAS) Version 4.1.0 (US Army Corps of Engineers, Hydrologic Engineering Center, Davis, CA, USA) [32] to calculate the boundary condition of water surface elevation at the desired location. The water surface elevation calculated by HEC-RAS can be entered as input as a downstream boundary condition for PHABSIM. The upstream boundary condition of PHABSIM is also entered for the calculated flow rate from SWMM. Furthermore, the HEC-RAS can estimate the bed condition, such as fixed or movable bed, for sediment transport using the simulation result of long-term bed change. The PHABSIM computes the fish flow () using the HSC for dominant fishes. If drought flow is equal to or greater than low-flow, we can determine the larger value as instream flow () by comparing drought flow and fish flow. However, if the drought flow is less than the low-flow, an amount that exceeds the drought flow must be secured using structural measures of the IWM. Finally, the boundary condition of River2D is also entered using the output of HEC-RAS in the same way as PHABSIM. When the drought flow is less than instream flow, in the hydraulic respect, the shortage of instream flow can be compensated by installing instream structures evaluated by the River2D without any increase in instream flow at the site where instream flow is insufficient.
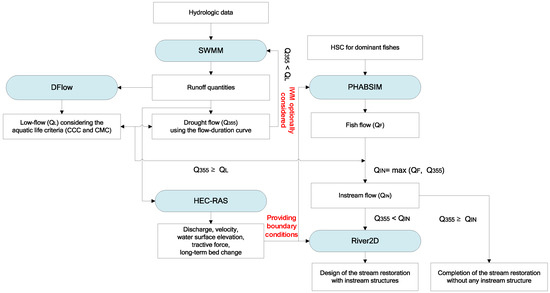
Figure 2.
Flow chart of the numerical model input and output data.
3. Study Area
The Mokgamcheon stream in the typical urbanized Anyangcheon watershed was selected (Figure 3) as the study area. This stream is a second-order tributary of the Han River in Korea. The watershed area of the Mokgamcheon stream is 56 km2, and the total length of the stream is 13.5 km. Historically, the Mokgamcheon stream was channelized with its sinuosity demolished as a result of flow modifications because of the urbanization of the Mokgamcheon watershed. The primary land cover types in year 2000 were 18.5% agricultural land, 35.5% forest, and 31% urban area. The average annual precipitation from 2000 to 2004 was 1468 mm, with 74% of the precipitation falling during the monsoon season of June to September. Table 1 gives a summary of the channel characteristics [33]. The channelized reach of average width 50 m has an average slope of 0.00116 m/m on the downstream reach of the Mokgamcheon watershed. There are four subwatersheds (Oryucheon, Yeokgokcheon, Gaesucheon, and Gahakchoen) in the Mokgamcheon watershed. As shown in Figure 3a, the term station is applied to any point whose position is given by its total distance from the confluence of the Anyangcheon stream and the Mokgamcheon stream (outlet of the Mokgamcheon stream). In general, total sediment discharge for engineering purpose directly relates to the total rate of transport to hydraulic variables, such as depth, velocity, and slope, and to sediment properties. When the riverbed variation was compared on the basis of observations [1,33], the four-year riverbed variation was found to be very small. The thalweg elevation was slightly changing within 0.1 m [33] because the channel slope was mild and the soil materials of channel were composed of granular materials, such as gravel and sand. The site has no bed vegetation, although short grass or concrete blocks are present on the riverbanks, as shown in Figure 4a,b. We considered sediment transport condition was on the dynamic equilibrium, and the site could be considered fixed-bed channel and bank. Figure 4c,d show examples of stepping stone structures in Korea.
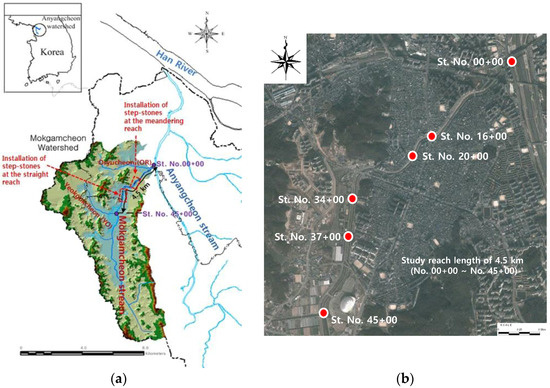
Figure 3.
Map of the Mokgamcheon watershed in Korea: (a) Mokgamcheon watershed; (b) base map of the study area (station No. 00+00–No. 45+00). For instance, station No. 45+00 is at a point 4500 m from the outlet of the Mokgamcheon stream, and station No. 00+00 is at the outlet of the Mokgamcheon stream.

Table 1.
Summary of site characteristics.
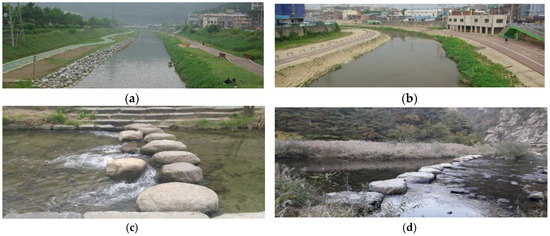
Figure 4.
View of channels, riverbanks, and floodplains on the Mokgamcheon watershed: (a) station No. 37+00; (b) station No. 13+00. View of stepping stone structures in Korea: (c) the Cheonggyecheon stream; (d) the Neunggang stream.
The selected study reach was 4.5 km long from the confluence of the Anyangcheon stream to that of the Yeokgokcheon stream. The ecological restoration design was conducted along a 4.5 km reach (Station No. 00+00–No. 45+00) of the Mokgamcheon stream, as shown in Figure 3b.
The dominant species in the Mokgamcheon stream, as identified by Lee [10] and Saman and Hankuk Engineering Consultants [4], are Carassius auratus, Phynchocypris oxycepthalus, and Zacco platypus. The population of Zacco platypus has continuously decreased within the target stream for the past 20 years. This is an integral dominant species that can be targeted to improve the ecological conditions of the Mokgamcheon stream; Carassius auratus and Phynchocypris oxycepthalus remain the dominant species under the present conditions. The ecological criteria from earlier studies were provided by the Korea Institute of Construction Technology [34] and Kim [35]. Thus, in this study, two dominant species—Carassius auratus and Zacco platypus—were selected as the target species to use for ecological stream restoration. The maximum WUA was obtained by PHABSIM using HSC of each target fish, as shown in Figure 2.
3.1. Variables of Hydraulic Dynamics
For explaining the hydraulic properties, the physical quantities that best describe the hydraulic characteristics are Froude number and shear stress (or shear velocity). The Froude number () is defined as the ratio of inertial to gravity forces in open channel flow, as shown in Equation (2). If the flow is classified as the Froude number, it is called subcritical flow if is less than 1, critical flow if is equal to 1, or supercritical flow if is greater than 1.
where is the mean velocity, is a length scale related to depth, and is gravitational acceleration. The shear velocity () is defined in Equation (3):
where is the shear stress on the wall, and is the density of fluid. The shear velocity is the hypothetical physical quantity expressed in terms of the shear stress as the components of force that flow over the wall resist the viscosity.
3.2. Determination of Drought Flow and Low-Flow
In this study, the calibrated SWMM simulation was used to calculate the results of the long-term run-off using the daily stream flow data (1964–2010). The simulation flow results were valid as long as the drought flow () and low-flow () could be successfully estimated. The SWMM needs sensitivity analysis to identify the parameters to be used in the calibration step. Therefore, the sensitivity analyses of watershed, channel roughness values, depression storage, and infiltration parameters were conducted and evaluated to determine the effect of the total volume of runoff as well as the peak flow. IMPN (impervious area Manning’s roughness), PERVN (pervious area Manning’s roughness), ROUGH (Manning’s roughness of conduit), IDS (impervious area depression storage), PDS (pervious area depression storage), SUCT (average capillary suction), HYDCON (saturated hydraulic conductivity), and SMDMAX (initial moisture deficit for soil) were selected as hydrologic parameters. The SWMM was calibrated manually using the model efficiency from Equations (4)–(6) [36].
where is the order of the days, is the number of values, is the initial variation in the observed values, is the index of disagreement between the observed and the simulated values, is the average of the observed values for all th days, is the observed value for the th day, and is simulated value for the th day. The model becomes more efficient as approaches 1. Table 2 showed the results of the calibration and verification of flow rate. The calibration period was 31 January 2007 to 1 September 2007, and the verification period was 9 June 2006 to 22 December 2006.
Table 2.
Calibration and verification results of Storm Water Management Model (SWMM).
Thus, the calibrated values of SWMM parameters were as follows: IMPN was 0.014, PERVN was 0.33, ROUGH was 0.03, IDS was 0.13, PDS was 0.5, SUCT was 100, HYDCON was 0.1, and SMDMAX was 0.32. Using the results of the calibrated SWMM simulation, the average drought flow and the standard drought flow, with a 10-year frequency, were determined without any consideration of the watershed management alternatives, such as the installation of interceptor, the construction of local wastewater treatment plan, or the combined sewer separation.
DFLOW was used to estimate the low-flow, as shown in Figure 1 and Figure 2. DFLOW uses the following formula (Equations (7)–(9)):
where is the mean of logarithms of annual low-flows, is the standard deviation, and is the gamma deviate corresponding to the standard normal deviate and skewness coefficient of the natural logarithms of the non-zero entries in . In addition, calculates total allowed excursions over flow record using the number of years in record divided by . The long-term results by the SWMM as the input data of DFLOW were used to compute the low-flow. In the next step, the respective low-flows, estimated by two methods, were compared with the drought flow, as shown in Figure 1.
3.3. Determination of Target Aquatic Species and Fish Flow
The parameters of PHABSIM include average water column velocities, water surface elevations, riverbed elevations, cell cover categories, and site discharges. The HEC-RAS model uses the step-backwater approach to compute water-surface elevation and hydraulic parameters, such as velocity, depth, and shear stress based on the cross-sectional geometry of channel. PHABSIM was calibrated and verified using measured time series data, such as water surface elevation from the Neobu bridge provided on the Water Resources Management Information System (WAMIS) [37], Korea, website. The important parameter for both HEC-RAS and PHABSIM is the Manning’s roughness. The calibrated Manning’s was chosen between 0.032 and 0.041. The PHABSIM and HEC-RAS models were calibrated and verified under the same periods used for the SWMM model, as shown in Table 3.
Table 3.
Calibration and verification results of Physical HABitat SIMulation (PHABSIM) and Hydrologic Engineering Center River Analysis System (HEC-RAS).
3.4. Determination of the Instream Structure to Habitat Enhancement Design
As a representative case study, 300-m-long straight and 400-m-long meandering reaches were selected, as shown in Figure 3b; the former was station No. 37+00 to No. 34+00, and the latter was station No. 20+00 to No. 16+00. As shown in Figure 5, instream structures such as stepping stones have to be added at the straight channel reach, while they are optional at the meandering channel reach. In addition, the ecological effectiveness for the habitats of two target fishes can be evaluated by the installation of stepping stones, as a simple instream structure, along the straight and meandering channel. Accordingly, boulders were placed at 100 m intervals along the straight channel. In addition, boulders were also installed along the meandering channel to analyze the effect of stepping stones. The stepping stone habitat simulations were conducted by installing six 0.8 m boulders in a 20.73 m width of the straight channel reach and three 1.4 m boulders in a 19.75 m width of the meandering channel reach, as shown in Figure 5.
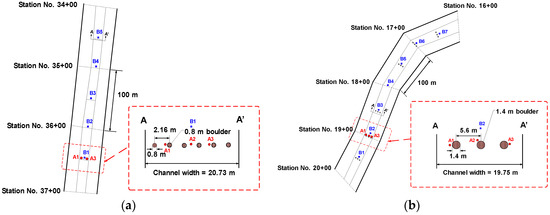
Figure 5.
Installation layout of stepping stones: (a) along the straight channel reach (No. 37+00–No. 34+00); (b) along the meandering channel reach (No. 20+00–No. 16+00). Note: A1, A2, and A3 are the lateral measuring points for shear velocity magnitudes, and B1, B2, B3, B4, B5, B6, and B7 are the longitudinal measuring points for shear velocity magnitudes.
In order to use the River2D model for design of stepping stones, the calibration and verification were validated under the same conditions as the preceding models such as PHABSIM and HEC-RAS. The River2D model has important parameters, such as effective roughness height and eddy viscosity coefficient . The velocity and water surface elevation were more sensitive to than , according to sensitivity analysis. The calibrated effective roughness height () used in the River2D model was on the Mokgamcheon stream restoration reach. The coefficient of determination, , for verification of the velocity and water surface elevation between the two models were 0.976 and 0.981, respectively. Three coefficients—, , and —were used to weight the three assumed components of eddy viscosity; the default values of 0, 0.5 and 0.1, respectively, were used in all runs.
4. Results and Discussion
4.1. Drought Flow and Low-Flow
4.1.1. Drought Flow
The standard and average drought flows were determined as 0.71 m3/s and 1.02 m3/s, respectively (Table 4). In general, the standard drought flow is smaller than the average one. This is because the former is for only a 10-year recurrent interval, while the latter is the average for the entire runoff values. The low-flows were calculated using both hydrologically and biologically based flow designs, as shown in Table 4, Table 5 and Table 6.
Table 4.
Drought flow and hydrological low-flow in the Mokgamcheon stream.
Table 5.
Biological low-flow for 1B3 at the Mokgamcheon stream.
Table 6.
Biological low-flow for 4B3 at the Mokgamcheon stream.
4.1.2. Hydrologically Based Flow Design
As shown in Table 4, the 1Q10 flow of 0.69 m3/s and the 7Q10 flow of 0.72 m3/s, as the low-flows, were estimated. The standard drought flow of 0.71 m3/s was between 0.69 m3/s and 0.72 m3/s of these low-flows, but they were less than the average drought flow of 1.02 m3/s. Therefore, it was reasonable to select the standard drought flow for the Mokgamcheon restoration plan to make the environmental regulation of the Ministry of Environment in Korea consistent with that of the US EPA because the standard drought flow had already achieved the water quality and quantity criteria for aquatic life.
4.1.3. Biologically Based Flow Design
The total numbers of days in excursion signifies the total numbers of days the minimum flow occurs below a certain level within a period of several years, such as the CMC and CCC. The biologically designed low-flows were estimated as the flows not exceeding the maximum numbers of days in excursion calculated as 47/3 = 15.67 (47-year data divided by 3-year period due to both 1B3 and 4B3, defined at 3-year recurrent intervals). As shown in Table 5 and Table 6, the total excursion numbers within the maximum limit of 15.67 were 14 for 1B3 (CMC) and 15.25 for 4B3 (CCC). Thus, the biologically designed low-flows were determined as being 0.63 m3/s for 1B3 and 0.71 m3/s for 4B3.
The standard drought flow of 0.71 m3/s was within the range of low-flows between 0.63 m3/s and 0.72 m3/s. The average drought flow was selected as it was somewhat equal to or greater than the hydrological (1Q10) and the biological low-flows (1B3 and 4B3). In other words, the selection of the standard drought flow was suitable for an ecological design of discharge with respect to the restoration of the Mokgamcheon stream as it exceeded the low-flows considering both hydrologically and biologically based design concepts.
4.2. Fish Flow and Instream Flow
As shown in Table 7, at a smaller flow rate, the appropriate conditions of the habitats were satisfied regarding water depth and velocity required during the spawning season rather than between the fry and adult season. Between the spawning and the adult seasons, the appropriate range of water depths inhabited by Carassius auratus was either deeper than or equal to those of Zacco platypus. On the other hand, the appropriate range of velocities of Carassius auratus was slower than that of Zacco platypus based on the characteristics of the respective fish species.
Table 7.
Habitat Suitability Criteria (HSC) of target species.
In this study, the topographical data of Hyundai Engineering’s channel and the floodplain design plan [33] was used to obtain the WUA of each fish species through PHABSIM simulation. Thereafter, the fish flows were obtained at the discharges appearing in the maximum WUA of Carassius auratus and Zacco platypus along the study-related reach of the Mokgamcheon stream (Table 8). Fish flows were calculated according to the seasonal growth of target fishes, as shown in Table 9. As it is obvious that the seasonal growth of fishes from fry to adult needs an increase in discharge to maintain and satisfy their habitat conditions [34,35], the results of fish flows that were obtained by the PHABSIM were reasonable, as shown in Table 9.
Table 8.
Determination of discharges appearing in the Weighted Usable Area (WUA) for each target species.
Table 9.
Fish flows according to the growing seasons of target fishes in the Mokgamcheon stream.
As the fish flows were available to obtain the instream flow for the growing season (spawning season to adult season) occurring from April to October, the respective fish flows of Carassius auratus and Zacco platypus from Equation (1) could be determined, as shown in Table 10. The fish flows for the growing season (from spawning season to adult season) were always lower than the standard drought flows for Carassius auratus, except in April, September, and October. Therefore, the fish flows in April, September, and October and the standard drought flows from November to March and from May to August were chosen to satisfy the instream flow requirements. However, the instream flows could be selected from the standard drought flow for Zacco platypus throughout the seasons because the fish flows were smaller than the standard drought flow. According to the design plan of Hyundai Engineering [33], the instream flows for most of the seasons were satisfactory without the requirement of any additional water supply, except in April, September, and October. Most of the time, the instream flows ensured the sufficient discharges that is necessary to preserve the habitat of a target fish species with respect to ecological stream restoration.
Table 10.
Instream flow for the Mokgamcheon stream ().
4.3. Detailed Design
According to the design plan of Hyundai Engineering [33], the standard drought flow exceeded the fish flows for the target species Zacco platypus in all months and Carassius auratus except April, September, and October. Because resources and budgets are generally limited, it is not easy to consider the use of structural measures (e.g., application of IWM) against stream flow depletion or flow shortage. In such cases, it is possible to consider some instream structures capable of securing a water quantity to replace structural measures. Instream structures, such as stepping stones, are the simplest and the most inexpensively installable structures that can improve the ecological aspect and can be added to enhance the target fish habitat environment in the detailed design phase. Stepping stone was therefore chosen as the simpler and more effective method than structural measures to improve physical ecological habitats of Zacco platypus and Carassius auratus.
4.3.1. Analysis of the Adequacy of the Stepping Stones Design Using Instream Flow Data
The adequacy of the habitat simulation was assessed through the evaluation of hydraulic factors. The results of the River2D simulation are presented in Table 11 and Table 12 and Figure 6 and Figure 7 at each reach of the straight and meandering channels. For the installation layouts of the stepping stones, the observation positions of the Froude numbers and shear velocities (A1–A3 and B1–B7) are shown in Figure 5a,b.
Table 11.
Simulated shear velocity magnitudes with or without the stepping stones along the straight and meandering channel reaches.
Table 12.
Simulated WUA of Zacco platypus and Carassius auratus with or without stepping stones along straight and meandering channel reaches.
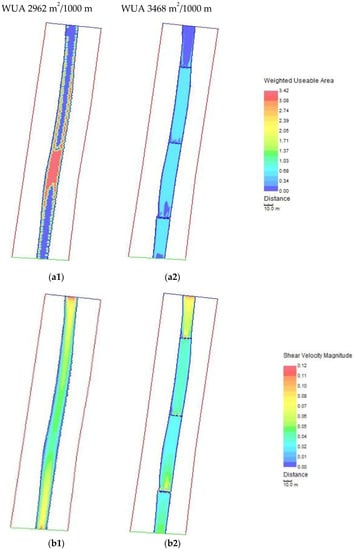
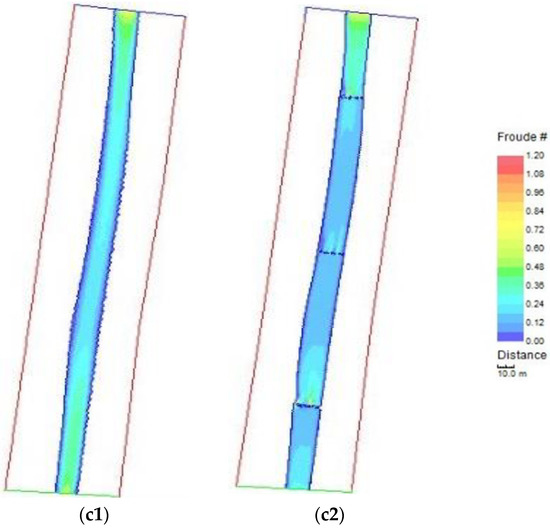
Figure 6.
Simulated results of Zacco platypus on adult season at the straight channel reach (No. 37+00–No. 34+00): (a1) WUA without any instream structure; (a2) WUA with stepping stones; (b1) shear velocity magnitude without any instream structure; (b2) shear velocity magnitude with stepping stones; (c1) Froude number without any instream structure; (c2) Froude number with stepping stones.
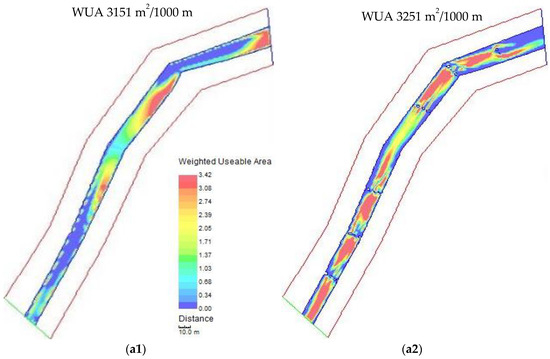
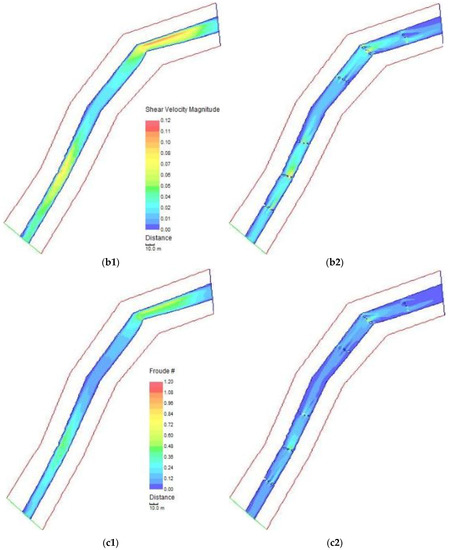
Figure 7.
Simulated results of Carassius auratus on adult season at the meandering channel reach (No. 20+00–No. 16+00): (a1) WUA without any instream structure; (a2) WUA with stepping stones; (b1) shear velocity magnitude without any instream structure; (b2) shear velocity magnitude with stepping stones; (c1) Froude number without any instream structure; (c2) Froude number with stepping stones.
At straight channel reach without any instream structure, the point B2 to B4 were suitable for the habitats of Zacco platypus (Figure 6a1) because of a gradually varied flow corresponding to subcritical flow condition (), while the Froude numbers () and shear velocities ( m/s) slightly increased at point B1 and B5 in the contraction reach, as shown in Table 11 and Figure 7b1,c1. The locations at B1 and B5 were not suitable as the habitat of Zacco platypus as we were able to prove the existence of pool-riffle structures geographically. The straight channel reach can only provide a suitable natural habitat due to the geographical stream features. On the other hand, at meandering channel reach, the Froude number () slightly increased in the contraction reach (point B2 in meandering channel). Froude number () and shear velocity ( m/s) also increased due to the effects of secondary currents and superelevation between the inside and outside of the channel curvature (point B6 in meandering channel). The habitats of Zacco platypus along the straight channel reach without any instream structure were more vulnerable than those of the meandering channel, as shown in Figure 6a1 and Figure 7a1. The original reach of meandering channel provided a more friendly habitat for aquatic systems without the installation of instream structure than that of the straight channel. Although the hydraulic characteristics of the meandering channel flow were very complex, the reach was very suitable for various aquatic habitats. This is because of a secondary flow, which made a difference in velocities between the outer and inner channels and the superelevation occurring in the curvature of naturally created habitats for various aquatic organisms along the meandering channel reach. Therefore, on the basis of such results, at the meandering channel reach, this hydraulic phenomenon created a favorable habitat for fish without the installation of instream structure. For straight channel reach, the installation of instream structure needed to be considered because the reach was hydraulically vulnerable. In this case, the adoption of additional flow supply or ecological habitat improvement techniques was essential for improvement of the ecological habitat in the straight channel reach.
As shown in Figure 6a2–c2 and Figure 7a2–c2, fish habitats for both Zacco platypus and Carassius auratus were relocated around the stepping stones because the diverse flow patterns occurred and the velocities were accelerated near the boulders. This phenomenon occurred due to the increase in velocity and the generation of an appropriate flow depth for the two species by the opening present among the stepping stones. According to simulation results (Figure 6 and Figure 7 and Table 11), at the locations where stepping stones were installed, quasi-critical flow () occurred at point A2 of the straight channel and at point B3 of the meandering channel. This hydraulic phenomenon made a weak hydraulic jump; as the quasi-critical flow at the top of the stepping stones was rapidly changed to subcritical flow in the downstream direction, the energy was dissipated. Repetitive phenomena, such as weak hydraulic jump (from point B3 to B7 of meandering channel reach), between the stepping stones could provide abundant fish habitats, as shown in Table 11 and Table 12.
Finally, on the basis of the hydraulic phenomena described above, it was shown that fish habitats were improved when the stepping stones were installed (Table 12). When stepping stones were installed in a straight channel, the WUA of Carassius auratus greatly increased from 663 to 1057 for fry season and from 769 to 2394 for adult season. However, in the case of meandering channel, despite the installation of stepping stones, there was only a slight increase in WUA, which depended on hydraulic characteristics such as the secondary flow and superelevation, as previously mentioned.
In the case of Zacco platypus, the WUA increased in both straight and meandering channels from spawning to adult seasons. When stepping stones were installed in a straight channel reach, they acted as a riffle-pool structure and were very effective in improving the ecological habitat from fry to adult season for Carassius auratus and from spawning to adult season for Zacco platypus. Therefore, the installation of stepping stones was a very effective way to improve the adverse situation in the ecological habitat caused by water shortages, with stepping stones proving advantageous for improving the habitats of Carassius auratus from fry to adult period and Zacco platypus during all life years.
4.3.2. Analysis of the Adequacy of the Stepping Stone Design Using Monthly Time Series Data
Figure 8 shows the results of simulated runoff using SWMM in the study site from January 2007 to December 2010. In order to assess the adequacy of the design of instream structure such as the stepping stones, River2D simulations were performed using mean monthly flow rates (runoffs) data from April 2009 to October 2009 (the growing season for target fishes). As shown in Figure 8, the stability assessment of the fish habitats for flood event was very important because relatively large floods occurred from July 2009 to October 2009. The results of the stability analysis of habitats for a flood discharge of 5.226 m3/s in September, when a relatively the peak flood occurred, are shown in Table 13 and Figure 8.
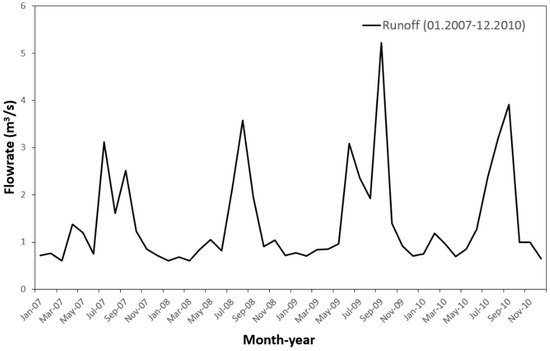
Figure 8.
Simulated runoff using SWMM from January 2007 to December 2010.
Table 13.
Simulated WUA of Zacco platypus and Carassius auratus with or without the stepping stones along the straight channel reach for flood discharge (5.226 m3/s).
The results of River2D by the flood discharge in September showed that the WUA conditions without any instream structure (Figure 9a1,b1) were slightly greater than if the stepping stones were installed (Figure 9a2,b2). In the absence of stepping stones, shelters were created for fish to be evacuated along riverbank as the velocities in the middle of the stream were very high, as shown in Figure 9c1,c2. When a large flood occurred and stepping stones were installed, the areas of the shelter were relatively smaller than when there were no stepping stones installed because of faster flow around the stepping stones. The stepping stones were submerged by floods, and velocities in the middle of the stream and around stepping stones were very fast, as shown in Figure 9c2. However, for some fishes, safety is ensured through vertical migration in stream to use the hyporheic zone of stream bed as a shelter [38]. Therefore, additional measures will be needed to create shelter for fishes to be evacuated. However, according to the theory of nature’s pulsing paradigm, if the structure is not destroyed, the pulse, such as a flood of medium frequency and amplitude, leads to the biodiversity and productivity of the ecosystem [39,40]. Even if the stepping stones are destroyed, it will provide a space as another natural ecological habitat.
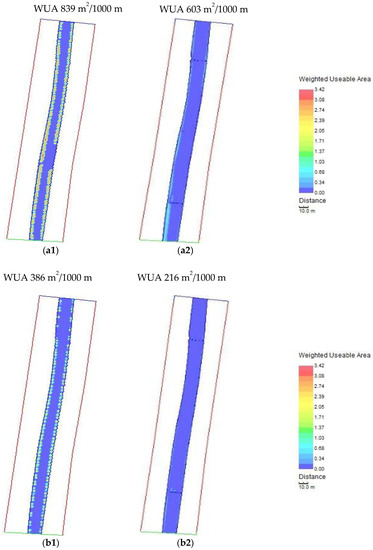
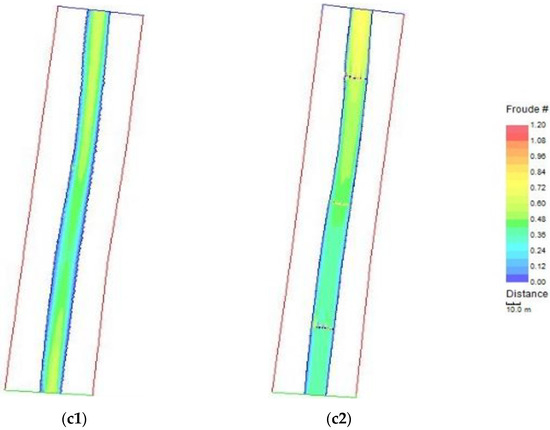
Figure 9.
Simulated results at the straight channel reach (No. 37+00–No. 34+00): (a1) WUA of Zacco platypus on adult season without any instream structure; (a2) WUA of Zacco platypus on adult season with stepping stones; (b1) WUA of Carassius auratus on adult season without any instream structure; (b2) WUA of Carassius auratus on adult season with stepping stones; (c1) shear velocity magnitude without any instream structure; (c2) shear velocity magnitude with stepping stones.
5. Conclusions
This study provides the determination procedure of fish habitats to improve the environment for target species during the restoration of a given stream. Although many urbanized watersheds in Korea suffer from stream flow depletion, governments cannot afford to invest big budgets and construct various available structural measures for water resource development by applying the IWM scheme. Important factors regarding the ecological restoration procedure consist of the effective estimation method and the substantive securing method of the instream flow for the target species. In this study, the determination process of the instream flow was demonstrated for the Mokgamcheon stream in Korea, which is an area undergoing various stream restoration projects.
One of the key findings was the appropriateness and usefulness of DFLOW, which was examined to check whether drought flow satisfied the condition of a water ecosystem. The DFLOW quantitatively expresses the aquatic life criteria by evaluating the CCC and the CMC, which is distinct from the traditional approaches of determining the drought flow in Korea. The results of the DFLOW simulation provided a robust evaluation of the low-flow, including the aquatic life criteria required to preserve the ecological environment as well as the minimum stream flow.
Because the populations of aquatic species in the stream corridor are crucial factors and are the minimum requirements for the purpose of ecological restoration, the calculation of fish flow is a very important factor regarding the restoration of an ecological system. To assess the fish flow for target fishes, the concept of WUA using the PHABSIM model was applied to evaluate the quantities of the available habitats. For this, the instream flow was evaluated as the maximum value between the drought flow and the calculated fish flow required to restore an aquatic ecosystem.
The River2D was applied in order to evaluate the population and habitat location of aquatic fishes. The results of River2D simulation on two cases (without/with the installation of instream structure, especially stepping stones) showed the change patterns of the habitats for the target species. When the drought flow was much smaller than the fish flow to rehabilitate the targeted urbanized stream, the stream flow depletion (the difference between the low-flow and the drought flow) provided the choices of supplementary structural measures to achieve the desired water quantity as well as the condition of ecological habitats. The other key finding from this study was the usefulness and effectiveness of the hydraulic engineering technique (e.g., instream structure) to create the preferred habitats for target species without additional water securing plan (i.e., the structural measures of the IWM). Therefore, although the method for securing water resources should be considered with respect to large-scale hydraulic and hydrologic facilities—which have carried tremendous costs in most of the previous water management projects—in this study, the installation of stepping stones as the improved alternative technique suggests the availability of a much more cost-effective instream structures with respect to hydraulic dynamics. However, from the analysis results of the adequacy of the stepping stone design using monthly time series data, the habitat with stepping stones was somewhat susceptible to flooding compared to the habitat without any instream structure. Nevertheless, satisfactory results were obtained for the entire period.
Future research will be needed on the hypothesis that pulses, such as medium floods, enhance productivity and biodiversity as pulsing of medium frequency and amplitude provides an energy subsidy for the ecosystem. Thus, in order to increase biodiversity [41] and productivity of the aquatic systems, our future study will consider both maximum and minimum extreme pulses, such as flood and drought, when performing river restoration. Through the understanding of vertical migration of fishes and connectivity with the hyporheic zone, it is necessary to study ways to preserve endangered fish species in the aquatic ecosystem from fall to spring [38]. Future studies should look at ways to effectively create fish habitat under the riverbed from fall to winter [39].
Author Contributions
Conceptualization, K.P. and K.S.L.; Methodology, K.P. and K.S.L.; Software, K.P.; Validation, K.P., K.S.L. and Y.-O.K.; Formal Analysis, K.P.; Investigation, K.P. and K.S.L.; Resources, K.P.; Data Curation, K.P.; Writing-Original Draft Preparation, K.P. and Y.-O.K.; Writing-Review & Editing, K.P., K.S.L. and Y.-O.K.; Visualization, K.P.; Supervision, K.S.L. and Y.-O.K.; Project Administration, Y.-O.K.; Funding Acquisition, Y.-O.K.
Funding
This research was supported by a grant (14AWMP-B082564-01) from the Advanced Water Management Research Program funded by the Ministry of Land, Infrastructure and Transport of Korea; the Institute of Engineering Research at Seoul National University; and Department of Civil & Environmental Engineering at Seoul National University.
Acknowledgments
The authors acknowledge the financial support of the Advanced Water Management Research Program funded by the Ministry of Land, Infrastructure and Transport of Korea; the Institute of Engineering Research at Seoul National University; and Department of Civil & Environmental Engineering at Seoul National University. The first author is also grateful to Jin-Ho Oh of Hyundai Development Company for helping to collect data.
Conflicts of Interest
The authors declare no conflict of interest.
References
- Boolim Engineering. Master Plan of the Mokgamcheon Watershed; Boolim Engineering: Gwang Myeong City, Korea, 2002. [Google Scholar]
- Jowett, I.G. Instream flow methods: A comparison of approaches. Regul. Rivers Res. Manag. 1997, 13, 115–127. [Google Scholar] [CrossRef]
- Kunhwa Engineering. River Maintenance Master Plan for the Mokgamcheon; Kunhwa Engineering: Gyeonggi-do, Korea, 1995. [Google Scholar]
- Saman and Hankuk Engineering Consultants. Master Plan and Detailed Design of the Mokgamcheon Restoration; Saman and Hankuk Engineering Consultants: Gwang Myeong City, Korea, 2008. [Google Scholar]
- Pathak, N.; Girija, T.R.; Mahanta, C. Modeling application towards eco-restoration strategies for the polluted tributaries of the Brahmaputra River system. In Proceedings of the World Enivronmental and Water Resources Congress 2007: Restoring Our Natural Habitat, Tampa, FL, USA, 15–19 May 2007. [Google Scholar]
- Kondolf, G.M. Lessons learned from river restoration projects in California. Aquat. Conserv. Mar. Freshw. Ecosyst. 1998, 8, 39–52. [Google Scholar] [CrossRef]
- Palmer, M.A.; Benhardt, E.S.; Allan, J.D.; Lake, P.S.; Alexander, G.; Brooks, S.; Carr, J.; Clayton, S.; Dahm, C.N.; Follstad Shah, J.; et al. Standards for ecologically successful river restoration. J. Appl. Ecol. 2005, 42, 208–217. [Google Scholar] [CrossRef]
- Bovee, K.D. A Guide to Stream Habitat Analysis Using the Instream Flow Incremental Methodology; Instream Flow Information Paper 12; US Fish and Wildlife Service Biological Services Program, Cooperative Instream Flow Service Group: Fort Collins, CO, USA, 1982. [Google Scholar]
- Pretty, J.L.; Harrison, S.C.; Shepherd, D.J.; Smith, C.; Hildrew, A.G.; Hey, R.D. River rehabilitation and fish populations: Assessing the benefit of instream structures. J. Appl. Ecol. 2003, 40, 251–265. [Google Scholar] [CrossRef]
- Lee, K.S. Rehabilitation of the Hydrologic Cycle in the Anyangcheon Watershed, Sustainable Water Resources Research Center; Ministry of Education, Science and Technology: Seoul, Korea, 2007. [Google Scholar]
- Lee, K.S.; Chung, E.-S.; Kim, Y.O. Integrated watershed management for mitigating stream flow depletion in an urbanized watershed in Korea. Phys. Chem. Earth 2008, 33, 382–394. [Google Scholar] [CrossRef]
- Korea Water Resources Association. Criteria and Commentary of River Design; Korea Water Resources Association: Seoul, Korea, 2009. [Google Scholar]
- Lee, K.S.; Chung, E.S. Development of integrated watershed management schemes for an intensively urbanized region in Korea. J. Hydro-Environ. Res. 2007, 1, 95–109. [Google Scholar] [CrossRef]
- United States Environmental Protection Agency. Technical Guidance Manual for Performing Wasteload Allocations. Book VI: Design Conditions—Chapter 1: Stream Design Flow for Steady-State Modeling; US EPA: Washington, DC, USA, 1986.
- United States Environmental Protection Agency. DFLOW User’s Manual; Risk Reduction Engineering Laboratory Office of Research and Development: Washington, DC, USA, 1990.
- Ministry of Environment. Environmental Policy Act 21887; Ministry of Environment: Seoul, Korea, 2009.
- Gore, J.A.; Crawford, D.J.; Addison, D.S. An analysis of artificial riffles and enhancement of benthic community diversity by physical habitat simulation (PHABSIM) and direct observation. Regul. Rivers Res. Manag. 1998, 4, 69–77. [Google Scholar] [CrossRef]
- Maddock, I.P.; Bickerton, M.A.; Spence, R.; Pickering, T. Reallocation of compensation releases to restore river flows and improve instream habitat availability in the Upper Derwent catchment, Derbyshire, UK. Regul. Rivers Res. Manag. 2001, 17, 417–441. [Google Scholar] [CrossRef]
- Milhous, R.T.; Updike, M.A.; Schneider, D.M. Physical Habitat Simulation Reference Manual-Version II. Instream Flow Information Paper; US Fish and Wildlife Service: Fort Collins, CO, USA, 1989.
- Moir, H.J.; Gibbins, C.N.; Soulsby, C.; Youngson, A.F. PHABSIM modeling of Atlantic salmon spawning habitat in an upland stream: Testing the influence of habitat suitability indices on model output. River Res. Appl. 2005, 21, 1021–1034. [Google Scholar] [CrossRef]
- Shuler, S.W.; Nehring, R.B. Using the physical habitat simulation model to evaluate stream habitat enhancement project. Rivers 1993, 4, 175–193. [Google Scholar]
- United States Geological Survey. PHABSIM for Windows, User Manual and Exercises; Midcontinent Ecological Science Center, US Geological Survey: Washington, DC, USA, 2001.
- Lee, J.H.; Kil, J.T.; Jeong, S. Evaluation of physical fish habitat quality enhancement designs in urban streams using a 2D hydrodynamic model. Ecol. Eng. 2010, 36, 1251–1259. [Google Scholar] [CrossRef]
- Peter, S.; Julia, B. River2D: Introduction to Depth Averaged Modeling and User’s Manual; University of Alberta: Edmonton, AB, Canada, 2002. [Google Scholar]
- Rosgen, D.L. Watershed Assessment of River Stability and Sediment Supply (WARSSS); Wildland Hydrology: Fort Collins, CO, USA, 2006. [Google Scholar]
- Niezgoda, S.L.; Johnson, P.A. Modeling the long term impacts of using rigid structures in stream channel restoration. J. Am. Water Resour. Assoc. 2006, 42, 1597–1613. [Google Scholar] [CrossRef]
- Radspinner, R.R.; Diplas, P.; Lightbody, A.F.; Sotiropoulos, F. River training and ecological enhancement potential using instream structures. J. Hydraul. Eng. 2010, 136, 967–980. [Google Scholar] [CrossRef]
- Shields, F.D.; Cooper, C.M.; Knight, S.S. Experiment in stream restoration. J. Hydraul. Eng. 1995, 121, 494–502. [Google Scholar] [CrossRef]
- Kuhnle, R.A.; Alonso, C.V.; Shields, F.D. Geometry of scour holes associated with 90 degree spur dikes. J. Hydraul. Eng. 1999, 125, 972–978. [Google Scholar] [CrossRef]
- Kuhnle, R.A.; Alonso, C.V.; Shields, F.D. Local scour associated with angled spur dikes. J. Hydraul. Eng. 2002, 128, 1087–1093. [Google Scholar] [CrossRef]
- Rossman, L.A. Storm Water Management Model User’s Manual, Version 5.0; Water Supple and Water Resources Division National Risk Management Research Laboratory, United States Environmental Protection Agency: Cincinnati, OH, USA, 2010.
- United States Army Corps of Engineers. HEC-RAS River Analysis System User’s Manual, Version 4.1; CPD-68; U.S. Army Corps of Engineers Hydrologic Engineering Center: Davis, CA, USA, 2010. [Google Scholar]
- Hyundai Engineering. Integrated Flood Management in the Anyangcheon Basin, Ministry of Construction and Transportation; Seoul Regional Construction Management Administration: Seoul, Korea, 2005. [Google Scholar]
- Korea Institute of Construction Technology. Development and Application of Method to Determine Instream Flow Requirement; Korea Water Resources Corporation: Daejeon, Korea, 1995. [Google Scholar]
- Kim, K.H. Evaluation of Habitat Conditions and Estimation of Optimum Flow for the Freshwater Fish. Ph.D. Thesis, Yonsei University, Seoul, Korea, 1999. [Google Scholar]
- Nash, J.E.; Sutcliffe, J.V. River flow forecasting through conceptual model, part 1—A discussion of principles. J. Hydrol. 1970, 10, 282–290. [Google Scholar] [CrossRef]
- Water Resources Management Information System. Available online: http://www.wamis.go.kr (accessed on 15 May 2012).
- Kawanishi, R.; Dohi, R.; Fujii, A.; Inoue, M.; Miyake, Y. Vertical migration in streams: Seasonal use of the hyporheic zone by the spinous loach Cobitis shikokuensis. Ichthyol. Res. 2017, 64, 433–443. [Google Scholar] [CrossRef]
- Odum, W.E.; Odum, E.P.; Odum, H.T. Nature’s pulsing paradigm. Estuaries 1995, 18, 547–555. [Google Scholar] [CrossRef]
- Junk, W.J.; Bayley, P.B.; Sparks, R.E. The flood pulse concept in river-floodplain system. Can. J. Fish. Aquat. Sci. 1989, 106, 110–127. [Google Scholar]
- Sousa-Santos, C.; Robalo, J.I.; Francisco, S.M.; Carrapato, C.; Cardoso, A.C.; Doadrio, I. Metapopulations in temporary streams—The role of drought-flood cycles in promoting high genetic diversity in a critically endangered freshwater fish and its consequences for the future. Mol. Phylogenet. Evol. 2014, 80, 281–296. [Google Scholar] [CrossRef] [PubMed]


© 2018 by the authors. Licensee MDPI, Basel, Switzerland. This article is an open access article distributed under the terms and conditions of the Creative Commons Attribution (CC BY) license (http://creativecommons.org/licenses/by/4.0/).