1. Introduction
The international climate goals set out in the Paris Agreement 2015 will require ‘net zero’ anthropogenic greenhouse gas (GHG) emissions by 2100 according to the consensus reports by the Intergovernmental Panel on Climate Change (IPCC) [
1]. If this goal is not achieved, climate change is expected to cause devastating negative effects on nature and society. Generally, achieving international climate change mitigation goals in high-income (HICs) will require drastic improvements in energy efficiency as well as profound lifestyle changes [
2,
3,
4,
5,
6,
7,
8,
9,
10,
11,
12]. While direct emissions from production of energy, other products and services are an integral part of the IPCC mitigation discourse, less emphasis has been given to indirect emissions by advocating lifestyle and end-use consumption changes [
13,
14,
15,
16]. GHG emissions can be calculated by taking consumption—or a production-based approach. The latter refers to the territorial emissions of a given region, whereas the first approach, consumption-based, takes into account emissions embedded in, for example, trade by looking into the demand side of production. When calculating GHG emissions from the consumption side, including both direct and indirect emissions, households contribute up to 72% of GHG emissions globally [
17,
18]. Whereas the direct production-related GHG emissions in many HICs for the last decades decreased by 3% between 1990–2008, consumption-related GHG emissions, in particular emissions from private consumption, increased by 11% [
19]. Studies addressing household level GHG mitigation have often been framed in contexts of voluntary and autonomous mitigation actions [
20]—to a lesser extent looking at mandatory mitigation policies or regulations and what effect that would have on people [
21]. Furthermore, greater focus has been on the analysis of the effects of households’ consumption patterns, as opposed to that of consumption volumes [
4,
18], in particular with respect to GHG emissions per unit of consumption [
22] and efficiency actions such as, for example, changing to an electric car, installing a heat pump, etc. [
23,
24]. Moreover, studies have indicated that it is difficult to engage households in mitigation actions that will result in changes in lifestyles with substantial GHG reduction. Furthermore, research is limited on the connection between household’s consumption, GHG emissions, and behavior change [
25,
26].
Upon the adoption of the Paris Agreement in 2015, the Conference of Parties (COP) to the United Nations Framework Convention on Climate Change (UNFCCC) invited the IPCC to provide a special report in 2018 on the impacts of global warming of 1.5 °C above pre-industrial levels and related global GHG emission pathways. This paper will contribute to this effort by investigating household strategies aimed at decarbonizing their emissions to achieve the 1.5 °C goal. This study is produced within the framework of the project “Household Preferences for Reducing Greenhouse Gas Emissions in Four European High Income Countries” (HOPE), and addresses the following research questions:
- (1)
What are the main determinants of households’ carbon footprints in four high income mid-size European cities?
- (2)
Which mitigation actions do households prefer to implement voluntarily to reduce their carbon footprint?
- (3)
Which mitigation actions do households need to implement to reduce their carbon footprint by 50 percent?
- (4)
What patterns can be found in CO2e reductions and reduction potential between high and low emitting households?
2. Materials and Methods
The HOPE project took a mixed-methods approach in order to assess households’ preferences to reduce greenhouse gas emissions. The mixed-methods design comprised three steps labeled
Interactions. The first two
Interactions were purely quantitative and the third interaction was purely qualitative. Only quantitative results are presented in this paper including a short brief of the sampling and recruitment procedures in order to focus more on the data collection and analysis of Interactions 1 and 2. A more detailed description of the entire study protocol is given elsewhere [
27].
Data was collected between June and November 2016 in households in four medium sized cities situated in four European high-income countries (HICs): Bergen in Norway, Communauté du Pays d’Aix in France, Mannheim in Germany, and Umeå in Sweden. We chose one city per country as a case study in order to engage stakeholders on a city level into the process of research and dissemination. Henceforth, the investigated cities will be referred to by country names. Initially, a thorough protocol and guidelines were developed to secure comparable procedures in every country after which invitation letters were sent by mail in those countries where city registries were available. The letters were standardized across countries and translated to local languages. They included general information, an announcement of incentives, a detailed information sheet and an informed consent form to be filled in. Given the thorough protocol and a limited budget, two incentives were offered to increase participation rate: €25 vouchers upon completion of interaction 2 and a lottery ticket to win a prize worth around €1000 upon completion of interaction 3. The combined incentives meant to encourage both “risk averse” and “risk seeking” people, further explained by Herrmann et al. [
25].
Interaction 1 was assessed by a self-report questionnaire that took approximately two hours for each household to fill in (for full questionnaire in English see the HOPE questionnaire (
Supplementary Materials: HOPE_questionnaire.pdf). The assessment included detailed questions concerning the households’ demographics, consumption, and expenditures in the areas of housing, mobility, food, and other consumption. For instance, households were asked to report their annual car mileage and expenditures for their car. In the food section, household representatives were asked to fill in their weekly use of a certain food item in kg. As not all types of foods were prompted, we introduced a fixed value for Other food, which was added to the CO
2e footprint of the prompted food items. This value was calculated from average values of the consumption of food not included in the questionnaire (in particular: eggs and eggs products, cereals, nuts, potatoes, rice, vegetable fats, sweets and sugar, mineral water, tee and infusions, coffee, and alcoholic drinks) and resulted in 611.68 kg CO
2e per person per year. Furthermore, socioeconomic characteristics of households were collected. The information provided by the questionnaire yielded a baseline carbon footprint (CF) for each household. This was calculated and presented using a Footprint Calculation and Simulation-Tool (FCS-Tool), especially developed for this study. The development and exact functioning of the FCS-Tool is described elsewhere [
28]. A chart presenting the structure of households’ baseline CF is shown in the
Supplementary Materials (Supplementary Materials: Footprint.pdf).
The households were informed about the EU’s mitigation goals to stay below the 1.5 °C warming ceiling and that it would require a 50% reduction of GHG emissions by 2030 across all sectors of society, including private households [
29,
30]. The interaction was conducted by one participant, who represented the whole household, in order to rule out bias from group dynamics. The FCS-tool generated 65 individualized action cards presenting mitigation actions in consumption patterns and levels (e.g., “Reduce your car use by 30%”). Each card displayed for each household: (1) How much CO
2e could be saved by implementing this action per year; (2) how much this action would cost/save the household in monetary terms; and (3) what health effects (“co-benefits”), if any, the respective action would generate. The calculations and methods behind the action card’s reduction potential, cost-effect and health co-benefits were decided and evaluated in a pilot study performed in 2015 by the HOPE-team. Information about calculations and methods, can be found on the web (
http://hope-project.net/?page_id=1052lang=en) and is described by Herrman et al. in a study protocol [
27].
The procedure in Interaction 2 took place as follows: First, we asked the participant to read and rate all action cards. Second, we confronted the participant with two sequential scenarios, ‘voluntary’ and ‘forced’ (abridged as Sim in notations) in order to simulate household’s CF reduction, using the following words:
- 1.
Sim1 (voluntary): “Which action would you actually like to implement to reduce your carbon footprint by 50% by 2030? Choose and rank action cards. Start with the action you would be most willing to implement. You may choose up to 30 actions in total.”
The choices were entered in the FCS-Tool, which calculated how much the CF would reduce if these actions were implemented. If the reduction was less than 50%, the participant was confronted with a second task:
- 2.
Sim2 (forced): “Which actions would you choose if you were forced to reduce your carbon footprint by 2030? Continue your rank order from simulation 1. You may choose up to 30 actions in total.”
During the second scenario, the participant received continuous feedback from the interviewer about the current reduction level. The simulation ended when the 50% target was reached or when it was not technically feasible to choose any more action cards. Moreover, some action cards were not applicable—thus not available—to households, either if the action was not possible to implement for this household (e.g., solar collectors in a ground floor apartment) or because the action was already done by the household (e.g., eating less meat in a vegetarian household). In cases where participants chose to stick with their Sim1 result throughout Sim2, their response counted only once. Furthermore, some actions were mutually exclusive such as eating 30% more vegetarian food, eating 60% more vegetarian food, and becoming a vegetarian.
Altogether, data from 309 households were collected and one observation was removed from the sample due to missing data. The repartition by countries was as follows: Germany n = 106 + 1 missing; France n = 70; Norway n = 58; and Sweden n = 74. All calculations and analysis were performed using the software R v.3.2.1 (R foundation for Statistical Computing, Vienna, Austria). Emission variables with skewed distributions were log-transformed to more accurately distinguish variation. Summary statistics for continuous variables were presented as medians and 25th–75th percentile range, and for categorical variables as frequencies (%).
Linear regression models were used to assess associations between (1) reduction potential (independent variable) and chosen actions (dependent variable) and (2) household baseline CF (independent variable) and household income (dependent variable). In order to improve comparisons across households of different sizes, some variables were weighted using “consumption units” (CU). We used the Organisation for Economic Co-operation and Development (OECD)-modified scale [
31], with the following weights: 1 for the household head, 0.5 for each additional adult member and 0.3 for each child (under 15). For example, if a household including 2 parents and 2 children under 15, had annual GHG emissions of 15 tons CO
2e, the annual footprint per consumption unit was 15/(1 + 0.5 + 2 × 0.3) = 7.14 tons per CU per year. The data of the four studied countries were analyzed separately, as well as pooled, however, all results were aggregated to give a descriptive picture of the full data including all countries if not otherwise stated.
3. Results
3.1. Size and Composition of the Households’ Baseline Carbon Footprint
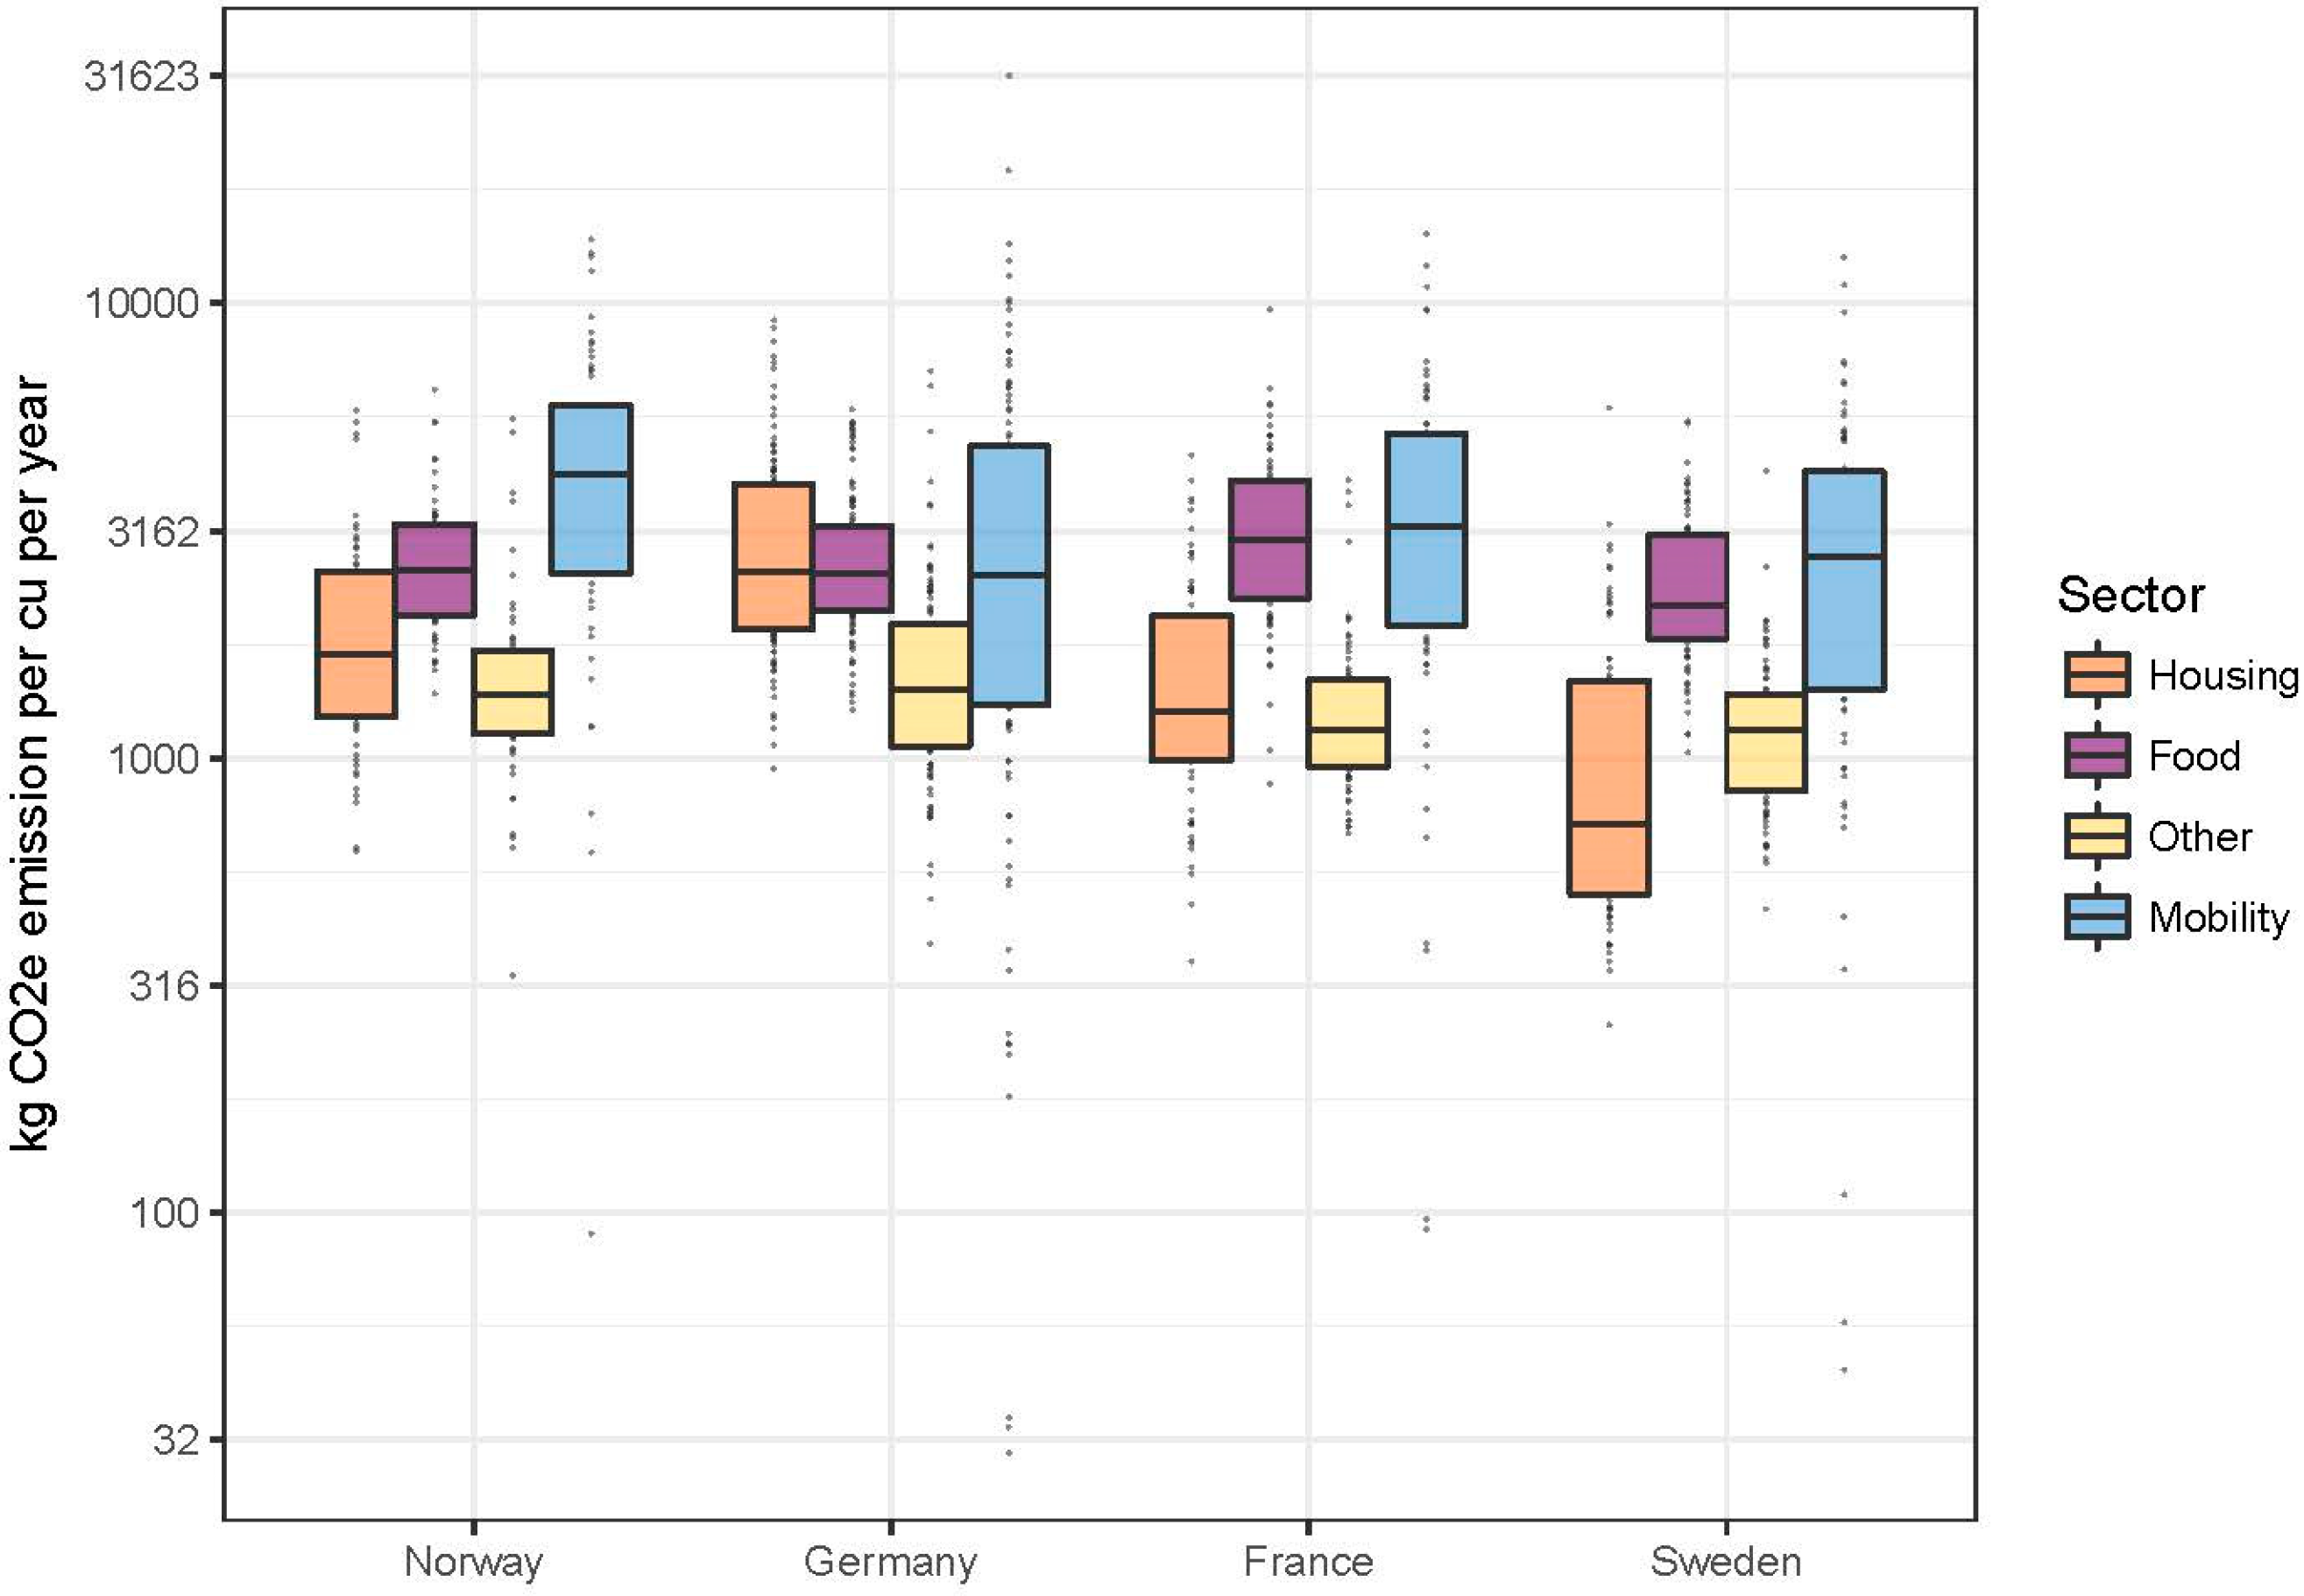
The households’ median baseline carbon footprint (CF) was lowest for Swedish participants (7.3 tons), followed by the French (10 tons), German (10.2 tons), and Norwegian participants with 11.3 tons CO
2e per consumption unit (cu) per year. Mobility stood out as the highest contributing sector to CO
2e emissions across all countries, accounting for an average of 34% of the households’ baseline CF with a median value of 2.9 tons CO
2e per CU per year. The food sector made out 30% with 2.6 tons CO
2e, followed by the housing sector (21% and 1.8 ton) and other consumption (15% and 1.3 ton). Altogether the median baseline household CF was 9.5 tons CO
2e per CU per year (see
Table S1 (Supplementary Materials: Tables spreadsheet)). To a large extent, the baseline CF for housing was made up by emissions from Heating, which was the highest contributing commodity to this sector in all countries with a total of 0.5 tons/cu covering 44% of this sectors total baseline CF. Furniture and renovation contributed the least within the housing sector (3%) along with House construction (1%) (see
Table S2 (Supplementary Materials: Tables spreadsheet)). Moreover, housing was a sector built by GHG emissions largely from energy consumption which resulted in some variations between countries depending on what major source of energy they used (nuclear, hydropower, district heating, etc.) and what the consumer price was at the time of the study (kWh/€). Food did not show much country wise variation with the exception of France due to higher numbers of reported meals eaten at restaurants/school. The highest contributing food commodity was the category Other food (37%) followed by Restaurants/school (24%), Dairy (14%), and Red meat (11%) (see
Table S3 (Supplementary Materials: Tables spreadsheet)). As shown in
Figure 1 (see
Table S4 (Supplementary Materials: Tables spreadsheet) for detailed information). Other consumption was the least emission-heavy sector with the exception of Sweden, where housing had the lowest median value of the four sectors. Mobility’s baseline CF was predominantly composed by the commodities Car, motorcycles and other motorized vehicles (hence referred to as Car) and Plane with 1.4 and 0.9 tons of CO
2e, respectively, together accounting for more than 98% of this sectors total baseline CF (see
Table S5 (Supplementary Materials: Tables spreadsheet)). As a result of the mobility sector’s vast contribution to the households’ total emissions, the commodities Car and Plane were dissected by country to grasp a wider understanding of the underlying factors affecting their impact on the CF. The annual distances for households’ flights per capita were noted in three subcategories: Domestic, inter-European, and intercontinental. The emissions attributed to these flights were directly connected to the distances of the voyages. The difference between the subcategories showed that domestic flights yielded the shortest recorded distance followed by inter-European-, and intercontinental flights for all countries, with the exception of Norway, which had over half of their recorded distances attributed to inter-European flights. For Germany, 84% was intercontinental flights, and for France almost 70%. The Swedish record were quite evenly distributed between all three subcategories. The median flight distance varied from around six–to eight thousand km per person and year for Germany, France, and Sweden. Norway had a median distance recorded to nearly 13 thousand km per person per year, comparable to a round-trip from Berlin to New York (see
Table S6 (Supplementary Materials: Tables spreadsheet)). The analysis of distances travelled by cars revealed that French and German participants mainly used their cars for commuting, whereas the Scandinavian countries used theirs for holidays or other local travel to a relatively higher extent. On average, households in France and Germany travelled 36 km, and 27 km per day, respectively, whilst households in Sweden and Norway both travelled less than 17 km (14 km and 16 km, respectively) (see
Table S7 (Supplementary Materials: Tables spreadsheet)).
3.2. Carbon Footprint Reduction in the two Scenarios of the Simulation Game
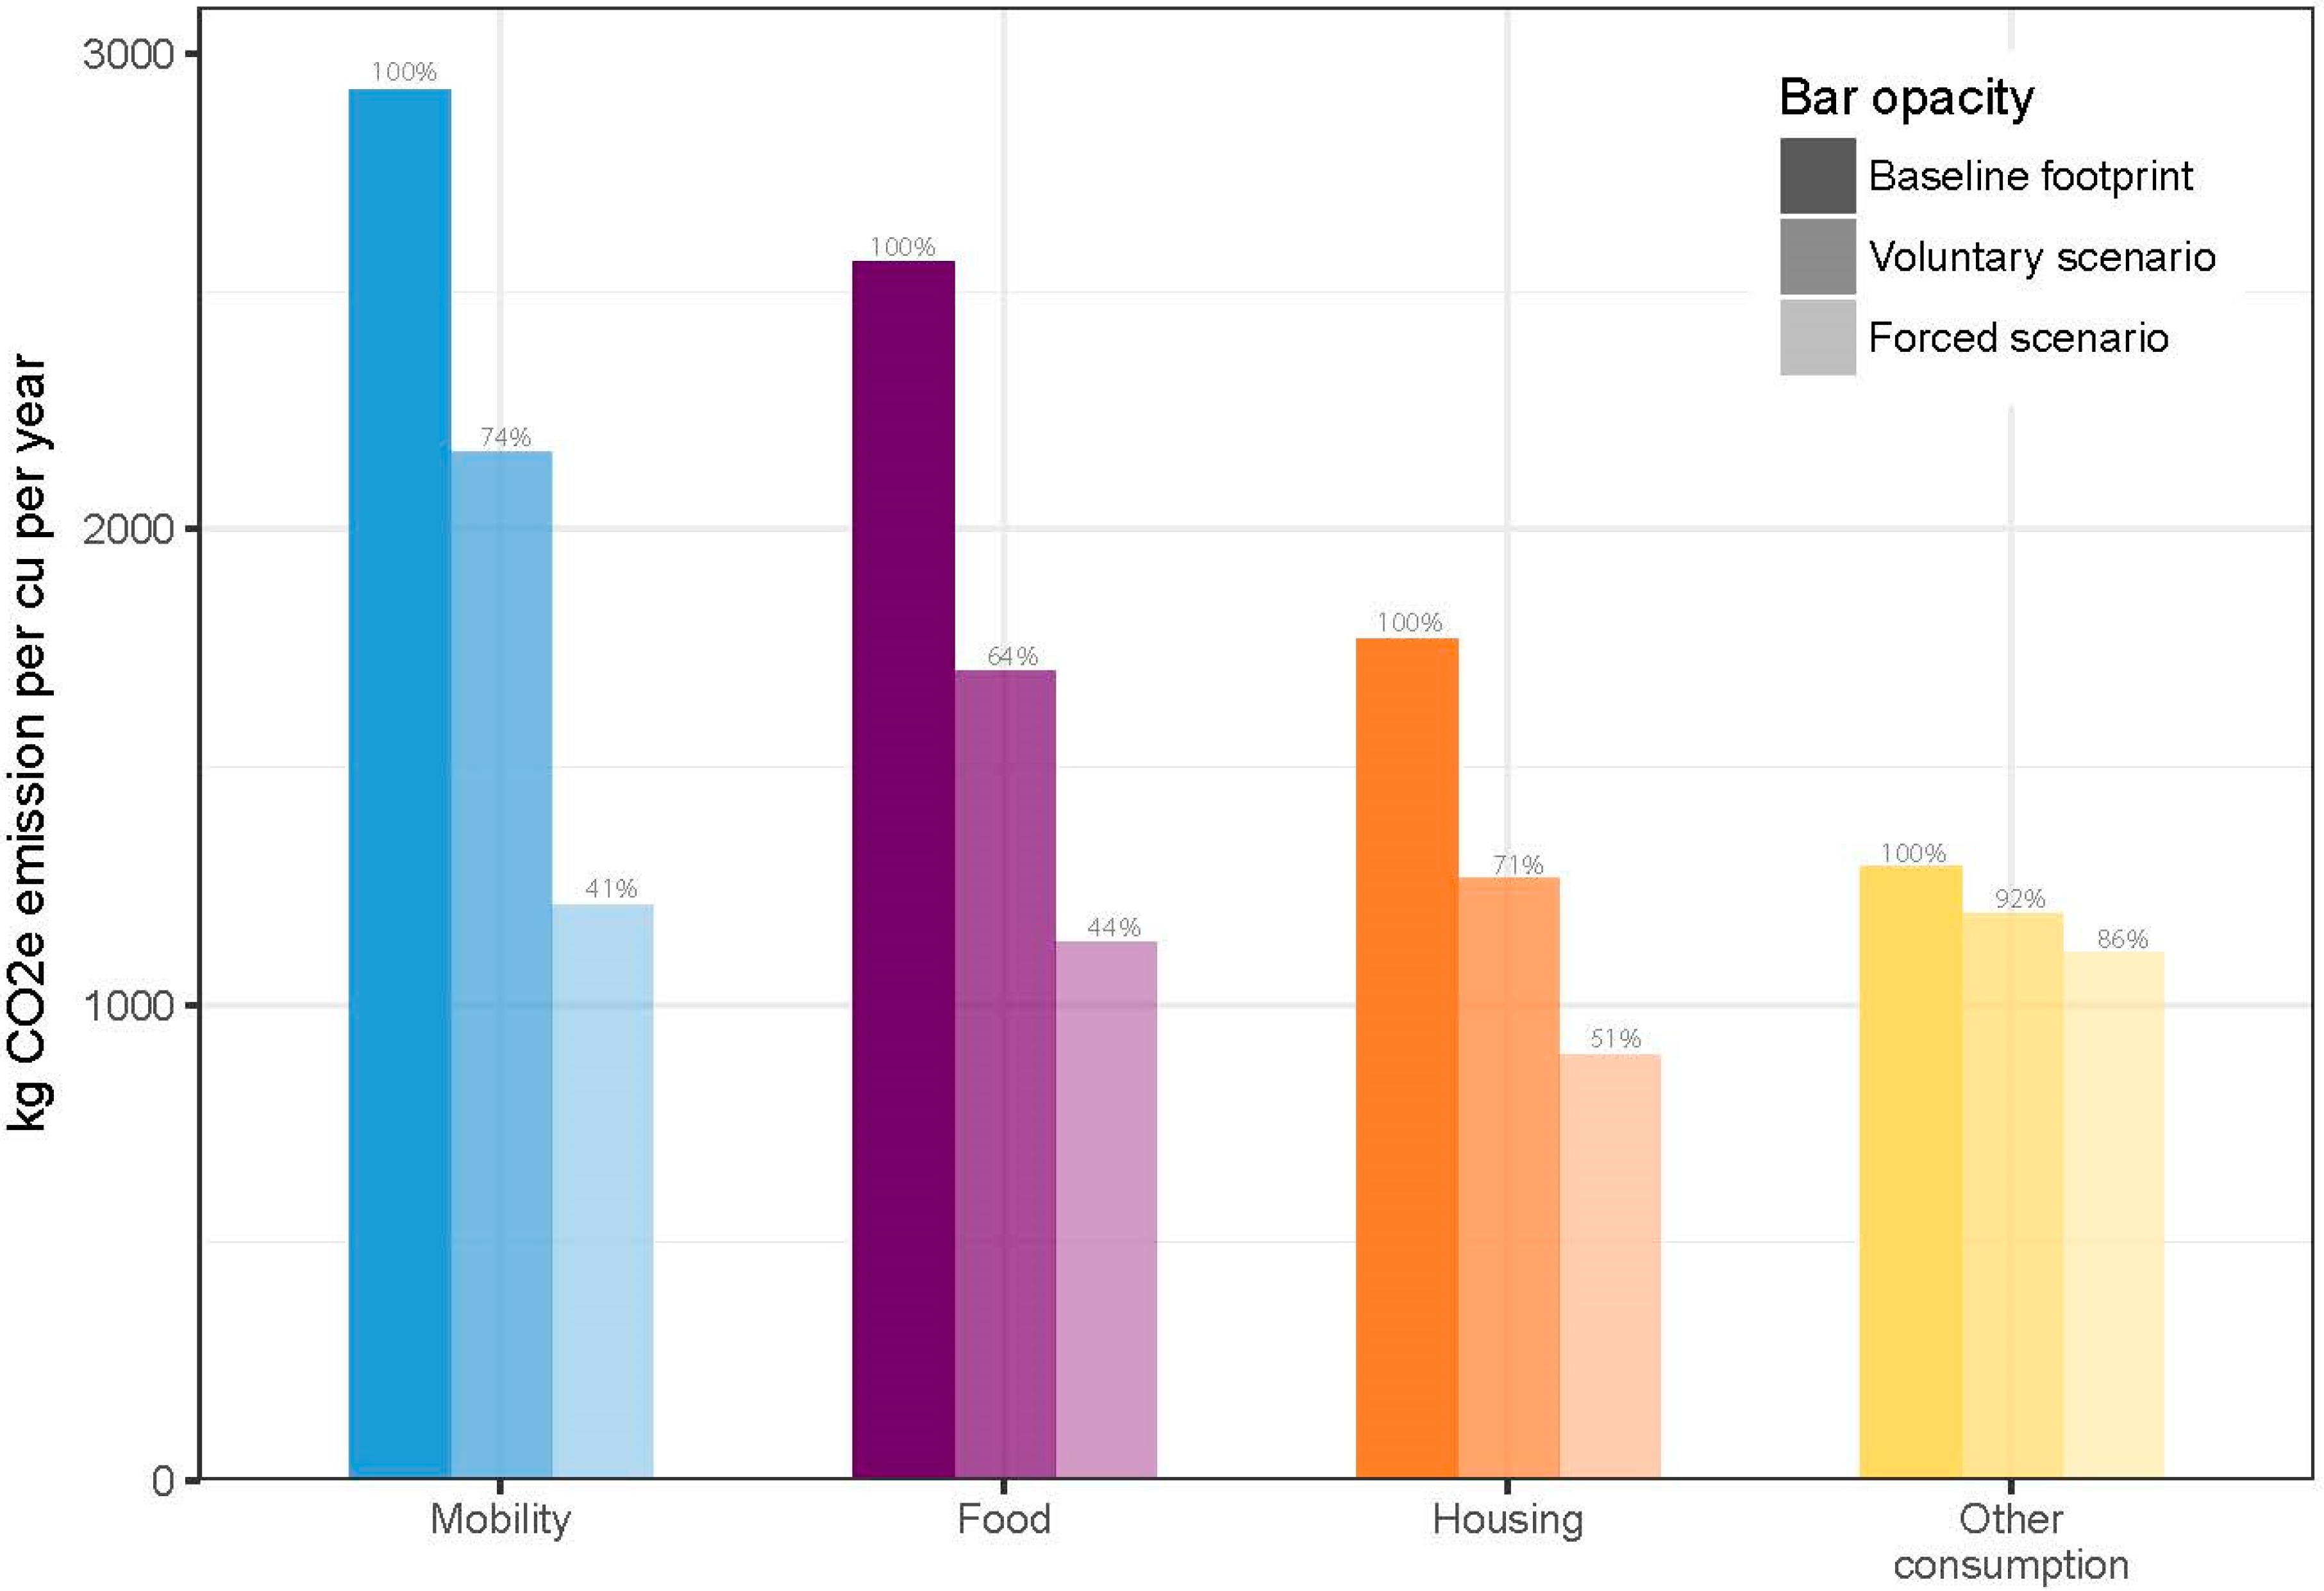
Figure 2 (see
Table S1 (Supplementary Materials: Tables Spreadsheet) for detailed information) presents the reductions of the baseline CF in the two rounds of the simulation game (Sim1 and Sim2) for the four household sectors. The median baseline CF for the 308 households was reduced by 25%, from around 9.5 tons of CO
2e per CU per year to 7.1 after the voluntary scenario Sim1. The ‘voluntary’ scenario Sim1 resulted in a cross-country median decrease of 34% in the food sector, 29% for housing, 26% for mobility, and 8% for other consumption. The variation between the studied countries’ reduction was minor (see
Table S8 (Supplementary Files: Tables spreadsheet)) During the forced scenario (Sim2), most households reached, or came very close in reaching, the reduction target of 50%. The few exceptions occurred because the households started with an already low baseline CF, which made it technically impossible to reach the target due to lack of available action cards. The ‘forced’ scenario Sim2 resulted in a median reduction of 48% of the total baseline CF (food: 56%, housing: 49%, mobility: 59%, other: 14%). In the food sector more than half of households’ total reductions (56%) was made during the voluntary scenario (36% in Sim1, 20% in Sim2). In the mobility sector, more than half of their total reduction (59%) was made during the forced scenario (26% in Sim1, 33% in Sim2). Substantial CO
2e reductions in the mobility sector during Sim2 were due to the yearly CO
2e reductions in the commodities Plane (53%) and Car (70%) travel. In the housing sector households’ reductions in Sim2 were primarily caused by cutting their consumption of the commodity Heating by 76% (see
Tables S2 and S5 (Supplementary Files: Tables spreadsheet)).
3.3. Reduction Potential and Mitigation Choices
In this chapter, action cards chosen during the voluntary scenario (Sim1), and/or during the forced scenario (Sim2) are described as, for example, Insulate roof/attic (Sim1: 30%, Sim2: 52%). This translates as follows: In Sim1, 30% of the households who had the possibility to choose this action, chose it. After Sim2, 52% of the households that had the possibility to choose this action, had chosen it either during Sim1 or during Sim2.
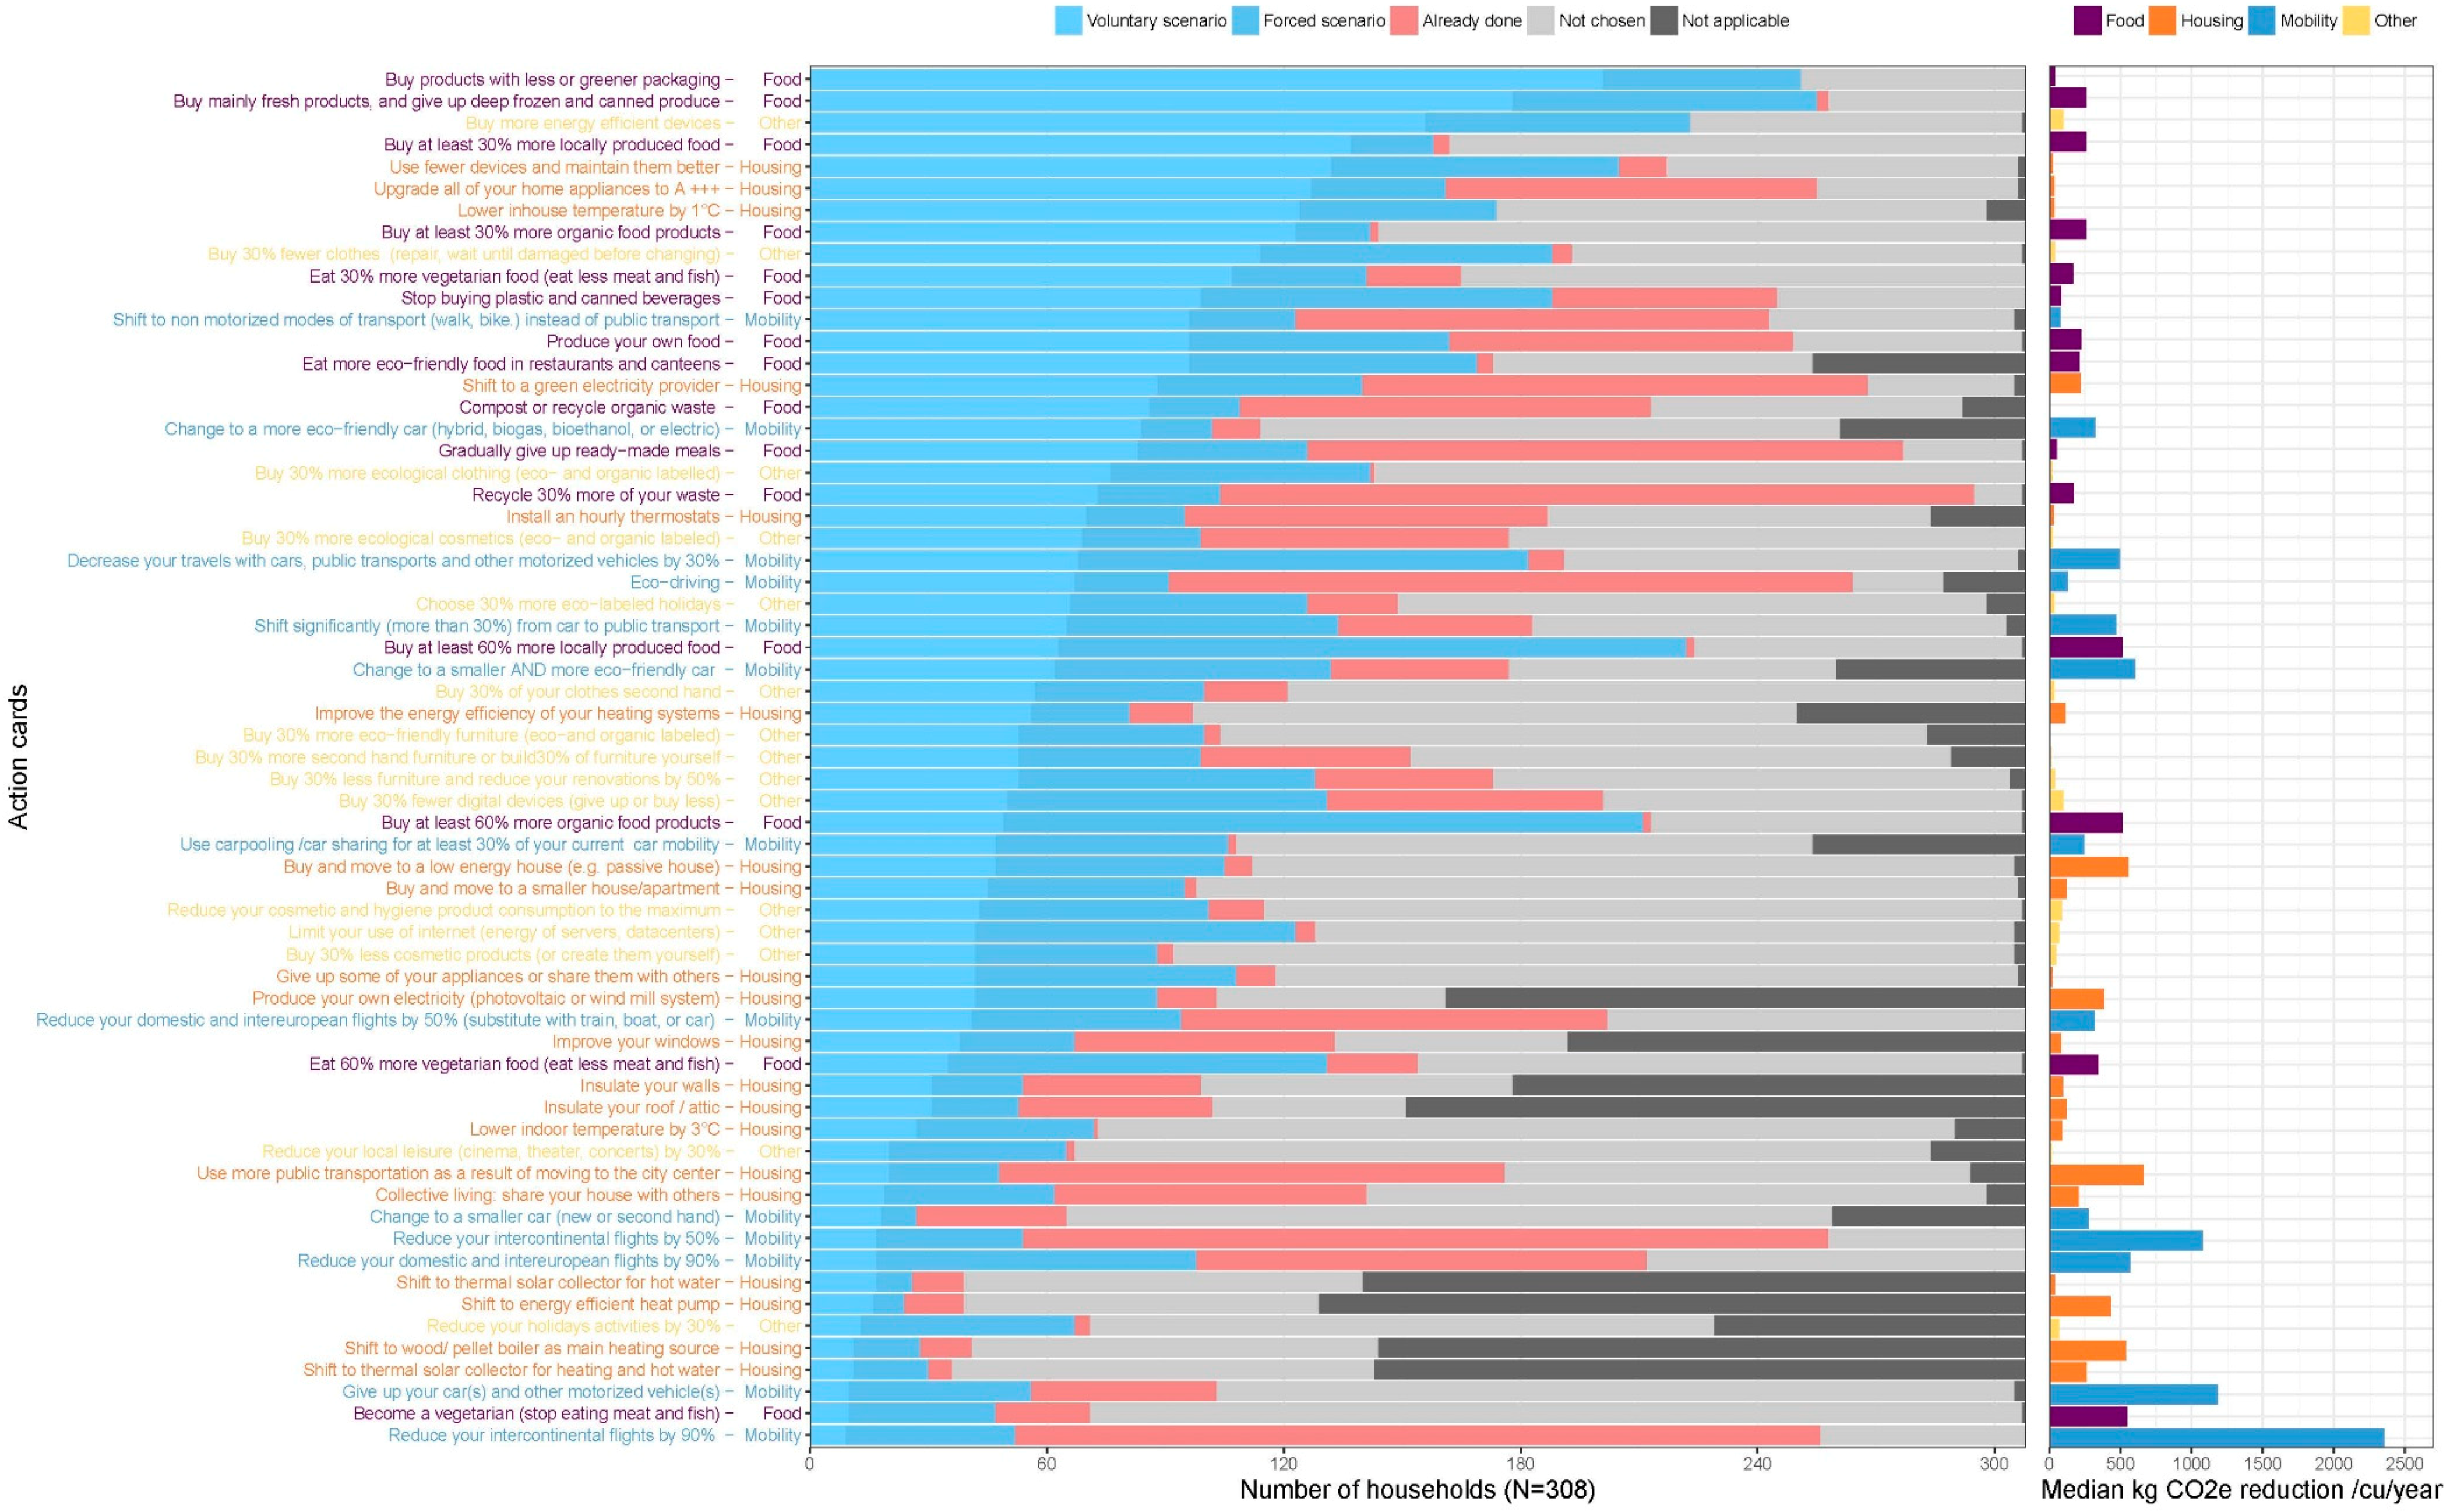
Figure 3 shows the number of households that either: Chose an action during Sim1 (light blue), chose an action during Sim2 (mid blue), did not chose the available action (grey), could not chose the action either because they already did it (red), or because it was not applicable (black).
Figure 3 shows actions ranked by decreasing “popularity” based on selection in Sim1. Furthermore, in the right-hand panel it depicts the corresponding median CO
2e reduction potential per action across households. Actions H3.2 and H3.6 were not included because they were applicable to less than 10% (i.e.,
n 31) of the households. A frequency table with complementary information is found here (
Supplementary Materials: S2 spreadsheet).
Out of the top ten most chosen actions, half were linked to food. However, out of the top ten actions with highest reduction potential, half were linked to mobility, the sector that yielded most emissions and thus had the highest reduction potential. During the voluntary scenario (Sim1) none of the ten actions with highest reduction potential could be allocated amongst the 50% most chosen. Amidst the top 20 most chosen actions, half were linked to food and none had high reduction potential. These 20 actions combined would yield a GHG reduction of around 2 tons per CU per year, less than enough to reach the 50%-target for most households. The most popular action was Buy products with less or greener packaging (Sim1: 65% and Sim2: 82%) which together with the second most chosen—Recycle 30% more of your waste—(Sim1: 63%, Sim2: 90%), both food commodities, had a combined reduction potential of around 0.2 tons CO2e for a typical household. However, 64% of all households already recycled 90% of their waste and could thus not choose that action card. Amongst the least chosen actions, i.e., the bottom 20 (ordered after Sim1 result), the patterns were alike amid the four countries. The foremost finding was that the actions least chosen in all countries were very similar: Become a vegetarian… (Sim1: 4%, Sim2: 17%), Give up your car(s) (Sim1: 4%, Sim2: 21%) etc., reduce your flights [both European and international] by 90% (Sim1: 9%, Sim2: 50%), and most of the “Shift heating system”-actions (Sim1: 8–14%, Sim2: 20–22%) were bottom 15 in all countries. Most of these actions had high reduction potentials around and above half a ton CO2e per CU per year each. Regarding the action cards connected hot heating systems however, many households were found incapable of choosing these because they were renting an apartment that rendered the actions inapplicable.
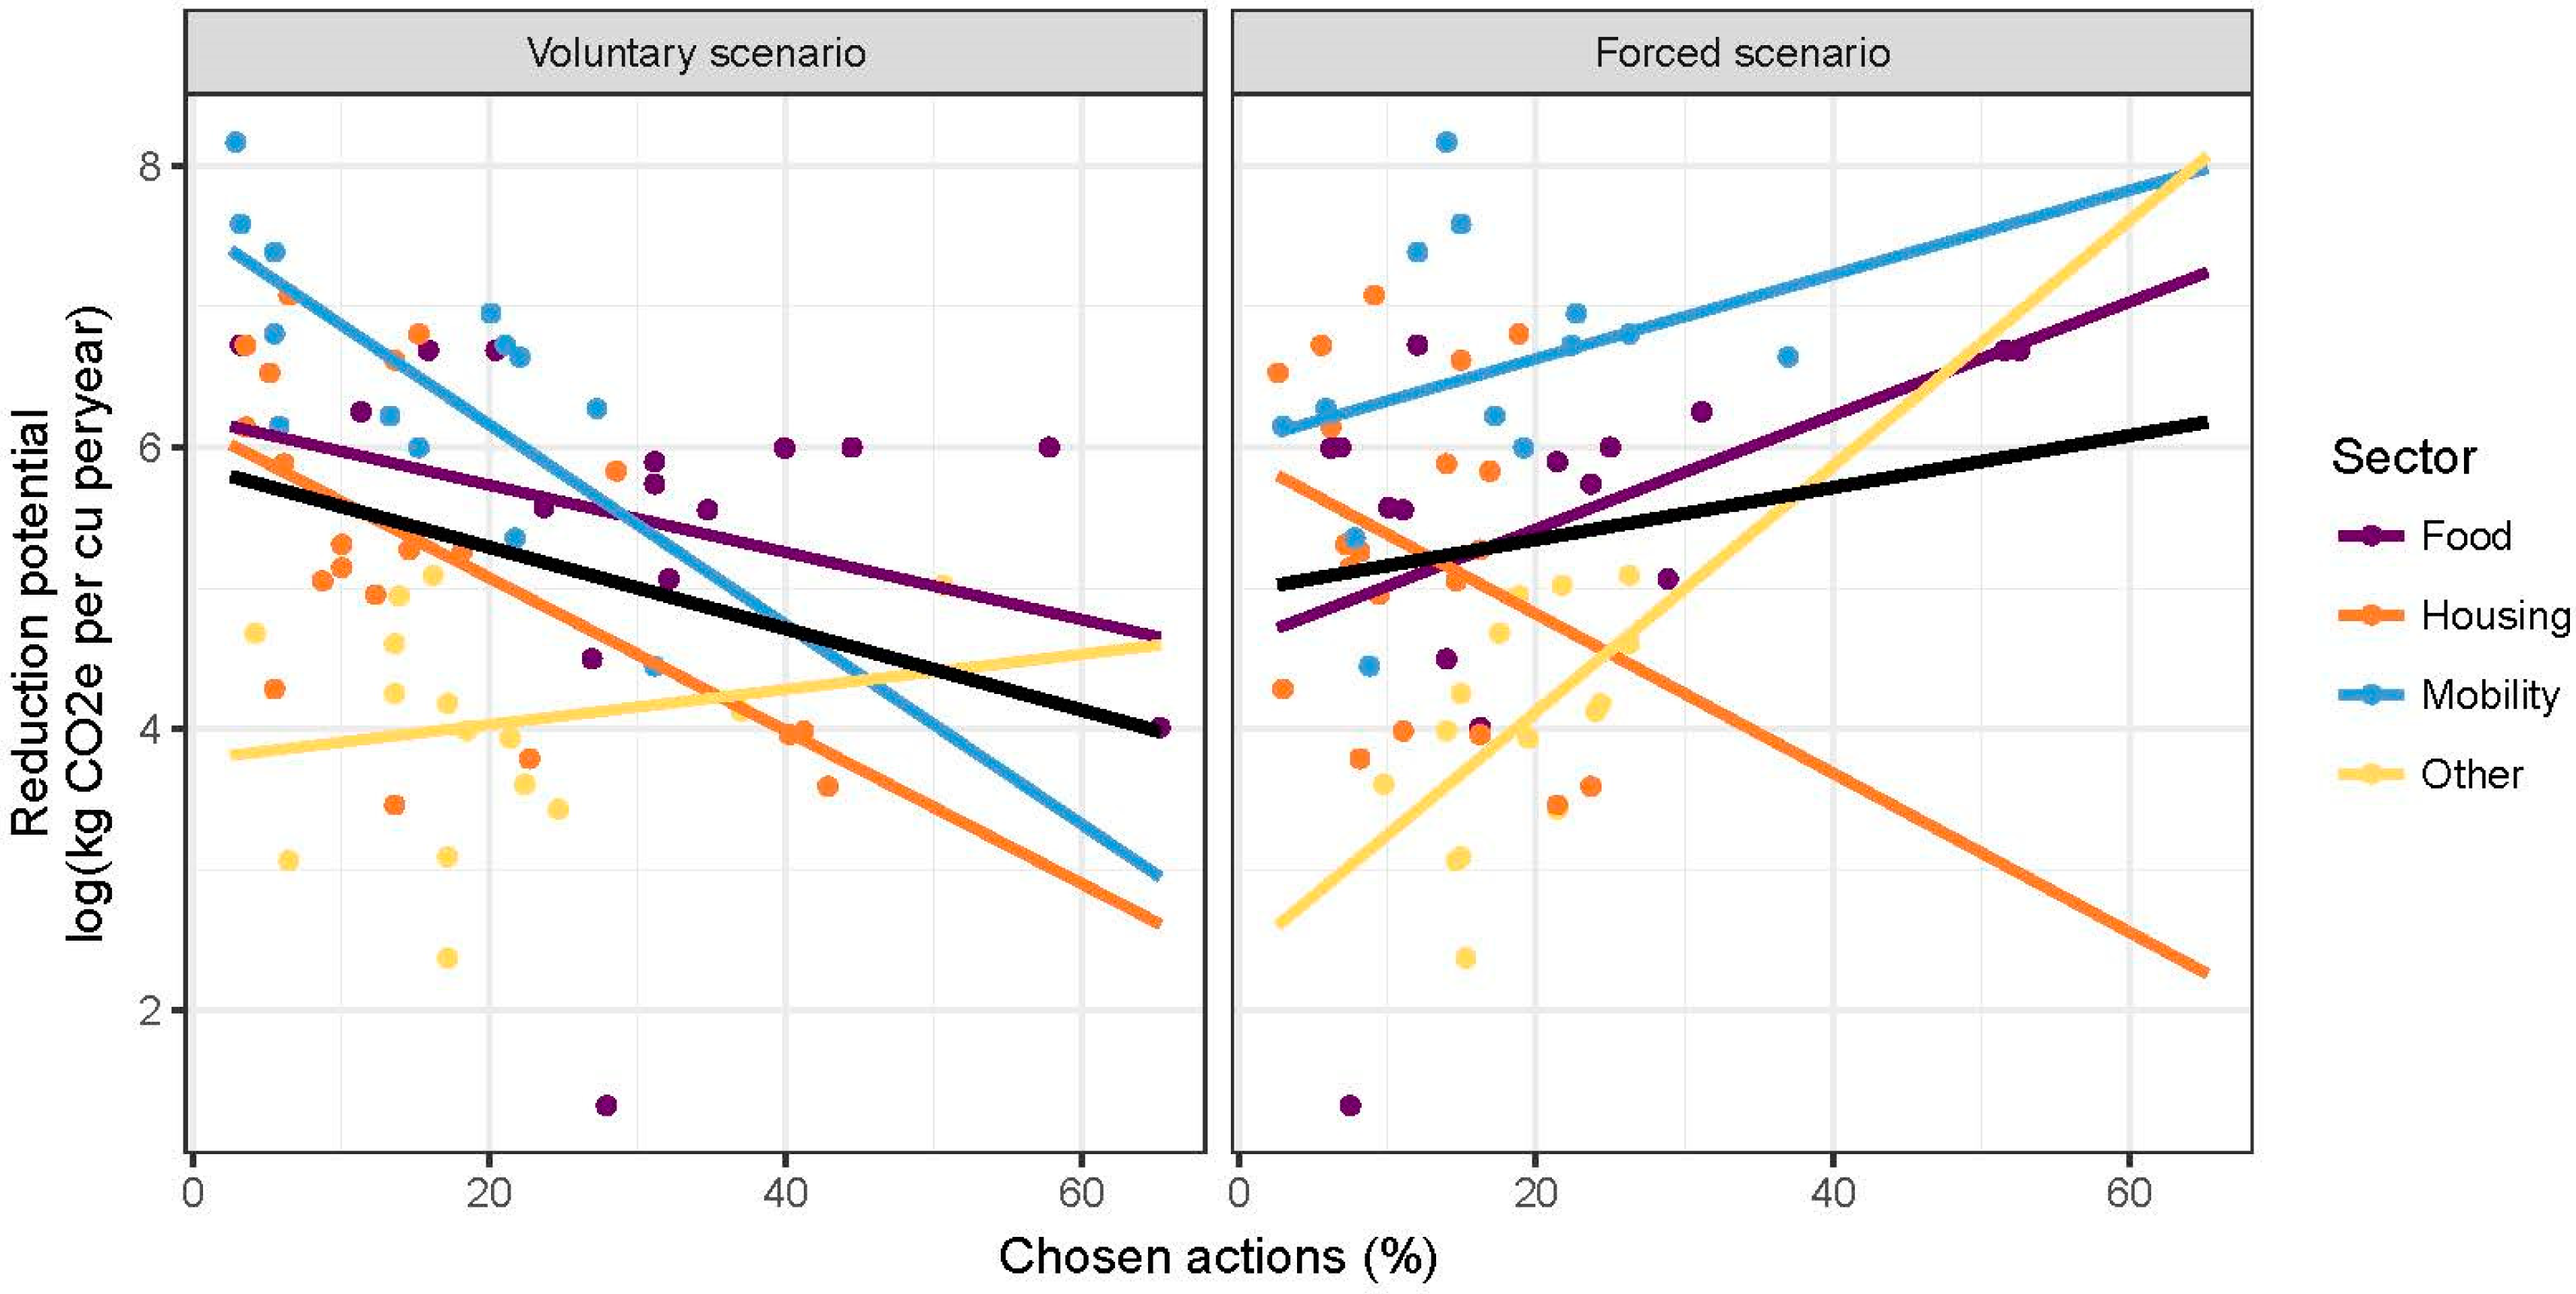
Overall, a negative association was found during the voluntary scenario (Sim1) between the frequency of chosen actions and their reduction potential (beta = −0.029,
P = 0.018). During the forced scenario (Sim2), the association was not present (beta = 0.018,
P = 0.297). Stratifying on household sectors, the association was mainly present in mobility and housing in Sim1 (beta = −0.071,
P = 0.006 and beta = −0.054,
P = 0.006 respectively). In Sim2, the null association was present in all sectors except in other consumption, where a positive association between chosen actions and reduction potential was observed (beta = 0.087,
P = 0.034) (see
Table S9 (Supplementary Materials: Tables spreadsheet)).
The pattern “the more popular the action, the less CO
2e reduction potential” as depicted for the voluntary scenario in
Figure 4, can be illustrated by example: Amongst the households that had the possibility to choose these actions, eco-driving was the most popular mobility measure, and buying an eco-friendlier car was chosen by 34% of households, yet only 4% were ready to give up their private car. Moreover, 38% of the households were willing to eat 30% more vegetarian food, but only 4% chose to become a vegetarian.
The median CO
2e reductions in the right-hand panel in
Figure 3 shows that many households would just have had to choose the top three action cards with the biggest reduction potential—reduce your intercontinental and European flights by 90%, and give up your car(s) and other motorized vehicle(s)—to reach the 50% reduction target. By choosing these three actions, a household would have reduced their CF by around 4.6 tons CO
2e per CU per year. Less, and around 20%, chose either of the two flight-related action cards during the voluntary scenario (Sim1), but when ‘forced’ to reach the 50% target during Sim2 half of all households had chosen either “−90% flights intercontinental” or “−90% flights Europe”. Furthermore, two thirds of the participating household had not taken any intercontinental flights in the last two years, and one third had taken no European flights. These households, therefore, did not have the option to reduce their plane-based emission, instead captured in the category “already done” (see
Figure 3).
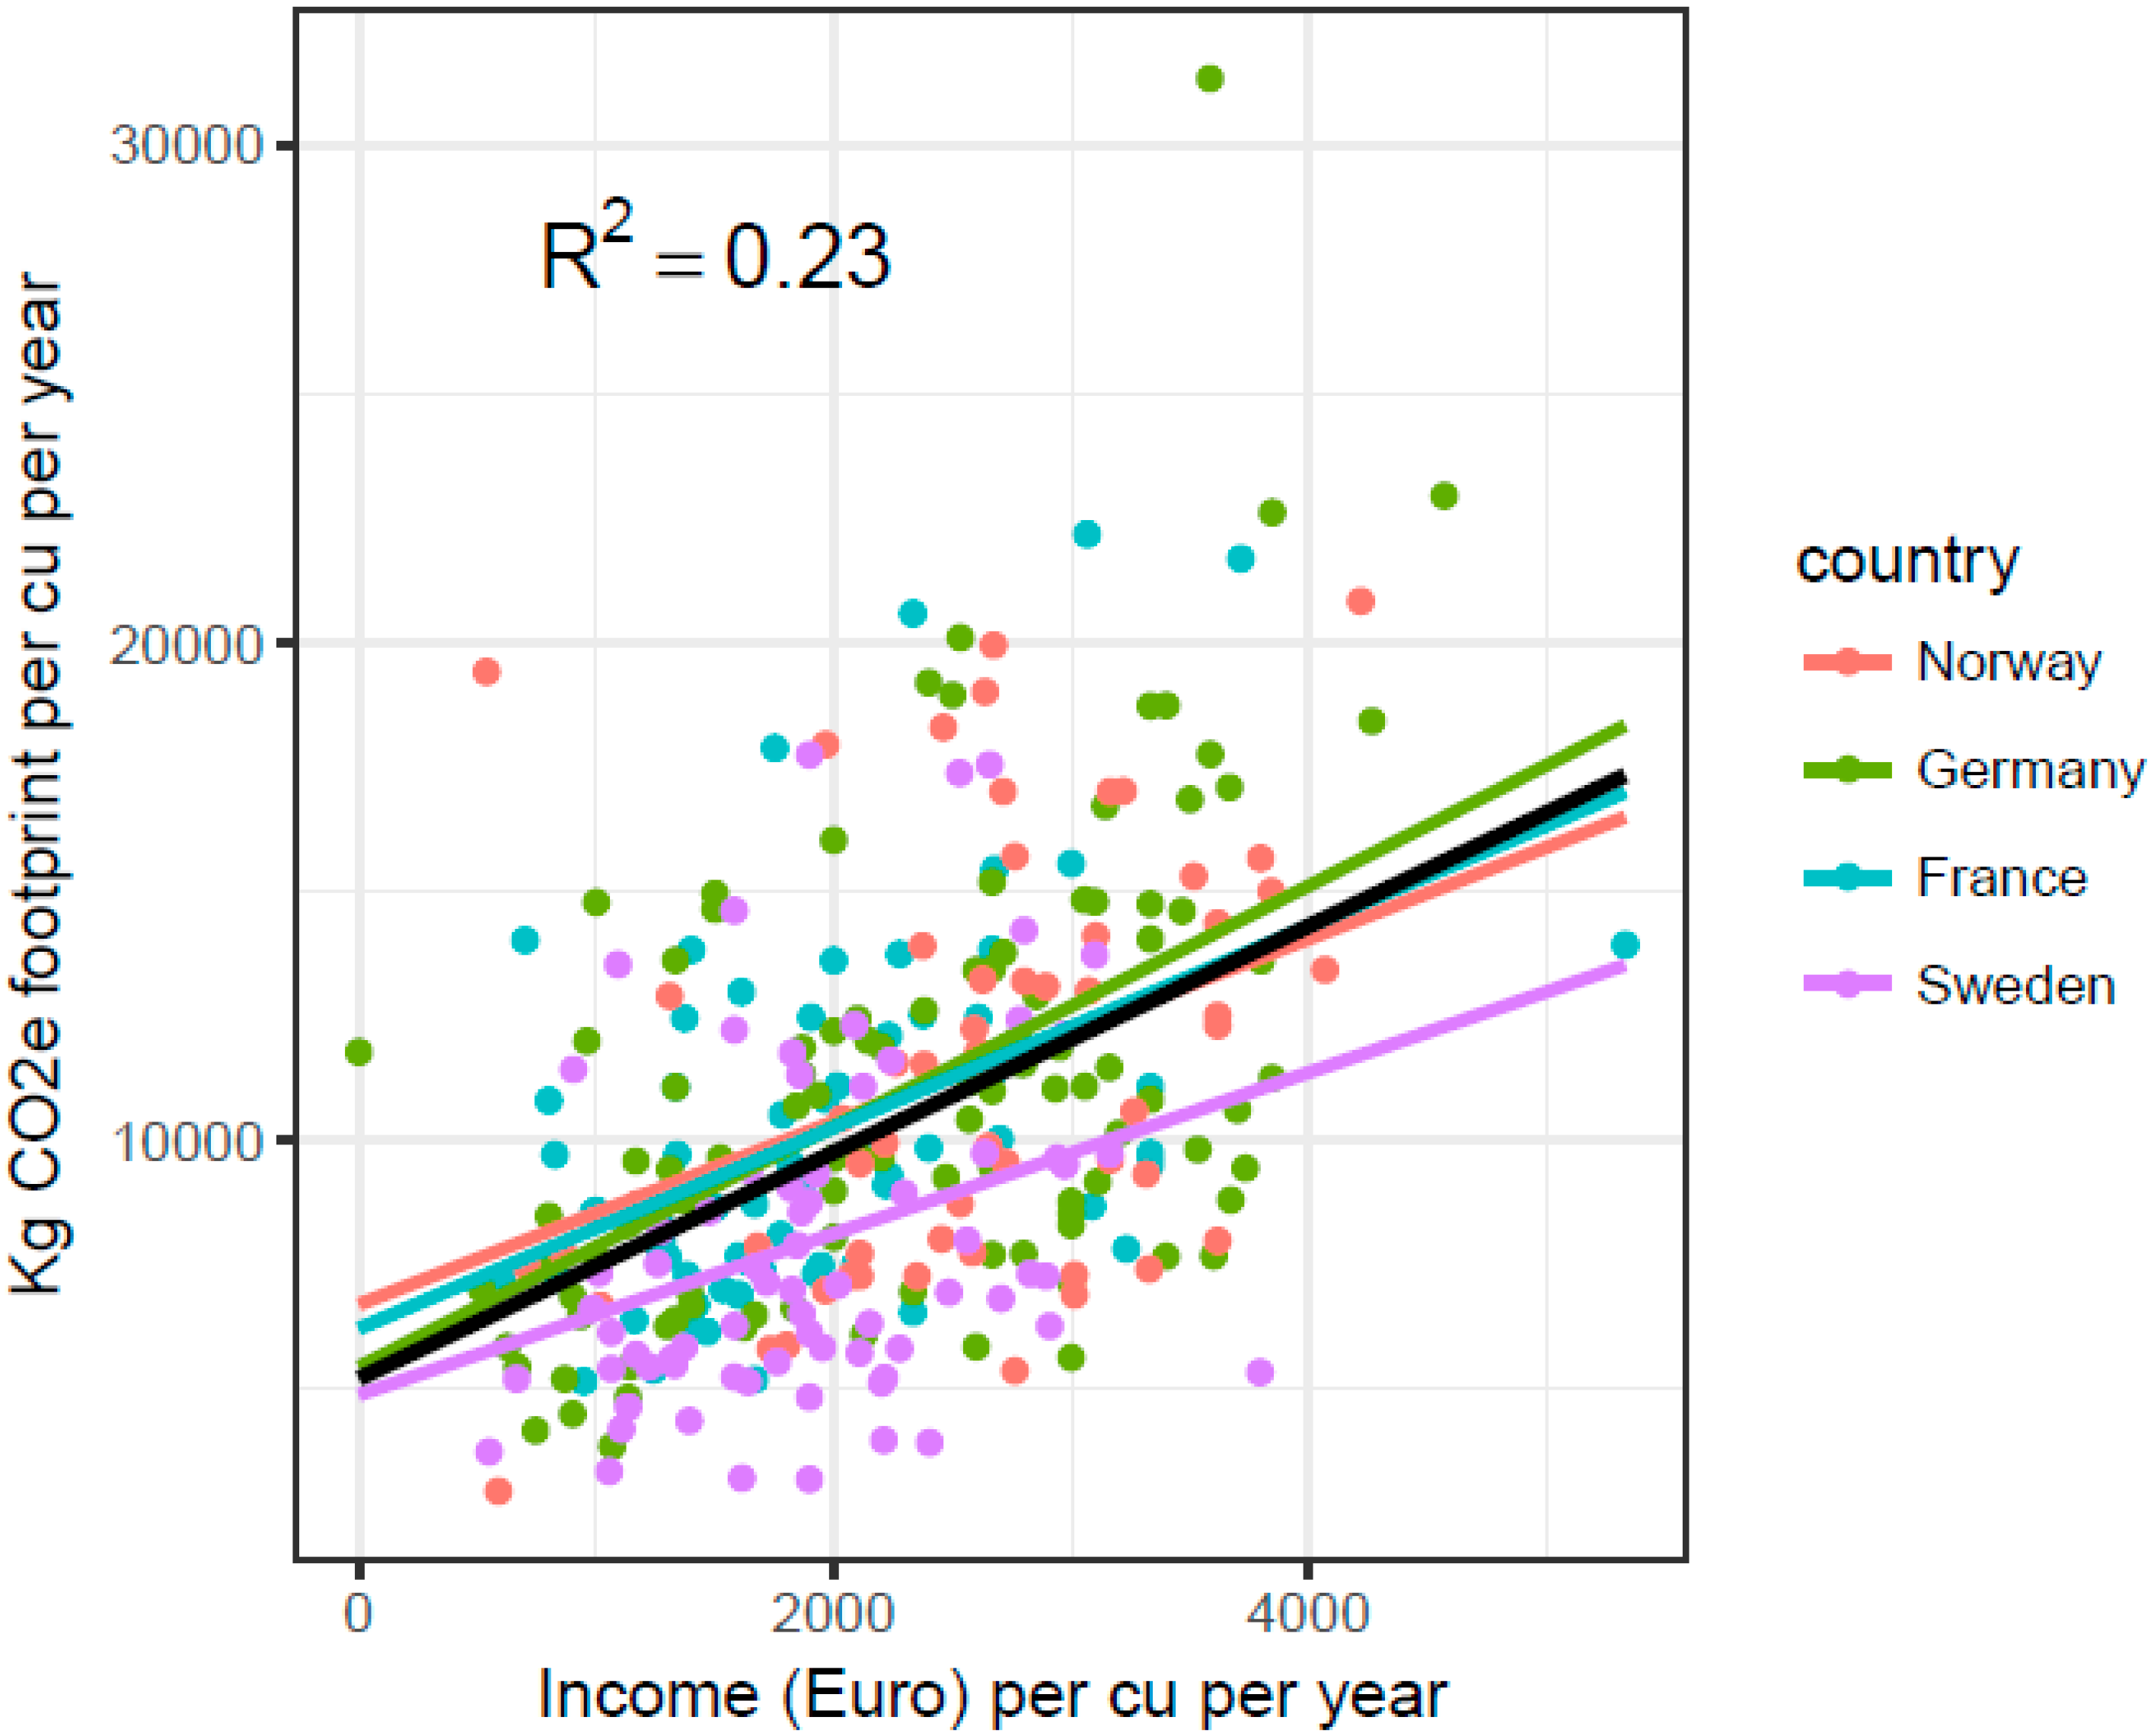
A strong association was found between baseline CF and household income per consumption unit (see
Figure 5). However, to illustrate the differences between households with low and high reduction potential and their choices of action cards, the population was split into quintiles of baseline CF by subcategories illustrated in
Table S10 (Supplementary Materials: Tables spreadsheet).
3.4. Patterns between low- and high Emitting Households Regarding Three Essential Mitigation Commodities
Table S10 (Supplementary Files: Tables Spreadsheet) shows the reduction potential for action cards related to the commodities Plane, Car and Meat consumption, the three items isolated in this study as particularly important for household mitigation based on their high reduction potential.
The baseline CF scores showed a wide discrepancy between quintiles in mobility and food. For instance, the commodity plane’s median CO2e emissions per consumption unit and year ranged from zero tons in the first quintile to 3941 tons in the fifth quintile, whereas the range for meat and fish consumption reached from 328 to 675 tons in the first and fifth quintile. The share that the commodities car and plane contributed to baseline CF in mobility was immense (up to 85%), however less so regarding fish and meat (less than 30%). The reduction potential i.e., the maximum amount of CO2e that could be mitigated by choosing action cards (median values) followed similar patterns to that of the baseline variables.
The observed reductions (kg CO2e per CU per year) from the voluntary scenario (Sim1) showed median values of zero in all quintiles for plane, which implies that these actions were unpopular even though the reduction potential was substantial. A small and incremental increase in reductions between Q1–Q5 was observed for car, with the exception of Q4. Meat and fish reductions held the highest reduction potential for low-mitigating households in absolute numbers, but showed little reductions in the voluntary scenario. However, the low-emitting households (Q1–Q3) reduced their meat consumption more than the high-emitting households (Q4–Q5).
The forced scenario (Sim2) yielded high reductions in plane and car, as well as in fish and meat. In absolute values, a clear increase in reductions was observed the higher the quintile for all variables during Sim2. However, for car and plane, the observed reductions, relative to baseline values and reduction potential, showed an opposite pattern where the lowest quintile (Q1) reduced twice as much as the highest quintile (Q5). Regarding meat and fish, on the other hand, the higher the quintile, the more households mitigated both in absolute and relative terms in relation to the reduction potential and baseline values.
Lastly, the total reduction (all 63 variables included) achieved by households during both simulations did not vary much between quintiles (20–28%) after Sim1 and (46–50%) after Sim2, however, in absolute values (kg CO
2e per CU per year) the differences between Q1 and Q5 were considerable e.g., If Q5 would have mitigated as much, in percent, as Q1, they would have reduced their CF by an additional 800 kg CO
2e per CU year (see
Table S11 (Supplementary Materials: Tables spreadsheet)).
In conclusion, low emitting households reduced more of their household’s emissions than the high emitting households, with the exception of meat and fish consumption.
5. Conclusions
In this study, we found that individuals were less likely to undergo lifestyle changes with large effects on their current carbon emission levels (e.g., less flying or meat consumption). This suggests that public policies need to focus at making households reduce their private carbon emission intense consumption in order to reach EUs 1.5, and 2 °C target. Participants in this this study chose their actions rationally and expectedly, as previous research has pointed out by first reaching for the “low hanging fruit”. They would not voluntarily mitigate GHG emissions by more than 25%, but will likely be able to go this far provided appropriate incentives. To adjust for the diversities among low/high-emitting households and their different mitigation preferences, stakeholders should look for systems that take this into consideration such as, for example, policies adjusted for household emission levels, and demographics. Based on the results in this study, it can be concluded that policies need to specifically focus at making households—by means of facilitating collective actions—reduce their consumption volume of private flights, car usage, and meat consumption in order to reach EUs 1.5, and 2 °C-target, while at the same time keep supporting households with policies that increases incentives to improve the efficiency of their everyday consumption.

 ,
, 


