Article

Do Consumers Care about the Energy Efficiency of Buildings? Understanding Residential Choice Based on Energy Performance Certificates

1
Technology Management, Economics, and Policy Program, Seoul National University, 1 Gwanak-ro, Gwanak-gu, Seoul 08826, Korea
2
Department of Global Business, Changwon National University, 20 Changwondaehak-ro, Uichang-gu, Changwon, Gyeongsangnamdo 51140, Korea
3
Erasmus School of Economics, Erasmus University Rotterdam, P.O. Box 1738, 3000DR Rotterdam, The Netherlands
*
Author to whom correspondence should be addressed.
Sustainability 2018, 10(11), 4297; https://doi.org/10.3390/su10114297
Submission received: 25 October 2018 / Revised: 11 November 2018 / Accepted: 16 November 2018 / Published: 20 November 2018
(This article belongs to the Section Economic and Business Aspects of Sustainability)

Abstract

:
Disclosing the energy performance information for buildings has been expected to become an important policy for controlling energy demand and reducing CO2 emissions, but its effectiveness remains controversial. This study investigates the effect of energy performance information on consumer residential choice by using a discrete choice experiment in South Korea. The estimation results confirmed that the energy efficiency level of the given housing has a significant effect on consumer residential choice when the related information is actually delivered. Combined with evidence from the simulation study, we suggest that obligating the owners to provide energy performance information to potential buyers/tenants would be necessary for enhancing the use of the information during the consumer decision-making process. Additionally, the simulation result implies that the effectiveness of the policy can be underestimated by the price premium related to energy efficiency. Therefore, we suggest that the government should control the price premium for high-efficiency buildings at the early stage so that the policy related to disclosing the energy performance can be on track.

1. Introduction

Managing energy demand has been one of the major global tools for reducing greenhouse gas (GHG) emissions to meet the goals of the Paris Agreement (In the Paris agreement, the EU and its members have agreed to a goal of keeping the increase in the global average temperature to well below 2 °C above the preindustrial level binding target to decrease the 1990 GHG emissions by at least 40% by 2030 [1]). Specifically, reducing energy use in the building sectors has become a critical issue for governments because approximately one-third of global GHG emissions are due to building-related energy consumption [2,3]. According to a report by the European Union (EU), the household sector consumed approximately 413 Mtoe of energy and became the second-largest energy consumption sector, accounting for 25.4% of the total final energy consumption in 2015 (Transportation, industry, services, agriculture and other sectors make up 33.1%, 25.3%, 13.5%, 13.6%, 2.2% and 0.5% of emissions, respectively). [4]. In South Korea, the commercial and residential building sector accounts for 23% of the carbon dioxide (CO2) emissions in the nation, and it has become the sector that produces the greatest emissions [5]. Thus, constructing more energy-efficient and climate-friendly buildings can contribute greatly towards reducing GHG emissions.
Many governments have designed and implemented various policies and regulations to promote the construction of energy-efficient buildings to encourage lower energy use in cities [6]. Among the options, the most popular policy is the energy performance certificate (EPC), which was introduced by the Energy Performance of Buildings Directive (EPBD) of the EU. South Korea introduced the Disclosure and Utilization of Building Energy Performance (DUBEP) as a form of EPC in 2013. The EPC aims to contribute to a CO2 reduction in the following two ways: (i) increasing building retrofits by providing explicit information about the energy consumption status quo to building owners/occupants, and (ii) inducing changes in the residential demand by giving reliable information on the energy performance of buildings to potential buyers/tenants [7,8].
However, the influence of the EPC has yet to come to fruition and has created a great deal of controversy among researchers and policymakers [9]. According to the research of Lainé (2011) [10] and Amecke (2012) [8], the EPC has little impact on residential choice. Among buyers, 44% received the EPC information, and only 18% of them used the information in their buy/rent decision [10]. Conflictingly, some research insists that the EPC information might overcome imperfect residential information and raise awareness about responsible energy use [11,12]. Substantial research has been dedicated to examining the direct relationship between the EPC and the housing value, indicating a need to follow up on the progress of this policy [13,14,15,16,17].
Most studies relating to EPC effects have primarily been focused on building retrofits and dwelling construction [18,19], only emphasizing a part of the residential market without considering rental housing [8,9]. In addition, they neglected the fact that consumers make their residential choices by making a trade-off between energy performance and other residential attributes. They also did not consider the information acquisition itself, regardless of the content of the information (i.e., energy performance) [20,21]. Because consumers intrinsically tend to acquire information to reduce or eliminate the uncertainty associated with their purchasing decision [22], the value of the information acquisition should be considered as an attribute of choice. Oaksford and Chater (1994) [23] insisted on the importance of information provision by demonstrating that obtaining information leads to a reduction in uncertainty. Thus, the impact of information provision should be measured separately from the content of the information.
Therefore, this study aims to investigate how the information obtained through DUBEP is reflected in the residential choices made by potential consumers in the South Korean housing market. By applying the discrete choice experiments, this study estimates the values that consumers give to residential housing, including the effects of the EPC information itself. Some policy implications can also be derived from empirical analysis and simulation studies.

2. Background

2.1. Overview of Policies Based on Building Energy Performacne Certificates

Beginning with the UK’s Environmental Assessment Scheme in 1992, a vast number of building energy performance or environmental assessment policies have been used across the world. The EU established the EPBD in 2002, and it has required that an EPC be attached to all transactions involving buildings since 2006. However, not all member states have accepted this policy as an obligation, and thus the percentage of transactions for which a valid EPC is shown to the prospective new tenant or buyer varies from under 10% to 100% (EU members who 100% satisfy the requirement of EPCs for sold and rented buildings: Greece, Spain, France, Hungary, Italy, Lithuania, and Slovakia [24]). The US also has a green building certification, which is a self-regulation program developed by a voluntary and non-profit private organization, the US Green Building Council (USGBC). Table 1 summarizes some major EPC policies.
The Korean government also started its own building energy consumption certificate system, in 2013. The Building Energy Assessment (BEA) charges the homeowners of any apartment that consists of over 500 residential units to provide information of how much energy the house consumes and requires. The BEA provides some information such as the building energy efficiency level, the amount of CO2 emissions, and the building energy consumption and requirements. In South Korea, the building energy efficiency levels consist of 10 total grades from Grade 1+++ to Grade 7, as shown in Table 2. The amount of CO2 emissions indicates the gas emissions during operations and activities, such as the combustion of fossil fuels to provide heating, cooling and lighting. Energy consumption refers to the actual amounts of energy consumed by residents for the past three years. The building energy requirements cover the heating and cooling, lighting, water boiling, and ventilation, and they were calculated in building system segments.
The intention of the original policy was to oblige homeowners to provide the buyer/tenant with all information, including the EPC, when the house was sold or rented. However, instead of making a mandatory rule, the Korean government chose to make available the energy performance data of housing units in buildings that contain over 300 units to the public online at all times as of 2016 (Energy consumption and efficiency level data are provided in partnership with estate portals such as Green Together [32], Naver Real Estate [33], Real Estate 114 [34], and Minwon 24 [35]), and they renamed it the DUBEP. This decision was based on the intention to deregulate real estate speculation and improve the utilization of building energy efficiency information [36]. The currently provided EPC based on the DUBEP is shown in Table 3. Column 1 and 2 in Table 3 represent the designed performance of the building, and column 3 & 4 represent the actual energy performance of the consumers.
The ultimate aim of these environmental assessments, including the DUBEP system, is to establish a virtuous cycle between real estate demand and the supply sector, encouraging consumers to rent or buy more energy-efficient buildings so that more energy-efficient buildings are voluntarily supplied. Thus, understanding the impact of EPC information on consumer preferences during residential choice is necessary to provide guidelines for enhancing the policy and contributing to higher public acceptance.

2.2. Literature Review

While the EPC and the relevant policy have been in place for more than 10 years, there is a great deal of debate and controversy regarding the effectiveness of the policy [8,9,10,18,19,37,38]. Dascalaki et al. (2012) [37] present the status of the EU Directive on the energy performance of buildings in Greece, emphasizing some practical difficulties related to implementation. Murphy (2014) [9] analyzes the impact of the EPC on Dutch private dwelling buyers, and Amecke (2012) [8] investigates how much the EPC influences real estate uses (i.e., sale and rental market transactions) in Germany. These studies conclude that the EPC has played a limited role in purchasing decisions and has been less effective than expected in the beginning. Lainé (2011) [10] even states that the EPC has little impact on residential choices due to insufficient information and policy communicability. By contrast, some studies have emphasized that the EPC has a positive impact on consumers including home owners and tenants [18,19,38]. Bull et al. (2012) [38] insist that a building energy certificate is a tool for behavioral change, and that it has a positive impact on the energy consumption of public buildings in Europe. As for homeowners’ or landlords’ perspectives, Comerford et al. (2018) [18] show evidence that the EPC has potential to induce the consumers to retrofit the house in England. Van Middelkoop et al. (2017) [19] also show that the consumers in the Netherlands who are well indicated to have knowledge of EPC allow their landlords to implement more measures to improve the energy performance of buildings.
As another positive impact on the appearance of the resultant of EPC is a price premium. By investigating the impact of EPC on house price, some studies have found that the price premium is positively related to a higher EPC level [16,17]. Fuerst et al. (2016) [16] conclude that in the UK there are positive price premiums for houses in higher efficiency rates (A/B and C), and there are discounts for lower efficiency rates (E and F). Hui et al. (2017) [17] shows that prices of energy certified buildings are 4.4 percent higher than those of non-registered buildings in Hong Kong.
Although many studies have focused on building energy performance and related policies, only a few studies have attempted to analyze consumer perceptions of energy-efficient buildings [20,21,39,40,41,42,43]. Hoffman and Henn (2008) [39] and Yau (2012) [40] demonstrate that consumers are affected by several factors when deciding to move into energy-efficient buildings, such as economic or/and psychological reasons. Encinas et al. (2018) [42] and Liu et al. (2018) [43] investigate the consumers’ willingness to pay for energy efficient buildings, and both conclude that people tend to pay more for higher level of energy efficient buildings. Chau et al. (2010) [20] apply discrete choice experiments to identify the factors affecting the preference for energy-efficient buildings in Hong Kong. Similarly, Luo et al. (2017) [41] analyze the green building market from a consumer perspective based on conjoint analysis. Four attributes such as the energy types (green energy or conventional energy), IEQ (indoor environmental quality), construction material, and price are considered here. Even though they represent the preference for green buildings from consumer perspectives, there is no evidence that these attributes affected the actual residential choice because of the availability and acceptance of the building information. For example, some attributes such as the annual energy consumption and monthly management fees in Chau et al. (2010) [20] are actually unknown, unless the information is given to the tenant/buyer directly. Likewise, Carroll et al. (2016) [21] include the building energy rating as an attribute in residential choices to estimate the consumers’ willingness to pay. However, it is difficult to define that they have confirmed the effect on energy efficiency information itself since the efficient-rating information is assumed to be provided to consumers. As Carroll et al. (2016) [21] suggested, asymmetric information regarding energy efficiency would lead consumers to make suboptimal decisions.
To summarize, most of the previous studies did not identify the influences that the EPC-related policy exerted over the overall housing market. In addition, none of these studies consider the obtainability of the energy efficiency information as an attribute of consumer residential choice when examining the effect of the EPC on the housing market in reality. Therefore, this study is intended to analyze the individual preferences on residential choice as affected by EPC information and derive the policy implications.

3. Method

3.1. The Design of the Discrete Choice Experiment

Because the DUBEP policy was recently initiated, there is insufficient data to analyze the consumer residential choice. Hence, this study uses data on stated preferences. There are several methods to gather the stated preference data. One of approaches is contingent valuation method (CVM), which is directly asking the consumers their willingness to pay [42,44]. Although the CVM is a simple and easy to conduct, it presents a weakness by suggesting the existence of either overestimate or underestimate of the true values. Another approach is the discrete choice experiment. Discrete choice experiments require the respondents to repeatedly choose the most preferred alternative from different sets of profiles, which consist of the core attributes with their levels [45]. Not only does it allow examining the values of each attribute as impacts of choice, many studies have proved that the discrete choice experiment method has advantages over CVM [46,47]. To examine the effect of the DUBEP, this study identifies attributes that are relevant to the energy efficiency of buildings as well as factors affecting consumer residential choice.
In reality, consumers change their residence for different reasons [48]. They might move to a different area to enter school, get a job or move to other houses in the same area due to their dissatisfaction with their current housing conditions. Additionally, they might move to a suburban district to experience a new living environment or purchase a more affordable house in the outskirts of metropolitan cities. Factors affecting the house selection may vary depending on consumer intentions. As a consequence, the choice situation should be controlled during the choice experiment to assess the effectiveness of the energy performance certificate policies. Therefore, this study controlled the residential choice situation by assuming that respondents would make a decision among houses under similar living conditions in relation to the status quo. For example, respondents living in a rental house should imagine that they are continuing to choose the most preferred rental house from the available sets in the same area and with a similar size to the house they currently live in. Based on this assumption, respondents can focus on trading off on the values of conventional housing attributes and EPC information. The designated attributes for residential choice are shown in Table 4.
The first five attributes are major factors in consumer residential choice, as referenced by several studies [48,49,50,51,52]. The first attribute is the relative housing price compared to the current price of a house. Because the housing price varies by the residential areas of each respondent, the relative housing price is applied instead of using the real price value. By taking this approach, we can consider and control the differentiation of the respondents. Thus, the survey presents the relative housing price at three levels, −10 percent, 0 percent, and 10 percent. Later in the calculation, these values are turned into each respondent’s real housing price value, which is collected from the survey.
One of the most crucial factors when purchasing a house is deciding how long it takes to commute to work. To apply this factor, the second attribute is the average commuting time. According to an OECD report (2014) [53], the daily average commuting time in Seoul is approximately one hour. Based on this value, this study lists three levels for the commuting time, namely 30 min, 1 h, and 2 h at the most. Respondents who do not presently work were asked to answer the survey by considering the situation of family members who do.
The third attribute is the average walking distance to access public transport systems. Kim et al. (2005) [32] suggested that the housing price, the average commuting time and the walking distance to public transportation are the most significant factors for consumers when they purchase their house. According to a report by the Korea Transportation Safety Authority (2016) [54], the average walking time to first access public transport is 8.9 min in Korea. In addition, assuming an average walking speed of 4 km/hour, most transit users tend to walk 6 to 12 min to access public transport [55,56]. If individuals have to walk more than 20 min to access the public transport station, they are unlikely to use public transit. Thus, we represented the attribute levels to make sure that respondents consider the walking distance to access the public transport system as follows: Within 5 min, 10 min, and 20 min.
The fourth attribute is the building age, representing the elapsed time since the building’s construction. Consumers tend to prefer new buildings, and thus the age of the building would affect the residential choice. Considering the fact that a building reconstruction cycle is normally approximately 15 years in South Korea, the levels of this attribute are set as less than 2 years, 10 years, and 20 years.
The fifth attribute is the average walking distance to schools (i.e., elementary, middle, or high school). According to Lee and Lee (2013) [52], the consumer places more emphasis on the walking distance to public transportation rather than the distance to schools when they purchase the house. However, that study focused only on new apartments, which were not yet sold; thus, it is necessary to include this variable to check whether their findings still hold up in relation to general housing decision-making.
The sixth and seventh attributes are the most essential variables in this study. To capture the effectiveness of the DUBEP, both attributes must be scrutinized. The sixth attribute, “Obtaining information related to building energy consumption,” is whether the EPC information is obtained, so the utility function takes the EPC information into account. Because the EPC is not a mandatory requirement upon the sale or leasing of commercial and residential properties, consumers have to search information about the EPC by themselves. In other words, without being given this sixth attribute, the consumer never knows the building efficiency level, which is indicated as the seventh attribute. Therefore, measuring the value of the information itself is an inevitable step to analyzing the actual consumer preference for the DUBEP.
The seventh attribute demonstrates the level of the building’s energy efficiency. Although the EPC provides both energy requirement and consumption information, this study focuses only on the energy requirement information because consumption information cannot be provided for new buildings. The attribute levels of energy efficiency are defined by the efficiency rating that is provided for all buildings, regardless of the building age. Even though there are ten rates of building efficiency in all, displaying all ten of them may lead the respondents to be confused about their preferences. According to Ratcliffe and Longworth (2002) [57], the respondents tend to put more emphasis on the specific attributes that have a large number of levels. Hence, it is desirable that the choice experiment should be composed of a similar number of levels for each attribute. This study acknowledges this issue by reconstructing the ten rates of building efficiency into three levels, which are the high, moderate, and low grades for building energy efficiency levels.
According to the Ministry of Trade, Industry and Energy (2007) [58], the average annual energy requirement per unit volume of space for a residential building is approximately 218.1~248.3 kWh/m2·year. Kim and Cho (2012) [59] also estimated its value as 253 kWh/m2·year. These approximate values have an approximately building energy efficiency level of 3~4. Thus, this study set the building efficiency 1+++~2 level as “high”, 3~4 as “moderate”, and 5~7 level as “low” levels of energy efficiency. At the beginning of the survey, the respondents were fully informed about the DUBEP grades corresponding to each attribute level. Moreover, to increase consumer understanding of the attribute levels in the actual questionnaire, the average energy requirement relative to the moderate grade was provided for each level in terms of energy payments and the amount of CO2 emissions based on the average residential area (i.e., 83 m2).
The combination of attributes and their levels in Table 3 gives 972 alternatives. Because it is difficult to show all 972 alternatives to each respondent, the fractional factorial design method is applied to choose 32 alternatives, dividing them into 8 choice sets that include 4 alternatives. The respondents were asked to choose the most preferred one among 4 alternatives. Table 5 shows a part of the actual choice sets.

3.2. A Mixed Logit Model

This study uses the mixed logit model to analyze consumer preferences in relation to residential choice within the DUBEP system. The mixed logit model is highly flexible to approximate any random utility [60]. According to the random utility theory, the indirect utility of alternative j (j = 1, …, J) for respondent n, Unj, consists of a deterministic component Vnj and a random component εnj with the joint probability density function f(εnj). The deterministic component of indirect utility (Vnj) is assumed to be a function of the attributes (Xnj) and their coefficient vector (βn), as follows:
V n j = X j , p r i c e ( β n , p r i c e + β n , R e g i o n 1 D n , R g i o n 1 + β n , R e g i o n 2 D n , R g i o n 2 )     + β n , c o m m u t e X j , c o m m u t e + β n , t r a n s p o r t X j , t r a n s p o r t + β n , t i m e X j , t i m e + β n , s c h o o l X j , s c h o o l     + D j , i n f o ( β n , i n f o + β n , h i g h E D j , h i g h E + β n , l o w E D j , l o w E )
where Xj,price, Xj,commute, Xj,transport, Xj,time and Xj,school are explanatory variables that are represented as the real house price, average commuting time, walking distance to public transportation, building age, and walking distance to the nearest school, respectively.
In Equation (1), Dn,Region1 and Dn,Region2 are the dummy variables for the respondents’ residential areas, as follows: Region 1 (metropolitan region near the capital including Seoul, Incheon, and Gyeonggi-do) and Region 2 (metropolitan region such as Busan, Daegu, Gwangju, Daejeon, and Ulsan). By including interactions between the regional dummy variables and the price, this study takes regional differences into account based on Region 3 (non-metropolitan area) (Because there has been a vast divergence in housing prices across the different regions of South Korea, we separately analyze the preference by three regions: Region 1, Region 2, and Region 3. A special metropolitan city, Seoul, is included in Region 1 with the two other nearest areas, which represents the most populated area. Region 2 includes other metropolitan areas, and Region 3 represents a relatively less metropolitan and a sparsely-populated area in South Korea. Even though there has been controversy about whether an increase in the resident population will increase demand for home sales or not, it is an inevitable fact that there is a host of research directly aligning the population to rising house prices. On a regional basis, Region 1 has the highest average house price followed by Region 2 and Region 3). Dj,info is a dummy variable representing whether the EPC information for alternative j is provided or not. If consumers obtain the information, Dj,info equals 1, and otherwise, it indicates 0. Accordingly, Dj,highE and Dj,lowE are dummy variables representing high and low grades of building energy efficiency by setting the moderate grade as the reference level.
The mixed logit model can account for taste variations among consumers by assuming the evaluation of attributes with probability density f(β). When εn is independent and identically distributed (i.i.d.) with a type Ι extreme-value distribution, the choice probability of alternative j by consumer n can be expressed as follows [61]:
P n j = ( e β n x n j i e β n x n i ) f ( β ) d β  
In the mixed logit model, the researcher can specify the distribution for each coefficient according to its effect on consumer preferences [61]. Although the coefficients are generally assumed to have a normal distribution, a bounded distribution such as a log-normal distribution should be used for the coefficient of the variable, such as the price, in which all consumers tend to have similar preferences [62]. This study applies a normal distribution for all the coefficients except the real house price, which is assumed to have a log-normally distributed coefficient. The coefficients were estimated using Bayesian inference methods.
Based on the estimated coefficients, the consumers’ marginal willingness to pay (MWTP) can be calculated as the variation in the compensated surplus of consumers from changes in attributes. The MWTP indicates the amount of money that consumers are willing to pay to maintain their current level of utility when the level of an attribute changes by one unit. The MWTP of each attribute can be calculated as follows:
M W T P X j k = V n j / X j k V n j / X j , p r i c e = β n , k β n , p r i c e  
where Xj,price and Xjk represent the price and the attribute k other than the price, respectively.
The relative importance (RIk) of each attribute in a consumer’s ultimate choice from a series of alternatives can be determined by calculating the “part-worth” of each attribute through the following equation:
R I k = p a r t w o r t h K k p a r t w o r t h k × 100  

4. Estimation Result

4.1. Data

A survey required for the analysis was conducted by a specialized survey company, Gallup Korea, from August to September of 2014 in 15 metropolitan areas, including Seoul, on a thousand adults aged 20 to 69. Using face-to-face interviews, the survey with a total of 25 questions (i.e., demographic characteristics, prior knowledge of DUBEP, choice sets, etc.) was distributed to selected 1000 participants. The participants were selected by using a purposive quota sampling method. The purposive quota-sampling method is based on respondent’s the gender, age, and region to maintain a component ratio representative of the population in South Korea. Table 6 shows the characteristics of the respondents. Among 1000 respondents, we only used 942 samples by excluding those who did not answer the questions.

4.2. Results

Table 7 presents the estimated results of the mixed logit model, and all the coefficients are statistically significant. The coefficient of the housing price (βn,price) has a negative sign as well as two interaction terms (βn,Region1, βn,Region2), demonstrating the consumer tendency to prefer low-priced houses. Respondents in Region 1 are more sensitive to the housing price than people living in other regions because the housing price in this area is approximately double the nationwide value. Moreover, the respondents’ utility decreases as the average commuting time, building age and walking distance to public transportation and school increases.
The attribute of providing EPC information (βn,info) is indicated with the positive sign. This sign indicates that the consumer utility increases with the acquisition of information on the energy efficiency for a housing option, compared to no information. In addition, under the condition that respondents can check the EPC information, they prefer buildings with higher energy efficiency.
As mentioned earlier, this study provides the MWTPs and relative importance of each attribute to compare the effect of the attribute levels on the housing choice by residential areas. When the EPC information is given, the respondents in Region 1 have a relatively high willingness to pay for high building efficiency level (1+++~2 level), but they are less likely to avoid buildings with a low efficiency level (5~7 level). Notably, respondents in Region 3 are less willing to pay for the high efficiency level compared to other regions, but they have a higher willingness to pay to avoid less efficient buildings. In addition, the respondents in Region 3 have a high willingness to pay for most of the attributes listed in Table 8.
The last three columns of Table 8 represent the relative importance of all eight attributes. According to the estimated results, the respondents placed the greatest importance on the “price” when they chose the house. It is highly prominent in Region 1 compared to Region 3 due to the extremely high housing price. The average commuting time and building age are the next most important factors. These results coincide with the findings of numerous previous studies in Section 2.2.

5. Discussion

This study examined the effect of EPC on consumers’ residential choice, which is the aspect of housing demand in South Korea. In order to analyze the effect of DUBEP, three simulation studies are conducted based on the estimation results: (i) comparing the choice probability with and without information on the energy efficiency level; (ii) estimating the regional market share by efficiency grade when the EPC is available in all buildings; and (iii) predicting the change in choice probability for highly energy-efficient buildings by differentiating among housing prices. All simulations were derived from the Equation (2) by using the estimated individual’s coefficients.

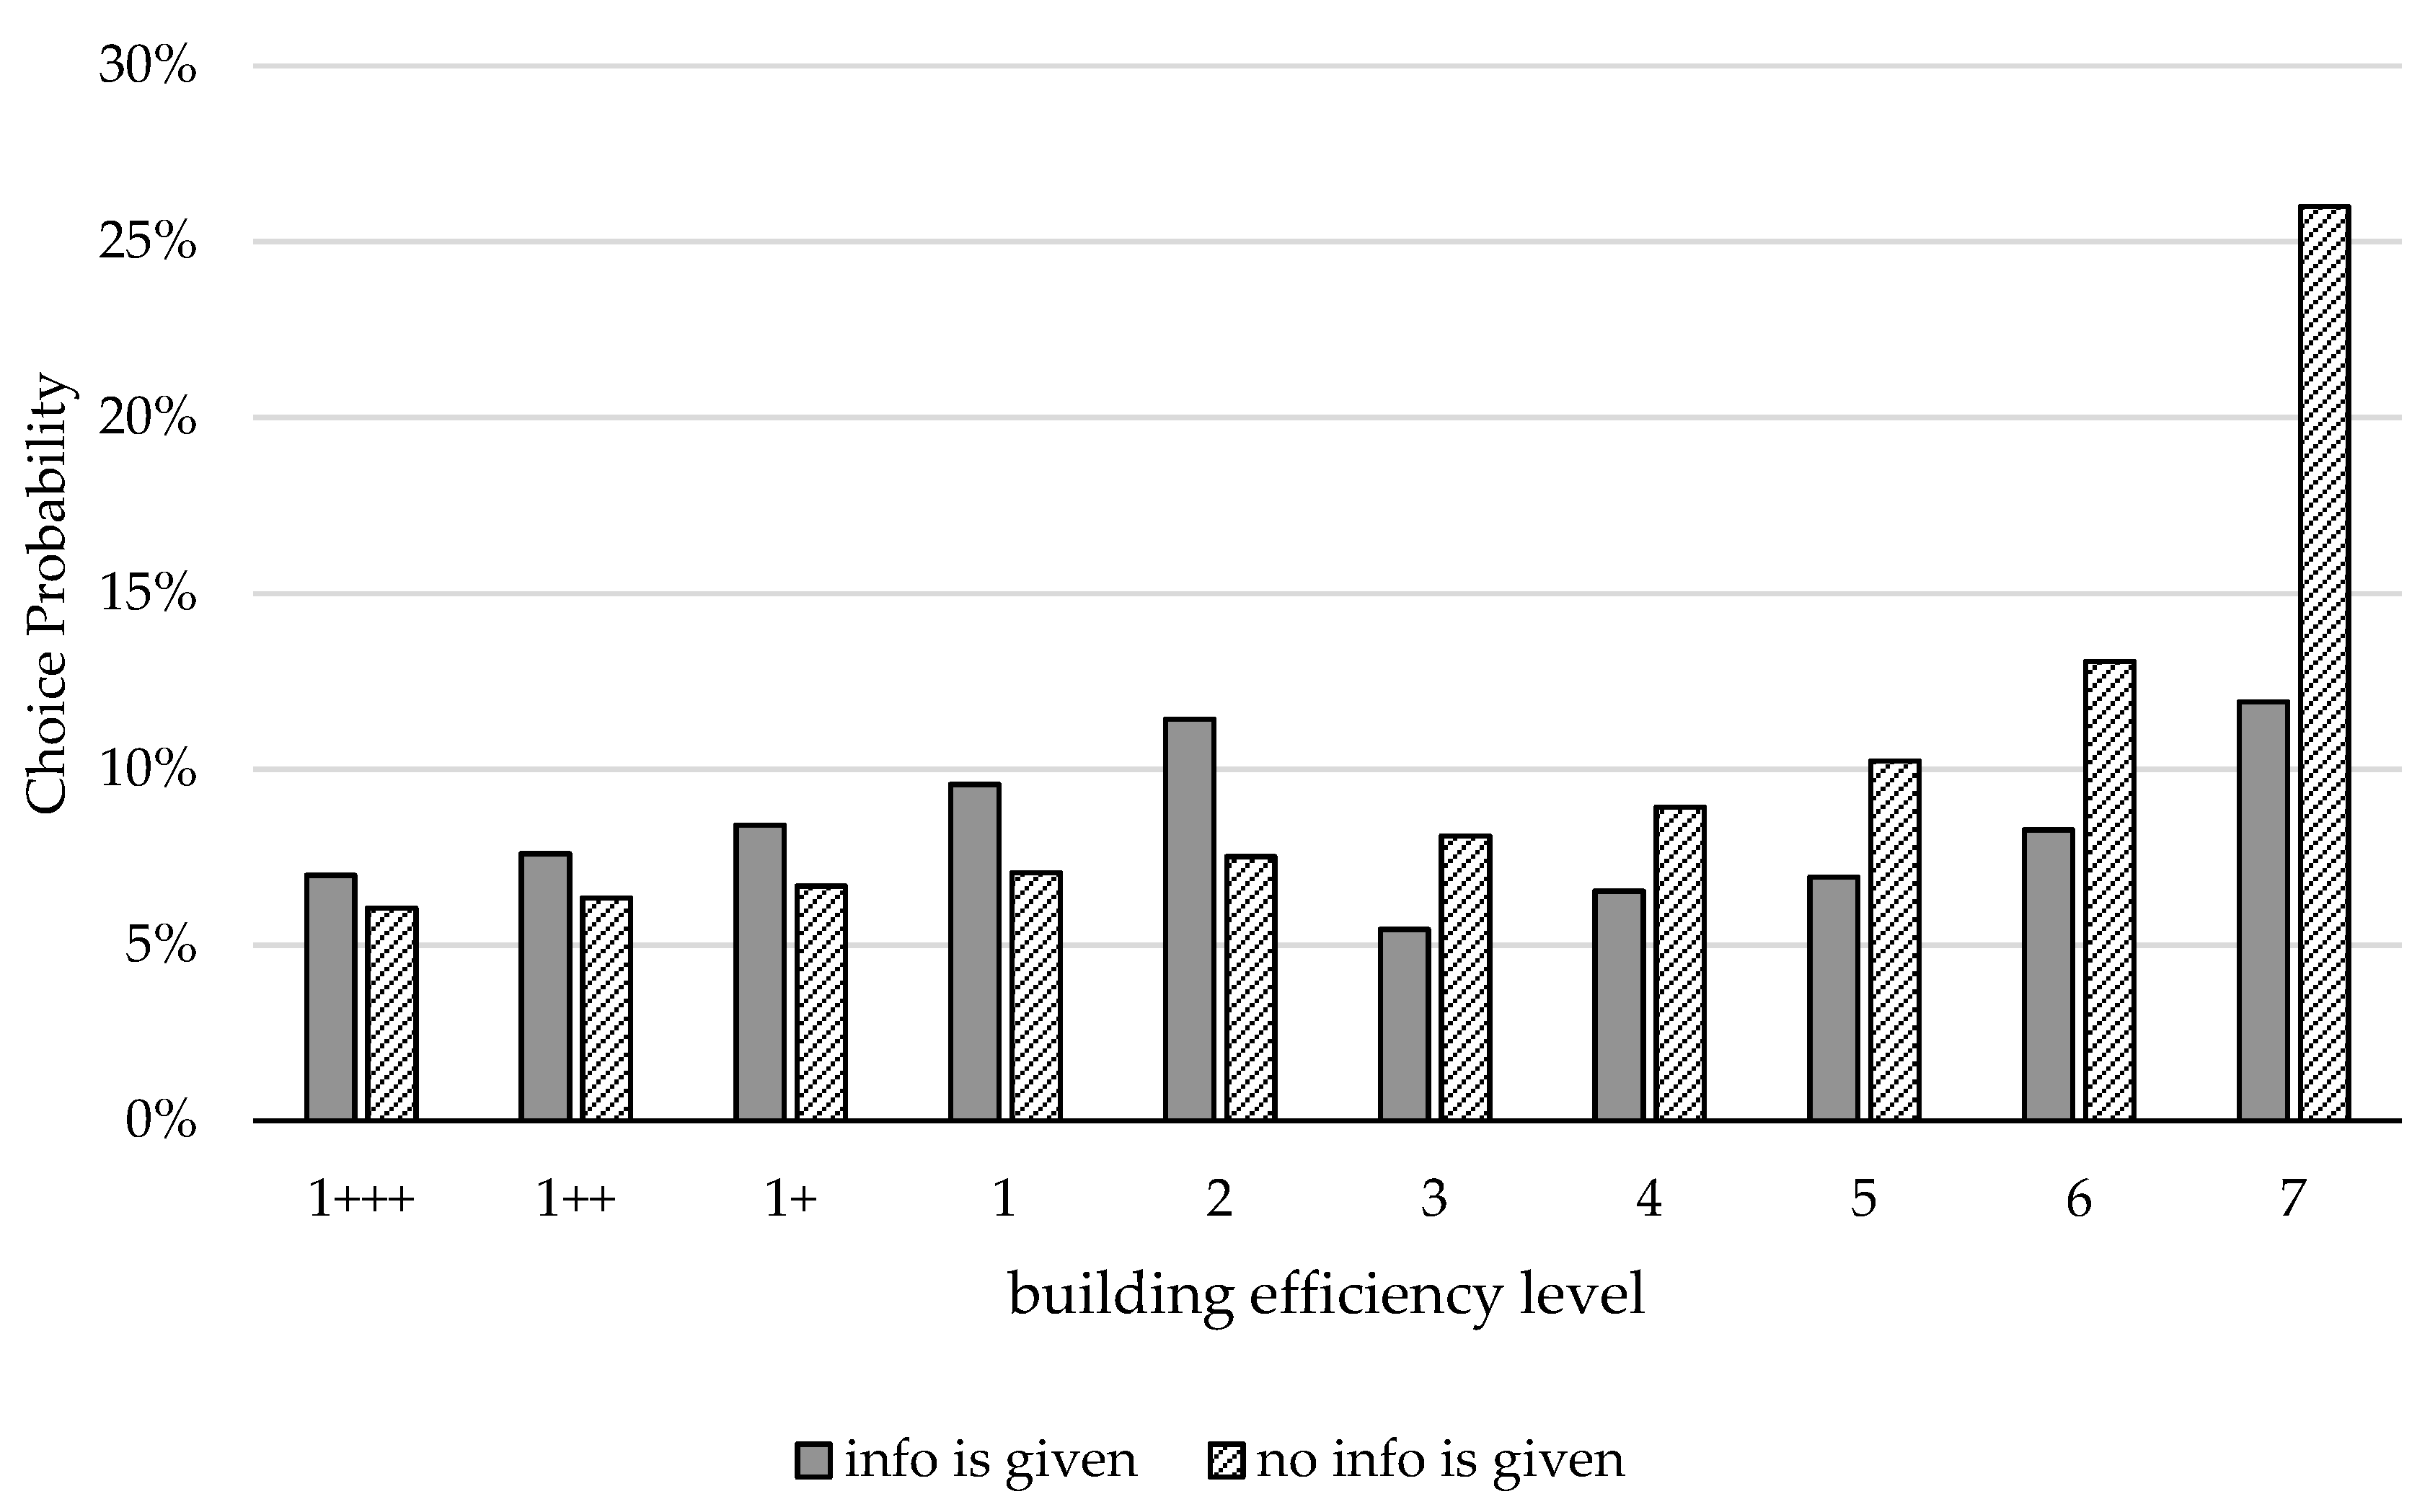
5.1. The Effect of EPC Information on the Residential Market

The first simulation study examines whether the provision of EPC information can change the consumer’s choice in the actual residential market or not. According to Lee and Moon (2016) [63], the housing price in Seoul increases by 1% as the level of the building energy efficiency increases by 1 unit. Assuming all the other conditions are equal, the housing price would be affected by the energy efficiency level. We simulated the choice probabilities for 10 hypothetical alternatives from the 1+++ to 7 levels with differentiating price based on the average market price in Seoul (Since the implementation of the DUBEP system has been started in Seoul, only Seoul has enough data to obtain the average residential prices). Figure 1 shows the choice probabilities for each alternative when consumers obtain and do not obtain the EPC information.
When the EPC information is given, consumers prefer to choose the house with higher energy efficiency rates due to trade-offs between the energy efficiency and the housing price. However, when the EPC information is not given during the transaction, consumers tend to buy less efficient houses depending only on the low price.
The simulation result supports the importance of the obtainability of the EPC information. The simulation result shows that choice probabilities with EPC information increase by approximately 10% for higher-efficiency buildings and they decrease by approximately 22% for lower-efficiency buildings compared when there is no EPC information. As Carroll et al. (2016) [21] suggested, asymmetrical information regarding energy efficiency would lead consumers to make a suboptimal decision. This result has numerically proved the effect of EPC information on mitigating suboptimality by simulating the change in choice probability, and has emphasized the positive effectiveness of EPC information. It is because purchasing the house without obtaining the EPC information would ultimately result in information asymmetry. In order to change the consumers’ behavior, this study suggests that the DUBEP system must be strengthened and implemented under compulsory use, rather than through the online disclosure of EPC information as is currently the case. Obligating house owners to provide the EPC information to potential buyers/tenants would increase the choice probabilities of higher energy-efficient buildings, as the Korean government initially intended.

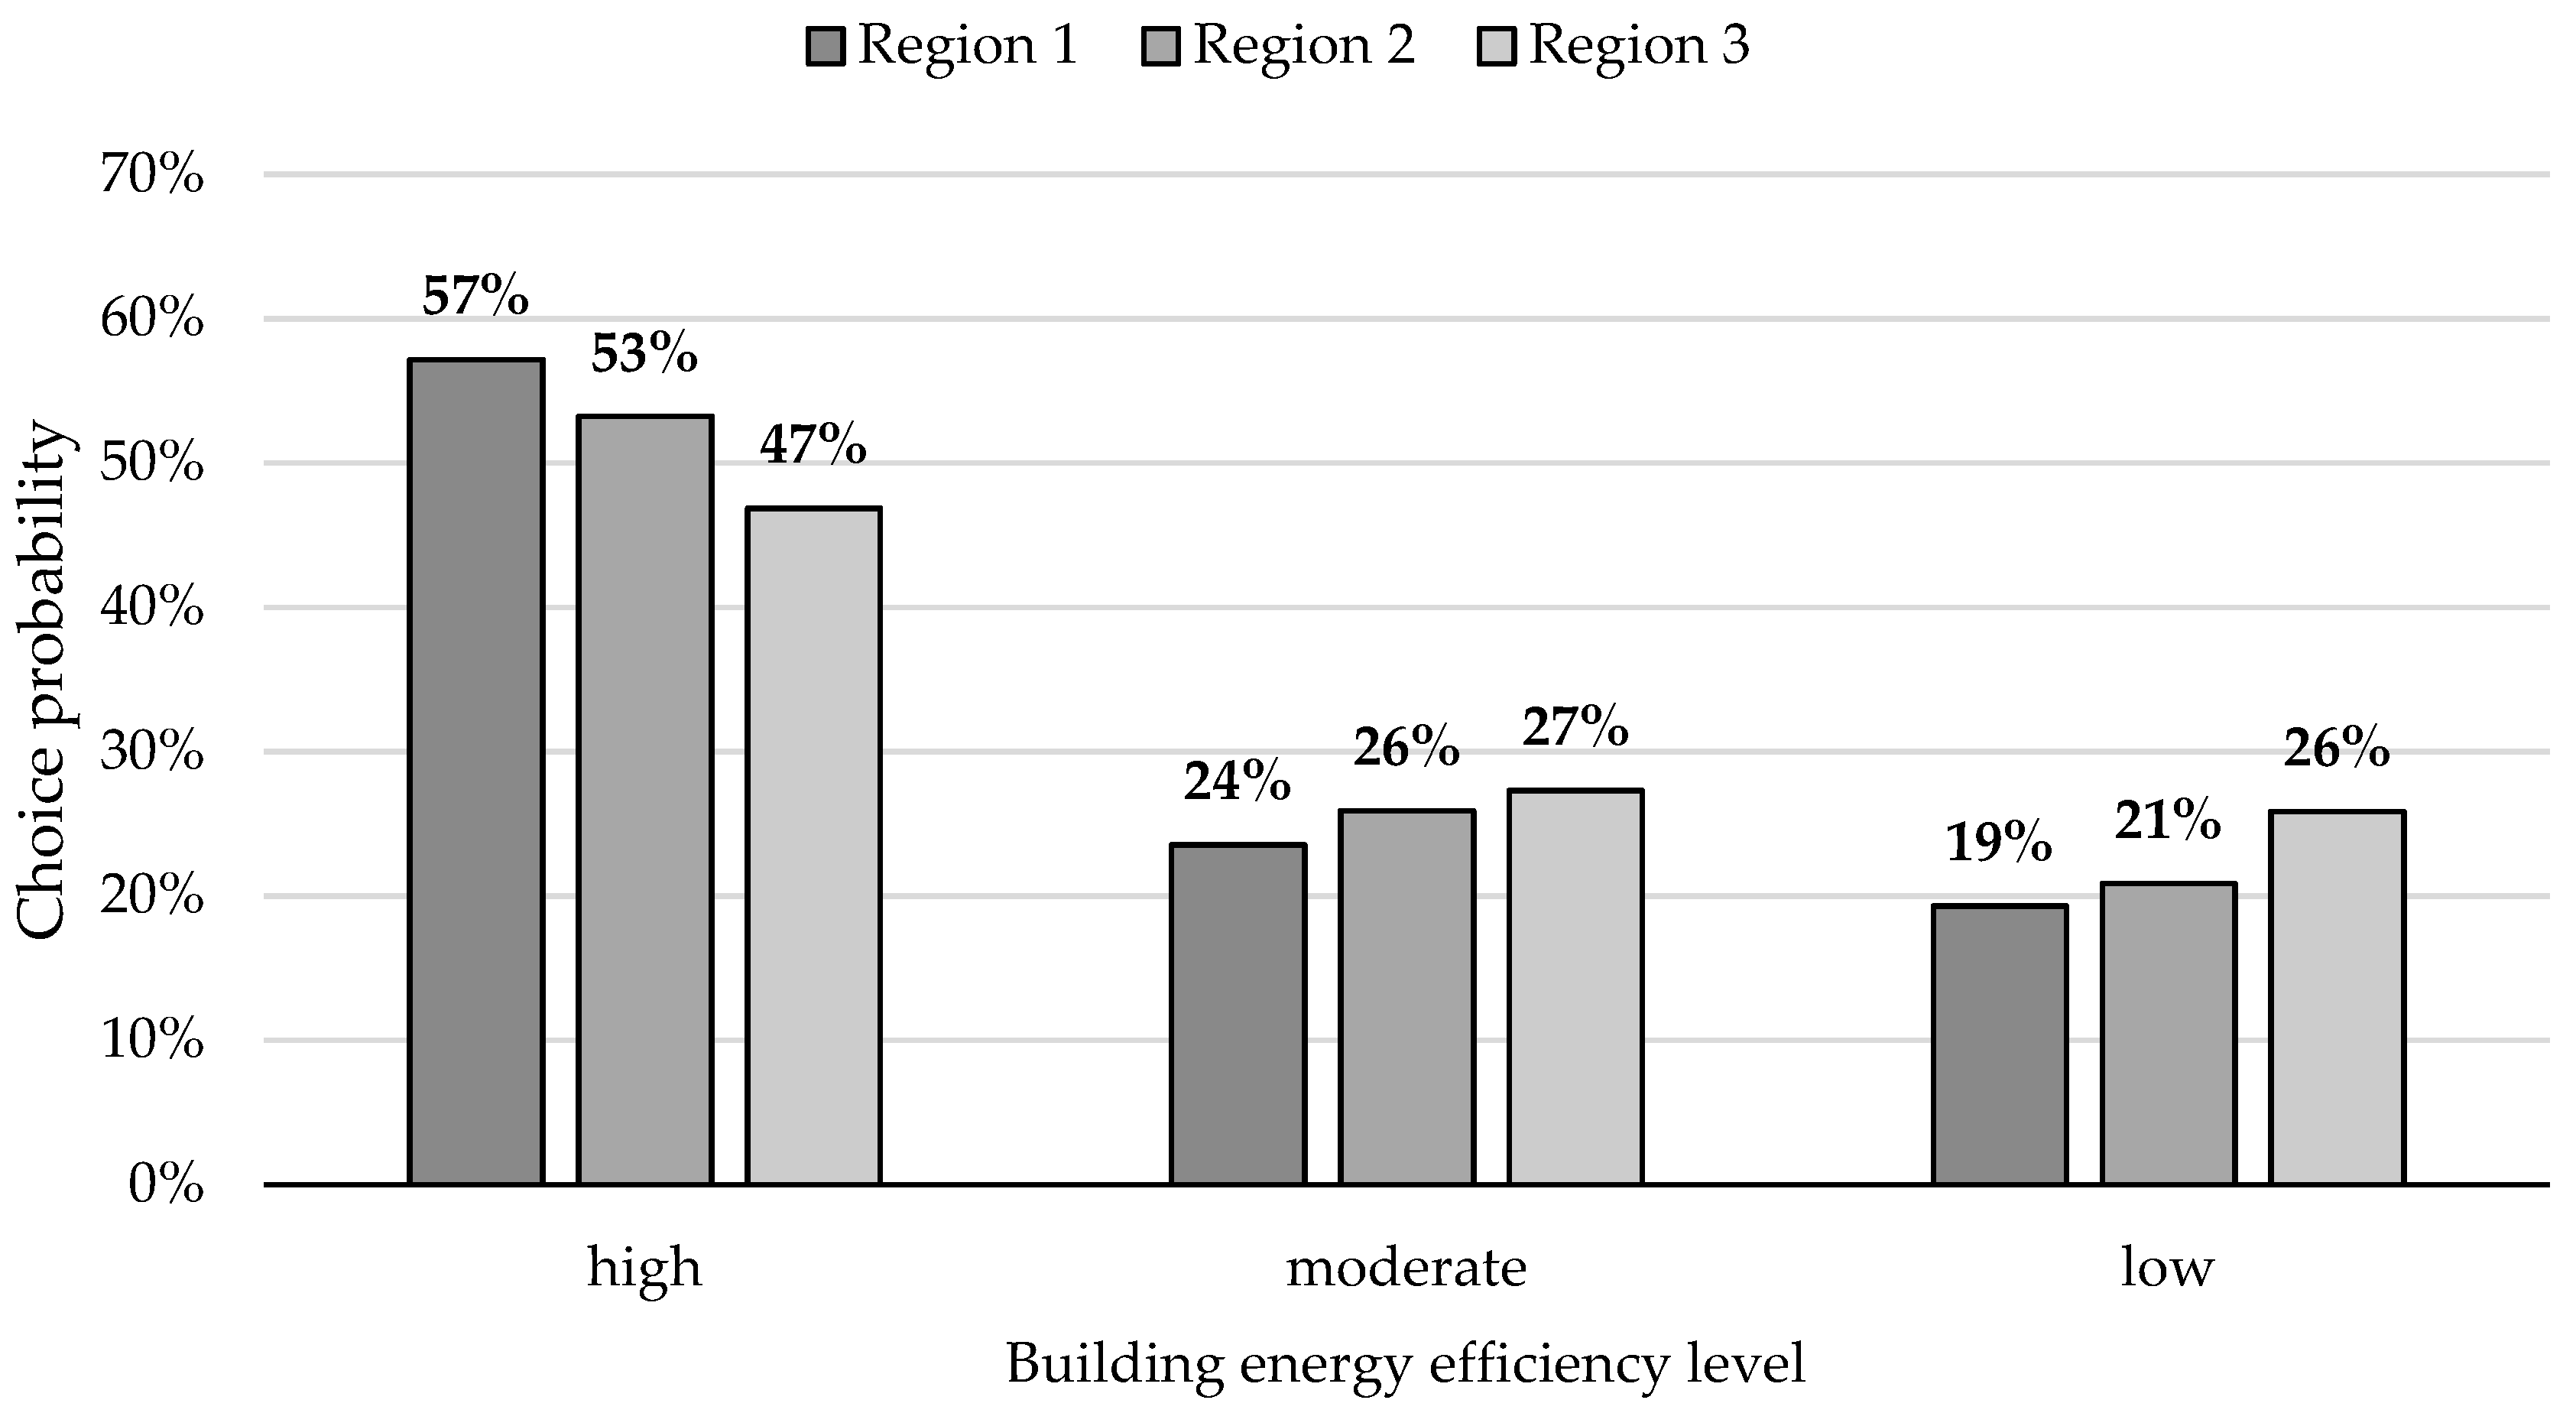
5.2. Market Share of Building Energy Efficiency Level by Region

The second simulation is closely examined to find how residential choices are affected by the building efficiency level when the DUBEP system is sufficiently expanded across the country. Because the consumer preference differs from region to region, the market share of the building energy efficiency level may also vary. Assuming all other attributes remain constant except for the energy efficiency level, Figure 2 shows the estimated average choice probabilities for three alternatives by groups of respondents based on their residential region.
When looking at the corresponding choice probability of consumers with different levels of building energy efficiency, it can be said that consumers prefer the highly energy-efficient buildings. This result varies somewhat by region, and the difference is especially pronounced in Region 1; the residents of Region 1 are far more likely to prefer highly energy-efficient buildings compared to the residents of other regions. If there is a sufficient supply of highly efficient housing in Regions 1 or 2, voluntary choices can be made for high-efficiency buildings because of the relatively high maintenance cost. By contrast, the majority of choices are made at a moderate or low level in Region 3. Thus, rather than expecting voluntary changes in the residential market, the policy might be necessary not only to restrict the supply of low-efficiency housing but also to support retrofits of old buildings.

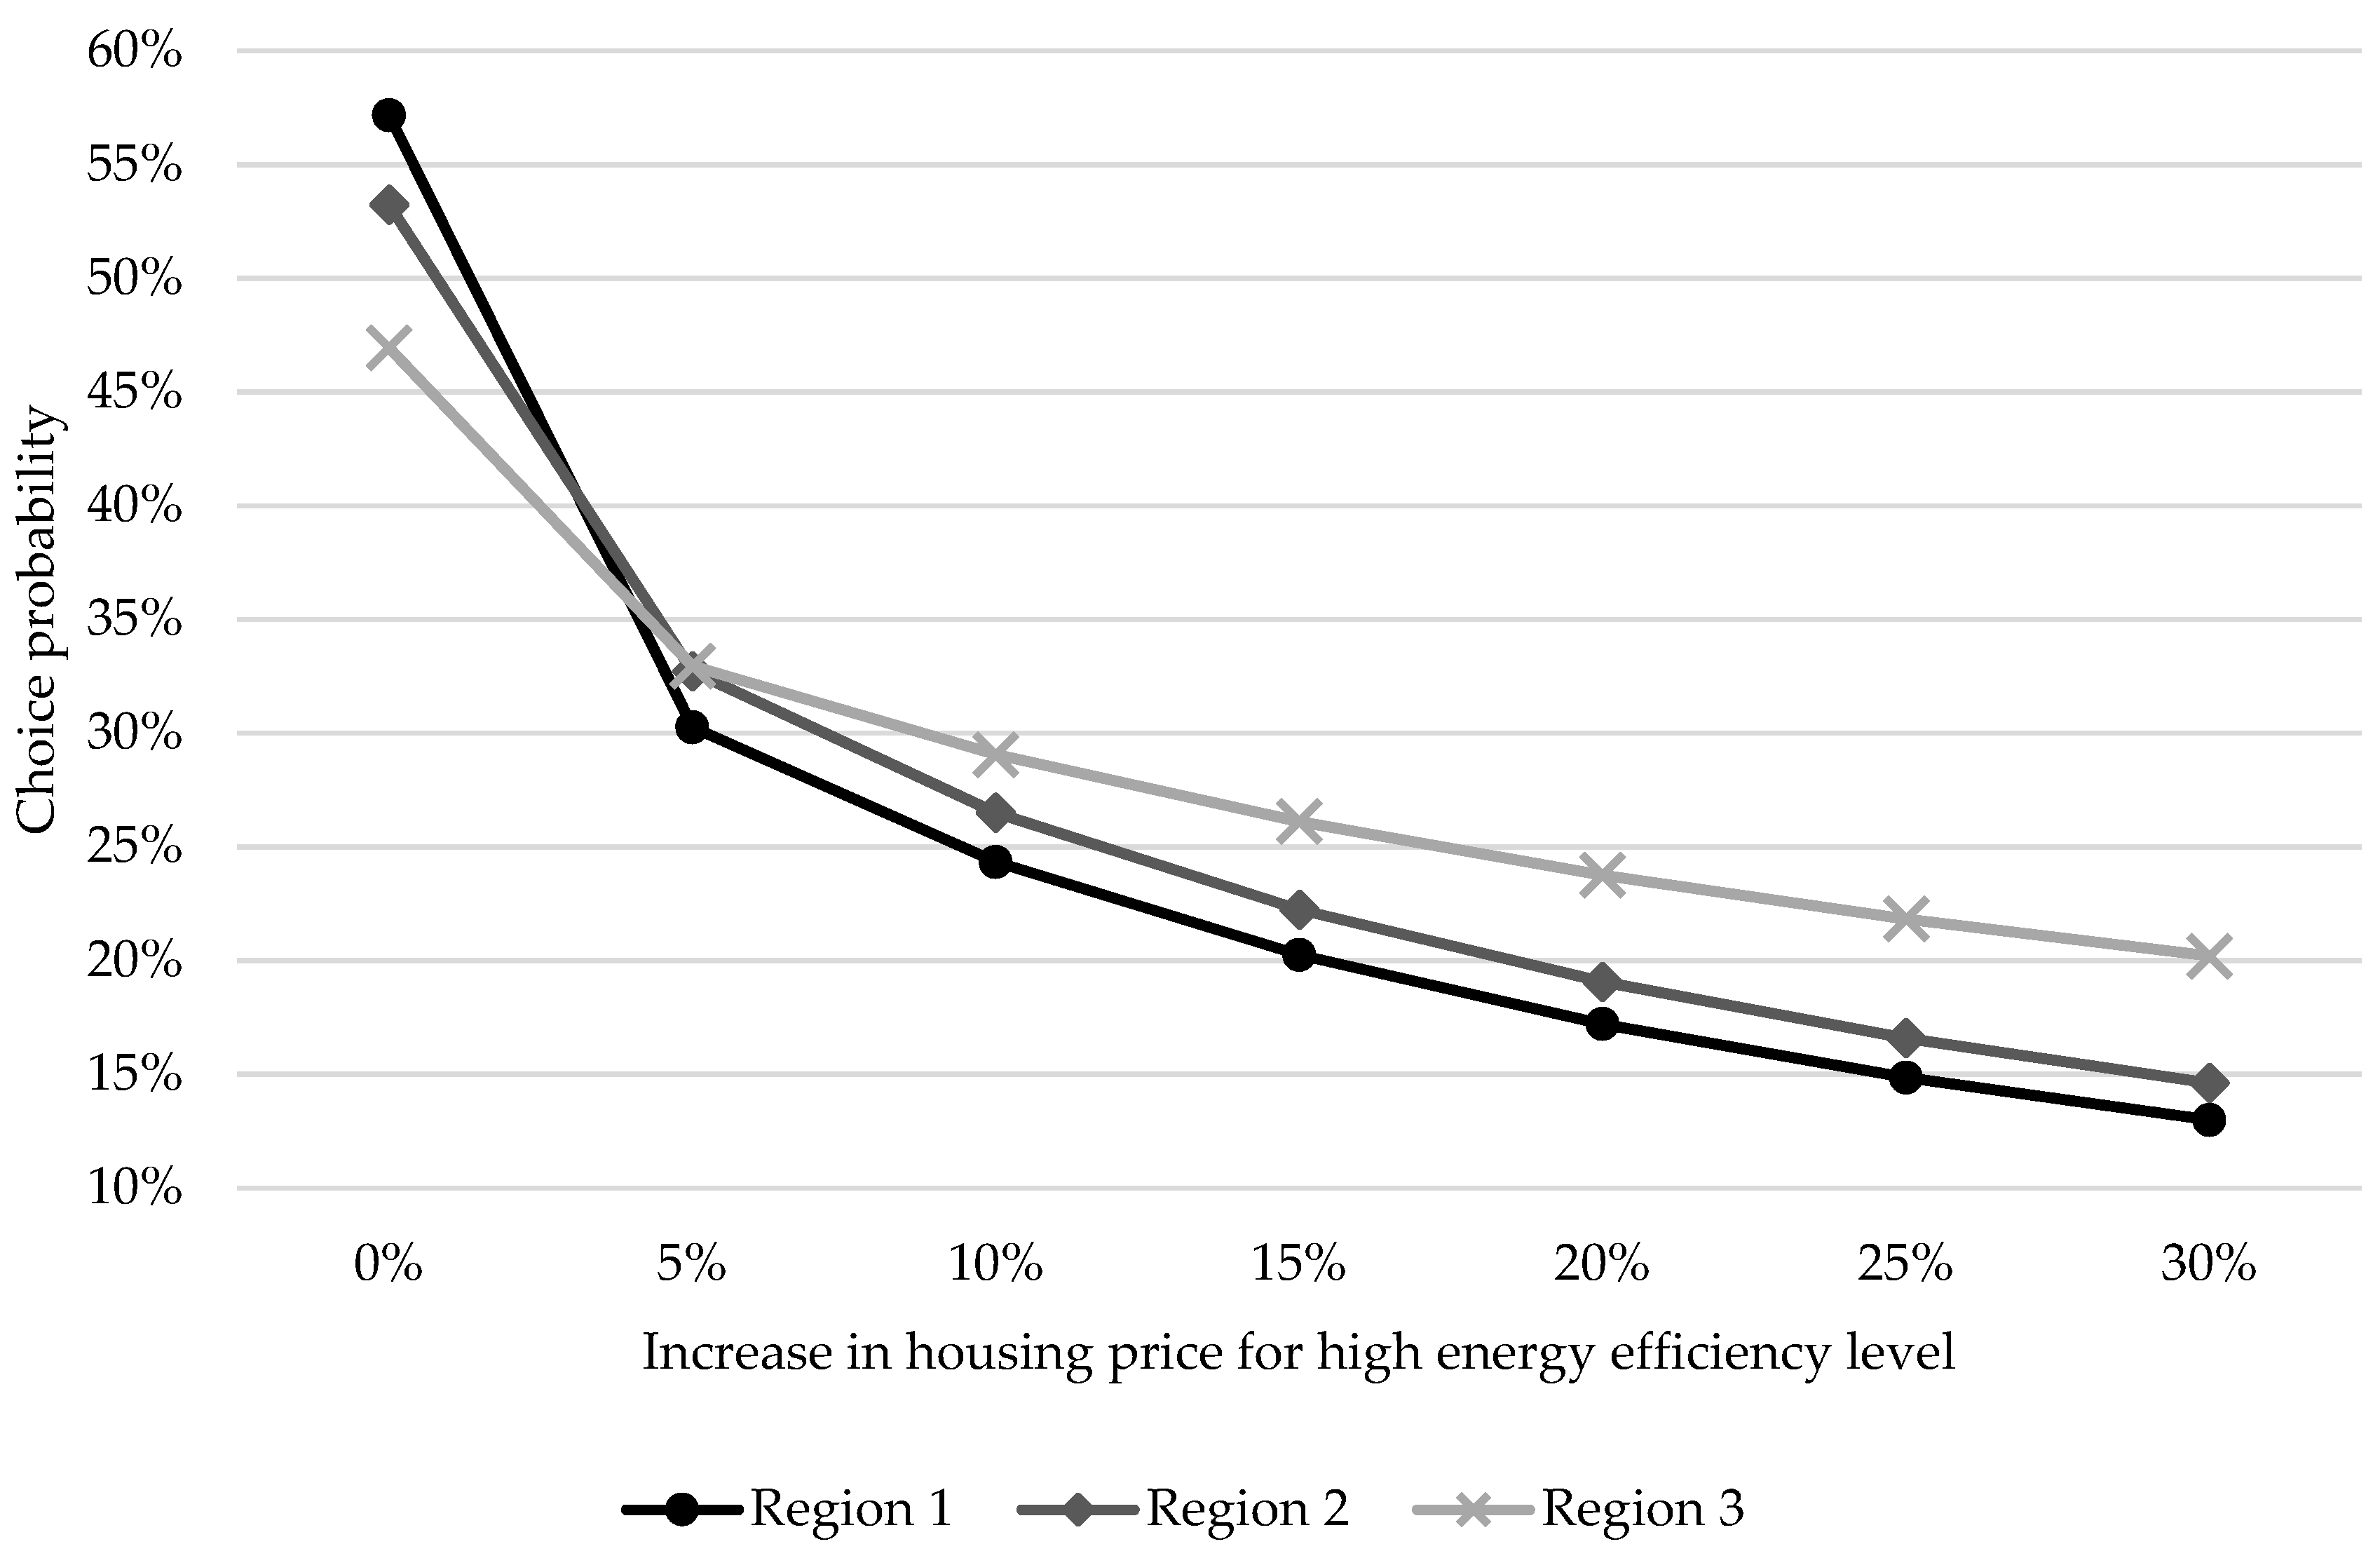
5.3. The Effect of EPC Information by Differentiating among Housing Prices

The last simulation is about the housing price effects on energy-efficient buildings. If the DUBEP system is successfully implemented and building owners are motivated to enable energy retrofits in housing, some premium can be added to the housing price. Figure 3 presents the changes in consumer choice probability with respect to highly energy-efficient buildings, when there is a price premium in the housing market. The prices of moderate/low energy-efficiency buildings are assumed to be the same as the current level.
When there is no price premium rate for the highly energy-efficient buildings, the choice probabilities are exactly the same as they are in Figure 2, representing the highest likelihood among three alternatives. However, as the price premium rate increases, the probability of choosing the highly energy-efficient building decreases dramatically. From these results, it can be said that the effect of EPC information could be underestimated by a price premium for highly energy-efficient buildings. This finding implies that the government’s policy to regulate the price premium is necessary at the early stage, until the market assures a sufficient supply of high energy-efficiency buildings. If the EPC-related policy is on track and consumers are fully aware of the value of energy efficiency, this type of rebound effect will slowly disappear.

6. Conclusions

This study investigated the effect of EPC information on consumer resident choices in South Korea. Using discrete choice experiments, this study analyzed how consumers use the EPC information related to the building energy efficiency when they decide to buy/rent the house. In addition, a simulation study is analyzed to examine the effect of the DUBEP system based on the result of the consumer preferences analysis. The results of this study showed that the building energy efficiency level has a significant effect on consumer residential choice when consumers were provided with this information. Consumers also prefer highly energy-efficient buildings when the EPC information is available. Although some previous studies have argued that there are limitations in the effects of the EPC information, this study confirms that consumers assign a high value to the available information on building energy efficiency.
Despite these policy implications, there are some limitations in this study. First, the situation of residential choice was limited by assuming that the respondents would make a decision among houses with similar living conditions to the status quo. If this assumption is relaxed, the effect of EPC information on consumer utility may be different. Second, if the market data on the actual housing choice is sufficiently accumulated under the DUBEP policy, a more realistic analysis will be possible. Lastly, because this study did not consider the effect of demographic variables, future research will need to take these data into account.

Author Contributions

All authors have played an important role in this study. H.L. designed the survey questionnaire, gathered the data, analyzed the model and wrote the manuscript. M.L. brought the research idea, investigated the current issues regarding of EPC, and reviewed and edited the manuscript. S.L. outlined the methodology, developed and analyzed the model, and wrote and edited the manuscript. All authors have read and approved the final manuscript.

Funding

This research was funded by Korea Ministry of Environment as the Climate Change, correspondence R&D program 2014001300001.

Conflicts of Interest

The authors declare no conflict of interest.

Abbreviations

BEABuilding Energy Assessment
BREEAMBuilding Research Establishment Environmental Assessment Method
CASBEEComprehensive Assessment System for Build Environment Efficiency
CVMContingent Valuation Method
DUBEPDisclosure and Utilization of Building Energy Performance
EPBDEnergy Performance of Building Directive
EPCEnergy Performance Certificate
LEEDLeadership in Energy and Environmental Design
MWTPMarginal Willingness to Pay
RIRelative Importance
USGBCUS Green Building Council

References

  1. Paris Agreement. Available online: http://unfccc.int/files/essential_background/convention/application/pdf/english_paris_agreement.pdf (accessed on 24 October 2018).
  2. Probst, D. How the Paris Agreement Sparked Green-Building Progress. GreenBiz. Available online: https://www.greenbiz.com/article/how-paris-agreement-sparked-green-building-progress (accessed on 24 October 2018).
  3. UNEP. Why Buildings? Buildings Day at COP21; UNEP: Paris, France, 2015. [Google Scholar]
  4. Eurostat. Available online: http://ec.europa.eu/eurostat/tgm/refreshTableAction.do?tab=table&plugin=1&pcode=ten00094&language=en (accessed on 24 October 2018).
  5. Ministry of Environment. Available online: https://www.keco.or.kr/kr/business/climate/communityid/187/view.do?idx=22056 (accessed on 24 October 2018).
  6. Polesello, V.; Johnson, K. Energy-Efficient Buildings for Low-Carbon Cities. 2016. Available online: http://www.iccgov.org/wp-content/uploads/2016/03/47_Energy-efficient-buildings-for-low-carbon-cities_Viola-Katie.pdf (accessed on 24 October 2018).
  7. Crawley, D.; Aho, I. Building environmental assessment methods: Applications and development trends. Build. Res. Inf. 1999, 27, 300–308. [Google Scholar] [CrossRef]
  8. Amecke, H. The impact of energy performance certificates: A survey of German home owners. Energy Policy 2012, 46, 4–14. [Google Scholar] [CrossRef]
  9. Murphy, L. The influence of the energy performance certificate: The Dutch case. Energy Policy 2014, 67, 664–672. [Google Scholar] [CrossRef]
  10. Lainé, L. Room for Improvement: The impact of EPCs on Consumer Decision-Making; Consum. Futur: London, UK, 2011; pp. 1–12. [Google Scholar]
  11. Clinch, P.; Healy, D. Domestic energy efficiency in Ireland: Correcting market failure. Energy Policy 2000, 28, 1–8. [Google Scholar] [CrossRef]
  12. Harmelink, M.; Nilsson, L.; Harmsen, R. Theory-based policy evaluation of 20 energy efficiency instruments. Energy Effic. 2008, 1, 131–148. [Google Scholar] [CrossRef]
  13. Brounen, D.; Kok, N. On the economics of energy labels in the housing market. J. Environ. Econ. Manag. 2011, 62, 166–179. [Google Scholar] [CrossRef] [Green Version]
  14. Hyland, M.; Lyons, C.; Lyons, S. The value of domestic building energy efficiency-evidence from Ireland. Energy Econ. 2013, 40, 943–952. [Google Scholar] [CrossRef]
  15. Cerin, P.; Hassel, G.; Semenova, N. Energy performance and housing prices. Sustain. Dev. 2014, 22, 404–419. [Google Scholar] [CrossRef]
  16. Fuerst, F.; McAllister, P.; Nanda, A.; Wyatt, P. Energy performance ratings and house prices in Wales: An empirical study. Energy Policy 2016, 92, 20–33. [Google Scholar] [CrossRef]
  17. Hui, E.; Tse, C.; Yu, K. The effect of BEAM Plus certification on property price in Hong Kong. Int. J. Strat. Prop. Manag. 2017, 21, 384–400. [Google Scholar] [CrossRef]
  18. Comerford, D.; Lange, I.; Moro, M. Proof of concept that requiring energy labels for dwellings can induce retrofitting. Energy Econ. 2018, 69, 204–212. [Google Scholar] [CrossRef]
  19. Van Middelkoop, M.; Vringer, K.; Visser, H. Are Dutch residents ready for a more stringent policy to enhance the energy performance of their homes? Energy Policy 2017, 105, 269–282. [Google Scholar] [CrossRef]
  20. Chau, K.; Tse, S.; Chung, Y. A choice experiment to estimate the effect of green experience on preferences and willingness-to-pay for green building attributes. Build. Environ. 2010, 45, 2553–2561. [Google Scholar] [CrossRef]
  21. Carroll, J.; Aravena, C.; Denny, E. Low energy efficiency in rental properties: Asymmetric information or low willingness-to-pay? Energy Policy 2016, 96, 617–629. [Google Scholar] [CrossRef]
  22. Snow, A. Ambiguity and the value of information. J. Risk Uncertain. 2010, 40, 133–145. [Google Scholar] [CrossRef]
  23. Oaksford, M.; Chater, N. A rational analysis of the selection task as optimal data selection. Psychol. Rev. 1994, 101, 608–631. [Google Scholar] [CrossRef]
  24. European Commission. Available online: http://ace-e2.eu/wp-content/uploads/2017/08/EPBD_Compliance_Study.pdf (accessed on 24 October 2018).
  25. Energy Efficiency: Energy Performance of Buildings (Directive 2002/91/EC). Available online: https://eur-lex.europa.eu/legal-content/EN/TXT/HTML/?uri=LEGISSUM:l27042&from=EN (accessed on 24 October 2018).
  26. Leadership in Energy and Environmental Design (LEED). Available online: http://new.usgbc.org/leed (accessed on 1 November 2018).
  27. EnerGuide Rating System. Available online: https://www.nrcan.gc.ca/energy/efficiency/homes/20548 (accessed on 1 November 2018).
  28. Building Research Establishment Environmental Assessment. Available online: https://www.breeam.com/ (accessed on 1 November 2018).
  29. Geng, Y.; Dong, H.; Xue, B.; Fu, J. An overview of Chinese green building standards. Sustain. Dev. 2012, 20, 211–221. [Google Scholar] [CrossRef]
  30. Comprehensive Assessment System for Built Environment Efficiency (CASBEE). Available online: http://www.ibec.or.jp/CASBEE/english/document/CASBEE_brochure_2016.pdf (accessed on 1 November 2018).
  31. Building & Construction Authority Green Mark. Available online: https://www.bca.gov.sg/greenmark/green_mark_buildings.html (accessed on 1 November 2018).
  32. Green Together. Available online: https://www.greentogether.go.kr:8343/index.do (accessed on 19 November 2018).
  33. Naver Real Estate. Available online: http://land.naver.com (accessed on 1 November 2018).
  34. Real Estate 114. Available online: http://www.r114.com (accessed on 1 November 2018).
  35. Minwon 24. Available online: http://www.gov.kr/portal/minwon?Mcode=10001 (accessed on 1 November 2018).
  36. Lee, D. GHG information system of building energy and operation status. Budongsan Focus 2017, 107, 54–63. [Google Scholar]
  37. Dascalaki, G.; Balaras, A.; Gaglia, G.; Droutsa, G.; Kontoyiannidis, S. Energy performance of buildings—EPBD in Greece. Energy Policy 2012, 45, 469–477. [Google Scholar] [CrossRef]
  38. Bull, R.; Chang, N.; Fleming, P. The use of building energy certificates to reduce energy consumption in European public buildings. Energy Build. 2012, 50, 103–110. [Google Scholar] [CrossRef]
  39. Hoffman, J.; Henn, R. Overcoming the social and psychological barriers to green building. Organ. Environ. 2008, 21, 390–419. [Google Scholar] [CrossRef]
  40. Yau, Y. Eco-labels and willingness-to-pay: A Hong Kong study. Smart Sustain. Built Environ. 2012, 1, 277–290. [Google Scholar] [CrossRef]
  41. Luo, W.; Kanzaki, M.; Matsushita, K. Promoting green buildings: Do Chinese consumers care about green building enhancements? Int. J. Consum. Stud. 2017, 41, 545–557. [Google Scholar] [CrossRef]
  42. Encinas, F.; Marmolejo-Duarte, C.; Sánchez de la Flor, F.; Aguirre, C. Does energy efficiency matter to real estate-consumers? Survey evidence on willingness to pay from a cost-optimal analysis in the context of a developing country. Energy Sustain. Dev. 2018, 45, 110–123. [Google Scholar] [CrossRef]
  43. Collins, M.; Curtis, J. Rental tenants’ willingness-to-pay for improved energy efficiency and payback periods for landlords. Energy Effic. 2018. [Google Scholar] [CrossRef]
  44. Liu, N.; Zhao, Y.; Ge, J. Do renters skimp on energy efficiency during economic recessions? Evidence from Northeast Scotland. Energy 2018, 165, 164–175. [Google Scholar] [CrossRef]
  45. Haaijer, R.; Wedel, M. Conjoint choice experiments: General characteristics and alternative model specifications. In Conjoint Measurement; Springer: Berlin/Heidelberg, Germany, 2003; pp. 371–412. ISBN 978-3-540-71404-0. [Google Scholar]
  46. Boxall, P.; Adamowicz, W.; Swait, J.; Williams, M.; Louviere, J. A comparison of stated preference methods for environmental valuation. Ecol. Econ. 1996, 18, 243–253. [Google Scholar] [CrossRef]
  47. Adamowicz, W.; Boxall, P.; Williams, M.; Louviere, J. Stated preference approaches for measuring passive use values: Choice experiments and contingent valuation. Am. J. Agric. Econ. 1998, 80, 64–75. [Google Scholar] [CrossRef]
  48. Mulder, C. Housing choice: Assumptions and approaches. Neth. J. Hous. Built Environ. 1996, 11, 209–232. [Google Scholar] [CrossRef]
  49. Louviere, J.; Timmermans, H. Hierarchical information integration applied to residential choice behavior. Geogr. Anal. 1990, 22, 127–144. [Google Scholar] [CrossRef]
  50. Molin, E.; Oppewal, H.; Timmermans, H. Predicting consumer response to new housing: A stated choice experiment. Neth. J. Hous. Built Environ. 1996, 11, 297–311. [Google Scholar] [CrossRef] [Green Version]
  51. Kim, J.; Pagliara, F.; Preston, J. The intention to move and residential location choice behaviour. Urban Stud. 2005, 42, 1621–1636. [Google Scholar] [CrossRef]
  52. Lee, K.; Lee, J. A marketing strategy for unsold apartments using conjoint analysis of customer preference. J. Korea Contents Assoc. 2013, 13, 556–564. [Google Scholar] [CrossRef]
  53. OECD. Available online: https://www.oecd.org/els/family/LMF2_6_Time_spent_travelling_to_and_from_work.pdf (accessed on 24 October 2018).
  54. Korea Transportation Safety Authority. Available online: http://stat.molit.go.kr/portal/cate/statFileView.do?hRsId=483&hFormId=&hSelectId=&sStyleNum=&sStart=&sEnd=&hPoint=&hAppr= (accessed on 24 October 2018).
  55. Aultman-Hall, L.; Roorda, M.; Baetz, B. Using GIS for evaluation of neighborhood pedestrian accessibility. J. Urban Plan. Dev. 1997, 123, 10–17. [Google Scholar] [CrossRef]
  56. Transit Capacity and Quality of Service Manual. Available online: http://onlinepubs.trb.org/onlinepubs/tcrp/tcrp_rpt_165ch-01.pdf (accessed on 24 October 2018).
  57. Ratcliffe, J.; Longworth, L. Investigating structural reliability within health technology assessment: A discrete choice experiment. Int. J. Technol. Assess. 2002, 18, 139–144. [Google Scholar]
  58. Ministry of Trade, Industry and Energy. Available online: http://www.ndsl.kr/ndsl/commons/util/ndslOriginalView.do?dbt=TRKO&cn=TRKO200700008021&rn=&url=&pageCode=PG18 (accessed on 24 October 2018).
  59. Kim, M.; Cho, H. Estimation of Energy Consumption of Residential Buildings in Seoul. Working Paper. Available online: https://www.si.re.kr/sites/default/files/2012-PR-33_0.pdf (accessed on 19 November 2018).
  60. McFadden, D.; Train, K. Mixed MNL models for discrete response. J. Appl. Econ. 2000, 15, 447–470. [Google Scholar] [CrossRef] [Green Version]
  61. Train, K. Discrete Choice Methods with Simulation, 2nd ed.; Cambridge University Press: New York, NY, USA, 2009; ISBN 928-0-521-74738-7. [Google Scholar]
  62. Train, K.; Sonnier, G. Mixed logit with bounded distributions of correlated partworths. In Applications of Simulation Methods in Environmental and Resource Economics; Springer: Dordrecht, The Netherlands, 2005; pp. 117–134. ISBN 978-1-4020-3684-2. [Google Scholar]
  63. Lee, D.; Moon, T. The effect of the energy efficiency rating system on apartment prices. Korea Environ. Policy 2016, 24, 25–42. [Google Scholar] [CrossRef]
Figure 1. Change in housing market share by EPC information provision in Seoul. Based on Equation (2), the choice probability of each efficiency level is calculated by using estimated coefficients of individuals. By differentiating housing price and availability of EPC information, the housing market share in Seoul is estimated.
Sustainability 10 04297 g001
Figure 2. Choice probability by building energy efficiency level and region. Based on Equation (2), the choice probability is calculated by using estimated coefficients of individuals. From dividing the estimated coefficients by three different regions, the choice probability of building energy efficiency level is calculated.
Sustainability 10 04297 g002
Figure 3. Choice probability for highly energy-efficient buildings with a price premium. Based on Equation (2), the choice probability is calculated by using estimated coefficients of individuals. The estimated coefficients are divided by three different regions, and the choice probability of high energy efficiency level is calculated by increasing the percentage of the consumer’s actual housing price.
Sustainability 10 04297 g003
Table 1. Schemes of building energy performance certificate.
SchemeDescriptionValidity Period (Years)Remarks
Energy Performance Certificate (EPC) [25]
  • Started in EU in 2002 as a part of EPBD
  • Increasing the availability of EPC in sale and rent transactions and the visibility of the energy label in commercial advertisements (Art. 13)
Up to 10Not mandatory for every country, and details are varied
Energy Star Certified Home
  • Started in the USA in 1998
  • Granted to houses with a minimum of 30% more efficiency than standard houses by the Environmental Protection Agency (EPA) and US Department of Energy (DOE)
  • A part of the Leadership in Energy and Environmental Design (LEED)project, a part of green building certification program developed by the US Green Building Council [26]
1Not mandatory and autonomously implemented in different states
EnerGuide Rating System [27]
  • Started in Canada in 2006
  • Rating scale from 0 to 100: about air leakage, insulation, energy consumption
  • Varied incentives are provided by provincial/territorial governments
2Not mandatory, and other rating systems are existed (Energy Star Portfolio Manager)
Building Research Establishment Environmental Assessment Method (BREEAM) [28]
  • Started in the UK in 1990
  • The world’s longest established method of assessing, rating, and certification of buildings
  • Five rating system (Pass, Good, Very Good, Excellent, Outstanding)
10200 pound penalty for failing to provide the assessments during transaction.
China 3 Star Building Energy Efficiency Evaluation
  • Started in China in 2006 as the Green Building Evaluation Standard [29]
  • Three-Star rating system: Credit-based, voluntary rating system, and provides incentives
  • Similar to the LEED
  • Rates the building after one year of operation
3Not mandatory, but there are building energy codes that are mandatory in some regions
Comprehensive Assessment System for Built Environment Efficiency (CASBEE) [30]
  • Started in Japan in 2001 as a part of Energy Conservation Law
  • Five-Star rating system (Superior, Very Good, Good, Slightly Poor, Poor): Including built environment efficiency, life cycle CO2, etc.
3 to 5Mandatory for building permits, and result is available on the internet
Building & Construction Authority Green Mark [31]
  • Started in Singapore in 2005
  • Four types of rating system (Certifies, Gold, Gold-plus, Platinum): Providing incentives for the rating higher than Gold
5Not mandatory
Table 2. Building energy efficiency levels of the DUBEP in South Korea 1.
GradeAnnual Primary Energy Requirements per Unit Area (kWh/m2∙Year)
Residential BuildingNon-Residential Building
1+++below 60below 80
1++minimum 60 and below 90minimum 80 and below 140
1+minimum 90 and below 120minimum 140 and below 200
1minimum 120 and below 150minimum 200 and below 260
2minimum 150 and below 190minimum 260 and below 320
3minimum 190 and below 230minimum 320 and below 380
4minimum 230 and below 270minimum 380 and below 450
5minimum 270 and below 320minimum 450 and below 520
6minimum 320 and below 370minimum 520 and below 610
7minimum 370 and below 420minimum 610 and below 700
1 The levels are defined by provisions of Ministry of Land, Infrastructure and Transport in South Korea (http://www.energy.or.kr/renew_eng/energy/buildings/buildings_certification.aspx).
Table 3. An example of Energy Performance Certificate Information in South Korea 1.
Efficiency LevelAmount of CO2 EmissionsEnergy ConsumptionAmount of CO2 Emissions
Primary energy requirements per unit area (kWh/m2∙year)Amount of CO2 emissions per unit area (kg/m2∙year)Primary energy consumption per unit area (kWh/m2∙year)Amount of CO2 emissions per unit area (kg/m2∙year)
Sustainability 10 04297 i001 Sustainability 10 04297 i002 Sustainability 10 04297 i003 Sustainability 10 04297 i004
Total energy requirement per unit area
(kWh/m2∙year)
Total energy consumption per unit area
(kWh/m2∙year)
RequirementEnergy requirementPrimary Energy requirementsYear00 year00 year00 year
Classification Classification
Heating Gas
Water boiling Electricity
Cooling Local heating & cooling
Lighting Oil
Ventilation Others
1 The top half of the rows represents diagrams that give an intuitive understanding of the efficiency level, amount of CO2 emissions and energy consumption. The bottom half of the rows represent the information on total energy requirement and consumption per unit area. The actual template of EPC information in South Korea can be found at the following link: https://terms.naver.com/entry.nhn?docId=2833487&cid=42279&categoryId=42279.
Table 4. Attributes and levels for discrete choice experiments.
AttributesLevels
1. Relative change of house price (rental or sale) compared to the current house −10 percent (10% lower in price)
0 percent (same in price)
10 percent (10% higher in price)
2. Average commuting timeWithin 30 min
Within 1 h
Within 2 h
3. Walking distance to public transportWithin 5 min
Within 10 min
Within 20 min
4. Building ageLess than 2 years
10 years
20 years
5. Walking distance to the nearest school (elementary, middle, or high school)Within 5 min
Within 15 min
Within 30 min
6. Obtaining information related to building energy consumptionYes
No
7. Building energy efficiency levelHigh (DUBEP grade 1+++ to 2)
Middle (DUBEP grade 3 to 4)
Low (DUBEP grade 5 to 7)
Table 5. A sample of the actual choice sets.
AttributesChoice 1Choice 2Choice 3Choice 4
1. Relative house price (rental or sale) compared to the current house 10% lower in pricesame in price10% higher in price10% higher in price
2. Average commuting timeWithin 1 hWithin 1 h Within 30 min Within 2 h
3. Walking distance to public transportWithin 5 minWithin 10 min Within 5 min Within 5 min
4. Building ageLess than 2 yearsLess than 2 years10 yearsLess than 2 years
5. Walking distance to the nearest school (elementary, middle, or high school)Within5 min Within 15 min Within 5 min Within 30 min
6. Obtaining information related to building energy consumptionYesNoNoYes
7. Building energy efficiency levelHigh (DUBEP grade 1+++ to 2) Sustainability 10 04297 i005 Sustainability 10 04297 i005Moderate (DUBEP grade 3 to 4)
Which of these four options would you be most likely to choose?
Table 6. Demographics of respondents.
CharacteristicsNumber of Samples (Ratio %)
Total1000 (100%)
GenderMale507 (50.7%)
Female493 (49.3%)
Age (Years)20–29196 (19.6%)
30–39213 (21.3%)
40–49244 (24.4%)
50–59221 (22.1%)
60–69126 (12.6%)
RegionRegion 1 (Seoul, Incheon, Gyeonggi-do)511 (51.1%)
Region 2 (Busan, Daegu, Gwangju, Daejeon, Ulsan)203 (20.3%)
Region 3 (Gangwon-do with 6 other regions)286 (28.6%)
Education LevelLess than high school492 (49.2%)
Above university/college508 (50.8%)
Monthly Household Income (in ten thousands)Below KRW 1 200127 (12.7%)
KRW 200–299 166 (16.6%)
KRW 300–399 248 (24.8%)
KRW 400–499 209 (20.9%)
Over KRW 500 247 (24.7%)
No answer3 (0.3%)
Home ownershipHome owners710 (71.0%)
Home tenants290 (29.0%)
1 The South Korean Won (KRW) is the currency of Korea, and the currency code for Won is KRW. According to the Bank of Korea (http://www.bok.or.kr), USD 1 was equivalent to KRW 1071 in 2014.
Table 7. Estimation results of coefficients.
AttributesVariableMeanStandard Deviation Assumed Distribution
Real housing priceXj,price−18.654 ***,117.446 ***Log-normal
Region 1 (Seoul metropolitan region)Dn,Region1−18.412 ***12.250 ***
Region 2 (Metropolitan region)Dn,Reguib2−9.094 ***8.301 **
Average commuting timeXj,commute−2.338 ***1.826 ***normal
Walking distance to public transportation Xj,transport−0.059 ***0.549 ***normal
Building ageXj,time−0.196 ***0.572 ***normal
Walking distance to the nearest schoolXj,school−0.081 ***0.442 ***normal
Obtaining information related to building energy consumptionDj,info0.584 ***1.587 ***normal
High grade on building energy efficiency levelDj,highE0.655 ***1.773 ***
Low grade on building energy efficiency levelDj,lowE−0.499 ***1.422 **
1, *** and ** imply significance at the 99% and 95% levels, respectively.
Table 8. Marginal willingness to pay and relative importance of attributes.
AttributesMarginal Willingness to Pay (MWTP)Relative Importance (RI, %)
Region 1Region 2Region 3Region 1Region 2Region 3
Real housing price---55.9650.7235.26
Average commuting time (KRW/h) −80,497,581−55,458,767−101,559,3709.3210.7913.29
Walking distance to public transportation (KRW/min)−471,322−281,812−1,323,7306.467.679.43
Building age (KRW/year)−7,453,995−4,582,627−6,662,32310.0010.4014.14
Walking distance to the nearest school (KRW/min)−4,734,895−1,554,344−4,280,3557.327.1710.47
Obtaining information relating to building energy consumption (KRW)33,206,65722,558,81664,226,9494.454.586.05
High grade for the building energy efficiency level (KRW)6,707,4424,461,5831,422,9184.235.607.29
Low grade for the building energy efficiency level (KRW)−5,427,284−11,133,909−11,740,0442.253.074.07

