Article

Evaluation of Landscape Ecological Integrity in the Yulin Region, China

1
College of Forestry, Shanxi Agricultural University, Taigu 030801, China
2
College of Urban and Environmental Science, Northwest University, Xi’an 710124, China
3
Key Laboratory of Surface System and Environmental Carrying Capacity in Shaanxi Province, Xi’an 710124, China
4
College of Earth Science and Resources, Chang’an University, Xi’an 710054, China
*
Author to whom correspondence should be addressed.
Sustainability 2018, 10(11), 4300; https://doi.org/10.3390/su10114300
Submission received: 5 October 2018 / Revised: 8 November 2018 / Accepted: 16 November 2018 / Published: 20 November 2018

Abstract

:
We developed a framework and an index to evaluate landscape ecological integrity. The framework was applied to the Yulin region (Shaanxi Province, China) to evaluate its overall ecological integrity and the effect of the Grain for Green Project on landscape ecological integrity. Landscape ecological integrity (LEI) is the ability of an ecosystem to maintain its self-organization capacity, stability, and diversity in structure and function. A landscape having high ecological integrity has three major characteristics: complex structure, high self-organization capacity, and a high level of stability. The LEI can be evaluated using five indicators: landscape fragmentation, connectance, ecological sensitivity, diversity, and vegetation productivity. The results indicate that the LEI in the Yulin region was relatively low during the period from 2000 to 2015. From 2000 to 2005, areas of very low and low LEI decreased, and areas of moderate and high LEI increased. From 2005 to 2010, areas of low and high LEI decreased, and areas of moderate LEI increased. Furthermore, from 2010 to 2015, areas of very low and low LEI increased, and areas of moderate and high LEI decreased. Overall, the LEI of the region was low, but increased between 2000 and 2010, and decreased between 2010 and 2015. On the basis of these findings, we conclude that the Grain for Green Project in the Yulin region has been successful in improving regional LEI.

1. Introduction

The term ecological integrity originated in 1949 from the ethical concept of Leopold, but this was largely qualitative [1]. It is an important concept in resource management and environmental protection, but various definitions have been used. With respect to parks, the Canada National Parks Act defines ecological integrity as a condition characteristic of the natural region, and likely to persist [2]. Parrish et al. [3] defined landscape ecological integrity (LEI) as the ability of an ecological and functional organization system to support a biotic community [3,4,5]. At the landscape scale, ecological integrity can be defined as the ability to maintain a balanced landscape ecosystem [3,6,7]. It is also a self-organizational ability [6]. A landscape ecological system of high ecological integrity is one having more natural ecological processes, and minimal influence from anthropogenic activities [3].
Measures of ecological integrity are increasingly being used to monitor and evaluate landscape status. However, many evaluation systems have been used to indicate ecological integrity [4], and different ecological integrity indicators have been developed for different (e.g., aquatic and terrestrial) ecosystems. For example, under the Parks Canada framework, four Earth-observation-based indicators were proposed, related to habitat fragmentation, succession and retrogression, productivity, and species richness [2]. Zampella et al. [8] used multiple indicators (including pH, specific conductance, and stream vegetation) to characterize the ecological integrity of a coastal plain stream system. Among the indices of ecological integrity, Karr’s Index of Biological Integrity is a well-accepted set of biological indicators for measuring the integrity of an aquatic system [1]. Andreasen et al. [9] provided detailed guidelines for developing a terrestrial index of ecological integrity. Reza and Abdullah [6] considered ecological integrity characteristics in a regional context, and developed an approach for establishing an index of regional ecological integrity.
Although the new concept of ecological integrity has been widely discussed [1,2,3,4,5,6,7,8,9,10], research on LEI is limited. Advances in the development of indices of ecological integrity have been made during the past decade [4,10,11,12,13,14,15,16]. While many of these are applicable to small areas, no regional index of ecological integrity that includes both terrestrial and aquatic ecosystems has been developed [6].
The Three-North Shelter Forest Programme is a large-scale forestry ecological engineering program that has been in operation in northeast, northwest, and north China since 1978. The Water and Soil Loss Control Project is also great programme in China. The Grain for Green Project, which is a project to convert the cropland to forestland and grassland, has been carried out since 1999 in China. These are the most important measures taken to improve the ecological environment in China. Yulin is one of the regions of China in which the projects were carried out. We suppose that the projects, especially the Grain for Green Project, can increase the landscape ecological integrity of Yulin.
Our study aimed to establish a framework for evaluating LEI on a regional scale. A fragmentation indicator built innovatively as a dominant factor also forms part of the framework. The main research calculated the LEI index in the Yulin region (Shaanxi Province, China) in 2000, 2005, 2010, and 2015, and addressed the following questions: (1) Is it possible to evaluate terrestrial LEI using the framework approach? (2) Did the spatiotemporal characteristics of LEI in the Yulin region change during the period 2000–2015? (3) Has the LEI of Yulin been increased by the implementation of various conversation projects, particularly the Grain for Green Project?

2. Materials and Methods

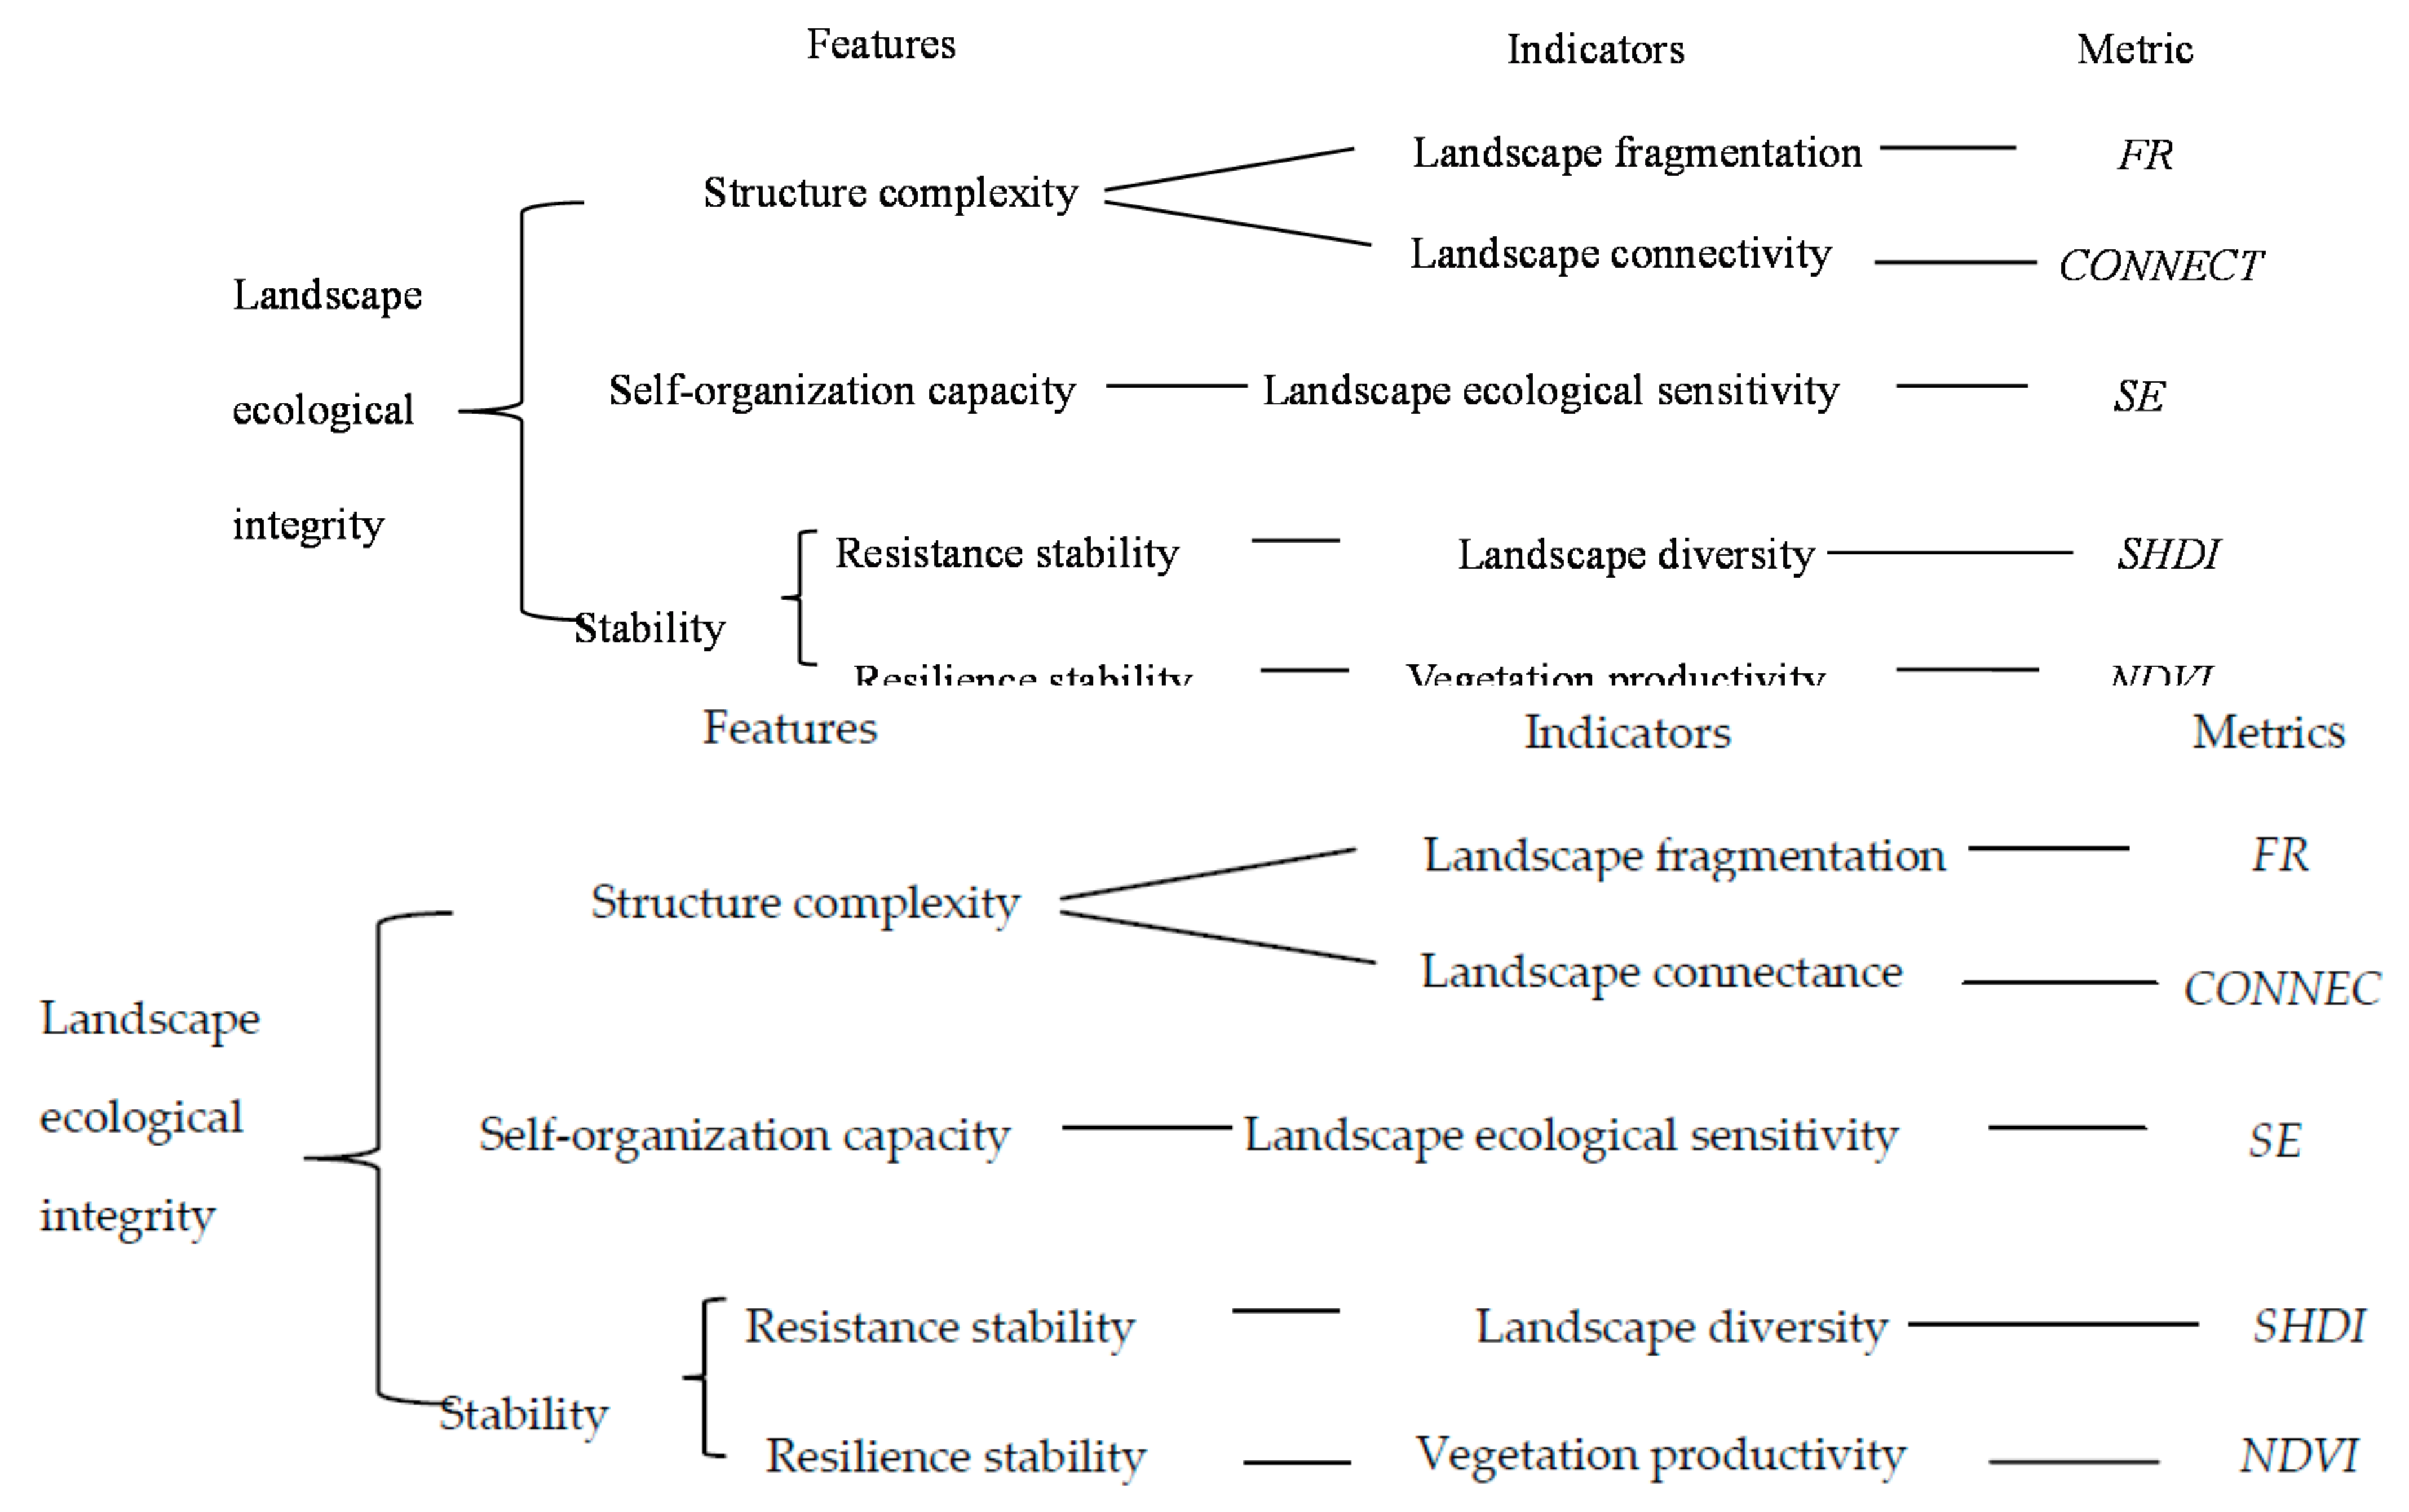
2.1. Framework for Evaluation of Landscape Ecological Integrity

Ecological integrity can be best understood through related concepts including ecosystem health, biodiversity, resilience, and self-maintenance [17]. High integrity implies a landscape ecological system having natural ecological processes and little human influence [3]. The characteristics of ecological integrity include ecosystem health, resilience, and self-organization ability [18]. In this study, we used the LEI to mean the ability of a landscape to maintain its self-organization capacity, stability, and diversity in structure and function. A landscape having high ecological integrity has three major characteristics: a complex structure, high capacity for self-organization, and high levels of stability. In general, if other conditions are constant, landscape ecosystems with more complex structures have more diverse habitats and landscapes, greater self-organization capacity, greater stability, and greater LEI. Therefore, LEI can be evaluated from three aspects: structural complexity, self-organization capacity, and stability.
Landscape fragmentation and connectance reflect the structural complexity of a landscape. Human activities can split an integrated landscape into many small patches, thereby diminishing its integrity. Landscape fragmentation is a main cause of biodiversity loss. Anthropogenic activities including agriculture, aquaculture, and urbanization lead to the occurrence of several spatial processes. Habitat fragmentation is the initial spatial process affecting naturalness. It destroys links or connectance among patches of habitat. The standard metric for evaluating landscape fragmentation is the landscape fragmentation index (FR). Damage to habitats can change spatial relationships among habitat patches. Consequently, the sensitivity of spatial relationships to patch loss and associated loss of connectance is a crucial factor in determining the ecological integrity of a region [19]. Landscape connectance is a characteristic of natural landscapes, and refers to the functional linkages among habitat patches [1]. It is a multi-scalar concept, and can be used to investigate how the interactions between the ability of species to move and landscape structure affect key ecological processes, including species survival and gene flow in a fragmented landscape [20]. The metric we used for determining landscape connectance was the connectance index.
A feature of ecological integrity is self-organization capacity [21]. The greater the self-organization capacity of a system, the greater is its ability to maintain organization and resist perturbations. Landscape ecological sensitivity can be defined as the sensitivity of ecosystems in a landscape to interference. Ecological sensitivity reflects the degree to which ecological problems are likely to occur when a landscape is subject to interference. Ecological problems readily occur when the self-organization capacity of a landscape is low. Thus, the higher the landscape ecological sensitivity, the lower the self-organization capacity of that landscape ecosystem. The metric we used to evaluate landscape ecological sensitivity was the landscape ecological sensitivity index (SE).
Stability refers to the ability of a landscape to maintain its original state when subject to perturbation (i.e., a landscape’s ability to resist interference), as well as its tendency to return to its original state (i.e., its ability to recover). Thus, stability includes aspects of resistance and resilience.
Landscape ecosystems with high levels of integrity are comparatively resistant to environmental change and external pressures, and are able to return to original conditions following a disturbance [9]. Resilience is the ability of a system to absorb disturbance and maintain function and structure [22]. Vegetation can be an indicator of terrestrial landscape ecosystem vigor. If other conditions are constant, the greater the vegetation cover and biomass, the faster an ecosystem will recover. Therefore, resilience can be represented by vegetation productivity, whereby the greater the vegetation productivity, the greater the resilience of the landscape ecosystem. The normalized difference vegetation index (NDVI) is strongly correlated with the amount of vegetation in an area [23]. This index provides information about the spatial and temporal distribution of vegetation communities, and vegetation biomass [24]. The NDVI is the most commonly used vegetation index, and has been linked to the fraction of photosynthetically-active radiation intercepted by vegetation, and consequently to primary productivity [25]. Therefore, we used the NDVI to represent vegetation productivity. Diversity leads to stability [26]; thus, the resistance of a landscape ecosystem to interference can be measured by landscape diversity. The metric we used to determine resistance to interference was the landscape diversity index.
In total, to evaluate the LEI, we used five major indicators related to the structure and function of the landscape ecosystem: landscape fragmentation, landscape connectance, ecological sensitivity, landscape diversity, and vegetation productivity (Figure 1).
Using this approach, we developed a framework to evaluate landscape ecological integrity based mainly on landscape patterns. Refinements, such as inclusion of functional indicators for monitoring, will be the subject of follow-up research.

2.2. Study Area

Yulin is located in the northern part of Shaanxi Province (China), between 31°42′ and 39°35′ N, 105°29′ and 111°15′ E, and covers an area of approximately 43,578 km2. The region includes two main geological areas: one characterized by wind-blown sand, in the southern part of the Mu Us Sandy Land, and the other is a hilly loess area (Figure 2). The sandy area is mainly on the Ordos Plateau, and the hilly loess area is mainly on the Loess Plateau (Huangtu Plateau). The region has a continental semi-arid monsoon climate, is located in a temperate zone, and has four distinct seasons (the rainy season is summer). The average annual temperature is 10 °C and the annual precipitation is 400 mm. Yulin is the only region in Shaanxi Province that has both internal and external drainage. It is located in the transitional zone between the Mu Su Sandy Land (Maowusu Desert) and the Loess Plateau, and in the ecotone between farming and pasture. As an ecologically fragile region of China with a semi-arid climate, Yulin is also a significant region for several national programs, including the Three-North Shelter Forest Programme and the Grain for Green Project.

2.3. Data Acquisition and Pre-Processing

Landsat enhanced thematic mapper (ETM) images for 2000, 2005, 2010, and 2015; a 30 m digital elevation model (DEM); and NASA (National Aeronautics and Space Administration) moderate resolution imaging spectroradiometer (MODIS) normalized difference vegetation index (NDVI) datasets were provided by the Geospatial Data Cloud, Computer Network Information Centre, Chinese Academy of Sciences (http://www.gscloud.cn).
To obtain landscape maps from the ETM images for 2000, 2005, 2010, and 2015, we classified the landscape into 11 types: farmland, which is cultivated land for crops; forestland, which is land of trees and shrubs; high coverage grassland, which is land of grass whose degree of grass coverage is more than 50%; moderate coverage grassland, which is land of grass whose degree of grass coverage is between 20% and 50%; low coverage grassland, which is land of grass whose degree of grass coverage is between 5% and 20%; mining and industrial land, which is land of coal and oil, among others, and land for industry out of the city; urban and residential land, which is urban land and rural residential land; water, saline, and alkaline land; sandy land, which is covered by sand; and bare land, which is land covered by soil or rock and land of grass whose degree of grass coverage is less 5%.
To analyze the spatial characteristics of LEI, the Yulin region was divided into 527 grids of approximately 10 km × 10 km (Figure 3). The area of most grids was 100 km2, but on the boundary, they were smaller. The index of LEI (ILEI) was calculated for each grid and assigned to the geographical center of the grid as its attribute value. On the basis of grid system sampling methods, we used ordinary kriging in ArcGIS( a geographic information system software) to interpolate the ILEI, and the results were divided into four levels.

2.4. Model to Evaluate the LEI
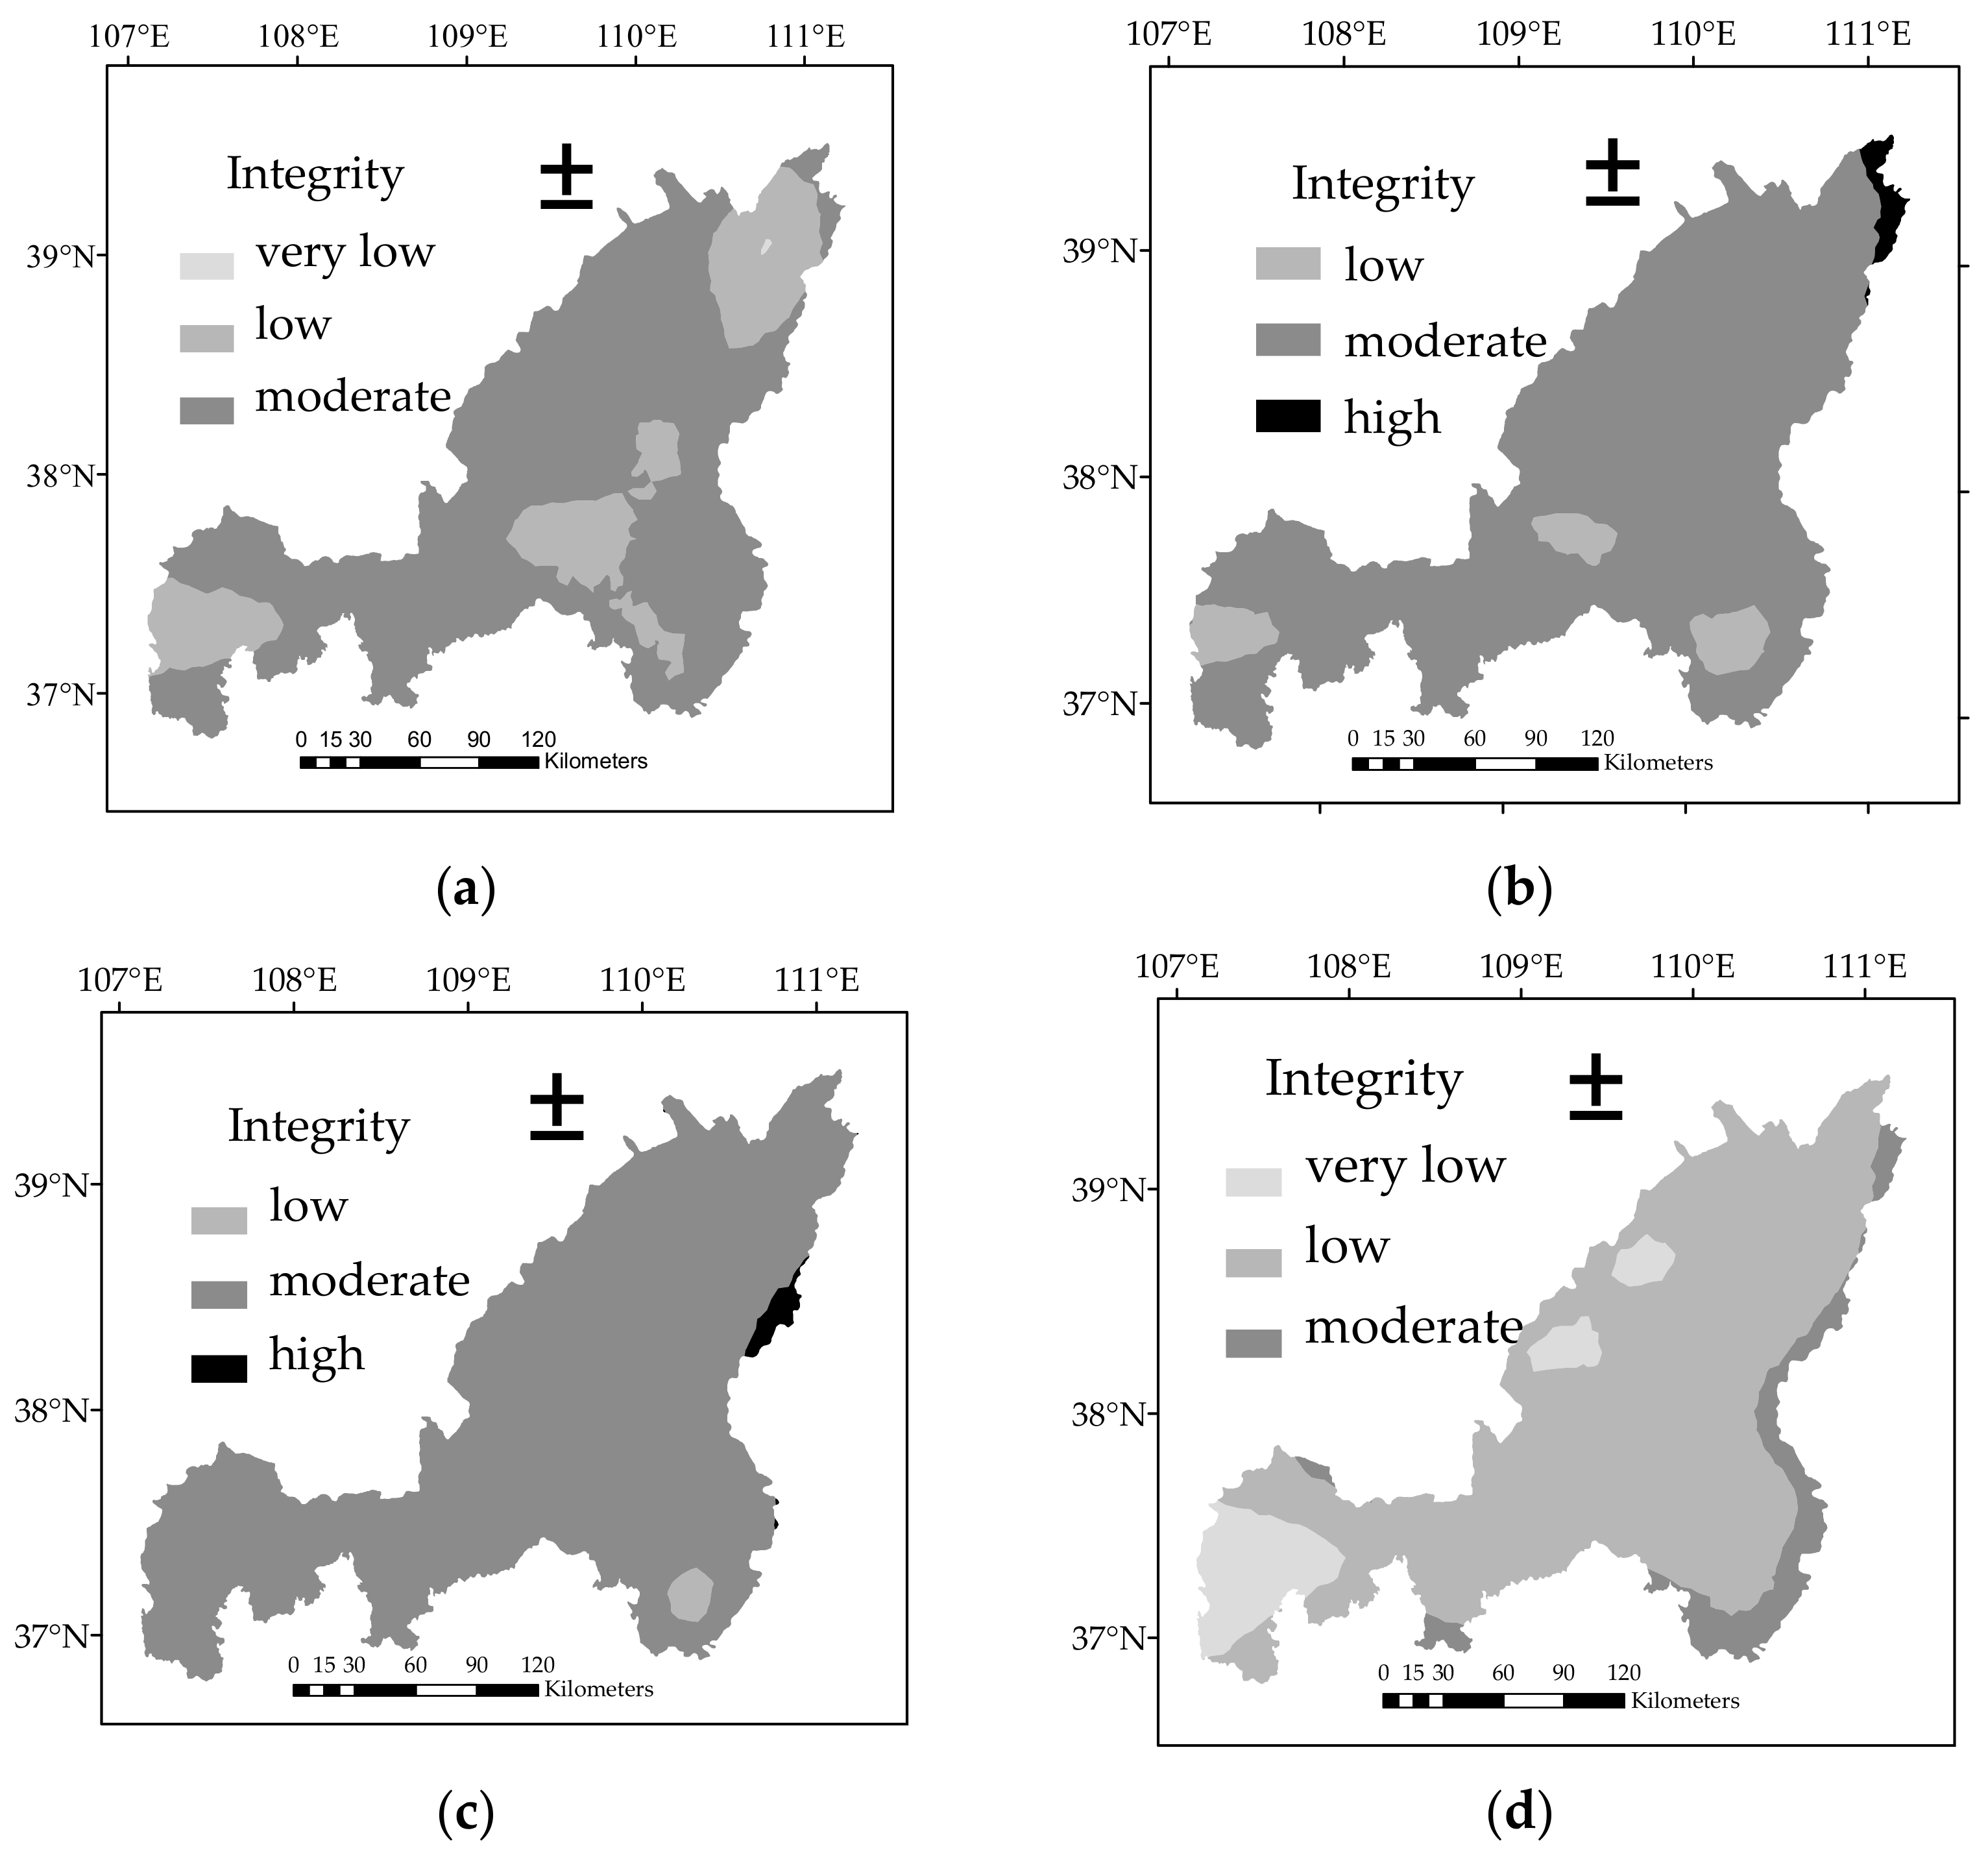
We described the LEI using three aspects: structural complexity, which was indicated by landscape fragmentation and landscape connectance; self-organization capacity, which was characterized by landscape ecological sensitivity; and stability, which was characterized by landscape diversity and vegetation productivity. On the basis of this framework, to evaluate the LEI, we used five major indicators related to the structure and function of the landscape ecosystem, including landscape fragmentation, landscape connectance, landscape ecological sensitivity, landscape diversity, and vegetation productivity.
(1) Landscape fragmentation
We developed a model for a new fragmentation index at the landscape scale (Equation (1)).
FR = (NP × TE)/(TA × 10,000)
where FR is the landscape fragmentation index, NP is the total number of patches in the landscape, TE is the total length (m) of edges within the landscape, and TA is the total landscape area (m2).
(2) Landscape connectance
To represent connectance at the landscape scale, we used the connectance index in FRAGSTATS, which is a spatial pattern analysis program for categorical maps. The index measures the functional connectance among grid cells, that is, the number of functional joins between all patches of a corresponding type. We determined the connectance index using Equation (2).
C O N N E C T = [ i = 1 m j = k n C i j k / i = 1 m ( n i ( n i 1 ) / 2 ) ] × 100
where CONNECT is the connectance index (0 ≤ CONNECT ≤ 100), Cijk is the joining between patch j and k (0 = unjoined, 1 = joined) of the corresponding patch type i (based on a user-specified threshold distance of 50 m in this study we think in landscape scale, when the distance between the patch i and j of the same patch type is equal to or less than 50 m, they are connectable), and ni is the number of patches of patch type i in the landscape.
(3) Landscape diversity
Shannon’s index is somewhat more sensitive to rare cover types than Simpson’s diversity index. When the dominant cover type is of interest, the Simpson index of diversity is preferred [27]. For landscape management within an ecological framework, it is better to use Shannon’s index [27]. Thus, we used Shannon’s diversity index (SHDI) in FRAGSTATS as the landscape diversity index, using Equation (3).
S H D I = i = 1 m ( p i × ln   p i )
where SHDI is Shannon’s diversity index, and pi is the proportion of the landscape occupied by patch type (class) i.
(4) Vegetation productivity
We used the NDVI as an indicator of vegetation productivity, and obtained 250-m monthly averaged MODIS NDVI data for July 2000, 2005, 2010, and 2015 with the maximum value composition (MVC) method.
(5) Landscape ecological sensitivity
We researched the landscape ecological sensitivity from 2000 to 2010 in Yulin [28]. That gave us a way to calculate landscape ecological sensitivity. We considered three types of sensitivity: sensitivity to soil erosion, sensitivity to land desertification, and sensitivity to human factors. Sensitivity to soil erosion was based on three factors: soil texture, terrain undulation, and vegetation or land use. Sensitivity was divided into five classes for each factor (Table 1).
We first calculated the sensitivity for each factor, and then calculated the sensitivity to soil erosion. To determine the sensitivity to soil erosion for each factor, we used Equation (4).
s i = k = 1 5 ( c i k w k )
where Si is the index of sensitivity to soil erosion for factor i, where the higher sensitivity to soil erosion, the higher the value of Si; cik is the proportion of the sensitivity class k for factor i; and wk is the weight of the sensitivity class k. The weights for insensitive and mild, moderate, high, and extreme sensitivity were 0.05, 0.10, 0.20, 0.25, and 0.40, respectively. These weights were determined from a weight model using IDRISI Selva software version 17.0 produced by Clark University. By performing pairwise comparisons of the five indicators and judging their relative importance, we created a pairwise comparison matrix based on this judgment. The weight model in IDRISI was then run to calculate the weights.
The sensitivity to soil erosion was determined using Equation (5).
S E s l = i = 1 3 ( s i w i )
where SEsl is the index of sensitivity to soil erosion, wi is the weight of factor i, and Si is the index of sensitivity to soil erosion shown in Equation (4). The weights for sensitivity of soil texture, terrain undulation, and vegetation or land use were 0.2, 0.4, and 0.4, respectively, which were also determined from the weight model using IDRISI Selva software.
Equation (6) was used to measure the sensitivity to desertification.
S E s a = k = 1 5 ( c k w k )
where SEsa is the index of sensitivity to desertification, ck is the proportion of the sensitivity class k, and wk is the weight of sensitivity class k. Sensitivity was divided into five classes and determined by landscape type, land use, and land cover. The sensitivity classes and weights are shown in Table 2.
Because farmland, mining land, urban land, and residential land mainly reflect human activities, sensitivity to human factors was calculated according to the relative areas of these land use types (Equation (7)).
SEhu = (Afa + Are + Ami)/TA
where SEhu is the index of sensitivity to human factors, Afa is the farmland area, Are is the urban and residential land area, Ami is the mining land area, and TA is the total area.
After calculating the sensitivities to soil erosion, desertification, and human factors, landscape sensitivity was determined using Equation (8).
S E = α S E s l + β S E s a + γ S E h u
where SE is the landscape sensitivity index and α, β, and γ are the weights (0.28, 0.28, and 0.44, respectively) for landscape sensitivity to soil erosion, desertification, and human factors, respectively.
(6) Index normalization
Index normalization was used to ensure the data were comparable among indices without inclusion of other dimensions. All index values were transformed to dimensionless forms using Equation (9).
X* = (XXmin)/(XmaxXmin)
where X* is the normalised value of a single index, X is the original index value, Xmin is the minimum for all samples, and Xmax is the maximum for all samples.
(7) Index of LEI (ILEI)
After normalization of the indices CONNECT, FR, SHDI, NDVI, and SE, the ILEI was calculated using Equation (10).
I L E I = ρ C O N N E C T λ F R + φ S H D I + δ N D V I ε S E
where ILEI is the index of LEI; CONNECT, FR, SHDI, NDVI, and SE are the normalized values of the indices of connectance, fragmentation, landscape diversity, vegetation productivity, and landscape sensitivity, respectively; and ρ, λ, φ, δ, and ε are their respective weights. These weights were determined from a weight model using IDRISI Selva software, the values assigned to ρ, λ, φ, δ, and ε were 0.2216, 0.2216, 0.2216, 0.2716, and 0.0637, respectively. The index of LEI was calculated at two scales: the entire Yulin region and at the grid scale.
(8) Classification of LEI
Following calculation of the ILEI for the 527 grids, kriging interpolation was performed in ArcGIS 9.3. The LEI was then classified in four grades: very low (ILEI < 0.2), low (0.2 ≤ ILEI < 0.4), moderate (0.4 ≤ ILEI < 0.6), and high (ILEI ≥ 0.6).

3. Results

The ILEI values for Yulin as a whole were 0.248 in 2000, 0.287 in 2005, 0.315 in 2010, and 0.208 in 2015. Thus, for the total landscape of the Yulin region, the LEI increased from 2000 to 2010, but decreased from 2010 to 2015.
As indicated in Figure 3 and Table 3, the ILEI values for the Yulin region were relatively low during the period from 2000 to 2015. In 2000, 20.882% of the total area of the Yulin region had low LEI (Figure 4 and Table 3), while 79.066% of the total area had moderate ecological integrity. Areas of low integrity were mainly in the hilly loess region. In 2005, areas of moderate ecological integrity predominated. Low and high ecological integrity areas accounted for only 7.385% of the total area, while those with moderate integrity accounted for 92.615% of the area. Compared with the year 2000, the area of moderate ecological integrity had increased and the area of low and very low ecological integrity had decreased. By 2010, the area of moderate ecological integrity had increased further, accounting for 97.951% of the total area, while the area of low ecological integrity had decreased further, and that of high ecological integrity had also decreased slightly. However, by 2015, the area with low ecological integrity had clearly increased, accounting for 80.39% of the total area, and the area of very low ecological integrity had also increased. In contrast, the area with moderate landscape integrity had clearly decreased by 2015. Thus, in general, the areas with very low and low ecological integrity decreased, and those with moderate and high integrity increased between 2000 and 2010. The LEI improved over the same period, but worsened between 2010 and 2015.

4. Discussion

4.1. Landscape Fragmentation Index

Several indices can be used to measure the degree of landscape fragmentation, including patch density, mean patch size, patch perimeter, and patch shape. In this study, we combined the total length of edges and the total number of patches within the landscape to express landscape fragmentation. If two landscapes have the same area and patch number, but different total edge length (TE), the one with the greater total edge length is the more fragmented. In contrast, based on patch density, the two landscapes would be considered to have the same degree of fragmentation. Thus, the fragmentation index we used is an improvement on a patch-density-based index.

4.2. The Landscape Ecological Integrity of the Yulin Region

The ILEI for the Yulin region was low. Spatially, the ILEI over most of the area of the Yulin region was 0.4–0.6 in 2000, 2005, and 2010, and 0.2–0.4 in 2015. The Yulin region has an arid and semi-arid climate with sparse rainfall. It also lies in the juncture between the Mu Us Sandy Land and the Loess Plateau, and has a fragile environment.
Overall, the LEI of the region was determined to be low, but increased between 2000 and 2010. This suggests that the ecological conditions generally improved over this period, which is consistent with findings of previous studies [29,30]. These results suggest that the Three-North Shelter Forest Programme, the Water and Soil Loss Control Project, and the Grain for Green Project have been successful in improving the ecological integrity of the region. However, the Yulin region remains ecologically fragile. These projects should be continued to further improve the region’s ecological resilience.
Natural and human factors lead to variations in LEI. Natural factors result mainly from variations in climate. The climate of the Yulin region, particularly annual temperature and precipitation, did not change significantly during the period 2000–2010, although precipitation decreased slightly [29,31]. Under the Grain for Green Project, the forest and grassland areas in the region have increased, increasing primary productivity and landscape connectance and diversity, and decreasing landscape fragmentation and landscape ecological sensitivity. We hypothesize that the increase in LEI in the Yulin region is mainly a result of this project, which has addressed the human activities that have the greatest environmental impact in the Yulin region over the study period. This indicates that the Grain for Green Project has been successful in improving the region’s ecological conditions.
The Yulin region is a target in Shaanxi Province for the Grain for Green Project, which commenced in 1999. Since that time, the total forest area has exceeded 22.67 × 10⁴ hm2, and the forest cover in the region has increased by 8.6%. The total area covered by the Grain for Green Project from 1999 to 2008 was 53.31 × 10⁴ hm2. The total area forested through the Three-North Shelter Forest Programme from 1978 to 2006 was 132.07 × 10⁴ hm2, with the forest area comprising 26.7% of the total land area in 2006. The area of fixed and semi-fixed sand was >2.0 × 10⁴ hm2, with 85% of the sand region controlled in 2006. The height of sand dunes in the region decreased by an average of 30%–50% between 1978 and 2006. Soil and water loss have been effectively controlled since these programs commenced, and sand shifting has ceased or reduced as a consequence of the landscape changes that have resulted from these programs. Therefore, implementation of these projects has improved the ecological conditions, and increased the LEI during the period 2000–2010.
However, urbanization and industrialization has increased since 2010. More than 100 construction projects were completed between 2010 and 2015, including colliery, industrial, and road-building projects. The built land area increased by 13,698.32 hm2 from 2010 to 2013, and during this period, the land area associated with urbanization, mining, and farming increased by 5211.64 hm2, 6611.16 hm2, and 59,156 hm2, respectively. This coincided with a decrease in the forest and grassland area by 14,505.56 hm2. These changes have inevitably led to landscape fragmentation, increased landscape ecological sensitivity, and decreased connectance, and thus to a decrease in LEI. In addition, with the expansion of industrial enterprises and their production capacity (Table 4), there has been an increase in water consumption. Water consumption by industry in the Yulin region was 0.529 × 10⁸ m3 in 2004, 1.297 × 10⁸ m3 in 2010, and 1.796 × 10⁸ m3 in 2013. Agriculture is also a major consumer of water, including 4.927 × 10⁸ m3 in 2004, 4.920 × 10⁸ m3 in 2010, and 5.296 × 10⁸ m3 in 2013 [32]. Thus, in terms of water use, the LEI decreased in 2015.

5. Conclusions

We developed an effective framework for evaluating landscape ecological integrity, which we will refine through further study. Overall, the LEI of the Yulin region was found to be low. This was related to the natural conditions and human activities, with variation in the LEI over the 15 years of the study related mainly to human factors. After 1999, the Grain for Green Project contributed to an increase in the LEI, but increasing urbanization and industrialization has led to a decrease since 2010. Our findings highlight that improving landscape ecological conditions is a long-term and difficult task.

Author Contributions

Y.S. and T.L. participated in all phases and contributed mainly to this work, including the establishment and application of the framework. N.W. and T.L. advised Y.S. in the process of writing the paper and revised the whole paper. Y.S., H.W., H.K., and X.S. interpreted ETM images and made part of the calculations. All authors contributed to the investigation, and have read and approved the final manuscript.

Funding

This research was funded by the National Natural Science Foundation of China (No. 31140042) and National Key R&D Program of China (No. 2017YFC0404302).

Conflicts of Interest

The authors declare no conflict of interest.

References

  1. Reza, M.I.H. Importance and Considerations for the development of a composite Index of Ecological Integrity for ecological management. Int. J. Ecol. Dev. 2014, 28, 33–48. [Google Scholar]
  2. Fraser, R.H.; Olthof, I.; Pouliot, D. Monitoring land cover change and ecological integrity in Canada’s national parks. Remote Sens. Environ. 2009, 113, 1397–1409. [Google Scholar] [CrossRef]
  3. Parrish, J.D.; Braun, D.P.; Unnasch, R.S. Are We Conserving What We Say We Are? Measuring Ecological Integrity within Protected Areas. BioScience 2003, 53, 851–860. [Google Scholar] [CrossRef]
  4. Theobald, D.M. A general model to quantify ecological integrity. Landsc. Ecol. 2013, 1859–1874. [Google Scholar] [CrossRef]
  5. Heckmann, K.E.; Manley, P.N.; Schlesinger, M.D. Ecological integrity of remnant montane forests along an urban gradient in the Sierra Nevada. For. Ecol. Manag. 2008, 255, 2453–2466. [Google Scholar] [CrossRef]
  6. Reza, M.I.H.; Abdullah, S.A. Regional Index of Ecological Integrity: A need for sustainable management of natural resources. Ecol. Indic. 2011, 11, 220–229. [Google Scholar] [CrossRef]
  7. Karr, J.R. Ecological integrity and ecological health are not the same. In Engineering within Ecological Constraints; Schultze, P., Ed.; National Academy of Science: Washington, DC, USA, 1996. [Google Scholar]
  8. Zampella, R.A.; Bunnell, J.F.; Laidig, K.J.; Procopio, N.A. Using multiple indicators to evaluate the ecological integrity of a coastal plain stream system. Ecol. Indic. 2006, 6, 644–663. [Google Scholar] [CrossRef]
  9. Andreasen, J.K.; O’Neill, R.V.; Noss, R.; Slosser, N.C. Considerations for the development of a terrestrial index of ecological integrity. Ecol. Indic. 2001, 1, 21–35. [Google Scholar] [CrossRef] [Green Version]
  10. Ramesh, S.; Kaplana, K. Ecological integrity and environmental protection for Vijayawada region—Scattered Eastern Ghats. Int. J. Sustain. Built Environ. 2015, 4, 109–116. [Google Scholar] [CrossRef]
  11. DeKeyser, E.S.; Kirby, D.R.; Ell, M.J. An index of plant community integrity: Development of the methodology for assessing prairie wetland plant communities. Ecol. Indic. 2003, 3, 119–133. [Google Scholar] [CrossRef]
  12. Hargiss, C.L.M.; DeKeyser, E.S.; Kirby, D.R.; Ell, M.J. Regional assessment of wetland plant communities using the index of plant community integrity. Ecol. Indic. 2008, 8, 303–307. [Google Scholar] [CrossRef]
  13. Hughes, J.E.; Deegan, L.A.; Weaver, M.J.; Costa, J.E. Regional application of an index of estuarine biotic integrity based on fish communities. Estuaries 2002, 25, 250–263. [Google Scholar] [CrossRef]
  14. Solimini, A.G.; Bazzanti, M.; Ruggiero, A.; Carchini, G. Developing a multrimetric index ofecological integrity based on macroinvertebrates of mountain ponds in central Italy. Hydrobiologia 2008, 597, 109–123. [Google Scholar] [CrossRef]
  15. Angermeier, P.L.; Davideanu, G. Using fish community to assess streams in Romania: Initial development of an index of biotic integrity. Hydrobiologia 2004, 511, 65–78. [Google Scholar] [CrossRef]
  16. Ortega, M.; Velasco, J.; Millan, A.; Guerrero, C. An ecological index for littoral wetlands in agricultural catchments of semiarid Mediterranean regions. Environ. Manag. 2004, 33, 412–430. [Google Scholar] [CrossRef] [PubMed]
  17. Ordóñez, C.; Duinker, P.N. Ecological integrity in urban forests. Urban Ecosyst. 2012, 15, 863–877. [Google Scholar] [CrossRef]
  18. Müller, F. Indicating ecosystem and landscape organisation. Ecol. Indic. 2005, 5, 280–294. [Google Scholar] [CrossRef]
  19. Matisziw, T.C.; Murray, A.T. Connectance change in habitat networks. Landsc. Ecol. 2009, 24, 89–100. [Google Scholar] [CrossRef]
  20. Luque, S.; Saura, S.; Fortin, M.-J. Landscape connectance analysis for conservation: Insights from combining new methods with ecological and genetic data. Landsc. Ecol. 2012, 27, 153–157. [Google Scholar] [CrossRef]
  21. Stevens, F.; Bogaert, P.; van Wesemael, B. Detecting and quantifying field-related spatial variation of soil organic carbon using mixed-effect models and airborne imagery. Geoderma 2015, 259–260, 93–103. [Google Scholar] [CrossRef]
  22. Folke, C.; Carpenter, S.; Walker, B.; Scheffer, M.; Elmqvist, T.; Gunderson, L.; Holling, C.S. Regime sifts reslilience and biodiversity in ecosysytem management. Annu. Rev. Ecol. Evol. Syst. 2004, 35, 557–581. [Google Scholar] [CrossRef]
  23. Pettorelli, N.; Vik, J.O.; Mysterud, A.; Gaillard, J.M.; Tucker, C.J.; Stenseth, N.C. Using the satellite-derived NDVI to assess ecological responses to environmental change. Trends Ecol. Evol. 2005, 20, 503–510. [Google Scholar] [CrossRef] [PubMed]
  24. Reed, B.C.; Brown, J.F.; VanderZee, D.; Loveland, T.R.; Merchant, J.W.; Ohlen, D.O. Measuring phenological variability from satellite imagery. J. Veg. Sci. 1994, 5, 703–714. [Google Scholar] [CrossRef]
  25. Baldi, G.; Nosetto, M.D.; Aragón, R.; Aversa, F.; Paruelo, J.M.; Jobbágy, E.G. Long-term Satellite NDVI Data Sets: Evaluating Their Ability to Detect Ecosystem Functional Changes in South America. Sensors 2008, 8, 5397–5425. [Google Scholar] [CrossRef] [PubMed] [Green Version]
  26. Loreau, M.; Mazancourt, C.D. Biodiversity and ecosystem stability: A synthesis of underlying mechanisms. Ecol. Lett. 2013, 16 (Suppl. S1), 106–115. [Google Scholar] [CrossRef] [PubMed]
  27. Nagendra, H. Opposite trends in response for the Shannon and Simpson indices of landscape diversity. Appl. Geogr. 2002, 22, 175–186. [Google Scholar] [CrossRef]
  28. Shi, Y.; Li, T.; Shi, X.; Kang, H.; Yan, Y. Spatial-temporal characteristics of landscape ecological sensitivity in Yulin area. Remote Sens. Land Resour. 2017, 29, 167–172. (In Chinese) [Google Scholar]
  29. Song, F.; Xing, K.; Liu, Y.; Liu, Z.C.; Kang, M.Y. Monitoring and assessment of vegetation variation in northern Shaanxi based on MODIS/NDVI. Acta Ecol. Sin. 2011, 31, 354–363. (In Chinese) [Google Scholar]
  30. Bai, J.; Bai, J.; Wang, L. Spatio-temporal change of vegetation NDVI and its relations with regional climate in northern Shaanxi province in 2000–2010. Sci. Geogr. Sin. 2014, 34, 882–888. (In Chinese) [Google Scholar]
  31. Zheng, J.; Sun, H. Analysis of Characteristics of Precipitation in Yulin Area of Shaanxi Province. Acta Agric. Jiangxi 2015, 27, 94–98. (In Chinese) [Google Scholar]
  32. Zhang, X. The utilization of water resource of Yulin. Shaanxi Water Resour. 2015, 6, 117–120. (In Chinese) [Google Scholar]
Figure 1. A framework to evaluate landscape ecological integrity (LEI). FR—lanscape fragmentation index; CONNECT—connectance index; SE—landscape ecological sensitivity index; SHDI—Shannon’s diversity index; NDVI—normalized difference vegetation index.
Sustainability 10 04300 g001
Figure 2. Map showing the Yulin region and associated distinct areas.
Sustainability 10 04300 g002
Figure 3. The Yulin divided into 527 grids of approximately 10 km × 10 km.
Sustainability 10 04300 g003
Figure 4. The LEI in the Yulin region in 2000 (a), 2005 (b), 2010 (c), and 2015 (d) by integrity grade.
Sustainability 10 04300 g004
Table 1. Sensitivity classes for soil and water loss.
Sensitivity ClassSoil TextureTerrain Undulation (m)Vegetation or Land Use
1 InsensitiveClay loam0–20Water, paddy field, marsh
2 MildGravel loam, sandy loam clay20–50High coverage grassland, forest land
3 ModerateLoam51–100Moderate and low coverage grassland, saline alkali land
4 HighSandy loam101–300Sand land, farmland
5 Extreme Sandy soil>300Bare, mining and industry, built land
Table 2. Desertification sensitivity classes and their weights.
Sensitivity ClassLand Use and Land CoverWeight
1 InsensitiveForest, high coverage grassland, water0.05
2 MildModerate coverage grassland, urban and residential land0.10
3 ModerateSaline alkali land, land for mining and industry, farmland0.20
4 HighBare land, low coverage grassland0.25
5 ExtremeSand0.40
Table 3. Proportion of land area classified into various landscape ecological integrity (LEI) grades (%).
YearVery LowLowModerateHighTotal
20000.05220.88279.0660100
20050.05.94792.6151.438100
20100.01.00097.9511.049100
201510.38180.3909.2290100
Table 4. Partial industrial production in the Yulin region (×104 t).
2000200520102015
Raw coal3125.06560.325,73236,103.5
Crude oil89.0476.49831186.94
Crude salt7.526.340.98134.8
Washed coal___7053.05
Fine methanol_46.88119.86222.07
Polyvinyl chloride__16.41131.36
Semi-coke__959.562499.11
Gas (×108 m3)3460.5109.86151.13
Electric energy (×108 kwh)_68.45356.96629.34
From statistical bulletins on national economic and social development in the Yulin region.

