Article

Cost-Sharing Mechanisms for A Wood Forest Product Supply Chain under Carbon Cap-and-Trade

College of Economics and Management, Nanjing Forestry University, Nanjing 210037, China
*
Author to whom correspondence should be addressed.
Sustainability 2018, 10(12), 4345; https://doi.org/10.3390/su10124345
Submission received: 24 October 2018 / Revised: 19 November 2018 / Accepted: 20 November 2018 / Published: 22 November 2018

Abstract

:
We consider a wood forest product supply chain consisting of a forestry company and a wood forest products manufacturer, where the forestry company produces timber and forestry carbon sinks, and the manufacturer consumes timber and carbon emission rights. A Stackelberg model is adopted to investigate the forest scale and carbon emission reduction decisions of the supply chain. We design and analyze the carbon emission reduction cost-sharing (ERCS) mechanism and carbon sink cost-sharing (SCS) mechanism, respectively. The result shows that both contracts can help the wood forest product supply chain to achieve higher profits. The ERCS mechanism may encourage the manufacturer to increase emission reduction level and the forestry company to expand the forest scale. The SCS mechanism is beneficial to the expansion of carbon sink forests; however, it may lead to the manufacturer decreasing investment in carbon emission reduction measures.

1. Introduction

As global warming intensifies, mitigating climate change and improving the living environment have become a core consensus of most countries worldwide. In response to the long-term threat posed by climate change, many countries have reached a series of climate policy agreements. The United Nations Framework Convention on Climate Change (UNFCCC) has categorized States Parties and established the principle of “common but differentiated responsibilities”. The Kyoto Protocol was developed on the basis of the UNFCCC. It formulated specific emission reduction tasks for developed countries and designed three flexible compliance mechanisms: Clean Development Mechanism (CDM), Emissions Trading (ET), and Joint Implementation (JI). This is essentially a “cap-and-trade” mechanism. Since then, the Bonn Political, the Marrakesh Accords, and the Conferences of the Parties to the UNFCCC have increasingly recognized the important role of forestry carbon sinks. The forestry companies, as the main producers of forestry carbon sinks, have received increasing attention, and the management of the wood forest product supply chain has also been affected. The total and unit carbon footprint of wood furniture, paper products, wood products, etc. are very large. So, when the government is seriously promoting the carbon quota policy, the wood forest product industry will inevitably be affected.
There are some differences between the general supply chain and the wood forest product supply chain with forestry carbon sinks. In a general supply chain, the manufacturer and the supplier usually trade raw materials only, and joint emission reduction can only be achieved through technical emission reduction or purchasing carbon emission rights from the carbon market. However, in the wood forest product supply chain, the manufacturer and the forestry company trade timber as well as forestry carbon sinks (which can offset carbon emissions). Moreover, the wood forest supply chain can also reduce emissions by increasing carbon sink forests. Forestry carbon sinks have the advantages of multiple benefits, low cost, and economic viability, and are considered to be important measures to increase carbon sinks and reduce emissions in the next 30 to 50 years [1]. Therefore, it is necessary to conduct in-depth research on the forest carbon sinks of the wood forest product supply chain.
We sketch the wood forest product supply chain system under a cap-and-trade mechanism in Figure 1. The forestry company provides timber to the manufacturer to obtain income, and the manufacturer processes the timber into wood forest products and then sells them in the finished product market to get revenue. The forestry carbon sinks produced by the forestry company have two flows. One is to the manufacturer to offset its carbon emissions and meet the requirements of low carbon production. The second is to sell to the carbon-emission-right market, where companies covered by carbon cap policy can purchase the carbon emission rights at market price. In addition to purchasing forestry carbon sinks from the forestry company to offset its carbon emissions, the manufacturer can also reduce emissions by purchasing carbon emission rights from the carbon-emission-right market or by implementing a technical emission reduction. The remaining carbon emission rights can also be sold in the carbon-emission-right market.
In addition, supply chain collaboration or coordination is a new idea of modern enterprise management. It can solve the conflicts of interest among enterprises within the supply chain, take the supply chain as a whole to optimize the strategy, and achieve a win-win situation for different stakeholders. Different types of contracts, such as cost-sharing contracts and revenue-sharing contracts are the most commonly used methods in the supply chain collaboration or coordination process. In recent years, to adapt to supply chains with different characteristics, scholars have developed plenty of innovative contracts, such as co-op advertising contracts, the co-op advertising and emission reduction cost-sharing contracts, and the revenue-sharing contracts with a subsidy on emission reduction [2,3]. However, to our best knowledge, no one has considered coordination contracts for a wood forest product supply chain under the “cap-and-trade” scheme, which will be considered in this paper.
In this paper, we consider a wood forest product supply chain with a forestry company and a manufacturer. Under the mechanism of “cap-and-trade”, we attempt to solve the following problems:
  • In the wood forest product supply chain, will factors such as carbon quota and carbon sink cost affect the forest scale of the forestry company? And will factors such as consumers’ low-carbon preference, the price of carbon sinks, and product demand affect the emission reduction level of the manufacturer?
  • Can traditional coordination mechanisms (such as cost-sharing mechanism) coordinate the wood forest product supply chain with the carbon quota?
  • Which type of cost-sharing mechanism is more suitable for coordinating the emission reduction behavior of the wood forest product supply chain? What impact does the cost-sharing mechanism have on the profit of the supply chain, the total carbon emissions, and the scale of the forest?
The carbon emissions of the manufacturer mainly come from the production processes, such as the use of unclean energy, and the waste of forest resources, etc. In addition, forest areas can absorb carbon dioxide from the atmosphere, thereby offsetting the carbon emissions. Actually, the forestry company is able to produce forestry carbon sinks through afforestation and reforestation.
According to China’s proposed plan, only those companies with emissions of more than 10,000 tons of CO2 equivalent will be involved in the cap-and-trade scheme. Therefore, in this paper, we only consider the manufacturers with large carbon emissions and covered by the cap-and-trade regulation, such as plywood manufacturer, paper manufacturer, and so on.
A Stackelberg model is adopted to investigate the forest scale and carbon emission reduction decisions for the supply chain. Further, we design and analyze carbon emission reduction cost-sharing mechanism (ERCS) and carbon sink cost-sharing mechanism (SCS). The Stackelberg model was originally proposed to solve the production game of two manufacturers in the oligopoly market. One of the two manufacturers is stronger, and the other is weaker, the stronger one decides the output first, the weaker one decides the output later. The manufacturer that makes decisions later knows the choice of the former, so it is a dynamic game problem. After continuous development, the Stackelberg model has been widely used in the research of supply chain decision optimization [4,5,6]. In this paper, the manufacturer is the leader and the forestry company is the follower.
The contributions of this paper are listed as follows.
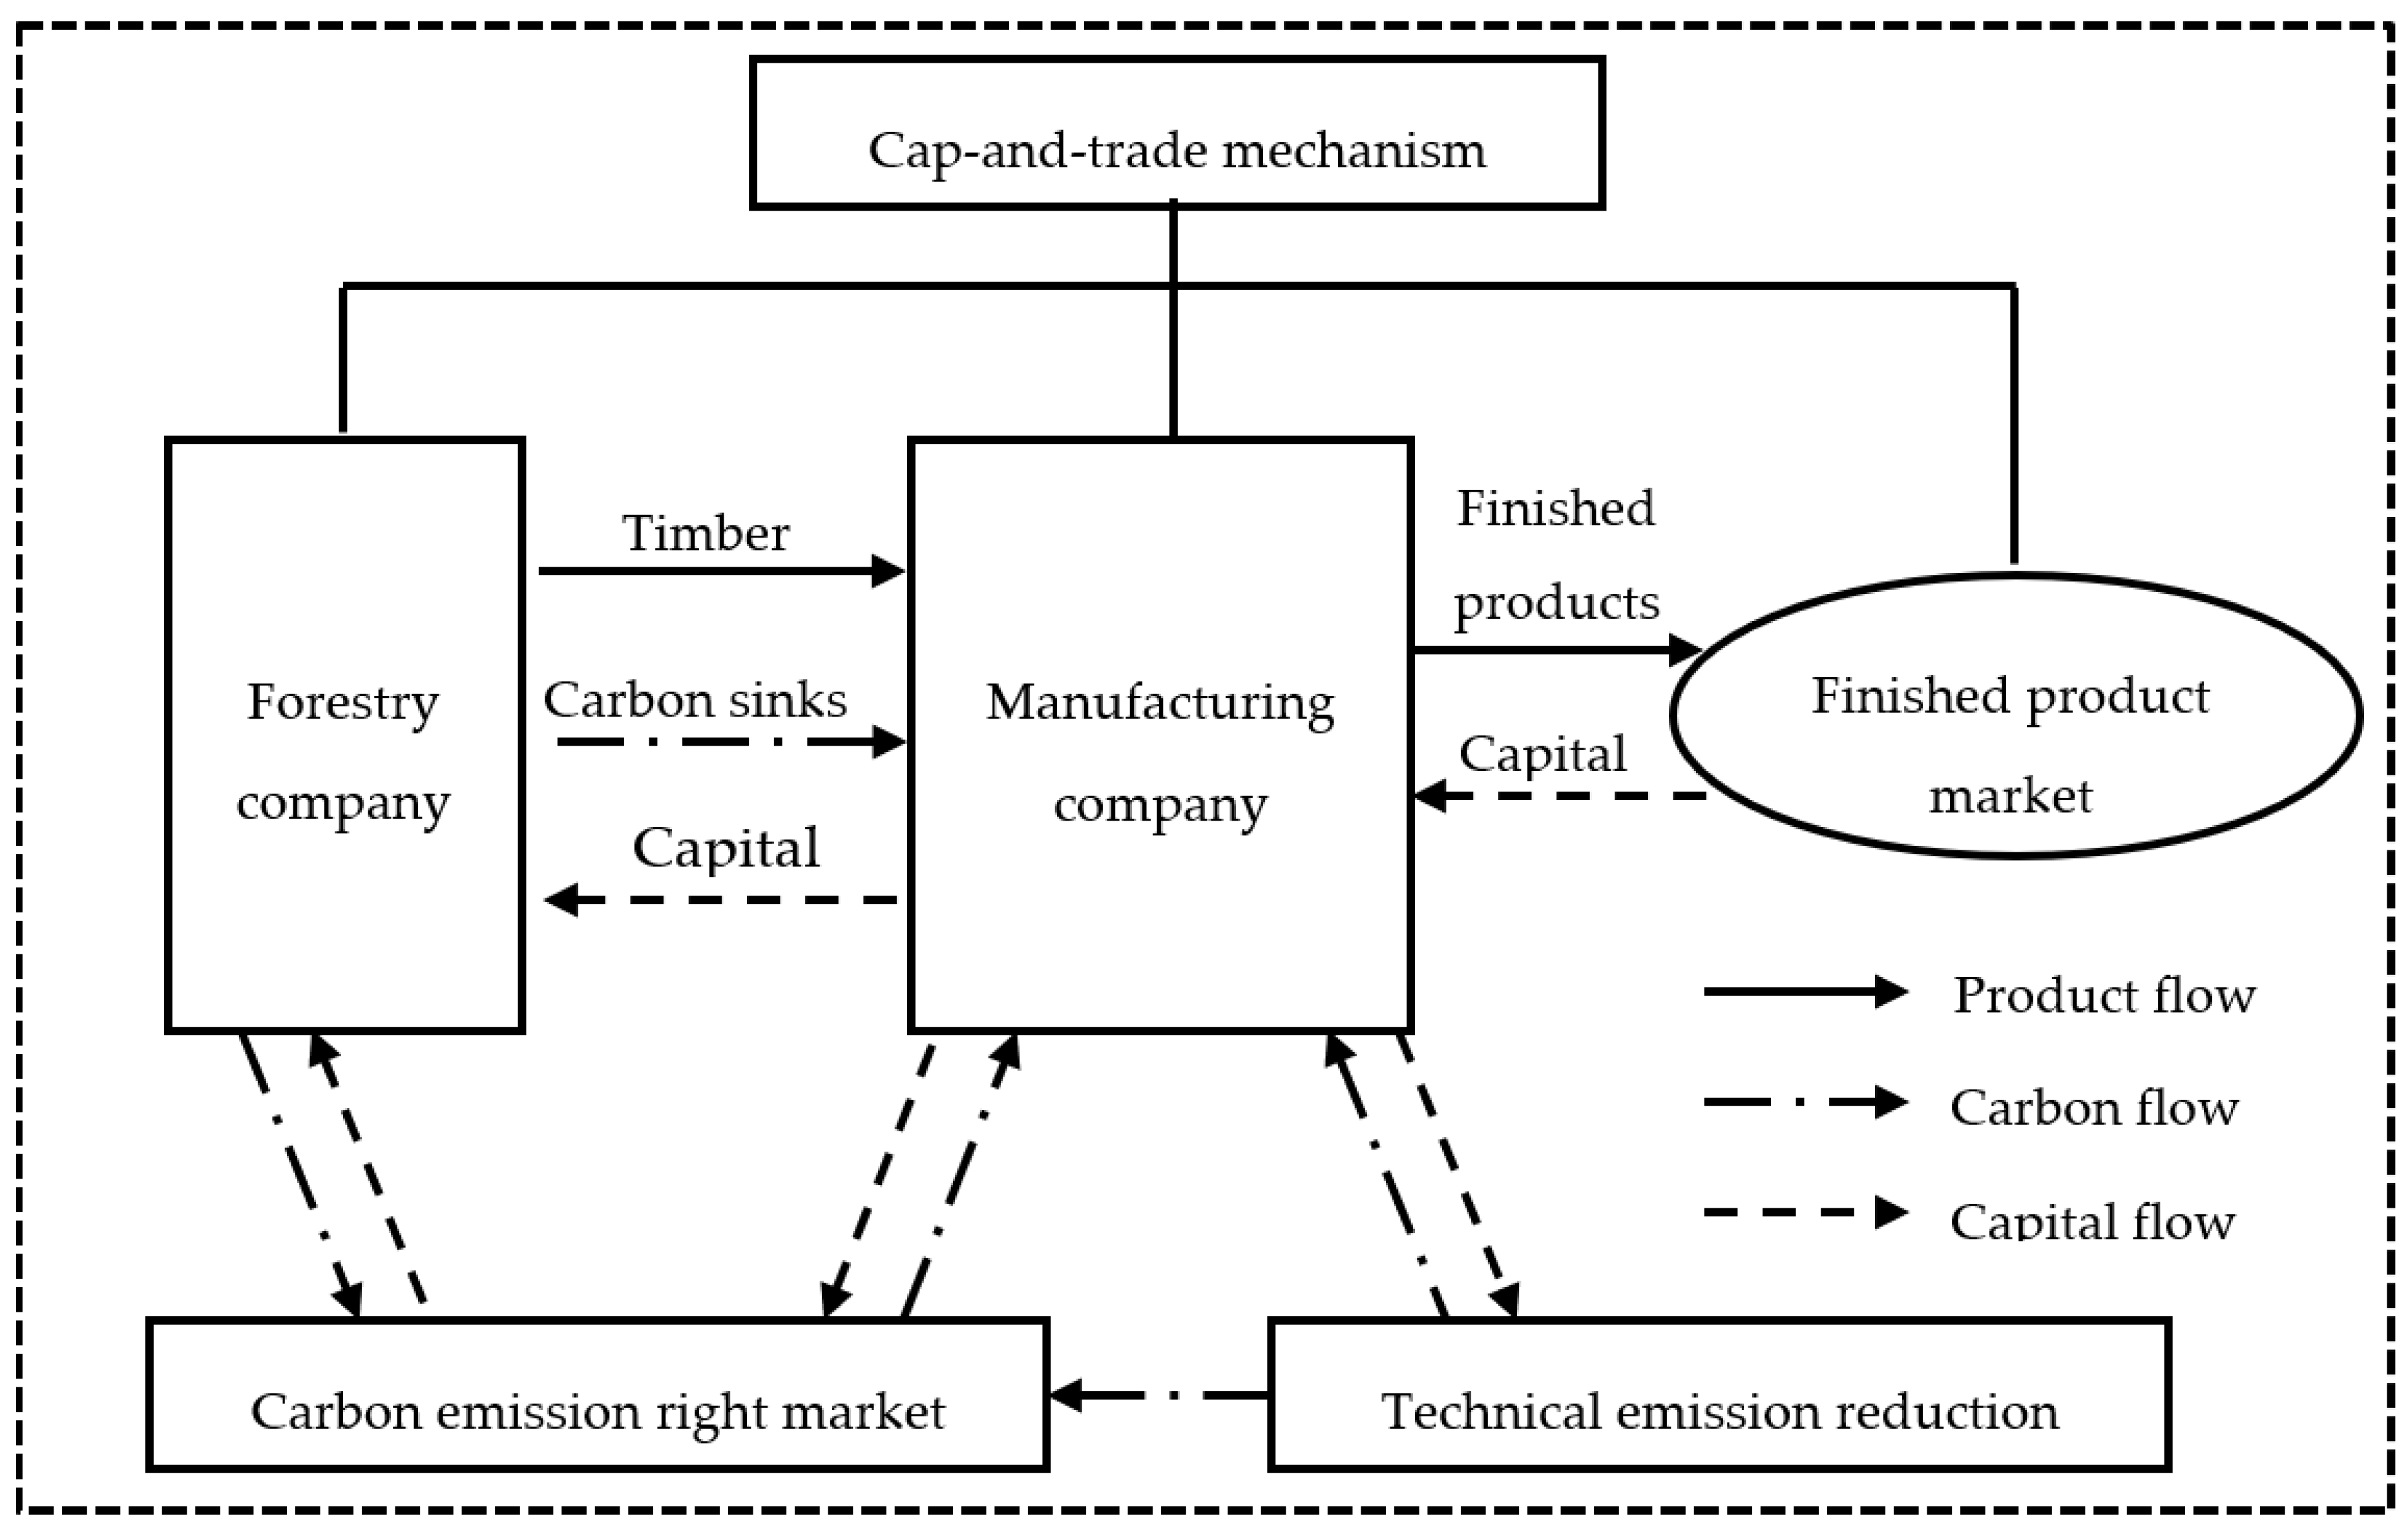
  • We consider a wood forest product supply chain consisting of a forestry company and a forest products manufacturer. The two companies are oligopolistic, so the amount of forestry carbon sink produced by the forestry company has great influences on the price of carbon emission rights. Compared with the general supply chain, the forest product supply chain has the following characteristics: The forestry company can provide the raw material (timber) as well as forestry carbon sinks for the manufacturer. The forestry carbon sinks are able to offset the carbon emissions of the manufacturer, which establishes the basis for cooperation between the members of the supply chain.
  • We focus on the impact of the cap-and-trade mechanism on the wood forest product supply chain and work out the optimal strategy for the forestry company and the manufacturer, so as to guide the members of the wood forest product supply chain to make the right decisions.
  • For the purpose of promoting cooperation between the forestry company and the manufacturer, this paper designs and compares two coordination contracts: carbon emission reduction cost-sharing (ERCS) contract and a carbon sink cost-sharing (SCS) contract. It not only explores the possibility of a joint emission reduction between the manufacturer and the forestry company but also provides some new ideas for the low carbon development of the wood forest product supply chain.
The paper is organized as follows. The literature review and motivations are given in Section 2. The assumptions and notations are given in Section 3. The non-cooperative mechanism is analyzed in Section 4. The SCS mechanism and ERCS mechanism are analyzed in Section 5. We discuss the results and give a numerical example in Section 6, and the conclusions of this paper are stated in Section 7.

2. Literature Review and Motivations

In this section, we review some related literature from three aspects: operation decisions for a low-carbon supply chain, collaboration and coordination contracts for a low-carbon supply chain, and forestry carbon sinks. Moreover, the motivations and certain innovations of this paper are given in this section.

2.1. Operation Decisions for LOW-carbon Supply Chain

With the promotion of the low-carbon economy, the global and regional emission reduction systems have been constantly improved. Enterprises are seeking green development due to regulations or voluntariness. Many researchers focus on the entire supply chain as the target of emission reduction and devote their efforts to low-carbon supply chain management. In general, a centralized supply chain is more beneficial to enterprises and the government than a decentralized supply chain [7]. Carbon emission costs are usually generated during manufacturing and transportation; however, the supply chain can be improved through special measures. For example, the environmental and economic performance of the supply chain can be improved when the buyer delays payment. This is mainly because trade credit reduces the cost of carbon emissions generated by the supply chain during transportation and manufacturing [8]. Moreover, the enhancement of corporate profitability will help enterprises increase investment in technologies of greenhouse gas emission reduction and achieve sustainable emission reductions [9].
Consumers’ low-carbon preference has an impact on supply chain management. When consumers’ low-carbon preference rises, they are willing to pay higher prices for low-carbon products, which will improve the total profit of the supply chain [2]. Therefore, when the market includes a significant portion of customers with a low-carbon preference, in order to make the product appeal to a low-carbon consumer, it is necessary to fully consider consumers’ sensitivity to carbon emissions when designing the supply chain [10]. In addition, low-carbon consumers will also have an impact on sales channels. The introduction of online channels is only beneficial to manufacturers when consumers’ low-carbon sensitivity meets certain conditions [4].
Carbon emission regulations such as carbon quota, carbon tax, and a cap-and-trade mechanism have been considered by many researchers. After comparison, it is found that after a certain design, all three policies can reduce carbon emissions. Among them, carbon tax and a cap-and-trade mechanism can stimulate enterprises to carry out technological innovation. Moreover, enterprises under the cap-and-trade mechanism have lower emission reduction costs because they can sell surplus carbon credits [11]. The carbon tax system will increase the cost of carbon emissions. Some researchers have shown that under the progressive carbon tax system, adopting a high energy consumption strategy could bring a higher environmental cost, which encourages enterprises to gradually shift to a low-energy consumption strategy [12]. The carbon cap-and-trade mechanism is a widely adopted carbon emission regulation and it pays more attention to the power of the market. Under this mechanism, enterprises can obtain additional income by selling carbon credits, implementing cost-effective emission reduction measures, or passing abatement costs to consumers [13]. Some scholars believe that the carbon emission standard for an individual product is superior to carbon tax and mandatory carbon emissions [14]. In the low-carbon supply chain, some attention has been paid to the important role of supply chain carbon financing. Compared with traditional carbon financing methods, lower rate financing for low-carbon investments can reduce financial costs while improving the profit of the supply chain. In addition, it provides new ideas for SMEs (small and medium enterprises) and capital-intensive industries to solve the problem of capital constraints [15].
In this paper, we analyze a wood forest product supply chain where the manufacturer is bound by a cap-and-trade carbon emission regulation. What differentiates our work from the works mentioned above is that we consider the optimal decisions of timber forests and carbon sink forests for the forestry company.

2.2. Collaboration and Coordination Contracts for a Low-carbon Supply Chain

There are conflicts of interest between enterprises in the supply chain. Many scholars have conducted extensive research on how to use contracts to achieve inter-firm cooperation and thus coordinate supply chains. During this process, various forms of contracts have been designed for the purpose of achieving collaboration between the members of the supply chain.
Consider a two-level supply chain consisting of a manufacturer and a retailer as an example. When the retailer provides the manufacturer with a revenue-sharing contract, the supply chain can achieve vertical cooperation, which is more beneficial to the supply chain and consumers, compared to horizontal cooperation between the two manufacturers [5]. A cost-sharing contract and wholesale price premium contract also enable the retailer to cooperate with the manufacturer and achieve a joint reduction, thereby increasing the manufacturer’s carbon reduction rate and the profits of the whole supply chain [6]. The effects of many other types of contracts on supply chain collaboration and coordination have also been discussed. The revenue-cost-sharing contract is important to increase the investment of carbon emission reduction and to improve the performance of decentralized supply chains [16]. Both the cooperative advertising contract and cooperative advertising and emission reduction cost-sharing contract can achieve Pareto improvement in the entire supply chain [17]. An income-investment sharing contract can effectively improve the profit of the supply chain and reduce carbon emissions. Meanwhile, both the supplier and the manufacturer can benefit from a higher carbon cap [18]. Both the wholesale price contracts and the cost-sharing contracts can coordinate the supply chain but the former is better than the latter in terms of weakening double marginalization [19].
Pang et al. (2018) [20] believe that with the goal of maximizing the profit of the supply chain, a revenue-sharing contract not only effectively coordinates the low-carbon supply chain but also achieves the dual goals of economic development and carbon emission reduction. Liu et al. (2015) [21] agree with Pang et al. (2018) [20], but they worry that decision-makers’ attention to fairness would aggravate the double marginalization of the supply chain and increase the difficulty of coordination. Under a two-part linear contract, the manufacturer and the retailer determine a wholesale price jointly, which is less than that in the decentralized supply chain. The reason is that, as the retailer gets a favorable wholesale price from the manufacturer, it will need to provide a transfer payment to the supplier. Through these initiatives, the manufacturers and retailer can achieve a win-win situation. The two-part linear contract is able to weaken the double marginalization, ease the channel conflict between manufacturers and retailers, and achieve a win-win situation [22]. Although there are many results on the supply chain collaboration and coordination, there are few works on designing coordination contracts for a wood forest product supply chain under the cap-and-trade scheme, which will be considered in this paper.

2.3. Forestry Carbon Sinks

Forests are the mainstay of terrestrial ecosystems and can reduce large amounts of carbon from the atmosphere, which means that forests have carbon sequestration capacity [23]. A forestry carbon sink is one of the effective ways to deal with the greenhouse effect [24]. In the United States, for example, forest resources within its territory can offset one-eighth of the country’s annual carbon dioxide emissions and have the potential to offset more at lower costs [25]. The multiple functions and values of forests are increasingly recognized as a key to addressing present global issues [26]. Moreover, forestry carbon sinks have been listed as important ways to reduce carbon emissions under US and international climate policy [27]. It is obvious that the importance of forestry carbon sinks has been recognized by many scholars.
Forestry carbon sinks have great potential for absorbing carbon dioxide and mitigating climate change. Not only afforestation activities, but also forest restoration, forest management, forest protection, and other forestry activities have significant potential for emission reduction [28]. Among many climate change mitigation options, a carbon sequestration project in forests is known as an old but effective and relatively low-cost method [29]. This is mainly due to the strong resilience of forests, and its quick response to factors such as carbon dioxide concentration and nitrogen use [30], even dead wood maintains the sink capacity of secondary forests for decades [31], which result in forestry carbon stocks which have a positive net change.
Although there are many positive comments on forestry carbon sinks, some scholars still express concerns about the development of forestry carbon sinks. In 1994, Dixon et al. [32] predicted that forests could be important carbon sinks or carbon sources in the future, and this difference mainly depends on future forest carbon cycle trends. If deforestation is reduced and reasonable forest management is carried out, the productivity of the forest system can be increased and its strong carbon sequestration capacity can be enhanced to become a carbon sink. Conversely, if the climate change is intensified and the forest area is reduced, it will become a carbon source. There are even worries that the impact of expanding the scale of forestry carbon sinks is minimal, not to mention the US’s withdrawal from the Kyoto mechanism [33]. Moreover, interference from the ecosystem such as forest fires, insect outbreaks, and storms are able to cause damage to the carbon balance in the region [34], which leads to the question of balance between the risk and the value of forestry carbon sinks due to the high levels of uncertainty [35]. The economic value of forestry carbon sinks has been doubted [36].
Based on the above works, we know that scholars’ attitudes towards forestry carbon sinks are not consistent. However, considering the low cost and easy implementation of forestry carbon sinks, it is of great significance to pay more attention to forestry carbon sinks and optimize the operation of the forestry company. We will study the decisions of timber forests and carbon sink forests of the forestry company. We also analyze how the cap-and-trade regulation affects the decision of carbon sink forests.

3. Basic Assumptions and Symbolic Description

We consider a wood forest product supply chain consisting of a forestry company who produces timber and forestry carbon sinks, and a wood forest products manufacturer who consumes timber and carbon emission rights.

3.1. Symbol Description

Table 1 shows the major notations used in this paper:

3.2. Main Assumption Analysis

Assumption 1 Due to the existence of capital and land constraints, we assume the total forest scale of the forestry company can’t expand infinitely. To simplify the model, we make an assumption that the scale of timber forests just meets the order quantity of the manufacturer, and the remaining forests are carbon sink forests. Since the forestry company’s timber production is determined by the order quantity of the manufacturer (which belongs to “limit production to market ability”), we assume that the scale of the carbon sink forests does not affect the purchase price of the timber. In addition, since forestry carbon sinks need to meet the requirement of additionality, we assume that c s 2 is greater than c s 1 , and the forestry company has to expend more efforts and costs on the management of the carbon sink forests.
Assumption 2 Assume that the market demand for products produced by the manufacturer is assumed to be stable over time [5]. There is a low-carbon preference in the market, and we assume that the consumers’ low-carbon preference shows little change. Thus, the sales volume of products is an increasing function of the emission reduction amount per product ( Δ e ), and the actual market demand can be expressed as D + u Δ e . According to the actual situation, the increased demand for products on account of a low-carbon preference is limited, so we assume that D > u Δ e . Therefore, the actual market demand, D , will not increase infinitely.
Assumption 3 We take the price of forestry carbon sinks as the same of carbon emission rights, and we assume that the price of forestry carbon sinks is inversely proportional to the carbon limit and the forestry company’s scale of carbon sink forests. Therefore, we assume the price of forestry carbon sinks as the following:
p t = b a 1 E g a 2 ε ( q s k D ) , b > 0 , a i > 0  
where b represents the initial market price of carbon emission rights, a 1 represents the marginal contribution rate of the carbon quota to the market price of carbon emission rights, and a 2 represents the effect of unit carbon sink amount on the market price of carbon emission rights.
Since we assume that the price of forestry carbon sinks is the same as that of carbon emission rights, as the carbon limit increases, the looser the policy, the lower the companies’ emission reduction requirements, the less demand for carbon emission rights, and the lower the price of carbon emission rights (or the price of forestry carbon sinks). Furthermore, offsetting carbon emissions is the primary role of forestry carbon sinks, which makes forestry carbon sinks a typical kind of carbon offset. According to [13], the supply and price of carbon offsets are affected by independent suppliers, and carbon prices are sensitive to changes in carbon supply and demand, thereby the increase in the carbon offset supply may push down the price of carbon offsets.
Based on actual cases and existing literature, we can know that carbon emission rights are scarce products, so the initial market price of carbon emission rights, b , is relatively large. Carbon cap and the amount of forestry carbon sinks will affect the price of carbon emission rights to a certain extent. However, due to the scarcity of carbon emission rights, compared with the initial price b , the price changes caused by the cap and forestry carbon sinks are relatively small, so we assume that a 1 and a 2 are relatively small, but still positive.
In conclusion, we assume that the values of b , a 1 , and a 2 must be those such that p t > 0 , see Equation (1). Moreover, according to the law of supply and demand, when the price of forestry carbon sinks is relatively high, the forestry company will expand the scale of carbon sink forests and increase supply in order to obtain more profits, and the manufacturer will decrease its forestry carbon sinks consumption, which leads to the price of forestry carbon sinks declining. On the other hand, when the price of forestry carbon sinks is relatively low, the forestry company will reduce its scale of carbon sink forests and decrease supply to avoid more losses. However, the manufacturer restrained by the carbon limit regulation will increase its demand for the forestry carbon sinks, which could result in the price of forestry carbon sinks rising. Therefore, instead of increasing or decreasing infinitely, the price of forestry carbon sinks will fluctuate around some equilibrium price.
Assumption 4 The carbon footprint is mainly generated in the production processes, and the total carbon dioxide emissions are assumed to be linear in production quantity [4]. The initial carbon emission of each finished product e is a fixed value. Based on this, we can calculate the total initial carbon emissions of the manufacturer and its demand for carbon emission rights before the emission reduction measures are taken.
Assumption 5 Carbon emission reduction technology cost is a quadratic function concerning emission reduction. Assuming that the carbon emission reduction cost is a one-action technical investment, and the carbon emission reduction cost is a quadratic function related to the manufacturer’s emission reduction level. That is:
C ( Δ e ) = θ ( Δ e ) 2
.
A higher amount of emission reduction raises the difficulty of reducing carbon emissions, so the value of θ is relatively large. Based on this assumption, we assume that θ > u p t . In fact, similar assumptions can be found in [4].
Since the technical reduction cost of the manufacturer is a quadratic function of unit carbon emission reduction, the greater the unit carbon emission reduction, the greater the marginal cost. In order to achieve the maximum profit, the manufacturer will weigh between the technical emission reduction and purchasing carbon emission rights from the carbon market (the price of carbon emission rights is also the price of forestry carbon sinks).

4. Non-Cooperative Mechanism

The forestry company provides timber for the manufacturer within the biggest deforestation rate it can reach, and the carbon sinks generated by the carbon sink forests meet the standard of those sold to the market. Then, we can get the profit of the forestry company as follows:
π s N ( q s ) = p s k D + ε ( q s k D ) p t [ k D c s 1 + ( q s k D ) c s 2 ]  
where the first part is the timber sales revenue, the second is the income from the sale of forestry carbon sinks, and the third is the total forest management cost.
In the model, we consider the manufacturer is the leader and the forestry company is the follower. Therefore, we assume that the order quantity of raw materials is known before the forestry company makes decisions. So, the forestry company decides the scale of carbon sink forests and timber forests based on the order quantity of timber and the price of carbon sinks. The optimal decision of the forestry company we obtained q s N is as follows:
Proposition 1.
In the case where there is no cooperation, the optimalforest scale of the forestry company is given by:
q s N = k D + H c s 2 2 a 2 ε 2  
where H = ε ( b a 1 E g ) .
(Proof of Proposition 1 is in Appendix A)
In the case that there is no cooperation, the profit of the manufacturer is as follows:
π m N ( Δ e ) = ( p m k p s ) D p t ( q e E g ) C ( Δ e )
where the first part is the gross income of selling finished products, the second is the cost/income that the manufacturer purchases/sells carbon emission rights through the carbon trading market, and the third is the cost of technical carbon emission reduction input. As the manufacturer’s demand for carbon emission rights increases, its price will rise, causing the manufacturer to reduce its demand for the carbon emission rights and instead explore other ways to meet the emission reduction requirements.
The manufacturer formulates emission reduction strategies and pursues the goal of maximizing profits based on the forest scale of the forestry company, carbon emission restraint policies, and carbon sink market price. Its decision model is:
m a x   π m N ( Δ e ) , s u b j e c t   t o ( 3 )
Proposition 2.
In the case where there is no cooperation, the manufacturer’s optimal emission reductionlevel is given by:
Δ e N = 2 ε u ( p m k p s ) + ( H + c s 2 ) ( D u e ) 4 ε θ 2 u ( H + c s 2 )
(Proof of Proposition 2 is in Appendix B)
Propositions 1–2 show that factors such as the gross profit of each individual product, consumers’ low-carbon preference, carbon sink price, and market demand for finished products can affect the manufacturer’s emission reduction level. Meanwhile, carbon quota, carbon sink cost, and carbon sequestration rate will affect the positivity of the forestry company to manage carbon sink forests.

5. Cost-Sharing Contracts

In this section, we consider two cost-sharing contracts for the wood forest product supply chain, the carbon sink cost-sharing (SCS) contract and the carbon emission reduction cost-sharing (ERCS) contract.

5.1. Carbon Sink Cost-Sharing (SCS) Contract

First we consider the carbon sink cost-sharing (SCS) contract. In order to promote the forestry company to expand the scale of carbon sink forests and increase its supply, the manufacturer covers a portion α (0< α <1) of the forestry company’s carbon sink forests management cost when the scale of the carbon sink forests is greater than a certain value ( q 0 ). q 0 is negotiated and determined by the two companies to ensure that the manufacturer is willing to be involved in the contract [37]. That is, under the SCS mechanism, the manufacturer shares part of the forestry company’s carbon sink forest management cost. In order to ensure that the profits of both parties are not lower than the non-cooperative mechanism, we assume that the forestry company transfers an income of α c s 2 q 0 to the manufacturer, and the value of q 0 depends on the bargaining power of both parties.
The cash flow of the wood forest product supply chain under the SCS is shown in Figure 2. It is obvious that the forestry company has one cash outflow (cost): the cost of managing forests (including timber forests and carbon sink forests), and four cash inflows (income): carbon sink income from the emission right market and the manufacturer, respectively. The timber income and the management cost are shared by the manufacturer. Meanwhile, the manufacturer has four cash outflows (costs): raw material cost, carbon cost, technical emission reduction cost, and part of the forestry company’s management cost. One cash inflow is involved, the finished product income.
On top of (2) and (4), we add cash flows between the forestry company and the manufacturer and we can obtain that, under the SCS mechanism, the profits of the forestry company and the manufacturer are:
π s C ( q s ) = p s k D + ε ( q s k D ) p t k D c s 1 c s 2 ( q s k D ) + α c s 2 ( q s k D q 0 )  
π m C ( Δ e ) = ( p m k p s ) D p t ( q e E g ) θ ( Δ e ) 2 α c s 2 ( q s k D q 0 )  
where α c s 2 ( q s k D ) indicates the carbon sink forest management cost shared by the manufacturer, α is the sharing coefficient, and α c s 2 q 0 can be viewed as the revenue transferred from the forestry company to the manufacturer to ensure that the manufacturer participates in the contract. The forestry company can only obtain substantial economic support from the manufacturer when its scale of carbon sink forests is greater than q 0 . The value of q 0 is determined by negotiation between the two parties, thus ensuring their profits are not lower than the non-cooperative mechanism. We can get that the value range of q 0 is q 0 [ q 01 , q 02 ] , in which q 01 is determined by the equation π m C = π m N and q 02 is determined by the equation π S C = π S N .
Proposition 3.
Under the SCS mechanism, the optimal forest scale of the forestry company is:
q s C = k D + H ( 1 α ) c s 2 2 a 2 ε 2
The optimal emission reduction amount of the manufacturer is:
Δ e C = 2 ε u ( p m k p s ) + [ H + ( 1 α ) c s 2 ] ( D u e ) 4 ε θ 2 u [ H + ( 1 α ) c s 2 ]  
The proof of Proposition 3 is very similar to the proof of Proposition 1 and Proposition 2, so we omit it.
According to the law of supply, when the scale of the carbon sink forests expands, the price of forestry carbon sinks will decrease. In this case, the forestry company will adjust its carbon sink forest scale according to the principle of profit maximization. Therefore, under the market influence, the forestry company will eventually reach an equilibrium level of carbon sink forest scale rather than expanding it infinitely.

5.2. Carbon Emission Reduction Cost-Sharing (ERCS) Contract

Low-carbon products can bring economic benefits to companies. However, reducing carbon emissions requires financial resources for research, improving production processes, and upgrading production equipment. Compared with technical emission reduction, the forestry carbon sinks can be utilized to achieve a higher emission reduction level with lower difficulty and costs. Moreover, in the wood forest product supply chain, increasing the level of emission reduction has a positive effect on expanding the production scale of the supply chain.
For the reasons above, we consider a carbon emission reduction cost-sharing (ERCS) contract. In particular, in order to promote the manufacturer to increase the carbon emission reduction level (thus enhancing market demand), the forestry company provides financial support when the emission reduction level of the manufacturer is higher than a certain level ( Δ e 0 ). Δ e 0 is negotiated and determined by the two companies to ensure that the forestry company participates in the contract [37]. That is, under the ERCS mechanism, the forestry company shares part of the manufacturer’s carbon emission reduction cost (the sharing coefficient is β ). To achieve a win-win situation, we assume that the income transferred by the manufacturer to the forestry company is β Δ e 0 . The value of Δ e 0 depends on the bargaining power of the two firms.
The cash flow between the companies in the wood forest product supply chain is shown in Figure 3. It is obvious that the forestry company has two cash outflows: management cost and part of the manufacturer’s emission reduction cost, and three cash inflows: carbon sink income from the emission right market and the manufacturer, respectively, and timber income. Meanwhile, the manufacturer has three cash outflows: raw material cost, carbon cost, and technical emission reduction cost, and two cash inflows: part of the technical emission reduction cost shared by the forestry company and finished product income.
In addition to (2) and (4), the cash flows between the forestry company and the manufacturer are taken into consideration. Therefore, under the ERCS, the profit functions of the forestry company and the manufacturer are:
π s R ( q s ) = p s k D + p t ε ( q s k D ) [ k D c s 1 + ( q s k D ) c s 2 ] β ( Δ e Δ e 0 )  
π m R ( Δ e ) = ( p m k p s ) D θ ( Δ e ) 2 p t ( q e E g ) + β ( Δ e Δ e 0 )
where β Δ e indicates the technical emission reduction cost shared by the forestry company, β is the sharing coefficient, and β Δ e 0 can be seen as the revenue transferred from the manufacturer to the forestry company to ensure the forestry company benefits from the contract. The manufacturer can only obtain substantial economic support from the forestry company when its unit amount of emission reduction is greater than Δ e 0 . To achieve a win-win situation, the value of Δ e 0 is determined by negotiation between the two parties. We can determine that the value range of Δ e 0 is Δ e 0 [ Δ e 01 , Δ e 02 ] , in which Δ e 01 is obtained from the equation π S R = π S N and Δ e 02 is determined by the equation π m R = π m N .
Proposition 4.
Under the ERCS mechanism, the optimal forest scale of the forestry company is:
q s R = D + u Δ e R + H c s 2 2 a 2 ε 2
The optimal technical emission reduction amount of the manufacturer is:
Δ e R = 2 ε u ( p m k p s ) + ( H + c s 2 ) ( D u e ) + β ε 4 ε θ 2 u ( H + c s 2 )
The proof of Proposition 4 is similar to the proof of Proposition 1 and Proposition 2, so we omit it.

6. Discussions and Numerical Results

In this section, we will discuss the total profit and carbon emissions of the supply chain under the three different trading modes discussed above, and a numerical example is used for the purposes of illustration. Using the actual situation of the wood forest product supply chain as references, the values of parameters in the example are set as shown in Table 2.
For the purpose of determining the approximate ranges of q 0 and Δ e 0 , we assume that α = 0.3 and β = 1500 . Under this circumstance, when u = 100 , q 0 [ 693 , 901 ] , Δ e 0 [ 0.95 , 1.05 ] ; when u = 150 , q 0 [ 716 , 847 ] , Δ e 0 [ 1.23 , 1.41 ] ; when u = 200 , q 0 [ 724 , 789 ] , Δ e 0 [ 1.59 , 1.89 ] .

6.1. Impact of a Low-Carbon Sensitivity Coefficient

Proposition 5.
(1)
d q s N / d u > 0 , d q s C / d u > 0 , d q s R / d u > 0 ;
(2)
d Δ e N / d u > 0 , d Δ e C / d u > 0 , d Δ e R / d u > 0 .
(Proof of Proposition 5 is in Appendix C)
Proposition 5 shows that the carbon emission reduction level and the forest scale will increase as the consumers’ low-carbon preference improves. Therefore, the improvement of consumers’ low-carbon preference may encourage the manufacturer to increase carbon emission reduction investment, as well as the forestry company to expand forest scale. The management insight of Proposition 5 is that the government should enhance low-carbon publicity and promote the formation of low-carbon consumption awareness. To be more specific, the government can take measures such as advocating a low-carbon life concept, establishing a green-label mechanism, and effectively improving the whole society’s low-carbon preference.

6.2. Impact of Emission Reduction Cost

Proposition 6.
(1)
d q s N / d θ < 0 , d q s C / d θ < 0 , d q s R / d θ < 0 ;
(2)
d Δ e N / d θ < 0 , d Δ e C / d θ < 0 , d Δ e R / d θ < 0 .
(Proof of Proposition 6 is in Appendix D)
Proposition 6 shows that the high cost of emission reduction may restrict the carbon emission reduction investment of the manufacturer, and may not be beneficial to the forestry company to expand the forest scale. Proposition 6 suggests that the government should promote the development of emission reduction technology so that a lower technical emission reduction cost can be achieved. Moreover, for the purpose of arousing the companies’ enthusiasm towards expanding the forest scale and reducing carbon emissions, it is suggested that the government provides subsidies for manufacturers and forestry companies.

6.3. Impact of a Cost-Sharing Mechanism on the Supply Chain Profit

Figure 4 shows the relationship between the carbon sink cost-sharing coefficient and the profit of the supply chain when the low-carbon demand sensitivity coefficient u = 100 , 150 , 200 , respectively. Figure 4 indicates that the profit of the supply chain under the non-sharing mechanism ( α = 0 ) is less than the profit under the SCS mechanism, and the overall profit of the supply chain is positively correlated with the sharing coefficient. That is, under the SCS mechanism, the members of the supply chain can obtain higher profits through the cooperation mechanism.
Figure 5 shows the relationship between the emission reduction cost-sharing coefficient and the profit of the supply chain when the low-carbon demand sensitivity coefficient u = 100 , 150 , 200 , respectively. It’s easy to find that, as the emission reduction cost-sharing coefficient increases, the profit of the supply chain first increases, then decreases gradually. It can be concluded that under the ERCS mechanism, there is an optimal sharing coefficient β such that the profit of the whole supply chain reaches a maximum, and the profit is greater than the maximum profit under the non-cooperative mechanism ( β = 0 ). It is obvious that the whole supply chain can achieve higher profit because of the ERCS mechanism.

6.4. Impact of a Cost-Sharing Mechanism on the Carbon Emission Reduction Level

Proposition 7.
Δ e R > Δ e N > Δ e C .
(Proof of Proposition 7 is in Appendix E)
Proposition 7 indicates that the ERCS mechanism can encourage the manufacturer to increase emission reduction level, while the SCS mechanism cannot. The reason is that the SCS mechanism can promote the expansion of the scale of carbon sink forests, thereby increasing the supply of carbon sinks in the market, lowering the price of carbon sinks and damaging the enthusiasm of the manufacturer to reduce carbon emissions.
Figure 6 and Figure 7 show the relationship between the manufacturer’s carbon emissions and cost-sharing coefficients. It is obvious that under the ERCS mechanism, the carbon emission level of the manufacturer is negatively correlated with the sharing coefficient, β . While under the SCS mechanism, it is positively correlated with the sharing coefficient, α .
The management implications of Proposition 7 and Figure 6 and Figure 7 are as follows. Both of the ERCS mechanism and the SCS mechanism can help the supply chain to obtain higher profits. However, the impacts on the manufacturer’s emission reduction decision are different. The former directly increases the income of finished products by improving the intensity of the technical emission reduction, while the latter indirectly reduces the investment in technical emission reduction by expanding the supply of carbon sinks; the former will promote the manufacturer to increase the carbon emission reduction level, while the latter will lead to a lower carbon emission reduction level.

6.5. Impact of the Cost-Sharing Mechanism on the Forest Scale

Because of the land and capital constraints, in addition to the long growth period, the forestry company faces high risks in the process of afforestation and forest management. As a result, the production process of timber and carbon sinks has great uncertainty, which inhibits the forestry company’s enthusiasm for expansion. In the process of constructing the sharing mechanism and determining the optimal forest scale, it is necessary to analyze the effect of sharing coefficient on the profit of members in the supply chain, as well as the limitations of external objective conditions on the scale of the forests.
From (2), (6), (10), and Proposition 7, we can obtain that q c s R > q c s N > q c s C , q t s C > q t s R = q t s N . The result indicates that under the ERCS mechanism, the forestry company encourages the manufacturer to increase investment in emission reduction and directly increase the sales volume of wood forest products so the manufacturer will be bound to enhance order quantity of timber produced by the forestry company. Meanwhile, under the SCS mechanism, the members in the supply chain manage the carbon sink forests together, and this will increase the supply of forest carbon sinks and decrease the price of carbon sinks in the market. Those help to enhance the scale of carbon sink forests. However, due to the decline in carbon sink price, the manufacturer might decrease carbon emission reduction level, leading to a decline in demand for finished products, and the amount of timber ordered by the manufacturer decreases, too.

7. Conclusions

We consider a two-level wood forest product supply chain consisting of a single forestry company and a single manufacturer, in which the forestry company produces timber and forestry carbon sinks, and the manufacturer consumes timber and carbon emission rights. Under the cap-and-trade mechanism, we design and compare the two cost-sharing mechanisms: carbon sink cost-sharing (SCS) mechanism and carbon emission reduction cost-sharing (ERCS) mechanism. Then we construct a Stackelberg game model to investigate the influences of the cost-sharing mechanisms on each member of the supply chain. Finally, we analyze the optimal forest scale and the emission reduction level of the supply chain. The result shows that both of the two mechanisms can help the wood forest product supply chain to achieve higher profits. The ERCS mechanism is able to encourage the manufacturer to increase investment in technical emission reduction and reduce total carbon emissions, as well as promote the forestry company to expand the forest scale. The carbon sink cost-sharing mechanism is beneficial to the expansion of carbon sink forests as well. However, it also leads to a large increase in the total carbon emissions of the manufacturer, which generates negative effects.
This research can be extended in several directions. First, the quantity of carbon sink forests may influence consumers’ demand for finished products and we would like to take this into consideration in the future research. Second, financing problems of the forestry company, such as carbon sink forest financing, can be considered in the future research. Furthermore, as the concept of carbon finance is becoming more and more popular, it is necessary to engage forest product supply chain industry professionals into our next research so that we can consider supply chain carbon finance and explore the significance of it for improving the environmental and economic performance of the supply chain.

Author Contributions

H.P. set up the framework of this paper; M.S. did the calculations of the models, collected the data and examples, analyzed the data, and wrote the first draft of the paper; S.W. designed the cost-sharing contracts.

Funding

The research is supported by the National Social Science Foundation of China (Grant NO. 17BGL236).

Conflicts of Interest

The authors declare no conflict of interest. The funders had no role in the design of the study; in the collection, analyses, or interpretation of data; in the writing of the manuscript, or in the decision to publish the results.

Appendix A. Proof of Proposition 1

From (2), it is easy to see that,
d π s N / d q s = 2 a 2 ε 2 ( q s k D ) + ε ( b a 1 E g ) c s 2 ,   d 2 π s N / d q s 2 = 2 a 2 ε 2
π s N is a concave function of q s because d 2 π s N / d q s 2 < 0 , and the supplier’s profit function has a maximum. Let d π s N / d q s = 0 , and we can derive the formula of q s N .

Appendix B. Proof of Proposition 2

From (3) and (4), we can derive that,
d π m N / d Δ e = u ( p m k p s ) [ ( b a 1 E g ) ε + c s 2 ] ( u e D 2 u Δ e ) 2 ε 2 θ Δ e  
d 2 π m N / d Δ e 2 = u ε [ ( b a 1 E g ) ε + c s 2 ] 2 θ
Based on Assumption 5, the cost coefficient of technical emission reduction for the manufacturer θ is relatively large, and θ > u p t . Thus d 2 π m N / d Δ e 2 < 0 and π m N ( Δ e ) is a concave function of Δ e . Let d π m N / d Δ e = 0 , and we can derive the formula of Δ e N

Appendix C. Proof of Proposition 5

From (6), (10), and (14), we can see that,
d Δ e N / d u > 0 , d Δ e C / d u > 0 , d Δ e R / d u > 0
.
In addition, it can be seen from (3) that the optimal forest scale q s N monotonically increases with Δ e N increasing, d q s N / d u = ( d q s N / d Δ e x ) ( d Δ e N / d u ) > 0 ; Similarly, from (9) and (13), we can derive that d Δ e C / d u > 0 , d Δ e R / d u > 0 .

Appendix D. Proof of Proposition 6

From (6), (10), and (14), we can derive that,
d Δ e N / d θ < 0 , d Δ e C / d θ < 0 , d Δ e R / d θ < 0
and from (3), it is easy to see that the optimal forest scale q s N monotonically increases with Δ e N increasing, so d q s N / d θ = ( d q s N / d Δ e x ) ( d Δ e N / d θ ) < 0 ; Similarly, from (9) and (13), we can get that d q s C / d θ < 0 , d q s R / d θ < 0 .

Appendix E. Proof of Proposition 7

From (6), (10), (14), and assumption (5), we can derive that:
Δ e N Δ e R = β ε 2 ε { 2 θ u ε [ ( b a 1 E g ) ε + c s 2 ] } < 0  
Δ e N Δ e C = 2 u 2 ( p m k p s ) α c s 2 + 2 ( D u e ) α c s 2 [ u ( b a 1 E g ) + θ ] 2 ε { 2 θ u ε [ ( b a 1 E g ) ε + c s 2 ] } { 2 θ u ε [ ( b a 1 E g ) ε + ( 1 α ) c s 2 ] } > 0
After sorting out, we can conclude that Δ e R > Δ e N > e C .

References

  1. Stocker, T.F.; Qin, D.; Plattner, G.K.; Tignor, M.; Allen, S.K.; Boschung, J.; Nauels, A.; Xia, Y.; Bex, V.; Midgley, P.M. IPCC: Summary for Policymakers. In Proceedings of Climate Change 2013: The Physical Science Basis. Contribution of Working Group I to the Fifth Assessment Report of the Intergovernmental Panel on Climate Change; Cambridge University Press: Cambridge, New York, NY, USA, 2013. [Google Scholar]
  2. Zhou, Y.J.; Bao, M.J.; Chen, X.H.; Xu, X.H. Co-op advertising and emission reduction cost sharing contracts and coordination in low-carbon supply chain based on fairness concerns. J. Clean. Prod. 2016, 133, 402–413. [Google Scholar] [CrossRef]
  3. Peng, H.J.; Pang, T.; Cong, J. Coordination contracts for a supply chain with yield uncertainty and low-carbon preference. J. Clean. Prod. 2018, 205, 291–302. [Google Scholar] [CrossRef]
  4. Ji, J.N.; Zhang, Z.Y.; Yang, L. Carbon emission reduction decisions in the retail-/dual-channel supply chain with consumers’ preference. J. Clean Prod. 2017, 141, 852–867. [Google Scholar] [CrossRef]
  5. Yang, L.; Zhang, Q.; J, N. Pricing and carbon emission reduction decisions in supply chains with vertical and horizontal cooperation. Int. J. of Prod. Econ. 2017, 191, 286–297. [Google Scholar] [CrossRef]
  6. Wang, Q.P.; Zhao, D.Z.; He, L.F. Contracting emission reduction for supply chains considering market low-carbon preference. J. Clean Prod. 2016, 120, 72–84. [Google Scholar] [CrossRef]
  7. Wang, C.X.; Wang, W.; Huang, R.B. Supply chain enterprise operations and government carbon tax decisions considering carbon emissions. J. Clean. Prod. 2017, 152, 271–280. [Google Scholar] [CrossRef]
  8. Aljazzar, S.M.; Gurtu, A.; Jaber, M.Y. Delay-in-payments–A strategy to reduce carbon emissions from supply chains. J. Clean. Prod. 2018, 170, 636–644. [Google Scholar] [CrossRef]
  9. Xiao, Z.; Tian, Y.X.; Yuan, Z. The impacts of regulations and financial development on the operations of supply chains with greenhouse gas emissions. Int. J. Env. Res. Pub. Heal. 2018, 15, 378. [Google Scholar] [CrossRef] [PubMed]
  10. Nouira, I.; Hammami, R.; Frein, Y.; Temponi, C. Design of forward supply chains: Impact of a carbon emissions-sensitive demand. Int. J. of Prod. Econ. 2016, 173, 80–98. [Google Scholar] [CrossRef]
  11. Toptal, A.; Özlü, H.; Konur, D. Joint decisions on inventory replenishment and emission reduction investment under different emission regulations. Int. J. Prod. Res. 2014, 52, 243–269. [Google Scholar] [CrossRef] [Green Version]
  12. Wu, B.; Huang, W.Y.; Liu, P.F. Carbon reduction strategies based on an NW small-world network with a progressive carbon tax. Sustainability 2017, 9, 1747. [Google Scholar] [CrossRef]
  13. Benjaafar, S.; Li, Y.; Daskin, M. Carbon footprint and the management of supply chain: Insights from simple models. IEEE Trans. Autom. Sci. Eng. 2013, 10, 99–116. [Google Scholar] [CrossRef]
  14. Chen, J.X.; Chen, J. Supply chain carbon footprinting and responsibility allocation under emission regulations[J]. J. Environ. Manage. 2017, 188, 255–267. [Google Scholar] [CrossRef] [PubMed]
  15. Yang, L.; Chen, Y.F.; Ji, J.N. Cooperation modes of operations and financing in a low-carbon supply chain. Sustainability 2018, 10, 821. [Google Scholar] [CrossRef]
  16. Xu, L.; Wang, C.; Li, H. Decision and coordination of low-carbon supply chain considering technological spillover and environmental awareness. Sci. Rep-UK 2017, 7, 3107. [Google Scholar] [CrossRef] [PubMed]
  17. Zhou, Y.J.; Ye, X. Differential game model of joint emission reduction strategies and contract design in a dual-channel supply chain. J. Clean Prod. 2018, 190, 592–607. [Google Scholar] [CrossRef]
  18. Bai, Q.G.; Xu, J.T.; Zhang, Y.Y. Emission reduction decision and coordination of a make-to-order supply chain with two products under cap-and-trade regulation. Comput. Ind. Eng. 2018, 119, 131–145. [Google Scholar] [CrossRef]
  19. Xu, X.P.; He, P.; Xu, H.; Zhang, Q.P. Supply chain coordination with green technology under cap-and-trade regulation. Int. J. of Prod. Econ. 2017, 183, 433–442. [Google Scholar] [CrossRef]
  20. Pang, Q.H.; Li, M.Z.; Yang, T.T.; Shen, Y.; Supply chain coordination with carbon trading price and consumers’ environmental awareness dependent demand. Math. Probl. Eng. 2018. Available online: https://www.hindawi.com/journals/mpe/2018/8749251/ (accessed on 19 November 2018).
  21. Liu, Z.; Gong, B.G.; Gui, Y.M.; Zheng, X.X. Joint decision-making and the coordination of a sustainable supply chain in the context of carbon tax regulation and fairness concerns. Inter. J. Env. Res. Pub. Heal. 2015, 14, 454–460. [Google Scholar] [CrossRef] [PubMed]
  22. Zhou, Y.W.; Fan, H.H.; Wu, D.Y.; Qiu, J.Y. The channel selection and coordination of two-echelon low carbon supply chain in the environment of random demand. Rev. Fac. Cienc. Agrar. 2017, 32, 802–814. [Google Scholar]
  23. Zhou, T.; Shi, P.J.; Dai, Y.J.; Zhao, X.; Wei, S.G.; Du, L.; Wu, H.; Luo, Y.Q. Age-dependent forest carbon sink: Estimation via inverse modeling. J. Geophys. Res-Biogeo. 2015, 120, 2473–2492. [Google Scholar] [CrossRef]
  24. Wang, M.T. Analysis of forest carbon sinks prediction model based on economic theory. Rev. Fac. Cienc. Agrar. 2017, 32, 541–548. [Google Scholar]
  25. Daniels, T.L. Integrating forest carbon sequestration into a cap-and-trade program to reduce net CO2 emissions. J. Am. Plann. Assoc. 2010, 76, 463–475. [Google Scholar] [CrossRef]
  26. Boscolo, M.; Dijk, K.V.; Savenije, H. Financing sustainable small-scale forestry: Lessons from developing national forest financing strategies in Latin America. Forests 2010, 1, 230–249. [Google Scholar] [CrossRef]
  27. Newell, R.G.; Stavins, R.N. Climate change and forest sinks: Factors affecting the costs of carbon sequestration. J. Environ. Econ. Manag. 2000, 40, 211–235. [Google Scholar] [CrossRef]
  28. Birdsey, R.A. Carbon accounting rules and guidelines for the United States forest sector. J. Environ Qual. 2006, 35, 1518–1524. [Google Scholar] [CrossRef] [PubMed]
  29. Pearson, T.R.H.; Brown, S.; Sohngen, B.; Henman, J.; Ohrel, S. Transaction costs for carbon sequestration projects in the tropical forest sector. Mitig. Adapt. Strateg. Glob. Chang. 2014, 19, 1209–1222. [Google Scholar] [CrossRef]
  30. Williams, C.A.; Gu, H.; MacLean, R.; Masek, J.G.; Collatz, G.J. Disturbance and the carbon balance of US forests: A quantitative review of impacts from harvests, fires, insects, and droughts. Global. Planet. Change 2016, 143, 66–80. [Google Scholar] [CrossRef]
  31. McGarvey, J.C.; Thompson, J.R.; Epstein, H.E.; Shugart, H.H., Jr. Carbon storage in old-growth forests of the Mid-Atlantic: Toward better understanding the eastern forest carbon sink. Ecology 2016, 96, 311–317. [Google Scholar] [CrossRef]
  32. Dixon, R.K.; Brown, S.; Houghton, R.A.; Solomon, A.M.; Trexler, M.C.; Wisniewski, J. Carbon pools and flux of global forest ecosystems. Science 1994, 263, 185–190. [Google Scholar] [CrossRef] [PubMed]
  33. Pohjola, J.; Kerkelä, L.; Mäkipää, R. Credited forest carbon sinks: How the cost reduction is allocated among countries and sectors. Clim. Policy 2003, 3, 445–461. [Google Scholar] [CrossRef]
  34. Lindroth, A.; Lagergren, F.; Grelle, A.; Klemedtsson, L.; Langvall, O.; Weslien, P.; Tuulik, J. Storms can cause Europe-wide reduction in forest carbon sink. Global Change Biol. 2010, 15, 346–355. [Google Scholar] [CrossRef]
  35. Gren, I.M.; Carlsson, M. Economic value of carbon sequestration in forests under multiple sources of uncertainty. J. Forest Econ. 2013, 19, 174–189. [Google Scholar] [CrossRef]
  36. Zhou, W.; Gao, L. The impact of carbon trade on the management of short-rotation forest plantations. Forest Policy Econ. 2016, 62, 30–35. [Google Scholar] [CrossRef]
  37. Cachon, G.P.; Lariviere, M.A. Supply chain coordination with revenue-sharing contracts: Strengths and limitations. Manag. Sci. 2005, 51, 30–44. [Google Scholar] [CrossRef]
Figure 1. Wood forest product supply chain system under a cap-and-trade mechanism.
Sustainability 10 04345 g001
Figure 2. Cash flow of supply chain under the SCS contract.
Sustainability 10 04345 g002
Figure 3. Cash flow of supply chain under the ERCS contract.
Sustainability 10 04345 g003
Figure 4. Profit of the supply chain vs. α under the SCS.
Sustainability 10 04345 g004
Figure 5. Profit of the supply chain vs. β under the ERCS.
Sustainability 10 04345 g005
Figure 6. Carbon emission level vs. β under the ERCS.
Sustainability 10 04345 g006
Figure 7. Carbon emission level vs. α under the SCS.
Sustainability 10 04345 g007
Table 1. List of the notations.
NotationMeaning
a 1 the marginal contribution rate of carbon quota to the market price of carbon emission rights
a 2 the effect of unit carbon sink amount on the market price of carbon emission rights
b the initial market price of carbon emission rights
C superscript, represents the carbon sink cost-sharing mechanism
c s 1 current year’s management cost of timber forests, p s > c s 1
c s 2 current year’s management cost of carbon sink forests, p t > c s 2
D basic market demand for finished products
D the actual market demand for finished products
e the initial carbon emission of unit product produced by manufacturer
Δ e the manufacturer’s unit amount of emission reduction
Δ e 0 the threshold of the manufacturer’s unit amount of emission reduction determined by negotiation between the two parties under the technical emission reduction cost sharing mechanism
E g the carbon quota allocated to the manufacturer initially
k the amount of timber required for unit finished product, and the timber order quantity of manufacturer can be expressed as follows: k D
N superscript, represents the non-cost-sharing mechanism
p m unit price for the product, we assume that the finished products produced by the manufacturer meet the requirements of the consumer, and the price is determined by the market
p s unit price for the timber
p t unit price for the forestry carbon sink (that is the market price of the carbon emission rights as well)
q c s the amount of timber forests of the forestry company, q c s = k D
q e total carbon emissions of the manufacturer, which meets the formula q e = D ( e Δ e )
q s the total forest scale of the forestry company, which is a decision variable of the forestry company , q s = q c s + q t s
q t s the amount of carbon sink forests of the forestry company, q t s = ( q s k D )
q 0 the threshold of the forestry company’s scale of carbon sink forests determined by negotiation between the two parties under the carbon sink cost sharing mechanism
R superscript, represents the carbon emission reduction cost-sharing mechanism
u demand sensitivity coefficient to the emission reduction level, and the market demand for finished products can be expressed by the following formula: D = D + u Δ e [4]
ε carbon sequestration rate of unit carbon sink, which is calculated by the carbon conversion coefficient and the proportion of carbon fixed in wood products for a long time [20]
θ the technical emission reduction cost coefficient of the manufacturer
π m profit of the manufacturer
π s profit of the forestry company
Table 2. The values of parameters.
Parameters a 1 a 2 b ε θ e E g β
Values0.020.005250.850003600[1000,3600]
Parameters p s u D p m c s 1 c s 2 α k
Values60[100,200]500120405[0,1]1

