1. Introduction
Increase in population and consumption—particularly in wealthier countries—and depletion of non-renewable resources have been significantly impacting the built environment [
1]. These changing conditions increase the need for resource-efficient buildings, which consume minimal energy, provide a quality indoor environment, and are constructed with materials that have long-term value as well as less waste generation [
2]. Comparing to conventionally designed buildings, sufficient evidence from the USA and Germany shows that green building (GB) offers an impressive reduction in energy and potable water consumption [
3].
Growing evidence shows that the GB movement has been international in scope for more than two decades, and is currently acknowledged as a national priority in several countries around the globe [
2]. As such, there are 70 countries that either have or are establishing GB councils, which require strict assessment systems [
4]. Undoubtedly, the reason behind these attempts/initiatives is to reduce the detrimental impact of the building industry, demanding buildings that are efficient in terms of energy, water, and resource consumption and do not compromise the needs of future populations [
3,
5].
Increase in the population in Kazakhstan is clear evidence of high demand for residential buildings, which account for the vast majority (8.94 million sqm of total floor area) of building stock [
6]. However, in recent years, environmental impact, high energy (13.5% power and 24% heat), and the resource consumption of the residential building market have become a national priority and triggered a sustainable movement and the implementation of green practices [
7]. The World Bank report [
8] clearly warrants efforts towards energy efficiency, particularly in the largest cities—Astana and Almaty—as they are home to the bulk of the residential building stock of Kazakhstan.
As a response to an increasing demand on GB imperative, to improve the environmental performance of buildings, several countries and institutions have introduced obligatory building codes and standards, though some of them are voluntary [
9]. Moreover, the advent of several assessment systems across the globe shows a clear effort being invested in the definition of the GB concept and evaluation of its performance. The Building Research Establishment Environmental Assessment Method (BREEAM) was the first assessment method introduced in the UK, which has successfully evaluated buildings on various factors including water consumption, energy performance, environmental impact, and indoor quality [
10]. Being a criteria-based assessment tool [
11], the Leadership in Energy and Environmental Design (LEED) has been introduced in the USA, aiming at building performance improvement based on similar factors to the BREEAM [
12]. Additionally, other studies developed country-specific assessment tools addressing the needs of the local context. For instance, [
13] developed a model—at an urban level—based on the elements having an impact on air pollution and climate change, which were then applied to case studies throughout South Korea for further verification of its applicability and feasibility. By utilizing the Analytical Hierarchy Process approach, the authors of [
10] developed a GB assessment tool based, to meet the needs of the local construction context, based on the perceptions of sustainability experts in Jordan.
Several studies, however, utilized multi-criteria assessment methods to evaluate the sustainability performance of the building stock in their respective countries. Balaras et al. [
14] presented an elaborate and hence more realistic version of such methodology utilized for energy conservation assessment of residential buildings in Hellenic by evaluating various scenarios with an aim of reducing CO
2 emissions. Zavri et al. [
15] presented a method for the assessment of residential buildings’ sustainability performance, which was customized to the priority needs of Slovenian end-users. The developed method was based on the opinions of potential users and further, to verify its effectiveness, applied to a sample building. Vucicevic et al. [
16] developed a mathematical procedure to determine a sustainability index for residential buildings through case studies in Serbia. The framework takes into account all pillars of sustainability (economic, environmental, and social). Thus, a review of the literature reveals that various methods/approaches have been utilized to evaluate the sustainability performance of buildings across the globe. While some were evaluated using internationally recognized tools (i.e., LEED, BREEAM) or by adapting them to the local context, the vast majority were assessed utilizing multi-criteria decision-making approaches.
A greening of the construction sector, since the adoption of Green Economy Concept policy in 2013, led to a rise in the utilization of building sustainability assessment systems, which are also called energy rating systems (ERS) [
17]. ERSs such as BREEAM and LEED are the most popular programs and recently have had an uptake within the building sector in Kazakhstan [
18]. There are to date 39 buildings certified in Kazakhstan (the majority right after the adoption of the policy, mainly in the cities of Astana and Almaty), three and 36 of which were certified by the LEED and BREEAM programs, respectively [
18]. These numbers provide sufficient evidence of the momentum gained by the green revolution in Kazakhstan in recent years.
There has been a rise in the adoption of green initiatives in the built environment in Kazakhstan. Numerous policies and statements by the leadership of the country indicate that the challenges of energy scarcity and GHG emissions reduction should be addressed by modernizing existing infrastructure, constructing energy-efficient buildings, and integrating technologies based on alternative sources of energy. However, the country’s construction industry seems to be unready for such changes. One of the main reasons could be that the construction standards and regulations were developed several decades ago, and thus are quite outdated. Moreover, only a limited number of construction industry players are willing to engage in projects with “green philosophy” due to their cost implications. It is believed that most of the projects that were certified as green aimed to increase their marketability. Another aspect hindering the advancement of GBs in Kazakhstan is the poor academic and research support. To the best of the authors’ knowledge, there is limited research output on the principles of sustainable building industry in the context of Kazakhstan. Apart from merely passing the certification process through internationally recognized programs, there is no clear vision to guide developers towards a greener future. Kazakhstan’s Green Building Council (KazGBC) is a newly established member of WGBC, in cooperation with UNDP, and aims to introduce greener construction standards and motivate construction workers to certify buildings under BREEAM and LEED. The root causes of overall poor sustainability practices, among others, are related to a lack of respective policies and regulations, guidelines, methodologies, practical examples, technologies, and low level of awareness among the general public and the construction industry [
19].
Although the number of certified buildings is growing, it is clear that the uptake level remains insufficient to meet the 2030 target set by KazGBC [
17]. Moreover, the certified buildings have all been constructed with the last decade, comprising only a small portion of the whole building stock of the country. Therefore, there is a need to assess other types of buildings in Kazakhstan, for instance, those constructed during the Soviet era and the period prior to the change of the capital city to Astana as well as afterwards. The latter period of history is considered a significant milestone for the construction industry as it transformed the industry and the way buildings are constructed due to a major construction boom attracting a wide range of foreign companies. Such analysis will provide a practical basis for potential solutions converting those old buildings into energy-efficient structures. It is worth mentioning that the certification cost of the aforementioned programs is one of the significant barriers to assessing those buildings in terms of their sustainability performance. This study hence aims to position the current classification of the residential buildings and determine how they are satisfying the GB requirements. The ultimate objective of this study is to suggest requirements for achieving better GB performance for all the identified types of residential buildings.
2. Methodology
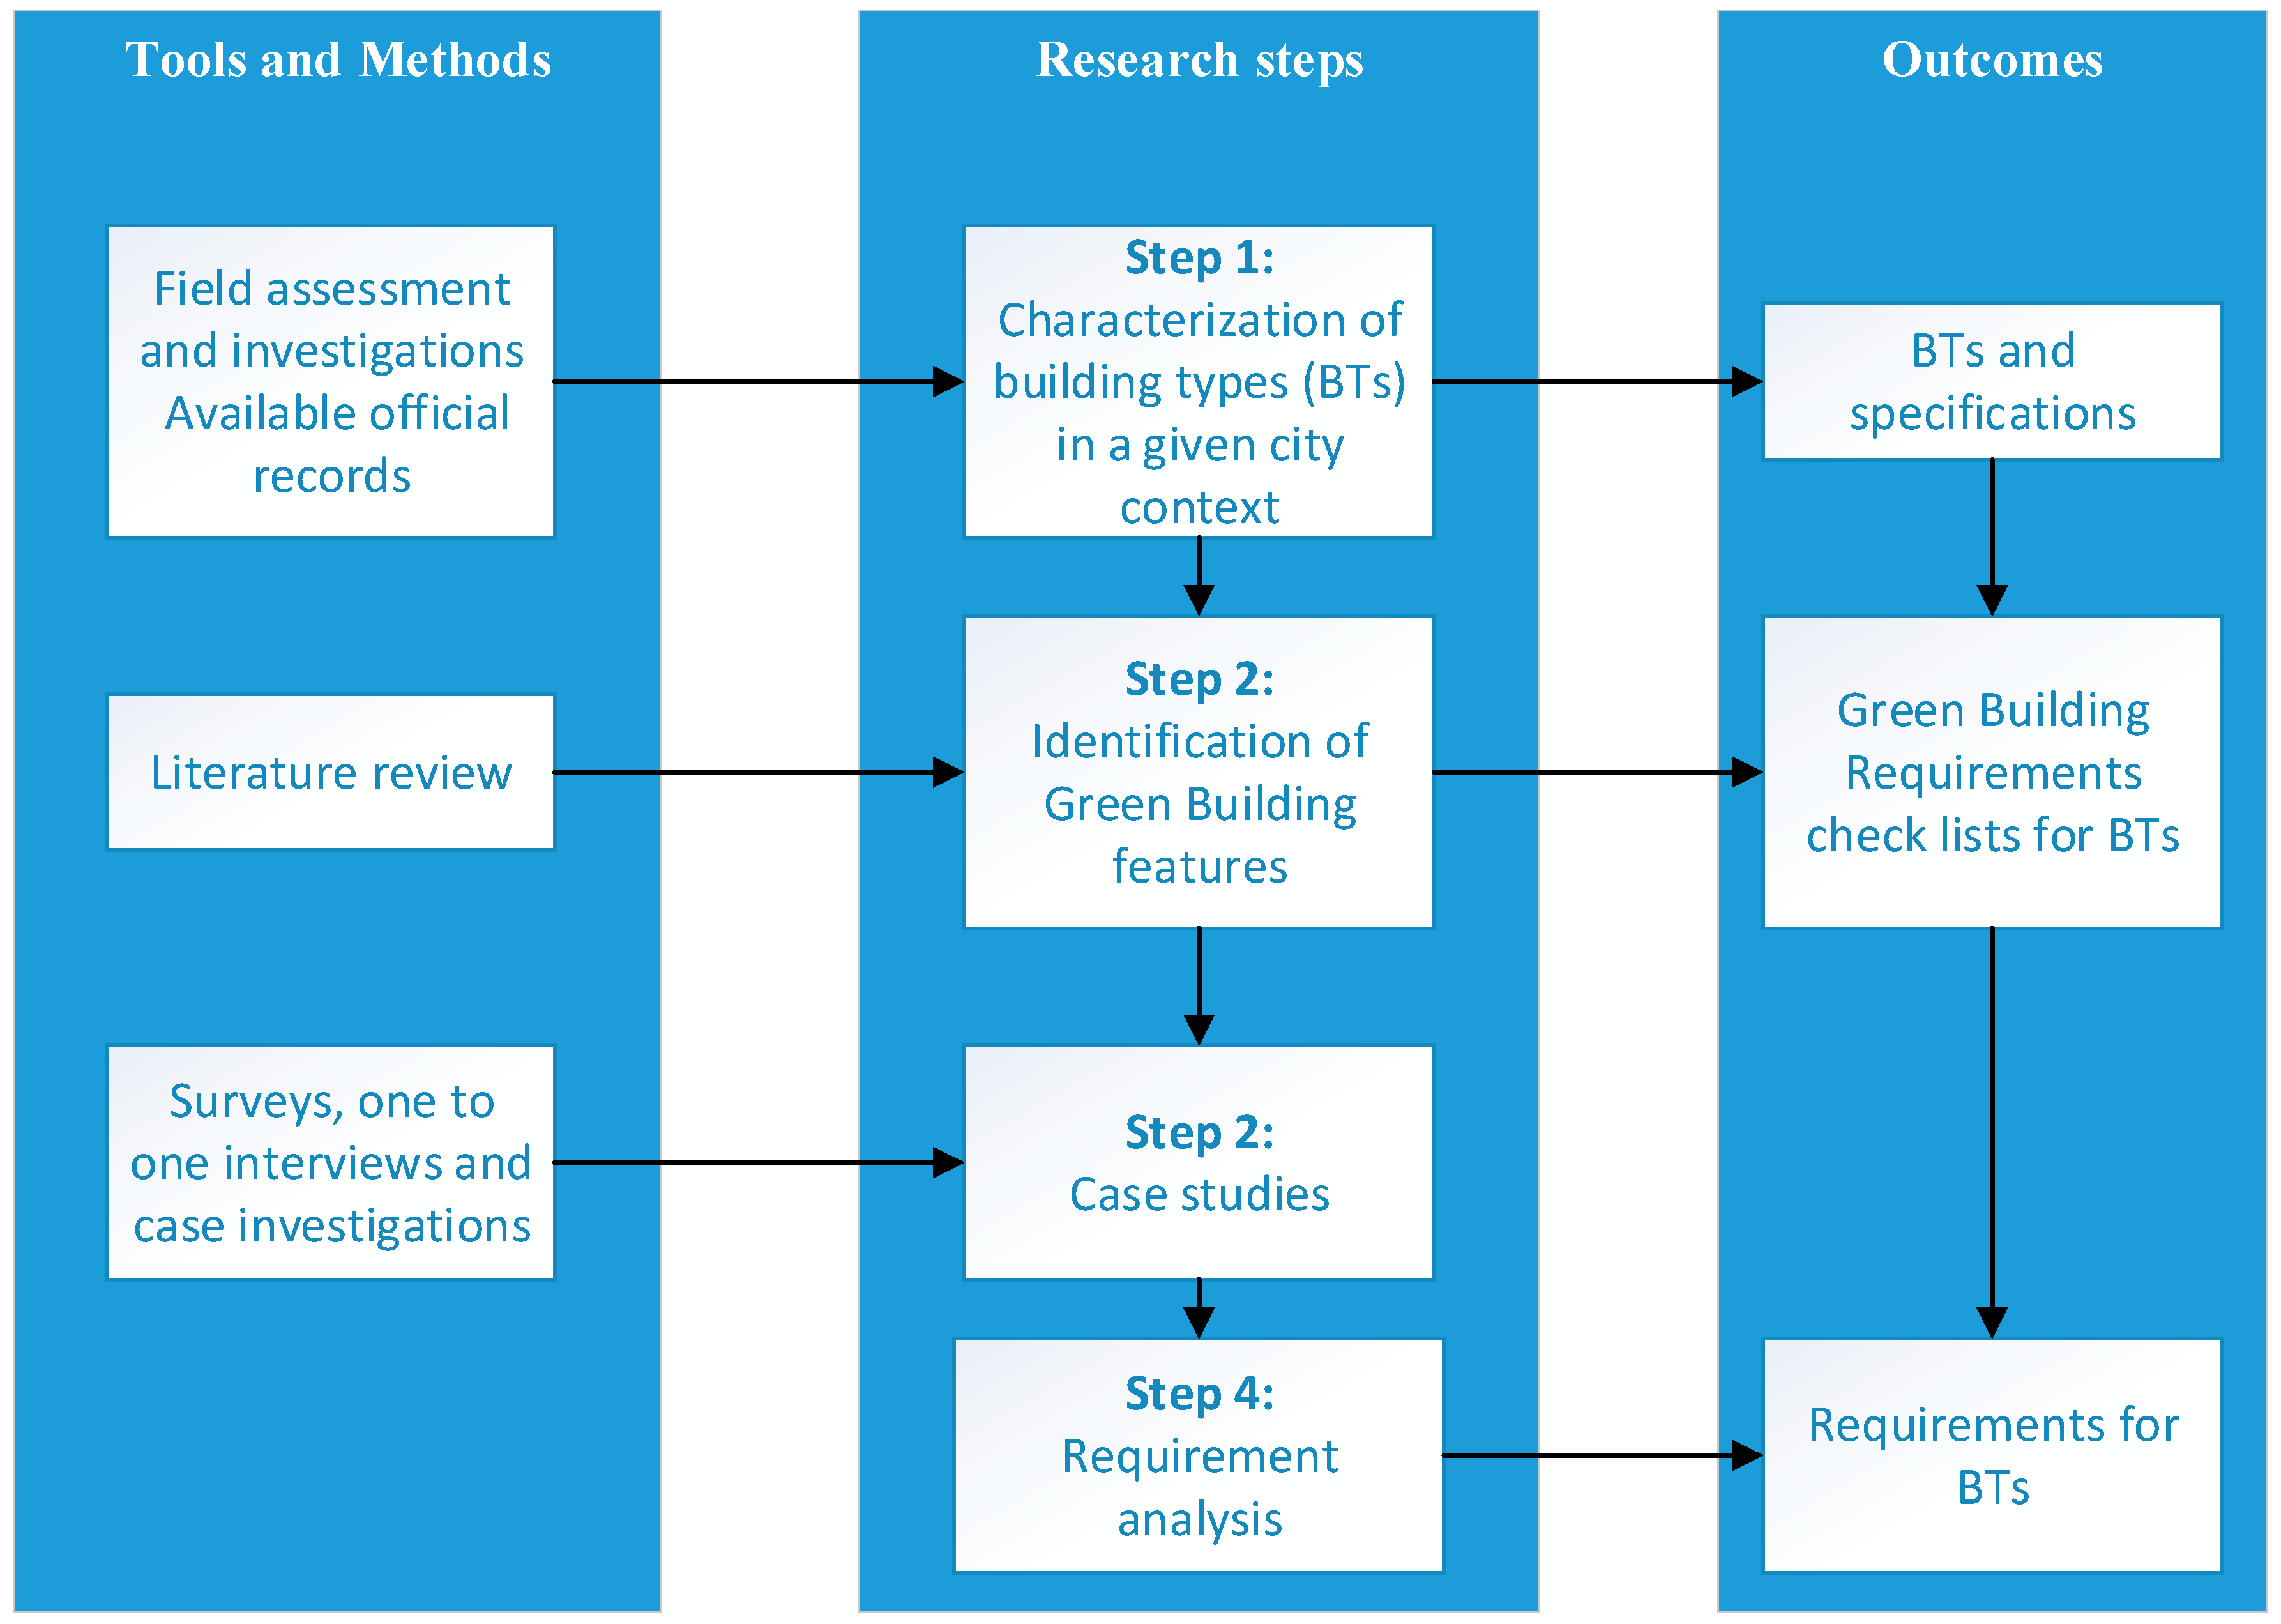
This paper presents the current situation in terms of conformity to the GB concept by the residential building sector in Astana, Kazakhstan. It has a particular focus on the identification of requirements and deficiencies in satisfying the GB concept, which is essential information to provide a correct direction for future sectoral applications. It follows a four-stage methodology that is illustrated in
Figure 1.
Firstly, the characterization of residential building types (BTs) were done by categorizing them into several groups (e.g., old buildings primarily built during the Soviet Union such as brick buildings, panel buildings and single floor dwellings (further, houses), and new generation residential buildings classified as economy, comfort, business/elite, premium). Details of BTs and their specifications are summarized in
Table 1 for new and old types of buildings. This classification was based on field assessments and investigations as well as available official records. Afterwards, the GB features and performance indicators were identified by a literature review [
20,
21,
22]. Then, a checklist was formed that allows us to track the identified GB features and performance in BTs. The checklist contains categories and what the elements of a green project are; it also provides, at minimum, an assessment performance and requirement list for each case study. This checklist collects relevant information in six categories:
Energy consumption, production and losses
Waste management and use of materials
Sustainable ecosystem: land and water
Air quality indoors
Building functionality
Certification and support
All the elements in the checklist were qualified using a Likert rating scale (1–5), with 5 being the positive end and 1 being the negative end (e.g., does not exist (1), partly exists (2), exists and fits the concept (3), significantly better applications exist (4), and best engineering applications exist (5)) is used. Thirty-five buildings were selected based on their BTs, and their GB requirement analyses were assessed by filling out the checklist for each case study during one-on-one interviews and site investigations. The averages of all the responses in each category were calculated.
The summary of BT ratings for each GB requirements category is given in Figure 5. Requirements for BTs is the ultimate outcome of this research that will potentially help building market stakeholders, especially giving decision makers, developers, builders and designers advice on how to make cost-effective green improvements to their current and future projects.
Table 2 provides representational data on BTs’ main characteristics, which provides one building as a sample per building category. The findings from each of the steps followed in this research are given in detail and discussed below.
2.1. Step 1: Characterization of Residential Buildings in Astana, Kazakhstan
The residential buildings in Kazakhstan have historically been classified according to the periods in which they were built. For example, terms such as “Stalinka,” “Brezhnevka,” and “Khrushchevka” refer to the 1960s, 1970s, and 1980s, respectively. However, the newer construction output, particularly built in post-Soviet times, is categorized based on the comfort class.
The residential buildings that were built before the 1990s are mainly 4‒5-story panel buildings assembled from prefabricated blocks (concrete panels). Such buildings are characterized by a relatively low level of thermal comfort due to poor insulation and façade design. Another typical building type in this category is old brick buildings, also consisting of four-five floors but the main material used is clay or silica bricks. Bricks buildings are characterized by higher level of thermal comfort and therefore higher market prices. Besides, panel and brick buildings, houses (single standing property) were popular in locals but less prevalent. Private houses were constructed using wood and clay, which are much cheaper than concrete and brick.
This study chose Astana as a case study location due to the significant construction boom in recent decades. Most of Kazakhstan’s construction output is reported to be in Astana. Currently, Astana is one of the fastest-growing capitals in the world. Only during the last 15 years, the total area of commissioned residential buildings was 3915 thousand m
2. Generally, the commissioned area is steadily increasing, with insignificant fluctuations (see
Figure 2) [
23]. The financial investment for construction of residential buildings in the first quarter of 2017 in Astana was KZT 195,399 million, which represents a 31.4% increase compared to the same period of 2016 [
24]. Such growth is correlated with a constantly growing population. According to government reports, the population in Astana was about 350,000 in 1997, the year that Astana became Kazakhstan’s capital city, and reached 1 million people in 2018, a nearly threefold increase [
23]. This milestone is, therefore, assumed to be the breakpoint that separates the construction of “old” and “new” types of buildings. Thus, old buildings constitute 36% of the city’s residential fund. The other 64% was considered new buildings. Based on the market analysis, the new buildings were divided into four categories, “economy,” “comfort,” “business,” and “premium” [
24]. The main characteristics of old and new buildings as well as their share in the total residential building stock are provided in
Table 1.
Economy class is the cheapest to build but is the largest segment in the new residential building fund of Astana. Economy-class residential buildings are spread across the city. The territory of buildings is not fenced; the security system is installed only at the request of the tenants. The number of apartments on one floor can be more than five. Underground parking is not provided. Exterior decoration, decoration of vestibules, and common areas is standard.
Comfort class is not significantly different, but the apartments have additional features such as more personal space for individual residents. Additional facilities may be available, such as an intercom at the entrance, fenced territory, and apartments equipped with TV and Internet. In
Business class, there are no more than four apartments per floor. Exterior finishing, decoration of halls, entrance groups, and public spaces are improved with the use of high-quality materials. The area is usually fenced, with a security system obligatory; there is one space per apartment in an underground parking garage. The finish is slightly inferior to that of premium housing, but also made of quality and expensive materials. The luxury buildings—
Premium class—are mostly located along the riverside. This class of building tends to provide a concierge service with an external guard post. Apartments can have a centralized control system for engineering networks, air conditioning, and cable/satellite TV. Usually, the apartments are decorated with high-quality and durable materials, works of art, and monuments and other decorative design [
25].
2.2. Step 2: Identification of GB Features
A checklist was created to assess the perception of residents of Astana regarding the sustainability levels of their respective buildings, based on the findings of the literature review where similar checklists were applied. It consists of six categories and each category contains from two to five questions. It was used in such a way that randomly selected residents from each particular building types among the seven BTs in Astana could assess their buildings. The results of the survey are presented in the Figure 5. The six categories along with the intentions of the questions asked are briefly explained as follows.
2.2.1. Energy Consumption, Production, and Losses
Questions in this category assess the overall efficiency of energy use, quality of insulation, level of airtightness as well as the application of renewable energy technologies and energy-efficient appliances.
2.2.2. Waste Management and Use of Materials
Questions in this category evaluate if a building has any waste management system or employs any relevant practices, as well as how efficiently resources and materials are used (e.g., chemical and painting materials, water, and labor to maintain the building).
2.2.3. Sustainable Infrastructure: Land and Water
Questions in this category check whether buildings discharge any waste into water, and if a building’s Service Company manages to maintain the landscape and biodiversity of its surroundings (trees, birds, flowers, bushes, etc.)
2.2.4. Indoor Air Quality
One of the questions in this category assesses air quality inside the building, by asking about any exposure to pollutants. Another question assesses the effectiveness of the HVAC system in terms of the provision of clean and fresh air.
2.2.5. Building Functionality
Respondents are asked to evaluate whether a building’s system allows for adjusting the heating level and regulating the humidity and temperature inside the building,—whether the building functionality is fully adjustable for inhabitants’ comfort. One of the questions is related to the technical condition of the building and whether it required improvement.
2.2.6. Certification and Support
The set of questions in this category is directly related to the availability of any GB certification. Additionally, one question is related to whether a building gets continuous technical support during the exploitation stage.
2.3. Step 3: Case Studies (Selection of BTs)
This study conducted a survey of respondents of 35 buildings (one response each) in Astana, which were divided into seven categories (building types) with five building samples in each category representing the residential building stock of Astana. This section briefly describes the selected “typical” buildings in each category. The visual representations of old and new BTs are given in
Figure 3a–c and
Figure 4a–d, respectively.
Table 2 provides the representational data of each “average” building of each building type. As can be seen from the table, almost all buildings were located on the right bank of Astana (with respect to the Ishim River). The exception is comfort class, which is constructed on the left side of Astana. The majority of buildings constructed in recent years were built by private companies, whereas the “old” buildings, particularly, “panel’ and “brick” ones, were built under governmental construction programs. “Houses” were mainly built by individuals.
Determination of whether there are any statistically significant differences between householders’ opinions on the independent groups (BTs) is of interest in this study. In order to test this, first a one-way ANOVA test was performed for testing whether the means for groups of building types were equal by assuming all the householders are representing the same population, namely, Astana residents. The F value and
p value of the test results are reported in
Table 3 [
26]. The
p-value (0.000000105<<0.05) is significantly small and the F statistic (8.15) is bigger than F critical (2.15). These results are statistical indications of strong evidence against the null hypothesis that the mean (average value of the dependent variable) is the same for all groups [
26]. It is statistically clear that there is an overall statistically significant difference in the responses of the different BT householders.
However, it is required to run some post hoc tests to confirm which groups are significantly different; hence, the Tukey HSD multiple comparison test was performed (refer to
Table 4). This post hoc test would likely identify which of the pairs of treatments are significantly different from each other. We have seven BTs, which results in 21 pair comparisons in Tukey’s HSD test. Significant and very significant results, along with insignificant ones, are reported in
Table 5 by evaluating whether Q > Qcritical for all relevant pairs of BTs. Very significant differences at the 99% confidence level were found between Economy vs. Business and Premium class BTs. The householder responses in Premium and Comfort class buildings were also statistically different at a 95% confidence level. Other significant differences in responses were found between Business and Premium building types vs. all old building types (e.g., Brick, Panel, and House).
The abovementioned results indicate that there are significant differences in the opinion of householders for the GB performance criteria. We suggest that these differences may follow a pattern or can be categorized based on the BTs. In order to confirm this hypothesis, Factor Analysis (FA) was performed to investigate whether our multiple observed variables have similar patterns of responses because they are all associated with a latent variable. Based on the eigenvalue ≥1 criteria, we obtained three factor groups. Rotated factor loadings of FA test results are given in
Table 5. These results indicate that there are three groups of responses (factor groups). Since factor loadings can be interpreted like standardized regression coefficients, one could say that the new building types (e.g., Economy, Comfort, Business, and Premium) have a correlation of >0.798, which is a strong association for a factor analysis. This result does not seem to be well matched with the earlier results obtained in Tukey’s HSD test, but it should be noted that the former analysis is for testing whether means for groups of building types are equal, while FA is observing similar patterns in the responses. Thus, it can be statistically said that all the new buildings fall in the same factor group, namely ‘Factor 1: New buildings’. The second group has two members, Brick and Panel buildings, in ‘Factor 2: Old apartments’. The last group has only one member, which is ‘Factor 3: Old Houses’.
2.4. Step 4: Requirement Analysis
The survey results are presented in
Figure 5 below and are visually self-descriptive. However, this analysis attempts to summarize the responses based on BTs, with an indication of some of the value-based results. The analysis also attempted to compare Factors 1–3.
2.4.1. Energy Consumption, Production, and Losses
“Old” buildings (Factor 2) in this category received from 2.1 to 2.6 points, which means that old buildings regardless of their type perform nearly the same way, whereas the “new” ones (Factor 1) tend to have better performance and, most importantly, the performance increases as the class of the building increases (2.5, 2.8, 3.3, 3.8 points). The latter can be explained by the fact that higher class buildings use higher quality and more expensive resources, labor, and technologies. This means that the final cost of the buildings was more expensive.
2.4.2. Waste Management and Use of Materials
It was found that most of the respondents from all building types gave relatively low and similar scores (ranging from 2.0 to 3.0) due to the fact that the waste management system across the city is quite poor (separating plastic, glass, batteries, and lightbulbs). However, most of the waste is combined and dumped outside the city. In terms of the efficiency of materials and resources used, in the “old” buildings category houses seem to be more advanced, perhaps, due to the private ownership and, as a result, more careful use of resources. The “brick” buildings seem to be slightly better than “panel” ones, but both have relatively poorer performance than “houses.” In the “new” buildings case, the “economy” class buildings had lower performance (2.1) compared to others that scored (2.7–3) points.
2.4.3. Sustainable Infrastructure: Land and Water
In this category, all scores were close to 2, ranging from 1.9 to 2.5, perhaps because usually all waste from Astana goes into a dump outside the city. Basically, this means that all types of buildings perform equally well in the city as the waste and sewage discharge system is similar for all types of buildings.
2.4.4. Indoor Air Quality
The responses in this category were almost similar for “old” buildings (2.5–2.6). Most of the old buildings have no mechanical air ventilation systems and rely solely on natural ventilation. Meanwhile, “new” buildings had an increasing range of responses (2.6, 2.9, 3.9, and 4.4) correlated with the class of buildings. “Premium” class buildings scored as high as 4.4, most likely due to the state-of-the-art HVAC system installed in the buildings.
2.4.5. Building Functionality
The responses in this category were distributed differently depending on the building age. While the “old” buildings had similar scores across the category (2.3–2.5), the “new” buildings had steadily increasing scores from Economy to Premium class (2.7, 2.9, 3.8, and 4.3). Such results indicate that the buildings from this category have increasing functionality as the class increases.
2.4.6. Certification and Support
All responses were between 1 and 2, due to the absence of GB certification and any plans for undergoing the certification. The “new” buildings had relatively higher values in this category as they were to have better technical support by operation companies.
The results of the study presented that the “new” buildings (Factor 1) tend to have similar patterns. With the increase of the comfort level, i.e., class, the sustainability level increases. The “old” buildings are divided into factor groups (2–3). Specifically, “old” multi-story buildings tend to perform slightly different from “houses.” This can be explained by the fact that “houses” are owned by individuals, and therefore have different maintenance and quality.
3. Conclusions
This study attempted to understand the types of buildings that constitute the residential sector of Kazakhstan, specifically in Astana, the capital city, which is the major construction site of the country. Moreover, it aimed to assess the levels of sustainability of the identified building types based on an opinion survey of the occupants. The study has adapted a checklist from the extant literature and used it as a survey tool. The study found that old buildings tend to have a rather poor level of sustainability across all types, whereas the sustainability of new buildings depends on the class of the building, steadily increasing from Economy to Premium class in all categories of the checklist.
It is observed that householders may have different motivations that color their understanding of the sustainability parameters. Use of common tools with standard practices is not efficient for measuring social and economic impacts; instead we concentrate on the more conventional approaches to minimizing environmental impacts. However, householders of fast-developing cities with no strong environmental priorities (e.g., Astana) tend to ascribe a higher level of importance to social and economic benefits. So, this study supports the idea that having a context-oriented assessment tool for GB is important. The GB checklist is the first context-based attempt in Kazakhstan, and further research and development will follow.
In order to increase the adoption of GB concepts in the Kazakhstani context in general:
A local context-oriented, holistic assessment methodology fostering Kazakhstan’s culture, issues, players, practices, and institutions by integrating criteria from existing assessment methodological frameworks must be developed.
GB assessments present many new opportunities for engineers, decision makers, and city planners to impact the built environment and meet sustainability goals.
Sustainability assessment systems have recently been introduced in Kazakhstan, which is a country with a fast-growing, urban population with lots of premises in planning. There are many opportunities for their expanded use in urban development. Sustainability strategies and goals should be addressed as a major aim by local, regional, and national governments, as well as city planners and decision makers.
Current building classifications in Astana, introduced by construction companies, play a major role in their marketing strategy. However, there is still need to develop a more objective and regulated system, in particular a GB assessment system.
Old buildings have priority in terms of GB improvements, while all buildings urgently need to be improved through better waste management systems. Promoting ecological sustainability and community should be a national priority for the construction sector and needs to be regulated and enforced for next-generation buildings.
In “new” buildings more attention should be paid to Economy-type buildings as this BT scored the lowest in all six categories. Within this BT, greater attention should be paid to improving the level of sustainability of using surrounding ecosystems: land and water, as well as introducing and improving the green building certification and technical support level. Although the Comfort-type buildings generally present a higher level of performance compared to the Economy class, the lowest scores were for sustainable use of ecosystems as well as the certification and technical support level. Business- and Premium-type buildings also had low scores for these two criteria. Beyond them, the priority for these BTs should be given to waste management and use of materials.
In the case of “old” buildings, it would be recommended to pay attention to certification and technical support in all BTs. This criterion seems to be a weak point for “old” buildings, the same as for “new” buildings. Except for this criterion, high priority should be given to waste management and use of materials as well as energy consumption, production, and losses in the case of Brick buildings and Houses. In the case of Panel buildings, the highest importance should be given to waste management and use of materials as well as sustainable use of ecosystems and building functionality.


 ,
, 


