Abstract
This study is set out to identify feasible ways for immigrants’ integration into the major ten host countries within the European Union (EU-10) and increased labor market performance. Eurostat, OECD, and United Nations High Commissioner for Refugees (UNHCR) official data was mainly used to capture essential international migration indicators (for both dimensions—economic and humanitarian), along with education, socio-economic development and labor market credentials, as key variables for immigrants’ integration into EU-10, compiled for 2000–2017. In this respect, spatial analyses, bootstrap estimations, structural equations (SEM), and Gaussian graphical models (GGM) are applied, to better grasp migrants’ labor market outcomes. Significant positive consequences reflected through a reduction in the unemployment rate of the foreign population are generated by active labor market policies, jointly with an enhancement in the attainment for secondary education, and welfare advances. The opposite, a rise in income inequalities has negative effects, while additional support for R&D activities deployed within the business sector is required to entail migrants’ labor market performance. The passive policies need to be redesigned and tailored to significantly downsize the foreign unemployment, since these are currently acting like a disincentive for an active participation of migrants on the European labor market, thus confining their integration.
1. Introduction
International migration currently heightens major confrontation for the European Union (EU) Members States (MS), particularly for migrant host countries that are met with large inflows of foreign population. On this framework, migrants’ integration into host economies, labor markets and society is an extensively debated subject in the literature and has gained tremendous importance on the European agenda. The EU, as a whole, acknowledges through its Common Basic Principles of Immigrant Integration that “employment is a key part of the integration process and is central to the participation of immigrants, to the contributions immigrants make to the host society and to making such contributions visible” [1] (p. 10). Furthermore, migrant’s active labor market participation and insertion represents an effective way to grant their integration and the positive impact upon host economies, and should be grasped as an opportunity for migrant receiving societies to improve the overall functioning and performance of their labor markets, by tackling skills shortages and supporting fiscal sustainability [2,3]. Moreover, as Van Wolleghem [4] (p. 196) emphasized, “immigration is unlikely to recede and the EU will need new citizens to sustain its economy and social policies”, becoming an essential factor for economic and social sustainability of host countries.
Hence, our research addresses an extremely important and highly topical subject connected to the major challenges faced nowadays by the EU in terms of migrants’ integration into host economies. We design an inclusive framework of analysis for migrants’ labor market integration in ten EU countries (EU-10) that are mostly preferred by immigrants in light of the Brexit decision (namely, Belgium, Denmark, Finland, France, the United Kingdom, Germany, Austria, Sweden, Italy and Spain). We focused on these ten EU Member States since they are migrant receiving countries, which are nowadays confronting with large inflows of immigrants and asylum seekers, being targeted in terms of living standards, economic development, welfare, job opportunities and security. Therefore, for EU-10 host countries, the issue of immigrant’s integration is essential in order to better cope with the large numbers of immigrants and to secure positive effects of international migration, especially on the long run, thus entailing sustainable economic development. The migration process is analyzed on both migration dimensions, respectively economic (labor) and humanitarian (refugees, asylum seekers). Hence, we aim to identify best practices concerning the most successful and adequate ways of ensuring a proper labor market integration of these two migrant categories. This approach is in line with the work advanced by Clark et al. [5] (p. 17), which stated that “whether migrants have moved for economic or family reasons or are refugees will be important, but is not identified in the data used here”. Thereby, authors considered that this “special route” analysis of the migration process would be more conclusive, especially for the United Kingdom, and they recommend it for future research. In order to capture the migrants’ labor market integration, we have selected two proxies related to the employment rate of the foreign population and, respectively, their unemployment rate, since these indicators represent essential measures of labor market performance.
Consequently, compared to previous studies, e.g., [1,5], the paper’s objective is to analyze both migration credentials (economic and humanitarian) within EU-10, along with welfare and labor market performance indicators, through a complex set of procedures followed throughout the methodological endeavor, respectively: spatial analysis, bootstrap estimations, structural equations (SEM) and Gaussian graphical models (GGM). The analyzed period is 2000–2017.
The paper is structured on three major sections. The aspects regarding the shaping factors of the migration decision and migrants’ integration policies were outlined first. Further, the data comprised within the empirical analysis were introduced, along with the research methodology, mainly the spatial analysis, bootstrap estimations, SEM, and network GGM techniques. The last section comprises the research results, their implications, and main conclusion.
2. Literature Review
Migrants’ integration on the EU labor market is fundamental for their effective inclusion into host countries, thus ensuring the positive impacts of migration on the European economy. These aspects would generate the entirely use of migrants’ skills and the acknowledgment of their economic resource, especially related to their contribution to the shortage coverage of capabilities in certain sectors for all levels of qualification.
Among the main factors which influence the migration decision, particularly, for migrants coming from the New Member States (NMS), are employment opportunities, higher income, and improved living standards at destination [6,7], along with the educational attainment enhancement and poverty avoidance in the origin country [8].
The basic guidelines of main EU strategies developed in this respect recommend the acknowledgment of migrants’ qualifications (skills) into the host countries, and the educational attainment [7,8,9], being also proved “the importance of skilled labor (national or foreign), to encourage workers’ productivity and to ensure sustainable economic development” [10] (p. 1).
Van Wolleghem [4] and also Entzinger and Biezeveld [11], referring to migrants’ integration within EU MS, underlined that there are a lot of differences among MS approach, strategies and policies, being concluded that “there is no EU integration policy”, although “there is a consistent set of policy instruments that together form a policy relating to integration” [4] (p. 190). The authors mentioned the need to avoid the negative effects of strategies both for migrants, and the native population. In this regard, they underlined the “mainstreaming” policy, which means that “policies addressing certain problems do not aim solely at migrants, but rather at the general population, thereby hoping that migrants will benefit from them as well” [11] (p. 20), or “newcomers need to be given the same opportunities as natives” [4] (p. 196). On this frame of reference, the need of migrants’ integration into host economies becomes crucial, along with accurate and specific strategies at EU level [4,12].
Entzinger and Biezeveld [11] (p. 16) emphasized the importance of tertiary education level, as a potential for entirely inclusion within EU host society, and argued that “incorporation of immigrants into the labor market as well as a sufficient level of education constitute most important objectives for securing a successful integration”. Providing programs by which migrants can acknowledge their educational and professional skills in order to be recognized and accepted in the host countries, thus receiving the most appropriate training for them, represents a fundamental step for migrants’ labor market insertion, as a whole, but especially for conducting a favorable economic impact on destination economies.
Opposite, Kogan [13] (p. 91) underlined that, even though the migrants in Germany (after 1990) have improved their educational level, “these immigrants coming mostly from Eastern Europe, Africa, and the Middle East face severe integration problems in the German labor market”.
Analyzing the importance of wages and unemployment for the immigrants in the United Kingdom, Clark et al. [5] (p. 16) found that “for both wages and unemployment, experience of the English labor market does indeed improve new migrants’ outcomes”. Still, for these results, the “spatial-assimilation theory” (migrants’ mobility inside a country towards better neighborhoods) accomplishes a significant role for higher migrants’ labor market integration.
Koopmans [14] analyzed the migrants’ integration on the labor market within 8 EU countries (Austria, Belgium, France, Germany, the Netherlands, Sweden, Switzerland, and the United Kingdom). Thus, applying a cross-national analysis, he identified a high connection among multicultural policies, welfare status of host countries, and migrants’ integration on the labor market. He found that better migrants’ integration were achieved in countries with “more restrictive or assimilationist integration policies (Germany, Austria, Switzerland, and France) or a relatively lean welfare state (the United Kingdom)”, compared with the other countries (Belgium, the Netherlands, and Sweden), where the integration process was limited [14] (p. 1).
Among immigrants within the host country, asylum seekers and refugees appear to be more affected by the challenges they face, especially due to employment disadvantages, and also to additional difficulties regarding the legal status and nature of the migratory process, interruption of employment and education path [15]. Hooper et al. [15] (p. 1) attested that assisting migrants (especially refugees) to find work “is crucial to their successful integration into these communities, as it reduces their reliance on local welfare systems and strengthens their broader social inclusion”. However, they highlight that the support granted for migrants and particularly new arrivals should be long-term oriented in order to contribute to their labor market performance.
Moreover, for asylum seekers, “the construction of the migration policy is a constitutive element of the spatial process of reorganization of territorial policies through the combination and diffusion of state, regional and global” [16].
Consequently, by reviewing the scientific literature, we can summarize that: the main factors considered for the migration decision are: welfare, income, poverty (from origin country), educational attainment; labor market insertion of migrants is a fundamental credential for their effective integration into host economies; there are numerous approaches regarding migrants’ integration into the host countries’ labor markets; there are many differences among EU MS regarding the strategies, policies and even approaches of migrants’ integration, despite a common framework developed so far at the EU level; there is a consensus related to the need for accurate strategies and policies; there are various models regarding migrants’ integration measurement, but none for the distinctive route of migrants (economic and humanitarian).
3. Data Analysis and Research Methodology
3.1. Data—Selected Indicators
Based on main findings of the literature review, we have compiled a balanced panel (2000–2017 sample) for the EU-10 countries, most targeted by migrants, and considered the total immigration flows (as measurement for the economic migration) and refugees and asylum seekers (humanitarian migration dimension), jointly with an integrated set of indicators (related to economic welfare and labor market performance) that we’ve further used in the empirical analysis.
For the data series with some missing observations, we’ve applied the mathematical method of extrapolation to complete the dataset. Further, to overlap for data benchmarking between countries, we’ve used the standardization procedure for all indicators.
The following groups of indicators were used as proxies for the variables included within the empirical models (Table A1, Appendix A), respectively:
- international migration indicators: flows of immigrants and foreign population (IMIG); and flows of refugees and asylum applicants (ASYL);
- economic welfare, labor market and other specific indicators: real Gross Domestic Product per capita (GDP_cap); unemployment rate for the foreign population (UR_F); employment rate for the foreign population (ER_F); educational attainment for upper secondary and post-secondary non-tertiary education (levels 3–4) (EDU_S), and tertiary education (levels 5–8) (EDU_T); active labor market policies (ALMPs) and passive labor market policies (PLMPs); at-risk-of-poverty rate (POV_R); Business Enterprise Research and Development (R&D) expenditures (BERD); GINI coefficients (economic inequalities among countries).
Inasmuch as timely migration data are not always readily available to capture the propensity of the migration phenomenon, the databases used for gathering the data were mainly Eurostat [3], but also OECD—International Migration Database [17], World Bank—World Development Indicators [18], United Nations High Commissioner for Refugees (UNHCR) [19], World Income Inequality Database [20] (Table A1, Appendix A).
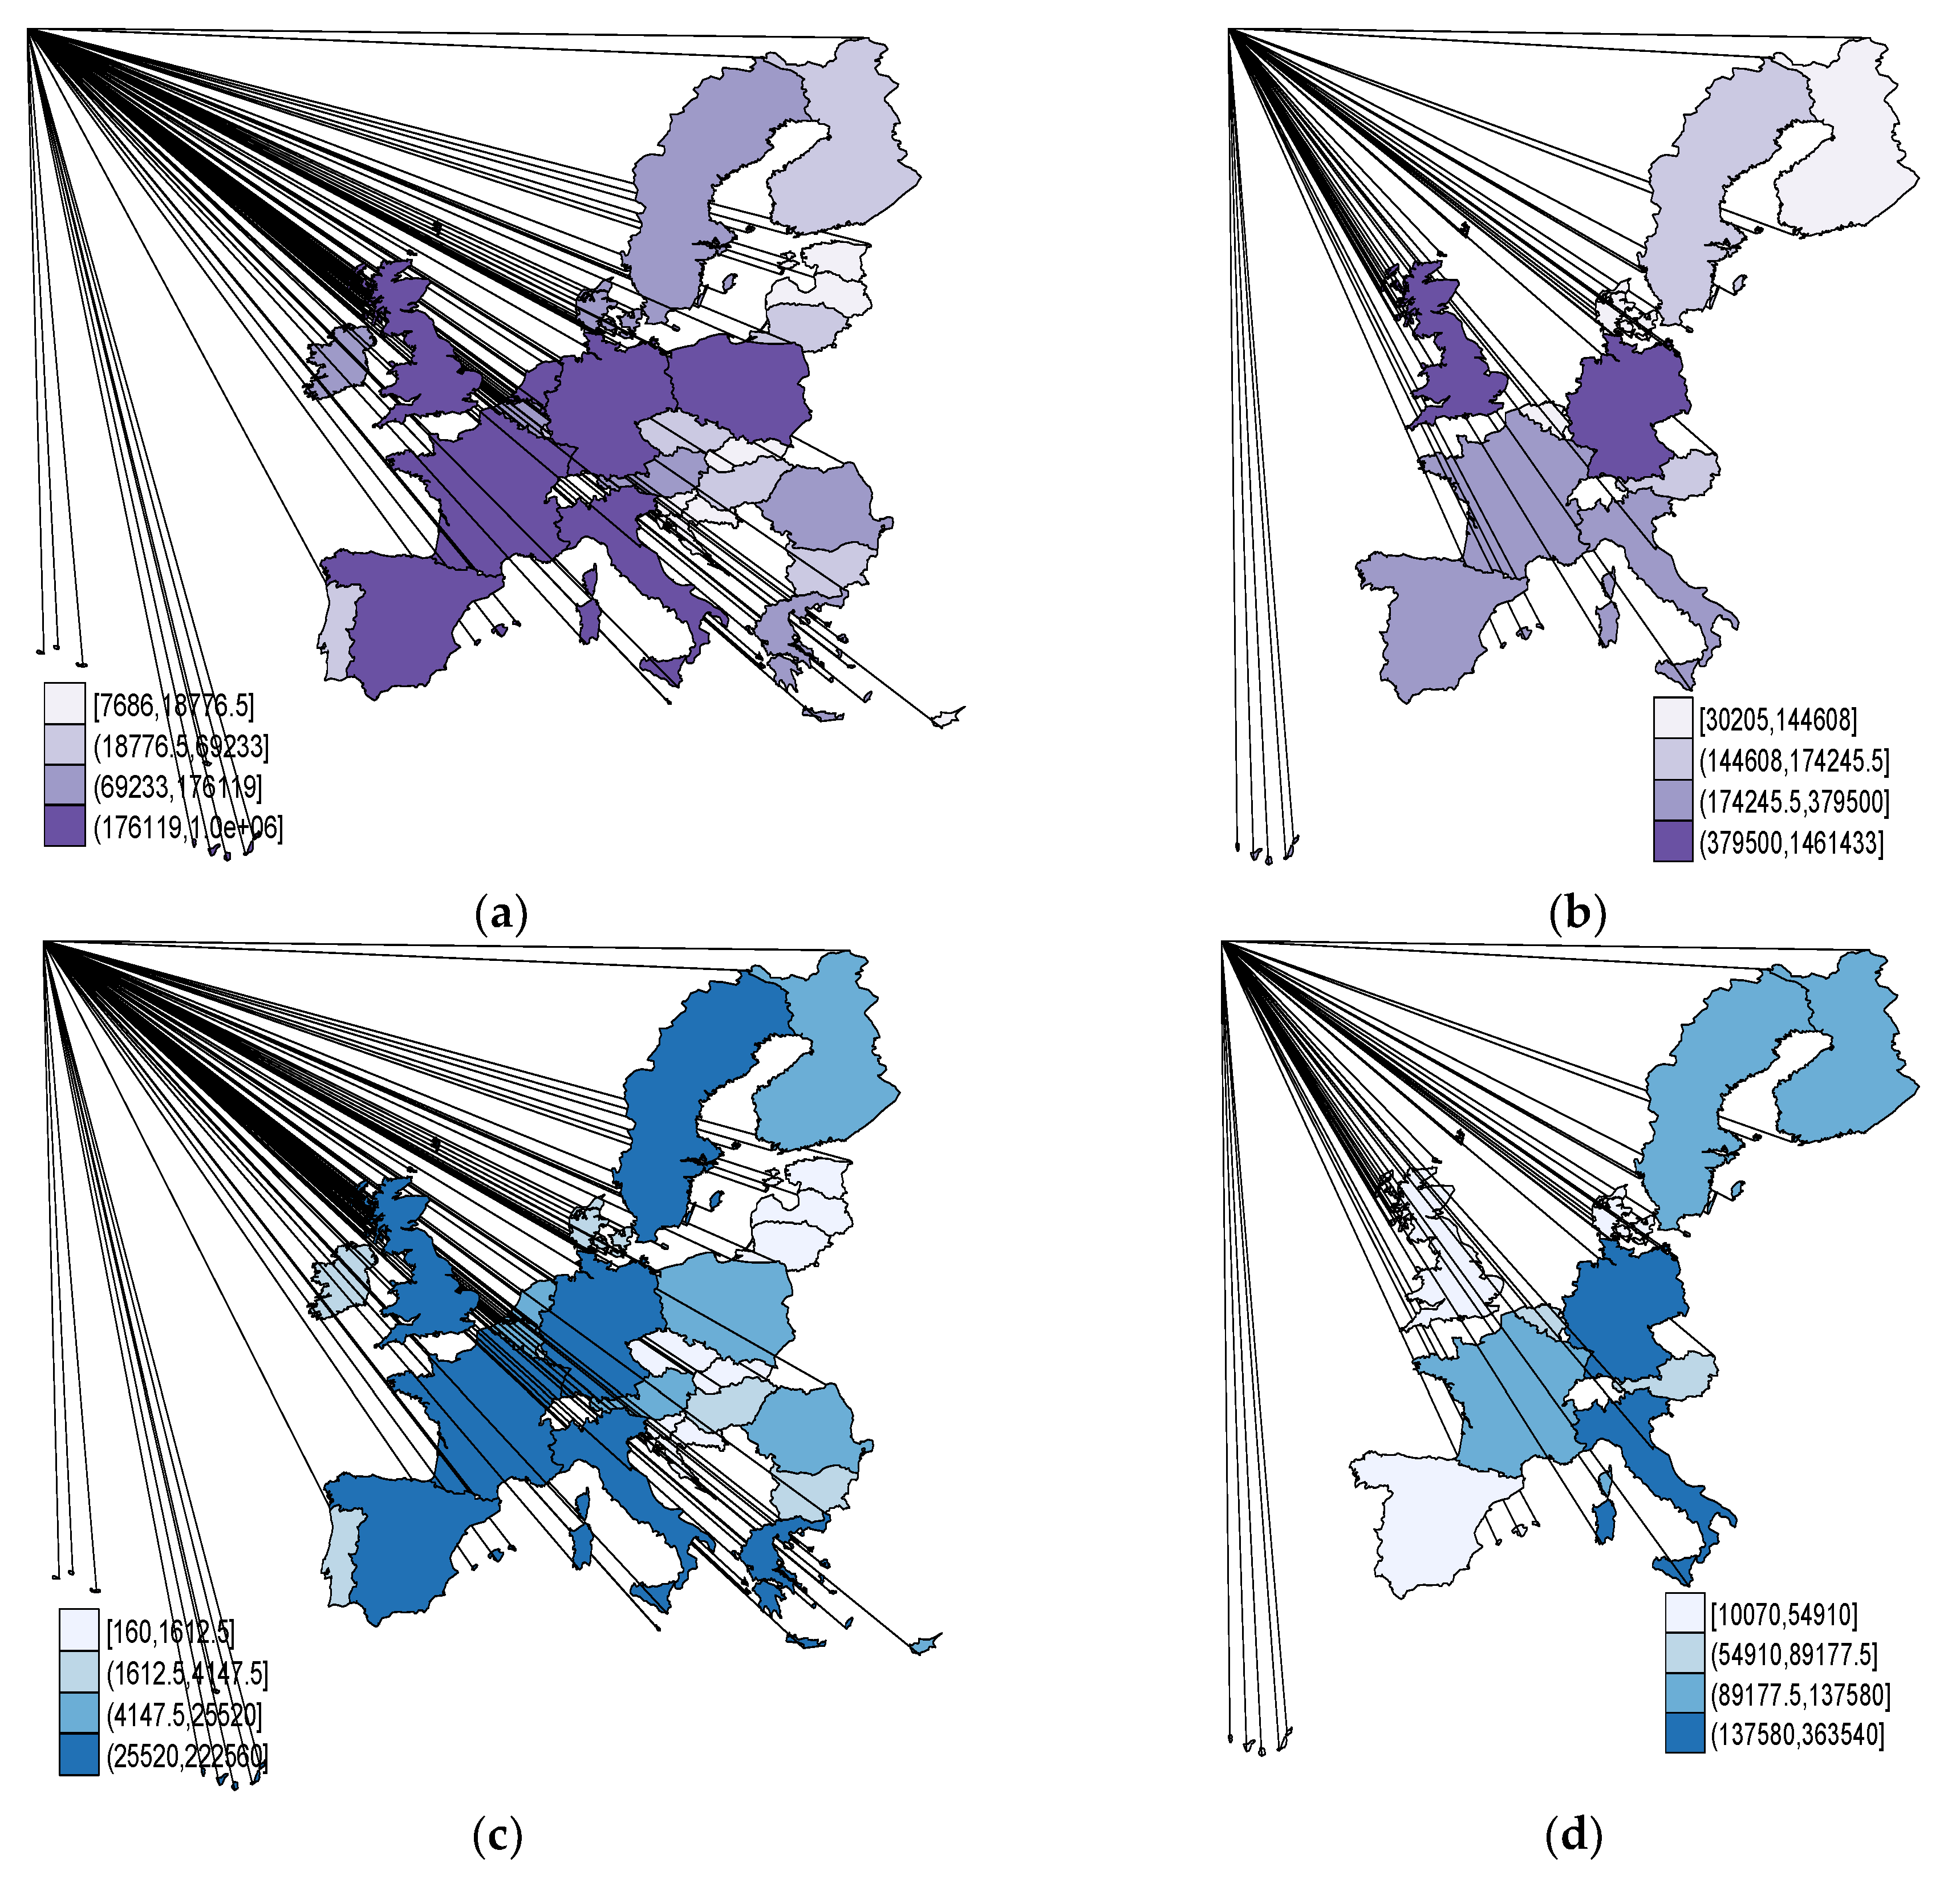
Regarding the international migration indicators (Figure 1a–d), while official data point to relatively high numbers of immigrants (as can be seen from Figure 1a) and asylum seekers (as can be seen from Figure 1c) in EU-10 countries (namely, the United Kingdom, Germany, France, Italy, Spain, Belgium, Austria, Sweden, Denmark, and Finland), the propensity of the migration phenomenon significantly overpasses these numbers. Alongside these selected EU-10 MS, Poland tends to be preferred by labor immigrants in absolute terms, however, if we report to its population, the immigration rate is very small (0.5%) compared to Austria for example, which accounts 1.48%, or Sweden with 1.65% [3]. Moreover, Poland and Romania are well known as migrant sending countries, analyzed from a different migration perspective (emigration), being rather transitory targeted by immigrants and asylum seekers through the main migration routes [21]. Among EU-10, Germany and the United Kingdom are mostly targeted by labor immigrants (Figure 1b), respectively Germany and Italy by asylum seekers (Figure 1d), but here Italy is mostly a transition country being targeted through a major migration corridor coming from Libya [21].
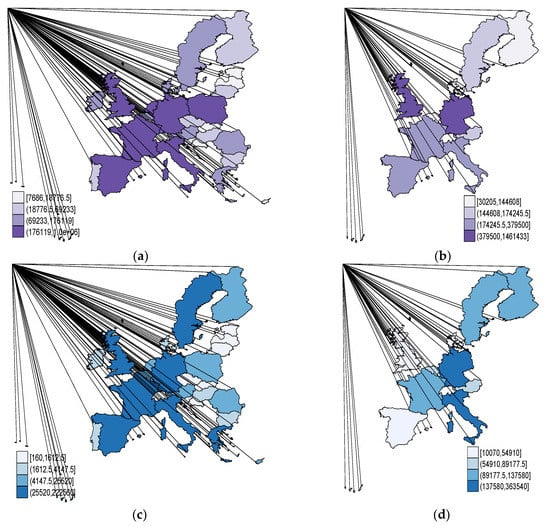
Figure 1.
The economic migration measured by flows of immigrants and foreign population, EU-28 (a), EU-10, 2017 (IMIG) (b). The humanitarian migration measured by flows of refugees and asylum applicants, EU-28 (c) and EU-10, 2017 (ASYL) (d). Source: authors’ process in Stata, based on data of [17,19].
Thus, within the EU-28 there are significant differences related to the challenges faced the MS in terms of international migration (Figure 1a,c). In this respect, basically, there are two sides, one of migrant sending countries (labor exporting countries) comprising the New Member States (EU-13) and particularly Central and Eastern Europe (CEE) countries, and the other entailing migrant receiving economies, respectively EU-15 Old Member States. Thereby, while CEE countries are confronting with large emigrant flows (a significant part of their labor force, particularly tertiary educated, working outside their borders), most of the developed EU-15 economies have to cope with large migration inflows (both labor immigrants and asylum seekers). The latter host countries, namely EU-10, considered both in absolute (number of immigrants and asylum seekers) and relative (by reporting to their population) terms (according to Eurostat, OECD, and UNHCR official data), are targeted due to the main motivations of the migration decision, with respect to what immigrants are searching in their migration journey, such as improved living standards, higher wages, increased earnings, better working conditions, labor market stability, additional job opportunities, flexibility and security (particularly in the case of the Nordic States, Denmark for example being well known in terms of flexicurity models—the so-called ‘Danish’ model developed by Madsen in 2004 and continuously upgraded in recent literature [22]).
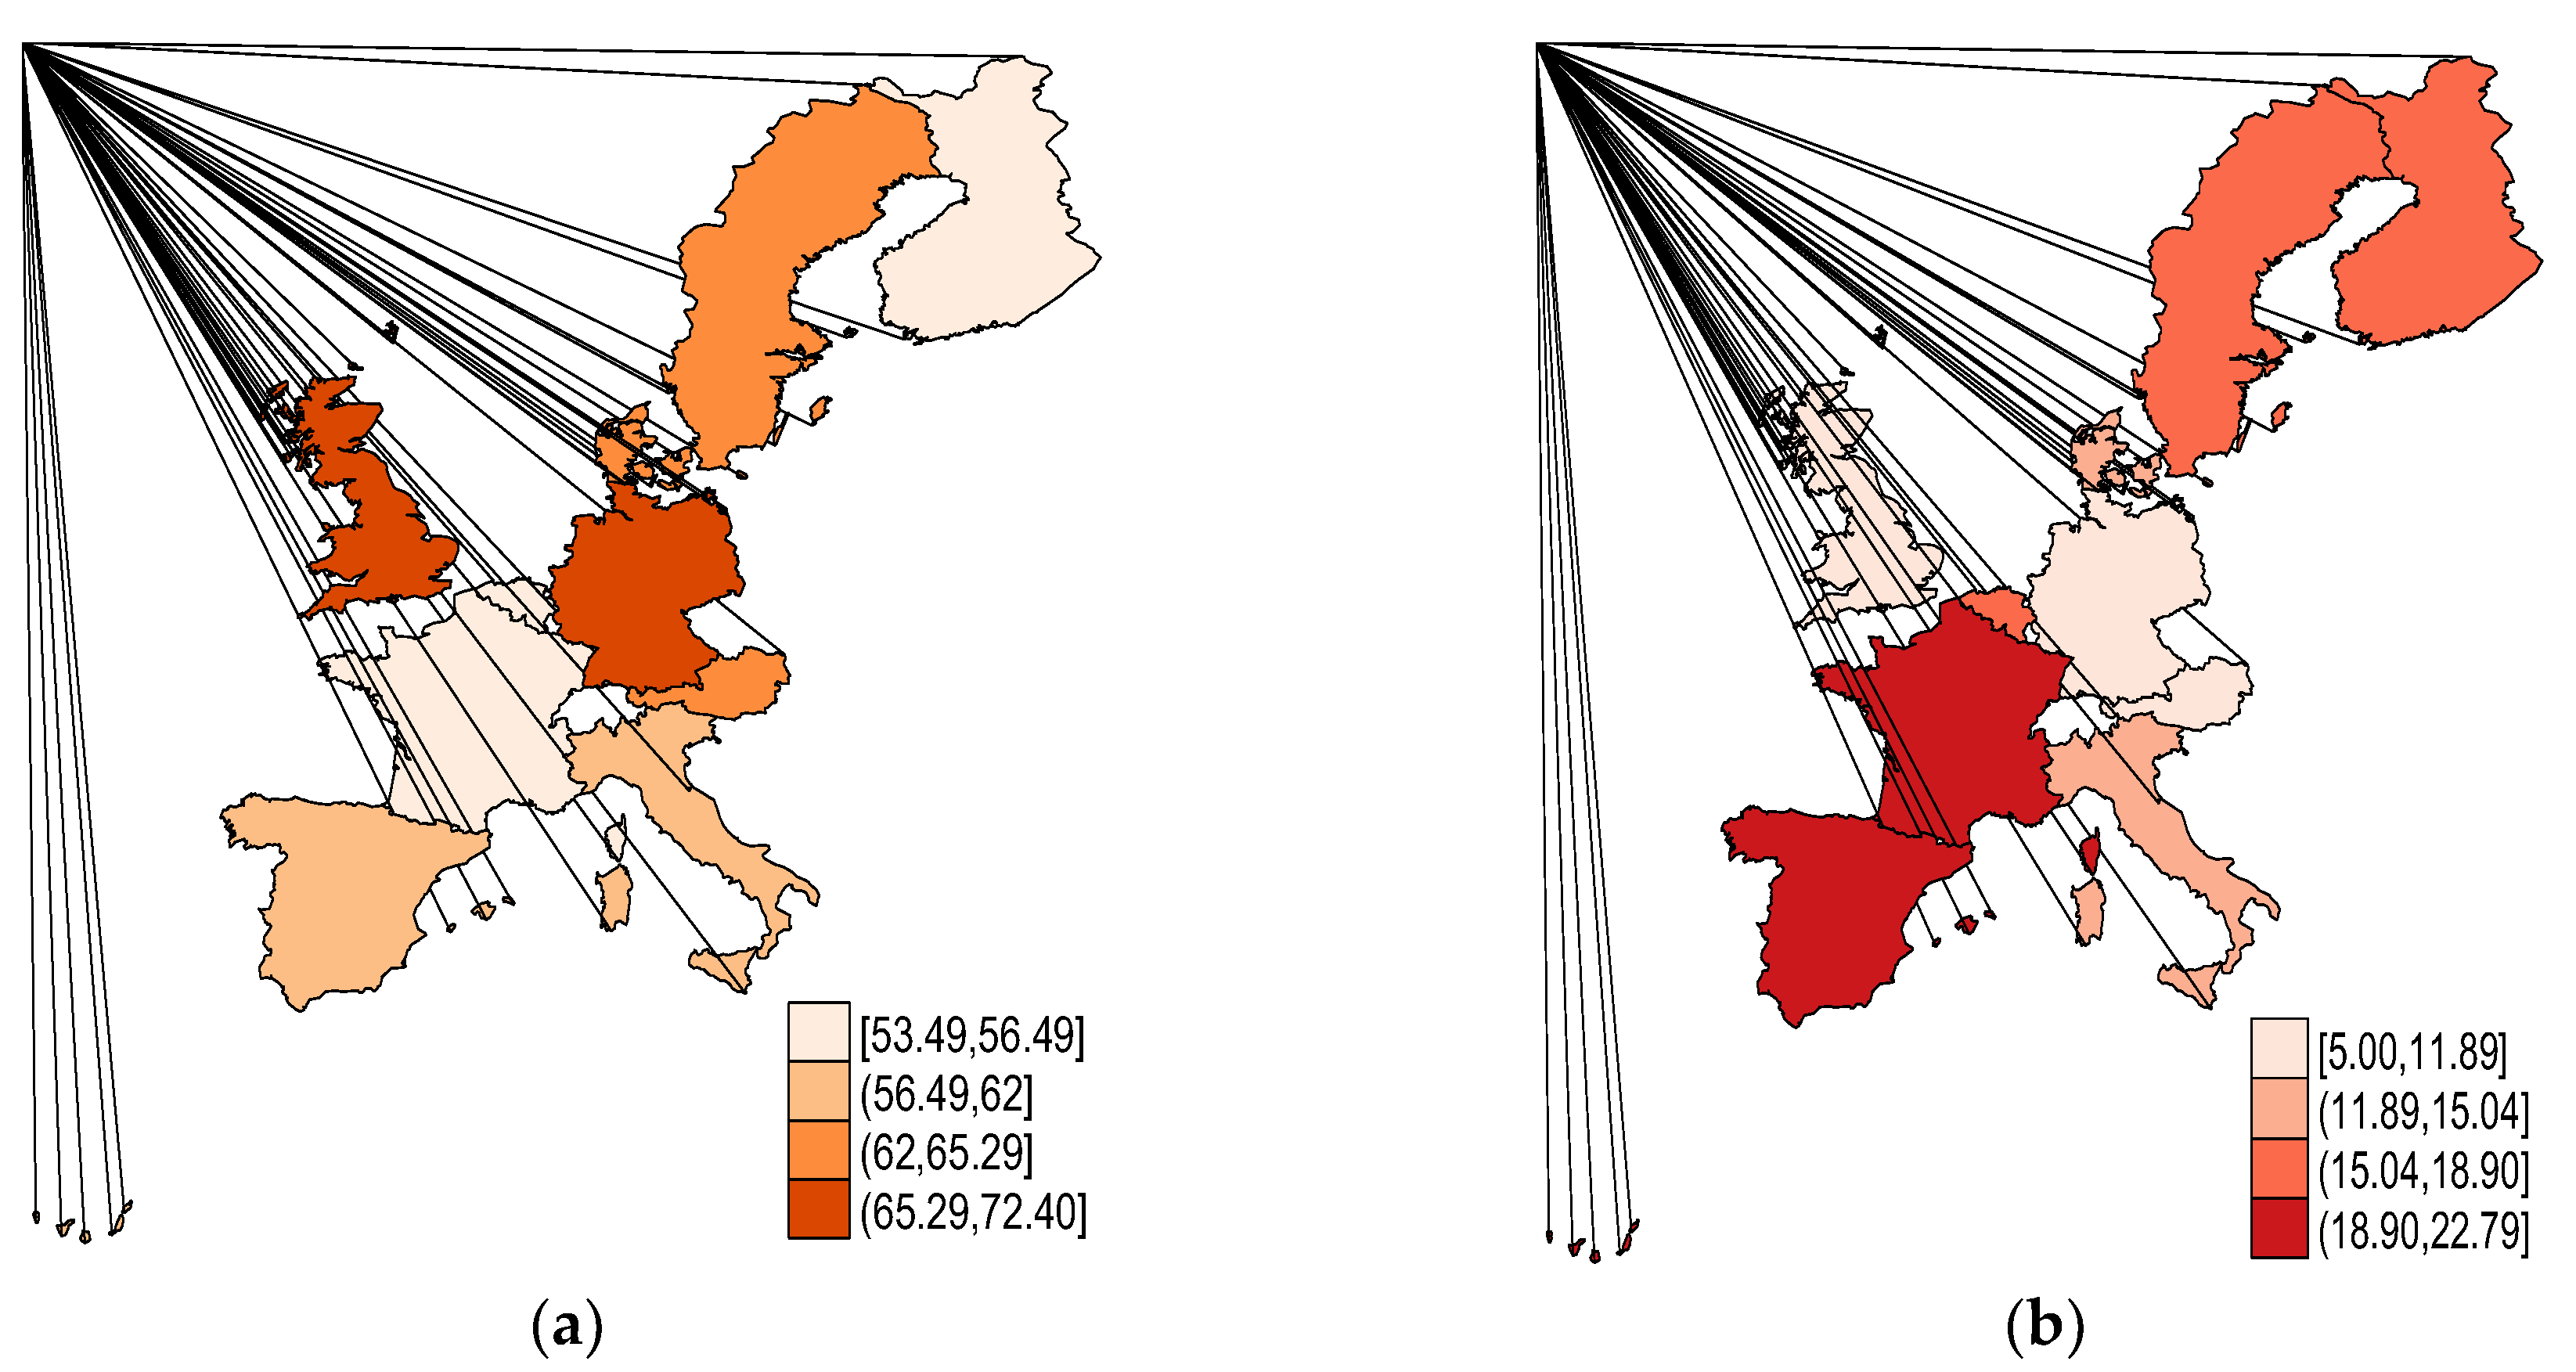
In this framework, the EU-10 host economies face significant challenges to ensure a proper integration of both migration categories into their societies. The challenges are far greater when it comes to the labor market integration of immigrants. In this respect, there are few countries where immigrants are actively involved in host countries’ labor markets (Germany, United Kingdom, Sweden), most economies having difficulties in this respect (France and Finland) (Figure 2a), while others are struggling with both natives and foreign population high unemployment levels (e.g., Spain) (Figure 2b).

Figure 2.
The employment rate for the foreign population in EU-10 (ER_F), 2017 (a). The unemployment rate for the foreign population in EU-10 (UR_F), 2017 (b). Source: authors’ process in Stata, based on [3].
These realities have brought the key factors, policies, strategies of immigrants’ integration to the fore, both national and European policy makers trying to implement accurate measures to cope with increased immigration and asylum seekers inflows, even more in the Brexit context.
According to recent data from European Quality of Life Survey, accomplished by “European Foundation for the Improvement of Living and Working Conditions” (Eurofound) [23], in most developed countries targeted by migrants, living standard satisfaction has increased during the last decade, having a positive dynamic over time, improved living standard at destination being a major determinant of the migration decision and an important credential for migrants’ integration.
In Europe, subjective wellbeing is significantly high in the Nordic states (especially in Sweden and Denmark), as well as in the United Kingdom, Ireland, Netherlands and Austria, but also to some extent in France and Germany (Figure 3a). On the other hand, Central and Eastern European (CEE) countries are characterized by low levels of contentment with the living standard (particularly Bulgaria and the Baltic States) and increased job insecurity [23]. Among CEE countries, in Romania, Poland, and Latvia, the perceived probability to lose the current job in the near future (next six months) is at its highest, thus leading to severe unemployment (Figure 3b). These countries also face increased migration challenges, having the largest emigrant stocks, respectively a large part of the labor force employed abroad, mainly targeting EU-10 host economies.
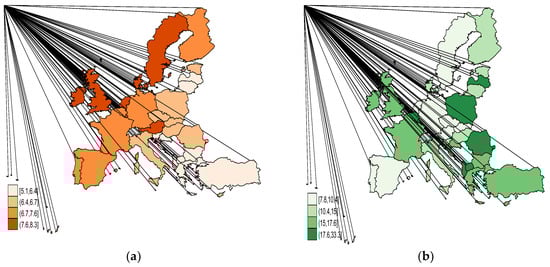
Figure 3.
Subjective well-being—living standard satisfaction in Europe, 2016 (a). Job insecurity in Europe, 2016 (captured based on the answers to the question “How likely is that you might lose your job in the next 6 months”) (b). Source: authors’ process in Stata, based on data of [23].
Providing job search assistance and further supporting job security through well-targeted measures, along with the complementarity between on-the-job training according to the educational backgrounds of migrants and Research & Development support (R&D) represent essential pillars of the integration process, “becoming a relevant condition for industrial countries’ growth rate” [24] (p. 7). All of these credentials are important features of the migrant labor market integration strategies and need to be addressed by the policy makers in Europe. Moreover, in order to support the economic sustainable development, the governments should orient toward “a technology-general training” and to avert “disparities in human capital accumulation” [25] (p. 378).
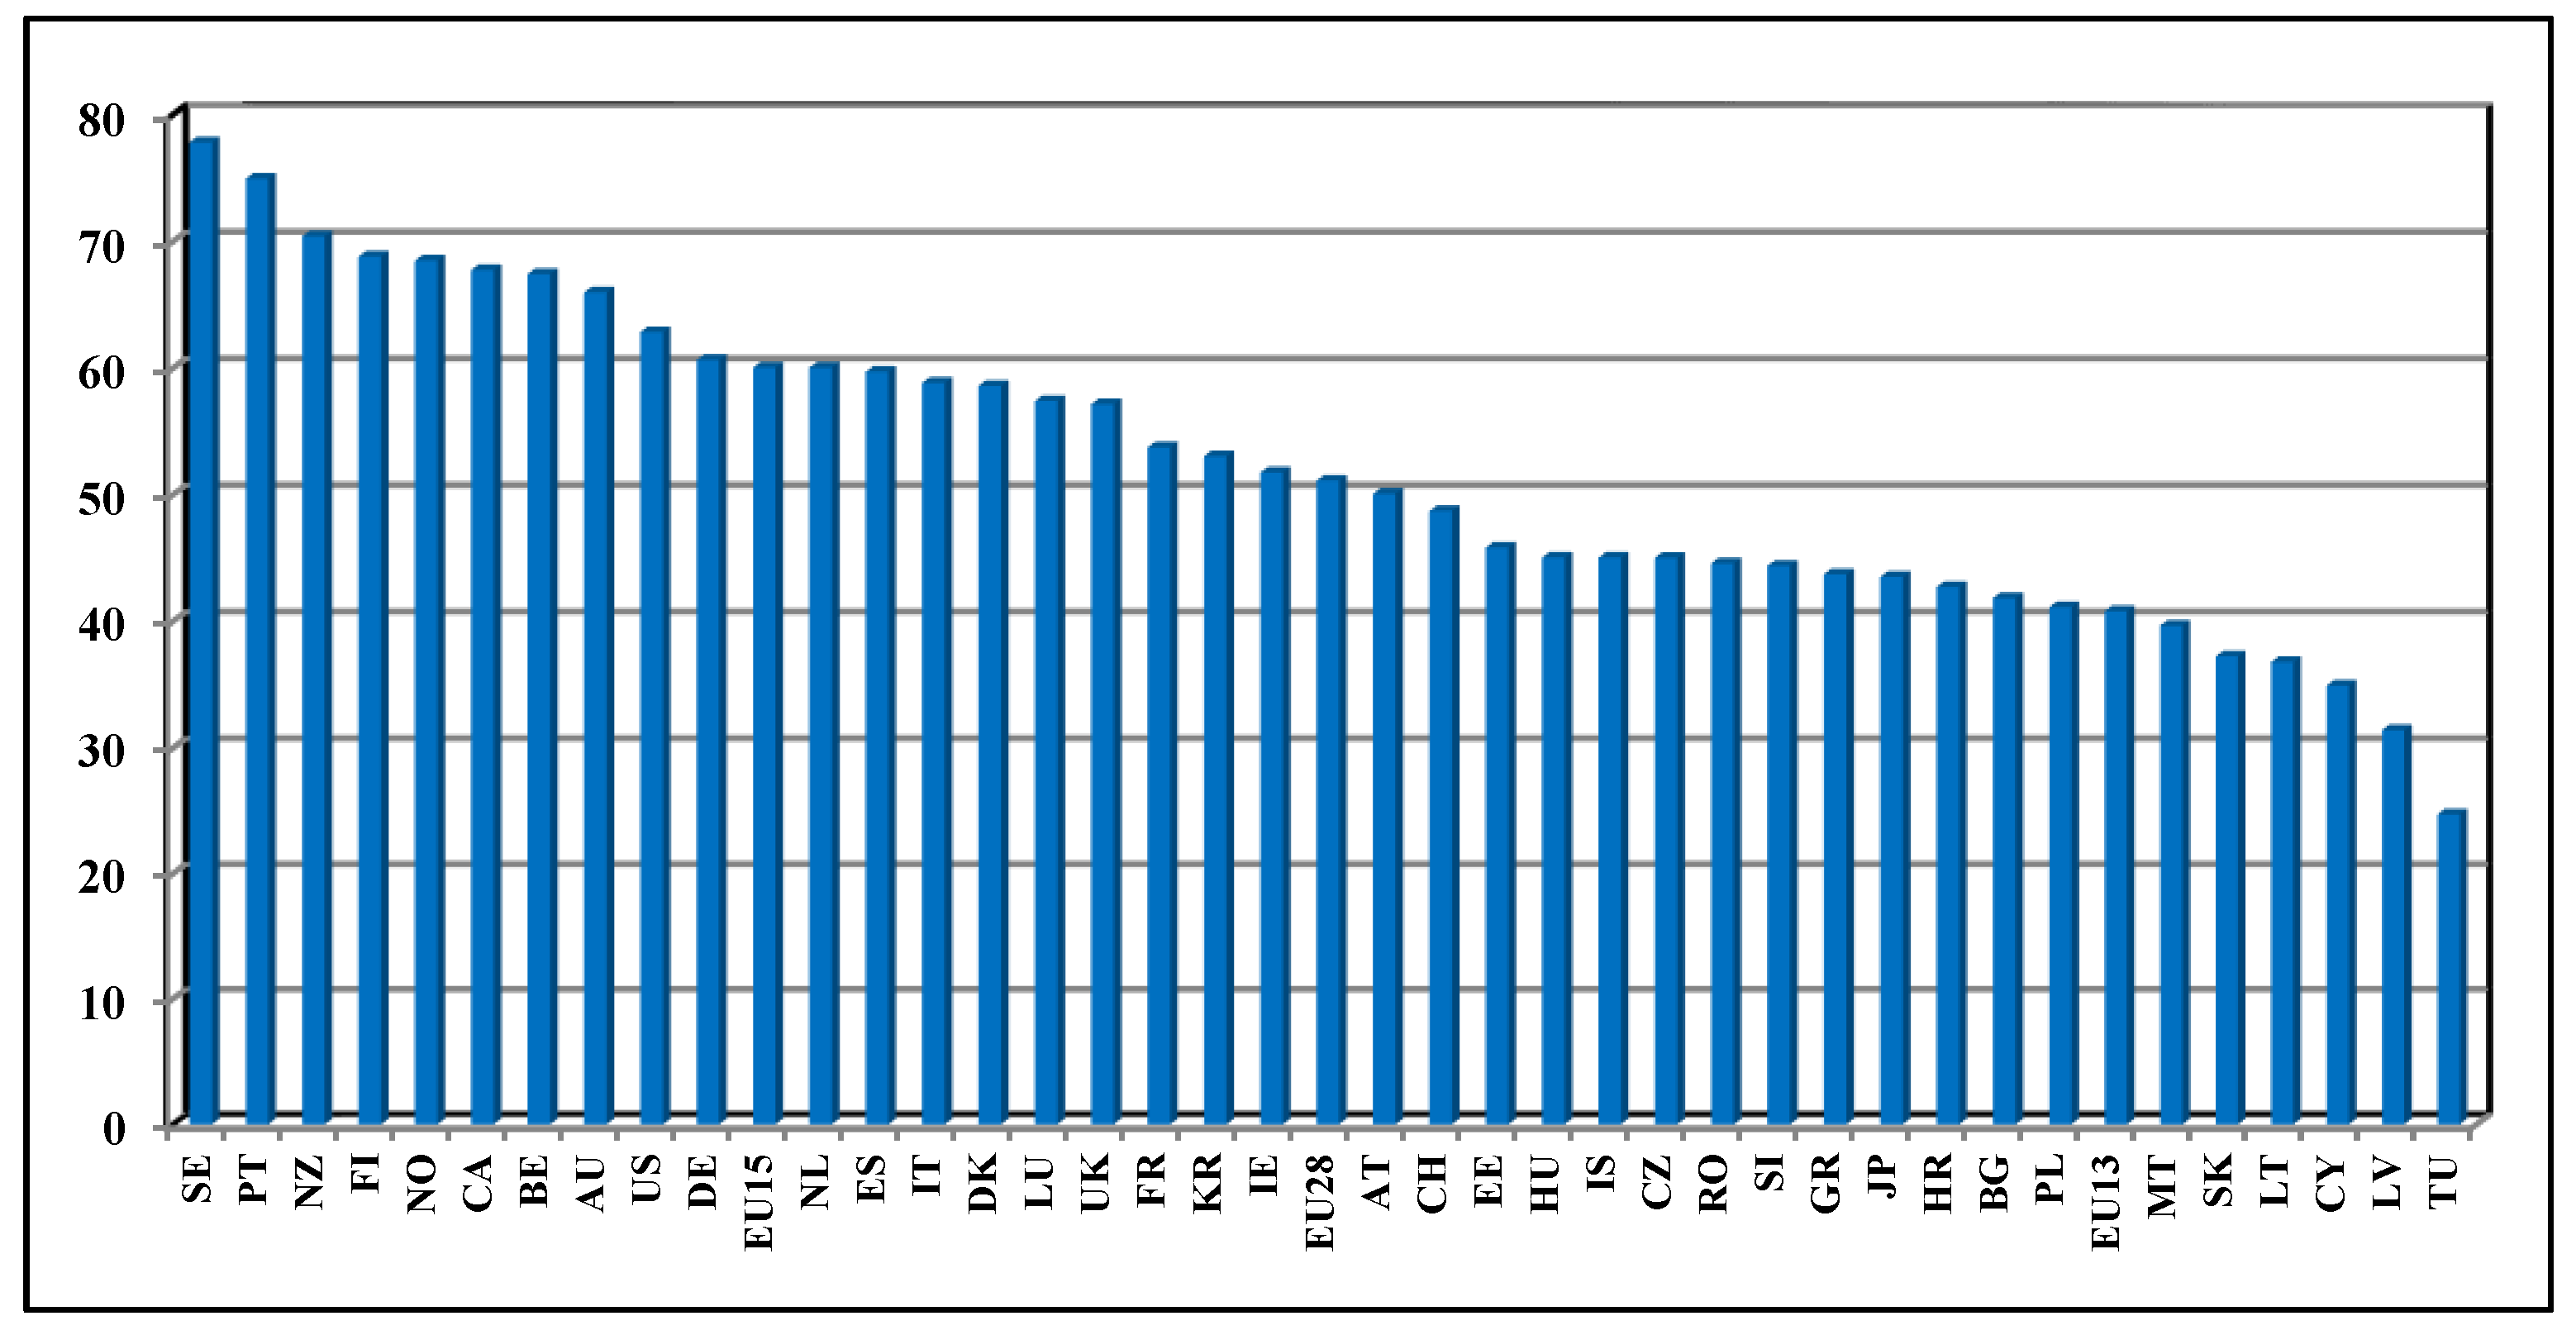
Thus, when the performances achieved in this respect by most of the European countries are accounted (Figure 4), one can notice that Sweden leads the way with the highest overall score on migrant integration policy index (MIPEX) [26], followed by most of the host economies comprised in our analyzed panel.

Figure 4.
Overall score on migrant integration policies in 38 countries, 2015. Source: own process of [26].
However, in terms of labor market integration, progresses still need to be made in most European countries, particularly since after the international economic and financial crisis in 2008 the non-EU citizens’ employment rate (for the persons aged 20–64) significantly decreased (by 6% on average to reach 56.5% in 2014) within the EU, according to the [26] key findings.
By taking into account all these aspects and in line with our general research objective, in the empirical analysis we’ve considered the EU-10 receiving countries, in order to provide consistent empirical evidence for developing better immigration and integration policies. The main statistics of the considered data are summarized into Table A2 (Appendix A).
3.2. Methodology
As we mentioned in the previous section, firstly, in order to defray for data benchmarking between countries, respectively to remove the related differences, we have applied the standardization technique [27]. Thus, by embedding the composite indicators, we can better evaluate the connections between the economic activity, labor market and immigration, as important vectors of the migrant integration strategies, aiming to improve immigrants’ performance and wellbeing in host countries.
Secondly, to assess the proper means of labor market integration of immigrants and asylum seekers into destination economies, we have built up an integrated general model, evolved through spatial analysis (spatial lag—autoregressive and spatial error), the robust regression (RREG) (with Cook’s D, Huber and Biweight iterations), and panel corrected standard errors (PCSE) that allowed us to cope with the endogeneity problem, inherent in migration models [28,29,30].
The general configuration of the model deployed to assess migrants’ labor market integration comprises alternatively both UR_F, and ER_F, as dependent variables, as is presented into Equation (1).
where: β are the regression parameters (coefficients), i = 1, …, m, t is the number of observed time periods.
The general macroeconometric model is afterwards reconfigured through spatial analysis procedures in line with spatial lag and error models (Equations (2a) and (2b)) [29] that were assessed through the maximum likelihood method (MLE).
Spatial lag models:
Spatial error models:
where: W is the inverse distance weights matrix (row-standardized); y represents the dependent variable; X is the explanatory (independent) variables; λ and ρ are scalars, which estimate the dependence of yi on nearby y and the spatial correlation in the errors; u represents the error term (spatially correlated residuals); ʋ captures independent and identically distributed disturbances.
The spatial autocorrelation is verified through Patrick Moran (Moran’s I) test [29].
For providing substantial estimates, we’ve also used bootstrap sampling and assessment on spatial models, whereas this “allows assigning measures of accuracy (defined in terms of bias, variance, confidence intervals, prediction error or some other such measure) to sample estimates” [29].
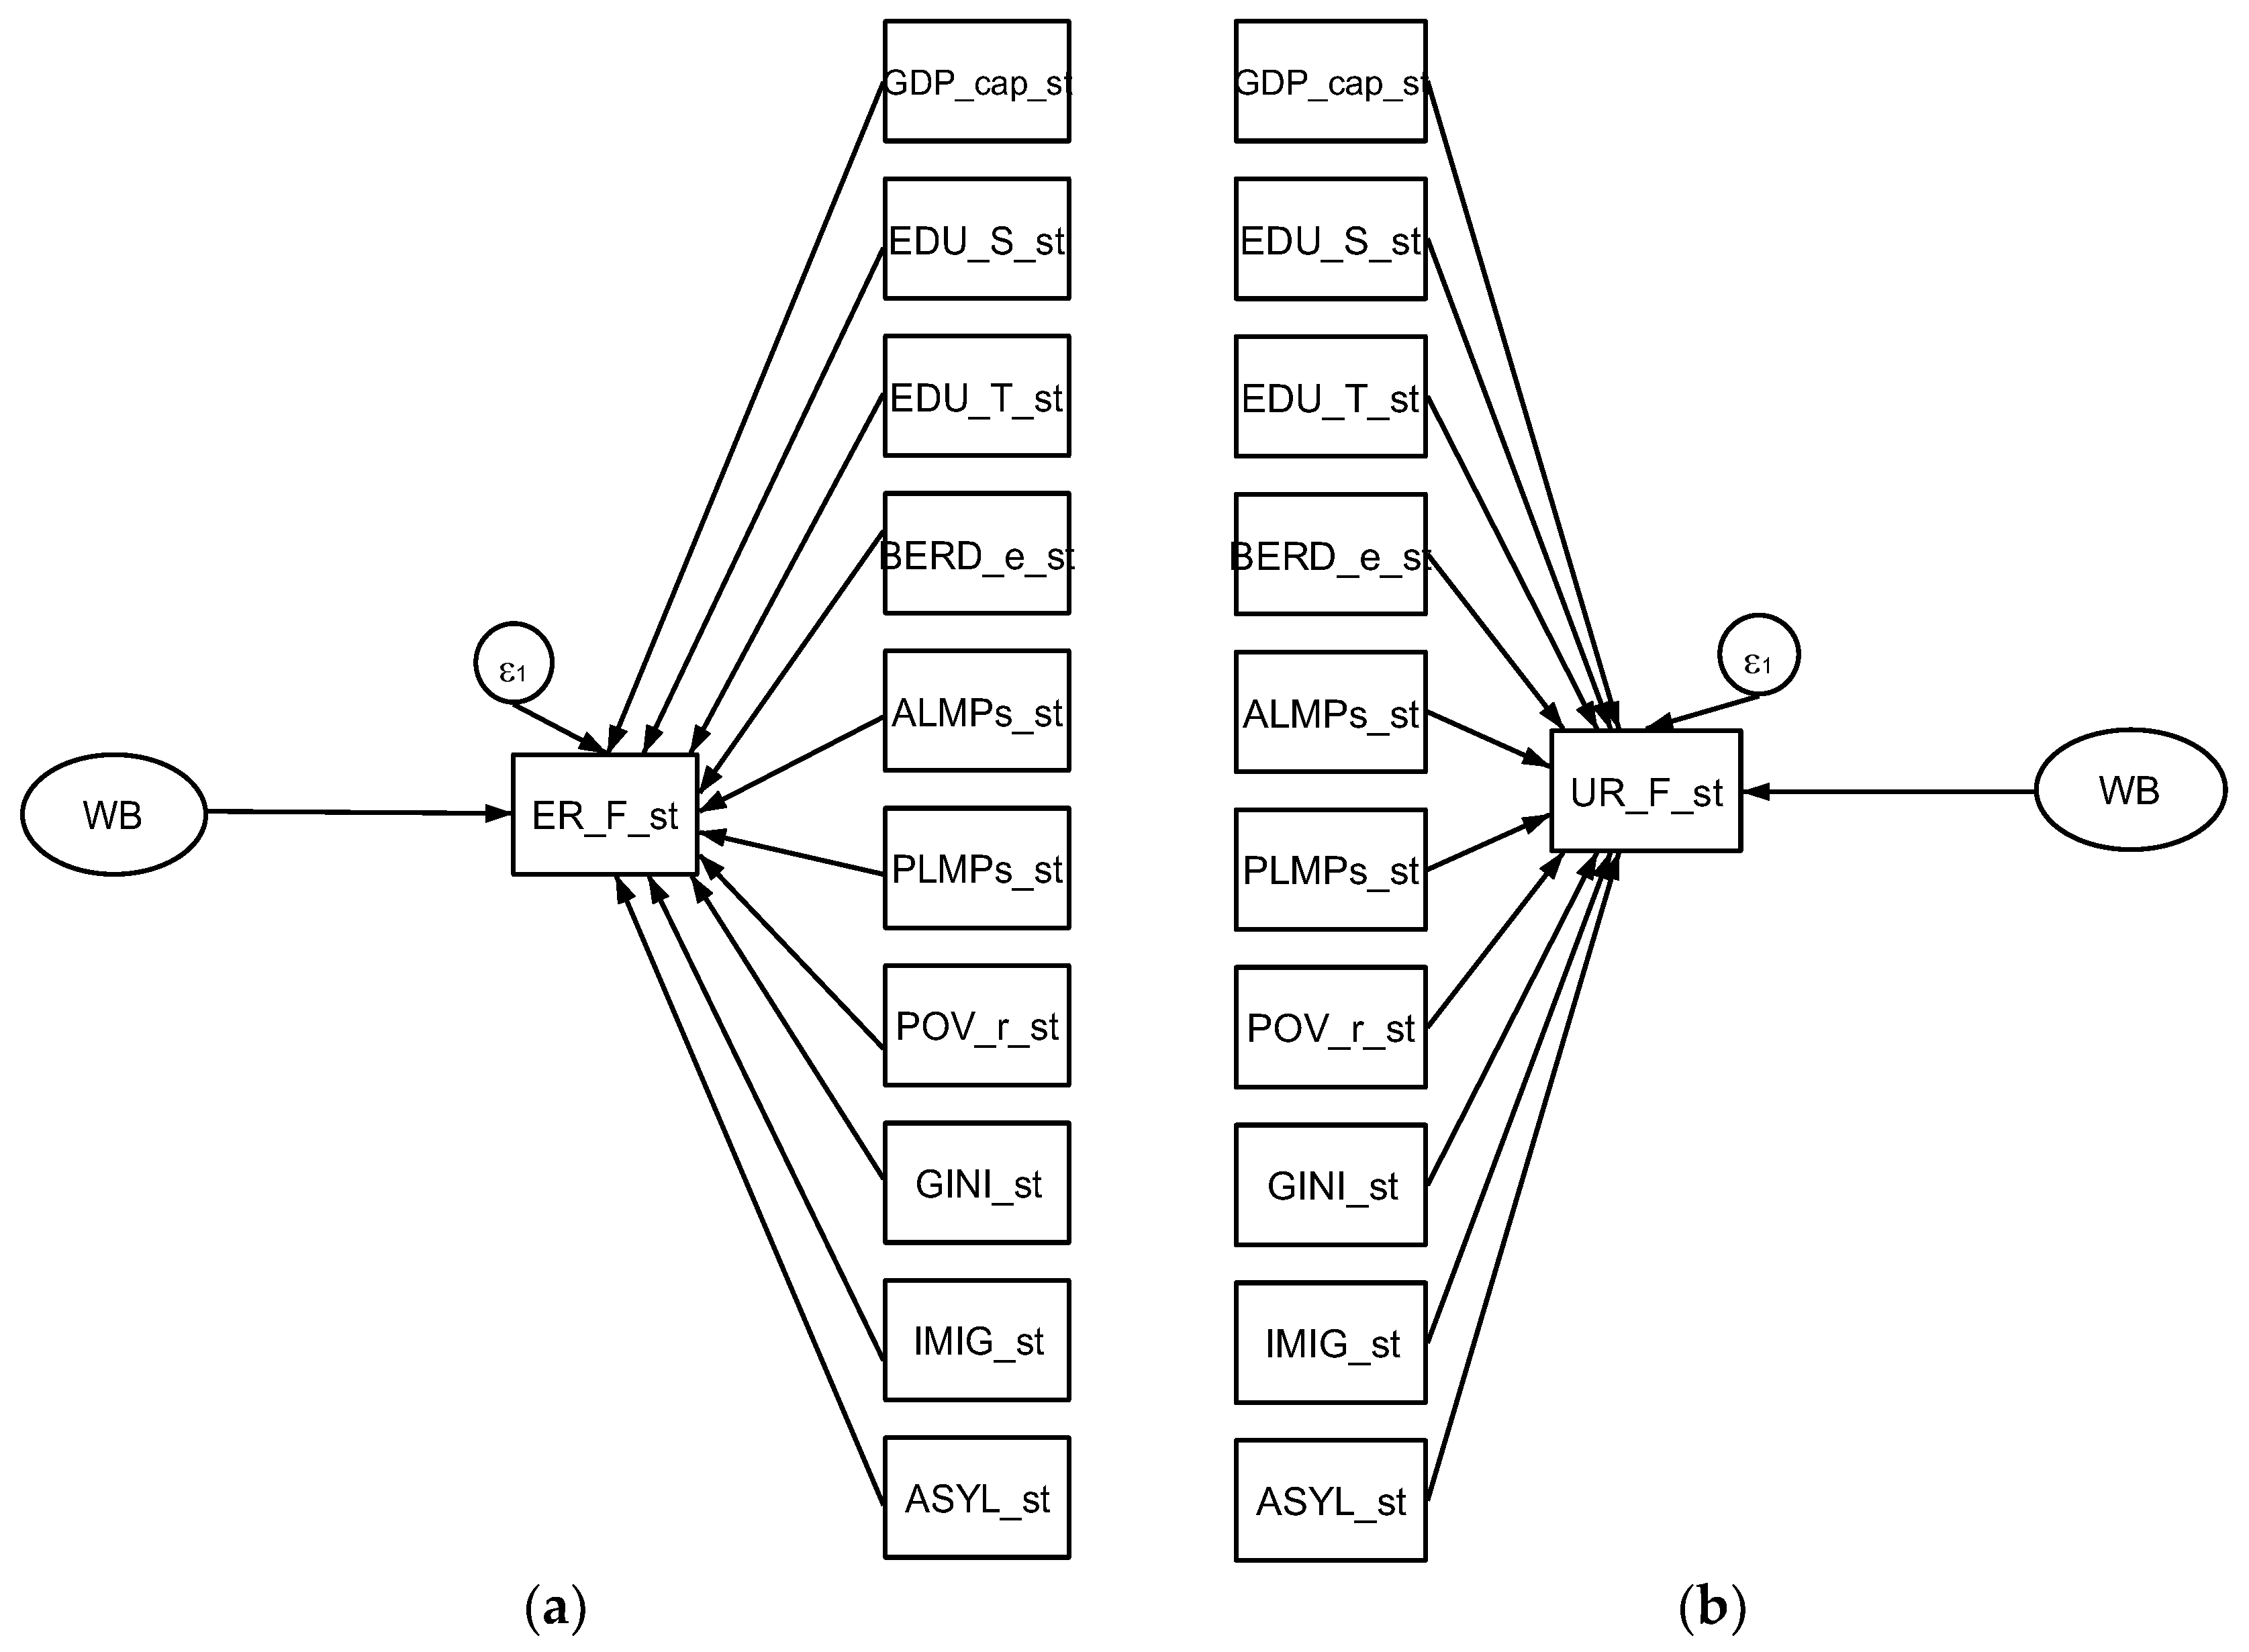
Moreover, in the next stage of the research, SEM (Structural Equations Modeling) models were applied to ensure a proper validity of the estimations performed both for UR_F (Figure 5a), and ER_F (Figure 5b), and reinforce the spatial and macro-econometric results.
Figure 5.
General SEM model configured for analyzing migrants’ labor market integration, in terms of the employment rate of foreign population (a), and unemployment rate of foreign population (b) variables. Source: authors’ research.
Structural equations modeling is a widely used multivariate confirmatory technique, rather than exploratory, being therefore more suitable to establish and assess the validity and reliability of the model.
Finally, to account for the interdependencies between multiple explanatory factors of migrants’ labor market integration in EU-10 host economies, we’ve also considered regressions induced by Gaussian Graphical Models (GGMs), thus grasping the advantages given by covariance structures [31,32].
Based on literature underpinnings and methodological credentials, the main research hypotheses followed within our empirical endeavor are:
Hypothesis 1 (H1).
A dditional labor immigrant flows have positive influences on the labor market performance of the foreign population already residing in the EU-10 countries, while the asylum seekers are not very concluding in impacting the labor market host countries.
Hypothesis 2 (H2).
There is a positive direct relationship between migrants’ labor market performance and the active and passive labor market policies implemented by host economies.
Hypothesis 3 (H3).
The educational background, research-development-innovation activities and support have a positive impact on migrants’ labor market integration.
Hypothesis 4 (H4).
Income inequalities, poverty risk and welfare uncertainties have a negative impact on migrants’ labor market integration.
4. Results and Discussion
4.1. Spatial Analysis
Based on our data, firstly, we have processed several macro–econometric models to attain the distinctive ways of migrants’ integrating into the EU-10 labor markets, accomplished by rising the employment rate (ER_F), and, respectively, downsizing the unemployment rate of the foreign population (UR_F), as dependent variables of developed models. Along with IMIG and ASYL (migration indicators), we have used as independent variables GDP_cap, EDU_S, EDU_T, BERD, ALMPs, PLMPs, POV_R, and GINI coefficients (Table 1 and Table 2).

Table 1.
Estimation results performed on complete timespan (sample) 2000–2017—total number of immigrants and asylum seekers (UR_F as dependent variable).
Table 2.
Estimation results performed on complete timespan (sample) 2000–2017—total number of immigrants and asylum seekers (ER_F as dependent variable).
For all estimation procedures (models 1–6 within Table 1 and Table 2), a special consideration was granted to robustness check and validation in order to attain valid results. Thus, we have performed distinctive tests presented at the end of Table 1 and Table 2 (Rho, Sigma, Lambda, parameters test, Lagrange Multiplier—LM, Wald test, Moran’s I test). We have also applied robust regression (RREG) (model 5) and panel corrected standard errors (PCSE) (model 6), to verify the endogeneity and heteroscedasticity problem, which offered substantial estimates. Furthermore, RREG conceded us to secure robustness, because some results might be completely led up by wider economies (e.g., Germany, France). To overcome these concerns, robust regression processes firstly Ordinary Least Squares (OLS), extracts Cook’s distance for each observation afterwards, being based on Huber and Biweight iterations, and as a result, the most dominant points are dropped. At the same time, focusing on the core research objectives, there was a substantial interest to outline distinctive ways of migrant labor market integration and related policies implemented by each country of the EU−10, as well as by the outputs accomplished by spatial spillover effects (neighbors and their dynamics over time).
Thus, we have applied spatial analysis, lag and error models, robust and bootstrap (models 1–4 in Table 1 and Table 2). The spatial lag model checks for spatial autocorrelation in the dependent variable (ER_F, UR_F) and includes employment (unemployment) for the foreign population in neighboring locations as an additional independent variable. The spatial error model is liable to be more robust whereas it “captures spatial dependence more fully, beyond that which can be attributed to the dependent variables in neighboring units” [33]. LM tests are significant for the whole panel (2000−2017), which denote the presence of spatial dependence. Rho is essential for capturing spatial dependence intrinsic in the sample data, measuring the average influence on observations by their neighboring observations. Lambda entails the coefficient on the spatially correlated errors. Both rho and lambda are positive and statistically significant for the complete panel in spatial lag and error models (simple and bootstrap), thus reflecting a positive autoregressive influence of explanatory variable on labor market output of the foreign population. Moreover, the Moran’s I test results show a positive overall spatial autocorrelation. Consequently, the migrant labor market integration performances fulfilled by the neighboring locations are also fundamental for influencing host economies. High values for LM and especially Wald tests, as well as of the R–squared are important measures of model correct specification and robustness. The estimated coefficients for all six models applied (Table 1) have a high degree of statistical significance, are slightly distinctive as value, but they have not modified their sign across the models, in the presence of statistical significance.
The results obtained (Table 1 and Table 2) entail that additional immigrant flows (IMIG) tend to have positive effects on the labor market performance of the foreign population already residing in the EU-10, and determine a significant decrease in their unemployment rates (Table 1), respectively an important increase in employment rates (Table 2), while the asylum seekers (ASYL) are not statistically significant, having a much smaller positive impact, only in terms of the unemployment rate (Table 1). Thus, H1 is confirmed. Nevertheless, significant positive influences grasped by a decrease in the unemployment rate (and increases in the employment rate) of the foreign population are given by the active labor market policies (ALMPs), jointly with an improvement of the educational background towards secondary education (EDU_S). These results are in line with Aceleanu et al. [34], Dima and Meghișan-Toma [35], and Suciu and Lăcătuş [36] who underline also the role of education (especially gaining the soft skills) and active labor market policies in reducing the unemployment rate. Therefore, educational strategies are essential for migrants’ integration, since an increase in secondary educational attainment (EDU_S) determine lower unemployment rates among foreign population in the EU-10 host economies, thus enforcing the migrant selection process, as stated by Konle-Seidl and Bolits [1]. Contrary to the expectations, the passive labor market policies (PLMPs) (facilities for the unemployment benefits, and the advanced retirement of persons with low chance in finding work), and research-development-innovation activities and support (BERD) acted as a restraint for labor market participation, as reflected by significant upturns in unemployment, respectively decline in the employment rates of the foreign population residing in EU-10. Furthermore, the estimated parameters also disclose that the tertiary education (EDU_T) does not support the migrants’ integration into host countries, issue stated also by Kogan [13], who proved that a higher migrants’ educational level would lead to significant difficulties in their integration on the labor market in Germany. Therefore, H2 and H3 are partially fulfilled. These results point out the need for a reconfiguration of the passive labor market policies, governmental support granted to research and development activities deployed within the business sector, and tertiary education strategies, especially for specific skills and competences recognition among foreign population.
Welfare increases (GDP_cap) within host economies positively reverberate on migrants’ labor market performance, by downsizing their unemployment rate (Table 1), and increasing the employment rate (Table 2). On the opposite side, an increase in income inequalities (GINI) has negative impacts on migrant labor market integration, entailed by an upward in the UR_F (Table 1), along with poverty rate (POV_R) increases, which has induced a downward in the ER_F (Table 2). Thus, H4 is confirmed.
4.2. SEM Models
We’ve continued the research endeavor by developing and processing additional SEM models for each dependent variable, UR_F (Table 3, model 1) and ER_F (Table 3, model 2), aimed to bring additional evidence to support previous results and grasp key factors of migrants’ labor market performance/integration.
Table 3.
Estimation results performed on complete timespan (sample) 2000–2017—SEM (Structural Equations Modeling).
SEM models have been subject to a series of goodness-of-fit tests, Wald tests for each equation, Cronbach’s Alpha calculations for scale reliability. The results obtained point to a high level of robustness and are detailed in the appendices (Table A3, Table A4 and Table A5, Appendix A).
SEM estimations reconfirm and support previous results and lead to the same conclusions (Table 3) related to the major favorable importance of labor immigration (IMIG) (H1 is reconfirmed), secondary education (EDU_S), and new tailored active labor market policies (ALMPs) both for unemployment and employment rates among foreign population (UR_F, ER_F). Opposite, the tertiary education (EDU_T), the governmental support granted in this respect for an adequate labor market integration of migrants in EU-10 (BERD), passive labor market policies (PLMPs), and the asylum seekers additional inflows (ASYL) don’t have positive impacts on labor market performance into EU-10 host economies. H2 and H3 are thus reconfirmed and partially fulfilled. Also, income inequalities (GINI) determined a rise of UR_F (Table 3, model 1), poverty risk (POV_R) had a negative impact on ER_F (Table 3, model 2), and welfare support (GDP_cap) has improved the migrants’ labor market performance both in terms of the UR_F, and ER_F (Table 3, models 1 and 2), H4 being reconfirmed and fulfilled.
4.3. Network Analysis
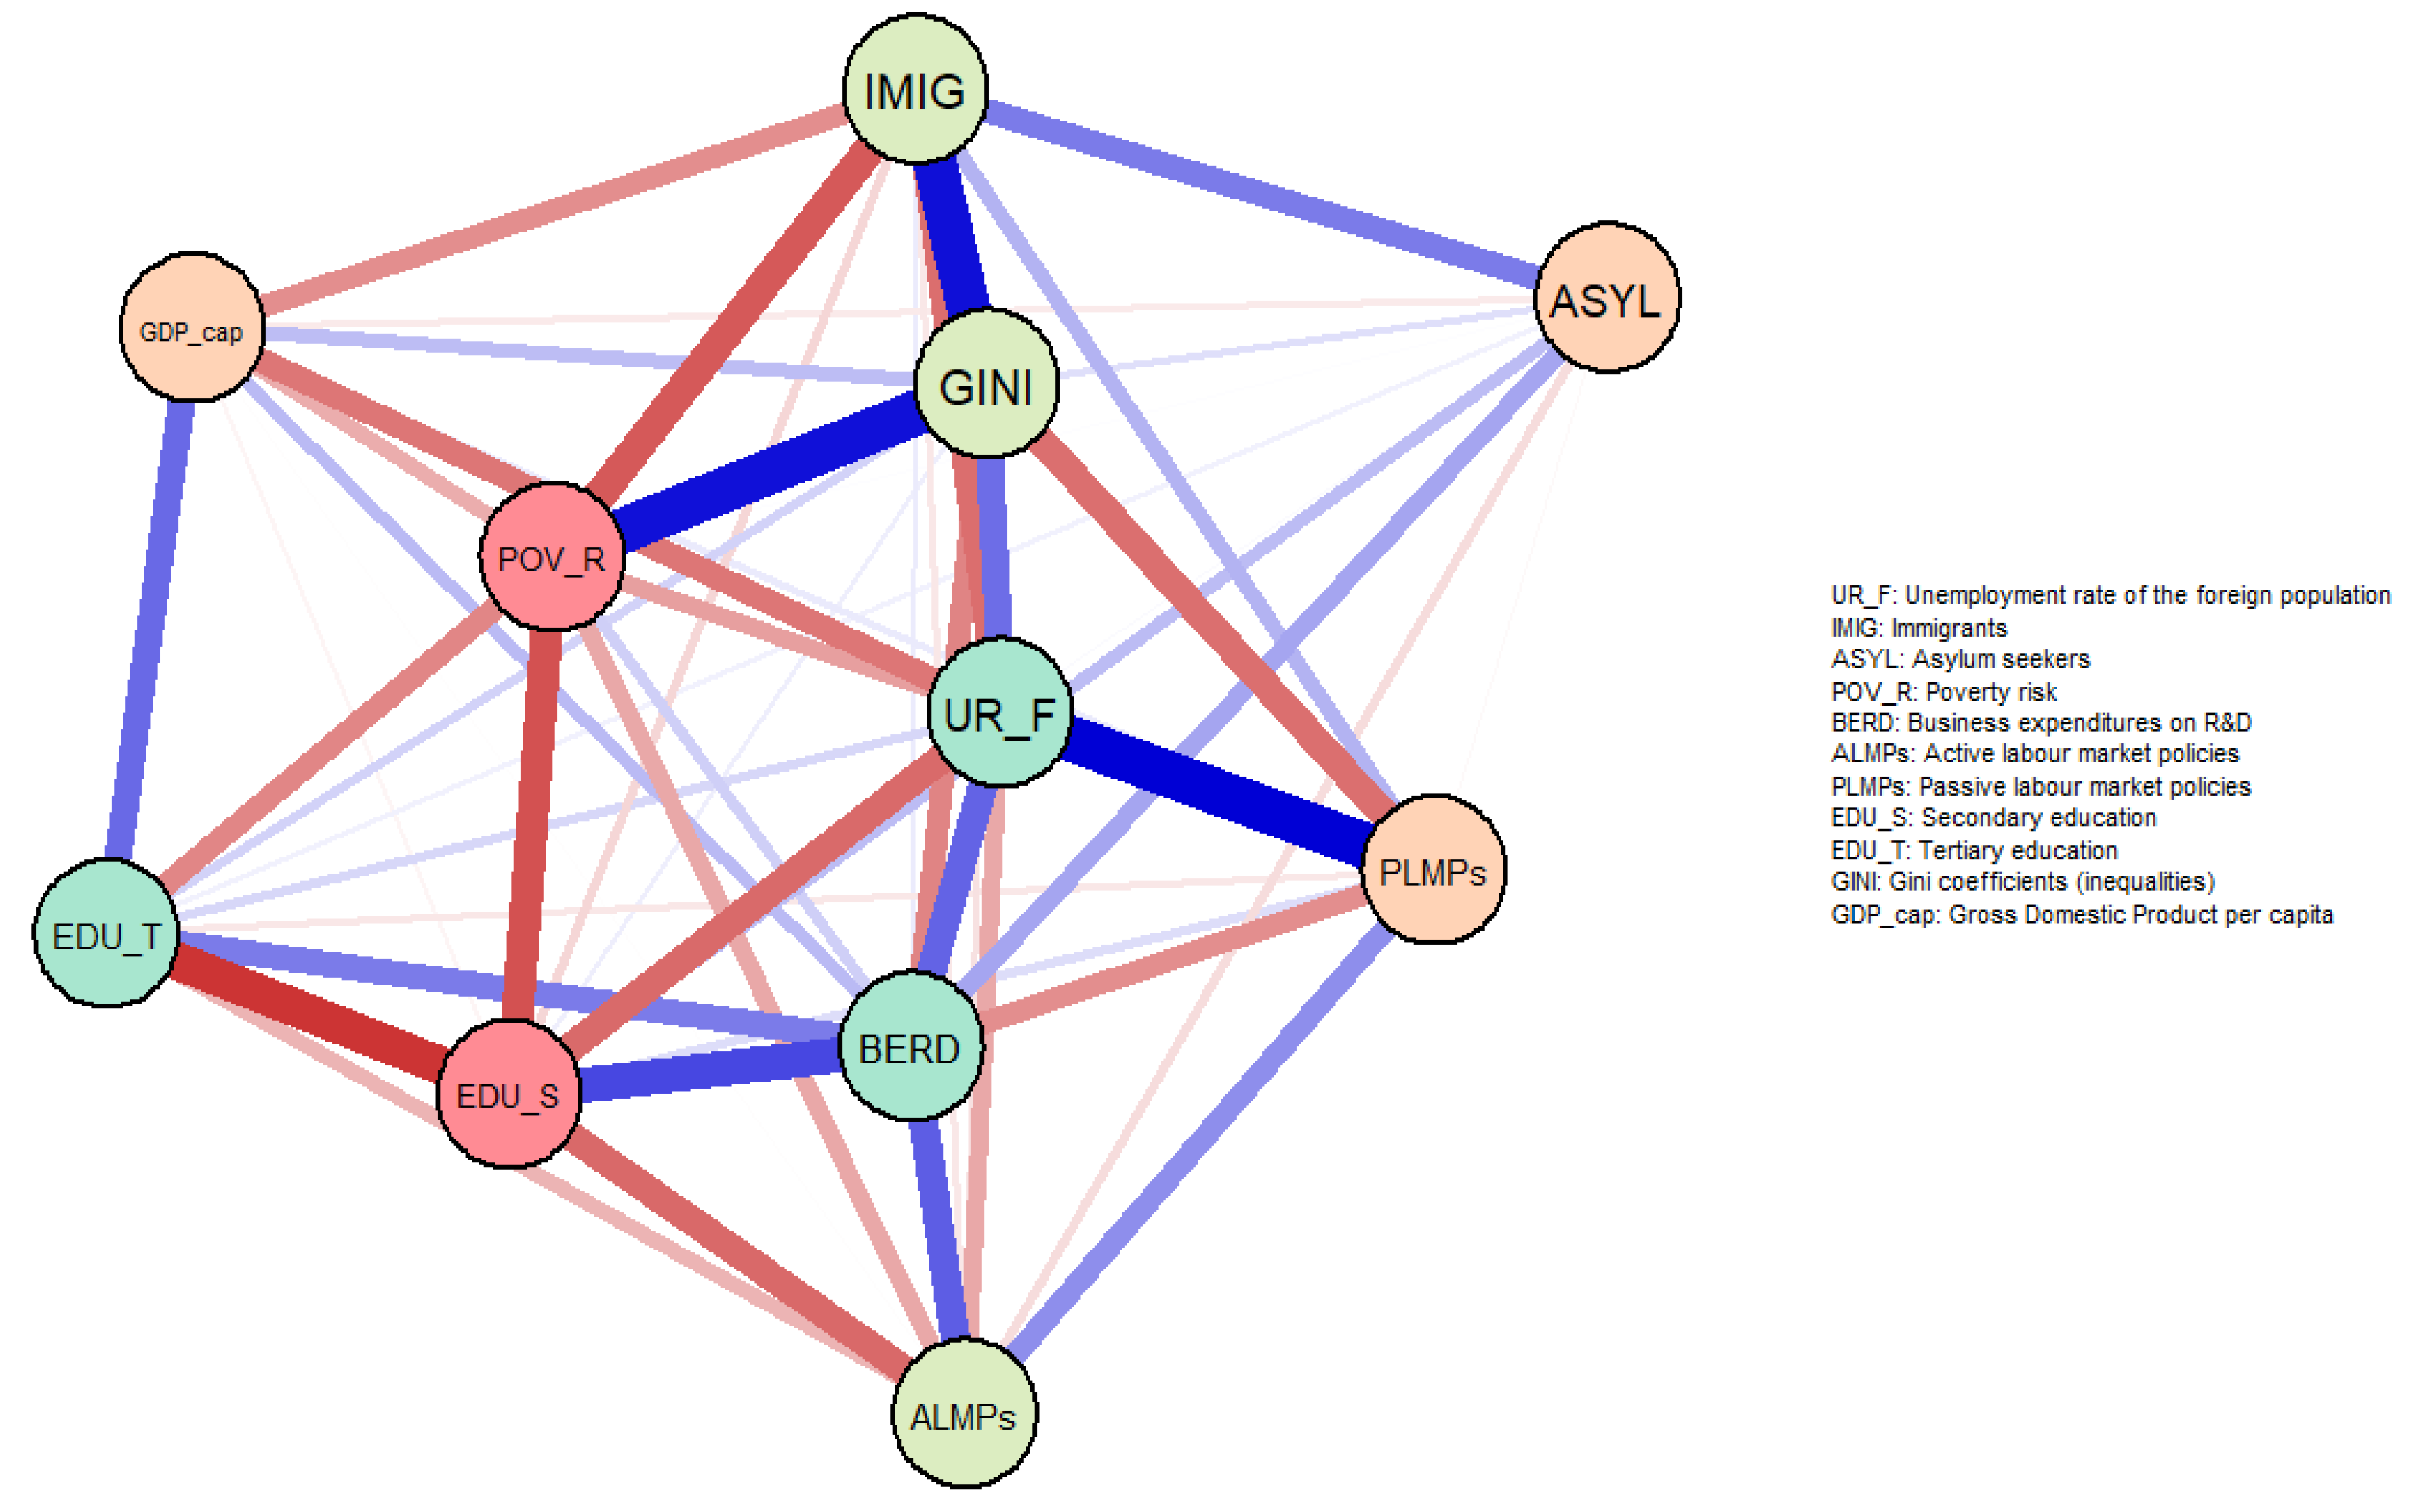
Gaussian Graphical Models (GGMs) entail the advantages given by covariance structures [31,32,37] and complete our SEM models, since the graphical models can be seen as “structural or simultaneous equations models (SEMs) and can involve any combination of discrete, continuous or categorical variables” [32] (p. 2), [38], but compared to SEM “a key advantage of the GGM approach is that model uncertainty can be easily incorporated into the framework” [32] (p. 3). This new approach based on graphical models holds the advantage of relaxing the strict conditional independence constraints denoted by the linear regression models and thus distinctly captures the complex dependency patterns that prevail between the determinants/key factors of migrants’ and asylum seekers’ integration on the European labor market.
The two GGMs developed within our research (Figure 6 and Figure 7) were finally applied by taking into account one of their essential features that allowed us to differentiate between the factors directly affecting immigrants’ labor market integration and the other factors that have an indirect impact by influencing other covariates.
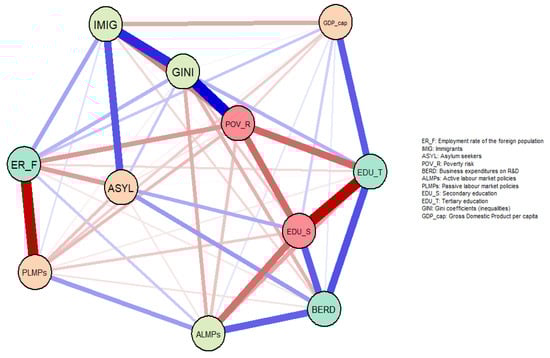
Figure 6.
GGMs (Gaussian Graphical Models)—Extended Bayesian Information Criterion (EBIC) and Least Absolute Shrinkage and Selection Operator (LASSO)/Partial correlation—for EU-10 in case of the employment rate of foreign population (ER_F), 2000–2017. Source: authors’ processing.
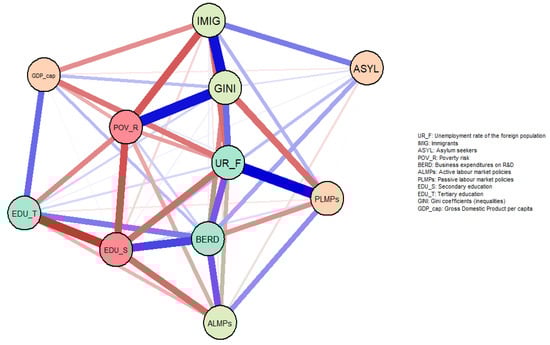
Figure 7.
GGMs (Gaussian Graphical Models)—Extended Bayesian Information Criterion (EBIC) and Least Absolute Shrinkage and Selection Operator (LASSO)/Partial correlation—for EU-10 in case of the unemployment rate of foreign population (UR_F), 2000–2017. Source: authors’ processing.
By analyzing the two regularized GGMs, developed to capture the most important factors influencing migrants’ labor market performance and integration, measured separately in terms of employment (ER_F) (Figure 6), respectively unemployment of the foreign population (UR_F) (Figure 7) residing in EU-10 host economies, we have observed that the inflows of immigrants and asylum seekers tend to rather be attracted by employment opportunities (ER_F), the living standards and economic welfare at destination (GDP_cap), and income inequalities among countries (GINI) with spillover effects on both UR_F and ER_F. These results bring additional evidence to support H1.
Furthermore, in line with our second research hypothesis (H2), network analysis reveals that the strongest connections and interdependencies are established directly with the passive labor market policies (PLMPs), both for ER_F and UR_F. In this respect, PLMPs have a direct impact on migrants’ labor market performance, even though it is a negative one as attested by our previous spatial and SEM results, since increased PLMPs act like a disincentive for an active participation of migrants’ on the European labor market, reducing ER_F and increasing UR_F. Hence, the passive policies need to be redesigned and tailored since their impact is proved to be essential, but in their current configuration PLMPs confine migrant’s labor market integration and associated performance.
If we consider the ER_F network GGM (Figure 6), we can grasp the peripheral position of ER_F compared to the centrality of UR_F (Figure 7), respectively the direct linkages of ER_F with PLMPs, IMIG and ASYL (H1 and H2). The same strong relation is revealed between IMIG-ASYL and GINI, POV_R, GDP_cap (H4), while the education–research–innovation coordinates (EDU_T, EDU_S, BERD) and ALMPs (which also comprises training and lifelong learning programs) are placed on the opposite side with ER_F. Thus, it can be stated that even though these latter coordinates are important, they need to be rebuilt in order to support long-term sustainability of immigrants’ labor market performance, by ensuring a proper insertion and increased job security.
Moreover, on these lines, when we’ve considered the GGM for UR_F (Figure 7), we have noticed the centrality of UR_F among the key credentials accounted to capture the essentials of migrants’ labor market integration. Hence, direct linkages are also established between UR_F and BERD, EDU_S (revealing the importance of the educational background, education and training programs, research and development activities and support in lowering UR_F) (re-entailing H3), respectively UR_F and GINI, POV_R (which grasps the importance of addressing inequalities and poverty risk in providing a proper labor market insertion of immigrants and thus ease their migration journey, aspects also showed by the interlinkages between IMIG-ASYL and GDP_cap, GINI, POV_R) (re-emphasis of H4).
5. Concluding Remarks
The present empirical analysis applied several methods (spatial analysis, bootstrap estimations, SEM, and GGM techniques) to capture adequate ways for a positive labor market performance and integration of migrants (assessed by a decrease in unemployment rates of the foreign population, respectively by an upward in employment rates of the foreign population). For capturing the immigration process, we have distinctly analyzed the economic migration (immigration flows looking for a better work conditions) and humanitarian migration (asylum seekers/refugees), as Clark et al. [5] recommended. They considered more conclusive the “special route” analysis of migration process, for further research, through economic and humanitarian migration.
We’ve applied, mainly, spatial analysis and associated models, since regional and local degrees of migrant integration and associated performances of neighboring locations matter essentially in the strategies that need to be adopted by policy makers worldwide. Local authorities also have a key role on migrants’ integration into their new communities, therefore cities, regions, countries can select best practices and learn from each other, hence grasping better evidence for designing new migrant integration policies [39]. Moreover, the “idea of an intra-European migration system with identifiable geographical structure that persists across space and time” [37] (p. 23), with strong interdependencies between economic factors, socio-cultural features and associated policies, tends to take extensive shape in the literature, being supported also by our spatial and network results.
In this complex endeavor, we highlighted that additional labor immigrant flows have positive effects on the labor market performance of the foreign population already residing in the considered destination countries, while the asylum seekers/refugees are not very concluding in impacting the labor market host countries (H1 confirmed). In this regard, there is a keen need to develop specific and distinctive policies for labor migrants and asylum seekers/refugees, the support granted for migrants and long-term oriented in order to contribute to their labor market performance, as Van Wolleghem [4] recommended. For the humanitarian migration, there is a specific commitment for assisting asylum seekers and refugees to integrate on the labor market, as Hooper et al. [15] and Petracou et al. [16] appreciated.
Furthermore, in order to find the most important features that encourage/discourage the migrants’ labor market integration into host economies, we have analyzed the following aspects: (i) the favorable implications of active and passive labor market policies, assessed by H2, which was partially fulfilled, since passive labor market policies didn’t react as an incentive for a better inclusion of migrants on the EU-10 host countries’ labor markets, generating an adverse effect, even though they have strong direct implications as shown by the GGM models (centrality on UR_F and periphery on ER_F); (ii) the positive enhancement of the educational background and research-development-innovation support, appreciated through H3, which was also partially fulfilled, due to the negative influence from the tertiary education and inappropriate governmental support granted for the labor market integration of migrants in EU-10; and (iii) a negative impact deriving from the income inequalities among countries, poverty risk and welfare uncertainties, evaluated by H4, which was totally confirmed.
In line with these results, we highlight several important strategies for a better labor market integration of immigrants into host societies/labor markets, such as: the rethinking of the unemployment benefits and early retirement schemes (included into the passive labor market policies); emphasis of education (including language training programs) that becomes crucial and, at the same time, a milestone in enhancing the use of particular skills developed by migrants in their labor market integration, thus increasing job security, labor productivity and overall economic development. Moreover, the educational system is important in terms of the programs implemented for migrant children, specially designed to ease their migration journey and secure a proper society and labor market integration of migrant families. Furthermore, these results point out the need for a reconfiguration of the governmental support granted to research and development activities evolved within the business sector. The results obtained highlight that the success of labor market integration strategies and policies depends on the way they account for the differences and stratifications in terms of origin country (region), neighboring locations integration performances, best practices and “local labor market disadvantage”, also stated by [5] (p. 18).
Our research results are in lines with the EU’s “Action Plan on the integration of third-country nationals” [2], underlining the importance of education, employment and vocational training, active participation and social inclusion for migrants’ early integration in the labor market.
The main limitations of our research consisted, mainly, in reduced data availability for an extensive time span of the international migration process. For future research, we aim to enlarge the migrants’ integration policies by analyzing the complementarity between the human capital (appreciated through tertiary education) and R&D support (as underlined by [24,25]), but also socio-psychological credentials jointly with the economic dimension, with a special focus on sustainable economic development implications.
Author Contributions
G.G.N. settled the general pattern of the paper. The authors were altogether involved in writing of the paper and approved its final version.
Funding
This research received no external funding.
Acknowledgments
We would like to thank the reviewers for their accurate and thoughtful comments that were extremely useful in framing the overall research.
Conflicts of Interest
The authors declare no conflict of interest.
Appendix A
Table A1.
Variables included within the empirical models.
Table A1.
Variables included within the empirical models.
| Acronym | Explanation | Database |
|---|---|---|
| IMIG | Flows of immigrants and foreign population (number) | OECD, Eurostat |
| ASYL | Flows of refugees and asylum applicants (number) | OECD, UNHCR |
| UR_F | Unemployment rate for the foreign population (%) | Eurostat |
| ER_F | Employment rate for the foreign population (%) | Eurostat |
| GDP_cap | Real Gross Domestic Product per capita (Euro) | Eurostat |
| EDU_S | Educational attainment for upper secondary and post–secondary non–tertiary education (levels 3–4) | Eurostat |
| EDU_T | Educational attainment for tertiary education (levels 5–8) | Eurostat |
| ALMPs | Expenditures on Active Labor Market Policies (% of GDP) | Eurostat |
| PLMPs | Expenditures on Passive Labor Market Policies (% of GDP) | Eurostat |
| POV_R | At-risk-of-poverty-rate (%) | Eurostat, World Bank |
| BERD | Business Enterprise R&D expenditures (% of GDP) | Eurostat |
| GINI | GINI coefficients (index) | UNU WIDER |
Source: authors’ process.
Table A2.
Summary Statistics.
Table A2.
Summary Statistics.
| N | Mean | sd | min | max | |
|---|---|---|---|---|---|
| IMIG | 180 | 289,868.3 | 269,660.3 | 16,895 | 1,461,433 |
| ASYL | 180 | 37,567.83 | 47,362.88 | 1405 | 363,540 |
| UR_F | 180 | 13.65889 | 5.563587 | 5 | 35.4 |
| ER_F | 180 | 60.95444 | 5.462389 | 45.2 | 72.4 |
| GDP_cap | 180 | 34,722.65 | 10,329.76 | 15,600 | 64,161.97 |
| EDU_S | 180 | 43.29222 | 9.77719 | 20 | 60.8 |
| EDU_T | 180 | 25.61667 | 7.409668 | 8.1 | 56.5 |
| ALMPs | 180 | 0.6604222 | 0.3642167 | 0.035 | 1.745 |
| PLMPs | 180 | 1.376456 | 0.6499149 | 0.062 | 3.053 |
| POV_R | 180 | 20.63778 | 4.545206 | 9.1 | 30.29 |
| BERD | 180 | 1.274556 | 0.6005345 | 0.38 | 2.985 |
| GINI | 180 | 28.65722 | 3.402878 | 20.6 | 37.7 |
Source: authors’ own process of panel data.
Table A3.
SEM results for Cronbach’s alpha, EU-10, 2000–2017.
Table A3.
SEM results for Cronbach’s alpha, EU-10, 2000–2017.
| Variables | Test Scale = Mean (Standardized Items), Average | |||||
|---|---|---|---|---|---|---|
| UR_F | ER_F | |||||
| Obs | Sign | alpha | Obs | Sign | alpha | |
| UR_F | 180 | + | 0.7804 | |||
| ER_F | 180 | - | 0.7804 | |||
| GDP_capita | 180 | + | 0.7463 | 180 | + | 0.7517 |
| EDU_S | 180 | + | 0.7840 | 180 | + | 0.7850 |
| EDU_T | 180 | + | 0.7638 | 180 | + | 0.7736 |
| BERD | 180 | + | 0.7153 | 180 | + | 0.7230 |
| ALMPs | 180 | + | 0.7193 | 180 | + | 0.7255 |
| PLMPs | 180 | + | 0.7586 | 180 | + | 0.7640 |
| POV_R | 180 | - | 0.7192 | 180 | - | 0.7267 |
| GINI | 180 | - | 0.6987 | 180 | - | 0.7005 |
| IMIG | 180 | - | 0.7232 | 180 | - | 0.7279 |
| ASYL | 180 | - | 0.7742 | 180 | - | 0.7810 |
| Total scale | 0.7638 | 0.7686 | ||||
Source: own research.
Table A4.
Wald test for SEM models, EU-10, 2000–2017.
Table A4.
Wald test for SEM models, EU-10, 2000–2017.
| Variables | Chi2 | df | p-Value | Chi2 | df | p-Value |
|---|---|---|---|---|---|---|
| UR_F | ER_F | |||||
| ER_F | 224.13 | 10 | 0.0000 | |||
| UR_F | 413.02 | 10 | 0.0000 | |||
| H0: all coefficients excluding the intercepts are 0. We can thus reject that null hypothesis for each equation. | ||||||
Source: own research.
Table A5.
(a) Goodness-of-fit tests for SEM models, UR_F. (b) Goodness-of-fit tests for SEM models, ER_F; 2000–2017.
Table A5.
(a) Goodness-of-fit tests for SEM models, UR_F. (b) Goodness-of-fit tests for SEM models, ER_F; 2000–2017.
| (a) UR_F | ||
| Fit Statistic | Value | Description |
| Likelihood ratio | ||
| chi2_ms(26) | 0.000 | model vs. saturated |
| p > chi2 | - | |
| chi2_bs(38) | 214.610 | baseline vs. saturated |
| p > chi2 | 0.000 | |
| Information criteria | ||
| AIC | 4662.958 | Akaike’s information criterion |
| BIC | 4701.273 | Bayesian information criterion |
| Baseline comparison | ||
| CFI | 1.000 | Comparative fit index |
| TLI | 1.000 | Tucker-Lewis index |
| Size of residuals | ||
| SRMR | 0.000 | Standardized root mean squared residual |
| CD | 0.696 | Coefficient of determination |
| (b) ER_F | ||
| Fit Statistic | Value | Description |
| Likelihood ratio | ||
| chi2_ms(26) | 0.000 | model vs. saturated |
| p > chi2 | - | |
| chi2_bs(38) | 145.578 | baseline vs. saturated |
| p > chi2 | 0.000 | |
| Information criteria | ||
| AIC | 4735.025 | Akaike’s information criterion |
| BIC | 4773.341 | Bayesian information criterion |
| Baseline comparison | ||
| CFI | 1.000 | Comparative fit index |
| TLI | 1.000 | Tucker-Lewis index |
| Size of residuals | ||
| SRMR | 0.000 | Standardized root mean squared residual |
| CD | 0.555 | Coefficient of determination |
Source: authors’ research.
References
- Konle-Seidl, R.; Bolits, G. Labour Market Integration of Refugees: Strategies and Good Practices; European Parliament, Directorate General for Internal Policies, Policy Department A—Economic and Scientific Policy: Brussels, Belgium, 2016. [Google Scholar]
- European Commission. Action Plan on the Integration of Third Country Nationals; Communication from the Commission to the European Parliament, the Council, the European Economic and Social Committee and the Committee of the Regions; European Commission: Brussels, Belgium, 2016. [Google Scholar]
- European Commission. Eurostat. Database. 2018. Available online: http://ec.europa.eu/eurostat/data/ database (accessed on 3 September 2018).
- Van Wolleghem, P.G. The EU’s Policy on the Integration of Migrants: A Case of Soft-Europeanization? Palgrave Studies in European Union Politics; Palgrave Macmillan: Basingstoke, UK, 2019; pp. 1–236. ISBN 978-3-319-97681-5. [Google Scholar]
- Clark, K.; Garratt, L.; Li, Y.; Lymperopoulou, K.; Shankley, W. Local deprivation and the labour market integration of new migrants to England. J. Ethn. Migr. Stud. 2018, 1–23. [Google Scholar] [CrossRef]
- Hoxhaj, R. Wage expectations of illegal immigrants: The role of networks and previous migration experience. Int. Econ. 2015, 142, 136–151. [Google Scholar] [CrossRef]
- Zimmermann, K.F. Labor Mobility and the Integration of European Labor Markets; IZA Discussion Paper 3999; Institute for the Study of Labor: Bonn, Germany, 2009. [Google Scholar]
- Noja, G.G.; Cristea, S.M.; Yüksel, A.; Pânzaru, C.; Drăcea, R.M. Migrants’ role in enhancing the economic development of host countries: Empirical evidence from Europe. Sustainability 2018, 10, 894. [Google Scholar] [CrossRef]
- Amuedo Dorantes, C.; De la Rica, S. Labour market assimilation of recent immigrants in Spain. Br. J. Ind. Relat. 2007, 45, 257–284. [Google Scholar] [CrossRef]
- Delgado Gómez-Flors, M.; Alguacil, M. The impact of immigrant diversity on wages. The Spanish experience. Sustainability 2018, 10, 3312. [Google Scholar] [CrossRef]
- Entzinger, H.; Biezeveld, R. Benchmarking in Immigrant Integration; Report for the European Commission; European Research Centre on Migration and Ethnic Relations: Rotterdam, The Netherlands, 2003. [Google Scholar]
- Van Wolleghem, P.G. Why Implement without a Tangible Threat? The Effect of a Soft Instrument on National Migrant Integration Policies. J. Common Mark. Stud. 2017, 55, 1127–1143. [Google Scholar] [CrossRef]
- Kogan, I. New immigrants—Old disadvantage patterns? Labour market integration of recent immigrants into Germany. Int. Migr. 2011, 49, 91–117. [Google Scholar] [CrossRef]
- Koopmans, R. Trade-offs between equality and difference: Immigrant integration, multiculturalism and the welfare state in cross-national perspective. J. Ethn. Migr. Stud. 2010, 36, 1–26. [Google Scholar] [CrossRef]
- Hooper, K.; Desiderio, M.V.; Salant, B. Improving the Labour Market Integration of Migrants and Refugees—Empowering Cities through Better Use of EU Instruments; Migration Policy Institute Europe (MPI): Brussels, Belgium, 2017. [Google Scholar]
- Petracou, E.; Domazakis, G.; Papayiannis, G.; Yannacopoulos, A. Towards a Common European Space for Asylum. Sustainability 2018, 10, 2961. [Google Scholar] [CrossRef]
- Organization for Economic Cooperation and Development (OECD). International Migration Outlook. Trends in Migration Flows, 2018; Organization for Economic Cooperation and Development (OECD): Paris, France, 2018; Available online: https://www.oecd-ilibrary.org/social-issues-migration-health/international-migration-outlook-2018_migr_outlook-2018-en (accessed on 12 September 2018).
- World Bank. World Development Indicators. 2018. Available online: http://data.worldbank.org/data-catalog/ world-development-indicators (accessed on 4 September 2018).
- The UN Refugee Agency (UNHCR). Figures at a Glance 2017. Geneva: United Nations High Commissioner for Refugees. Available online: http://www.unhcr.org/figures-at-a-glance.html (accessed on 14 September 2018).
- United Nations University World Institute for Development Economics Research (UNU WIDER). World Income Inequality Database; United Nations University: Helsinki, Finland, 2018. [Google Scholar]
- Tănasie, A.; Drăcea, R.; Lădaru, G.R. A Chaos Theory Perspective on International Migration. Sustainability 2017, 9, 2355. [Google Scholar] [CrossRef]
- Noja, G.G.; Cristea, M. Working Conditions and Flexicurity Measures as Key Drivers of Economic Growth: Empirical Evidence for Europe. Ekonomický Časopis 2018, 66, 719–749. [Google Scholar]
- European Foundation for the Improvement of Living and Working Conditions (Eurofound). European Quality of Life Survey; Eurofound: Dublin, Ireland, 2016. [Google Scholar]
- Scicchitano, S. On the Complementarity between On-the-job Training and R&D: A Brief Overview. Econ. Bull. 2007, 15, 1–11. [Google Scholar]
- Scicchitano, S. Complementarity between heterogeneous human capital and R&D: Can job-training avoid low development traps? Empirica 2010, 37, 361–380. [Google Scholar] [CrossRef]
- Huddleston, T.; Bilgili, O.; Joki, A.L.; Vankova, Z. Migrant Integration Policy Index 2015; CIDOB: Barcelona, Spain; MPG: Brussels, Belgium, 2015; Available online: www.mipex.eu (accessed on 9 September 2018).
- Organization for Economic Cooperation and Development (OECD). Handbook on Constructing Composite Indicators: Methodology and User Guide; OECD Publishing: Paris, France, 2005; pp. 83–88. ISBN 978-92-64-04345-9. [Google Scholar]
- Lozano, F.A.; Steinberger, M.D. Empirical Methods in the Economics of International Immigration; IZA Discussion Paper Series 5328; Institute for the Study of Labor: Bonn, Germany, 2010. [Google Scholar]
- Viton, P.A. Notes on Spatial Econometric Models. City Reg. Plan. 2010, 870, 2–17. [Google Scholar]
- Efron, B.; Tibshirani, R.G. An Introduction to the Bootstrap; Chapman & Hall/CRC: Boca Raton, FL, USA, 1993; pp. 1–436. ISBN 0-412-04231-2. [Google Scholar]
- Dempster, A.P. Covariance selection. Biometrics 1972, 28, 157–175. [Google Scholar] [CrossRef]
- Dobra, A.; Eicher, T.; Lenkoski, A. Modeling Uncertainty in Macroeconomic Growth Determinants Using Gaussian Graphical Models; Working Paper 87; Center for Statistics and the Social Sciences, University of Washington: Seattle, WA, USA, 2008. [Google Scholar]
- Glass, A.J.; Kenjegalieva, K.; Sickles, R. The Economic Case for the Spatial Error Model with an Application to State Vehicle Usage in the U.S.; Rice University: Houston, TX, USA, 2012; Available online: https://pdfs.semanticscholar.org/40ff/8eeaae7f1326813e500253adc3eaff0490a9.pdf (accessed on 3 August 2018).
- Aceleanu, M.I.; Şerban, A.C.; Burghelea, C. “Greening” the youth employment—A chance for sustainable development. Sustainability 2015, 7, 2623–2643. [Google Scholar] [CrossRef]
- Dima, A.M.; Meghişan-Toma, G.M. Research on Implementing Education for Sustainable Development. In Proceedings of the International Conference on Business Excellence, Bucharest, Romania, 22–23 March 2018; Sciendo: Warsaw, Poland, 2018; Volume 12, pp. 300–310. [Google Scholar]
- Suciu, M.C.; Lăcătuş, M.L. Soft skills and economic education. Pol. J. Manag. Stud. 2014, 10, 161–168. [Google Scholar]
- Balaz, V.; Karasová, K. Geographical patterns in the intra-European migration before and after Eastern enlargement: The connectivity approach. Ekonomicky Casopis 2017, 65, 3–30. [Google Scholar]
- Lauritzen, S.L. Graphical Models; Oxford University Press: New York, NY, USA, 1996; pp. 1–298. ISBN 0-19-852219-3. [Google Scholar]
- Organization for Economic Cooperation and Development (OECD). Working Together for Local Integration of Migrants and Refugees; Organization for Economic Cooperation and Development (OECD): Paris, France, 2018. [Google Scholar]


© 2018 by the authors. Licensee MDPI, Basel, Switzerland. This article is an open access article distributed under the terms and conditions of the Creative Commons Attribution (CC BY) license (http://creativecommons.org/licenses/by/4.0/).