1. Introduction
Sponge city construction, low-impact development, and rainwater management in green spaces in Shanghai, China, have become important issues. Green spaces include two parts: the overground part, with limbs and canopy; and the underground part, with roots and soil. Studies have suggested that limbs, canopy, and roots are related to rainwater regulation and storage capacity of green spaces [
1]. Physical soil properties, especially soil porous characteristics, also have a great impact on rainfall infiltration [
2]. During rainfall infiltration, water permeates into the soil, forming soil moisture, and there is mutual transformation among rainfall, runoff, soil moisture, and underground water [
3]. When rainfall flows downward to deeper soil layers, the process of hydraulic redistribution is affected by roots, accounting for 74% (<36 mm rainfall) to 100% (<8 mm rainfall) of the effect [
4]. The conversion process is significantly influenced by physical soil properties.
Plant root systems have a great impact on the soil, and there is a functional relationship among soil depth, root density, and soil properties [
5]. By increasing soil porosity, non-capillary porosity, and field capacity, plant root systems may intensify the hydrological and ecological function of rainfall regulation, storage, and infiltration [
6]. The effect of plant roots is commonly studied in forestry, agriculture, and hydraulic engineering [
7,
8]. However, research has largely focused on the linear relationship between the root density of ground cover plants and soil infiltration instead of trees [
9,
10,
11]. One reason is that roots need to be dug out for measurements in traditional investigations. This method is suitable for understanding the local features of roots, especially for ground cover plants and small size shrubs with roots thinner than 1 cm [
12]. However, for trees in which the horizontal and vertical root distribution expands to meters with roots thicker than 2 cm, it is impossible to dig out the main root systems without serious damage to tree growth.
It is time-consuming to study plant roots quantitatively by collecting roots and measuring morphological variables, such as length, density, weight, angle, and topological structure. With improvements in picture processing and analysis, the approaches to measuring root systems have advanced gradually from artificial measurements to automatic detection by computer. Huffman (1997) employed Root Mean Square (RMS) software to measure root length accurately and quickly via imaging. Another method is called root canal, which has little impact on the growth of plant roots. This can be used to detect dynamic variation, but the results are still two-dimensional images [
13]. Thus, this method is often applied to observe roots in special growing steps, rather than the whole root structure [
14]. Montgomery and Heyenga (2009) used a charge-coupled device and computer software to gain more accurate three-dimensional images of root systems, which allows for better visualization and more informatization of root systems. Nevertheless, an entire image cannot be obtained in situations such as root stagger or overlap [
15]. For now, this problem has not been solved by traditional methods.
Magnetic resonance imaging (MRT), X ray computed tomography (XCT), and ground penetrating radar (GPR) have to some extent solved the limitations of traditional methods, allowing for noninvasive three-dimensional measurements [
16]. MRT and XCT techniques can detect plant roots over the long term in situ. However, the equipment is not suitable for field investigations due to the high demands of the instruments. GPR can detect and locate underground objects using discontinuous scattering and the reflection of high frequency electromagnetic waves on media with different dielectric constants, allowing for plane, section, and three-dimensional diagrams [
17]. Roots as small as 0.5 cm diameter can be identified by GPR, and the mean square error is 0.6 cm, which makes GPR feasible to study tree root systems [
18]. The precision of GPR is not good enough for ground cover plants due to their small root diameters. In addition, the radar signal may be affected by factors such as soil moisture content, the medium uniformity coefficient, differences in dielectric constant, the extension direction of roots, and stagger and overlap of root systems. Nevertheless, GPR is a relatively mature technology, and the instruments are easy to carry and operate, making them appropriate for tree root investigation in the field.
It is hard for the traditional way of digging to estimate the root distribution precisely, which would cause serious damage to root systems. In the present work, we used noninvasive methods such as the Tree Radar Unit (TRU) to detect 10 kinds of tree root systems that are commonly found in Shanghai green spaces at more than 70% frequency of occurrence.
Furthermore, the relationships among tree root density, soil total porosity, and non-capillary porosity were identified to examine the effects of various trees on rainfall regulation and storage capacity of soil. For 10 kinds of trees commonly used in green space, it is important to analyze and compare root density, root system spatial distribution and effect on soil properties, reflecting on management measure for public or private green areas in order to maximize the soil biophysical values and increase the sustainability of cities throughout the improvement of ecosystem service (selecting proper plant species in specific soils for example).
Simultaneously, in urban environment, trees are an important medium to promote infiltration, as a fundamental element of green space [
19,
20]. Insights into landscape trees and urban environment may provide an important theoretical and practical reference frame for tree selection, green space construction, in line with soil condition and the frequency of trampling, to enhance soil properties and relatively water-holding capacity in areas like Shanghai, China [
21,
22].
2. Research System
Shanghai (120°52′–120°12′ E, 30°40′–31°53′ N) is located in East China, with a subtropical monsoon climate, and its annual precipitation is about 1159.5 mm. The urban green coverage rate was up to about 40% in 2017 [
23], and the main types of plants were evergreen broad-leaved forest, deciduous broad-leaved forest, evergreen coniferous forest, and deciduous coniferous forest [
24]. With reference to the landscape plant frequency in Shanghai, 10 species of trees were chosen as research objects, including
Cinnamomum camphora (CCL),
Magnolia grandiflora (MGL),
Elaeocarpus decipiens (EDH),
Ligustrum lucidum (LLA),
Osmanthus fragrans (OFL),
Zelkova serrata (ZSM),
Koelreuteria paniculata (KPL),
Platanus orientalis (POL),
Cedrus deodara (CDG), and
Metasequoia glyptostroboides (MGH).
The campus of Shanghai Jiao Tong University was selected as the sample location (
Figure 1), because it includes all the above-mentioned trees. The research objects were all landscape trees that were healthy and distributed on the lawn without other trees within an 8 m diameter to exclude the influence of other tree root systems. The lawn under the trees was mainly covered by
Zoysia matrella and
Cynodon dactylon. There are a lot of impacts affecting the root distribution, as height, diameter at breast height, tree-age, soil conditions and water table [
25,
26], and there is significant relationship among height, diameter at breast height (DBH) and tree-age [
24]. In addition, the trees grow at different rates, so the species in the same age could have diverse height and DBH. As a result, the trees chosen in this research were of the same age (about ten years), with DBH ranging from 13 to 30 cm, which grew under similar soil characteristics and away from the water bodies to eliminate the influence of water table.
Each species consisted of nine trees as replicants. For each tree, root density was measured in 1 m, 2 m, 3 m, and 4 m radii, as well as five depth slices (surface to 15 cm, 15–35 cm, 35–45 cm, 45–60 cm, and deeper than 60 cm) (
Figure 2). Accordingly, the physical properties of the soil were investigated.
4. Results
4.1. Root Density with Change in Soil Depth
As
Table 2 and
Figure 3 show, the root density was similar at a radius of 2 m and 3 m, but between 1 m and 4 m from the trunk, the root density was significantly different. In the vertical direction, root density decreased sharply with the increase of depth within a 1 m distance. Except for
O. fragrans, the mean value of root density for the trees had minimal difference in depth slices from the surface to 15 cm and from 45–60 cm. This suggested that variations in tree root density are mainly reflected in the middle layer of the root structure. As the root density decreased with the increase of distance, and the magnitude of the decrease was stable, the distribution range of root systems could be estimated by measuring the root density at the edge. For example, the root density of
O. fragrans was lower than 1.2 number/m at a depth of 45–60 cm, which indicated that the number of 1 cm diameter roots was rare when the soil layer was deeper than 60 cm. The root density of
O. fragrans at the edge was lower than that of the other trees.
As
Table 1 and
Figure 3 show, in the horizontal direction, the root density of all trees was highest at a 1 m radius from the trunk. For the 10 species of trees, the root density was highest for
K. paniculata followed by
M. glyptostroboides,
P. orientalis,
C. deodara,
M. grandiflora,
C. camphora,
E. decipiens,
Z. serrata,
O. fragrans, and
L. lucidum. There was an obvious decline in root density from the 2 m radius. At 4 m from the trunk, the average root density of
C. deodara (6.23) was highest and was almost 1.5 times as much as those of
K. paniculata,
M. grandiflora,
Z. serrata,
E. decipiens,
M. glyptostroboides,
P. orientalis, and
C. camphora. The root densities of
L. lucidum (2.01) and
O. fragrans (1.71) were relatively low and were approximate one-third that of
C. deodara. These results represent the expansion ranges of trees in the horizontal direction. For the vertical direction, from the surface soil layer to a 30-cm depth, the root densities of
Z. serrata,
E. decipiens, and
L. lucidum were lowest, ranging from 1.6–2.5 number/m. The other trees were similar to each other, about 3.2–3.5 number/m. In the deeper soil slices, the root densities of
O. fragrans (1.2) and
L. lucidum (1.6) were obviously low, followed by
C. camphora (2.0) and
E. decipiens (2.0). The root densities of those trees were about half of that for
K. paniculata (3.46).
4.2. Correlation Analysis of Root Density and Soil Porosity Characteristics
Root systems expand, insert, and interweave in the soil, forming a loose and porous root–soil complex, gradually improving soil physical properties [
28]. There is some relationship between soil physical properties and root system distribution characteristics. Root density reflects root distribution. Furthermore, soil infiltration mainly depends on physical properties, and soil infiltration can be improved by increasing soil porosity [
29]. As growth, expansion, interweaving, death, and decomposition of root systems occurs, a large number of root channels are left in the soil. A higher root density represents larger root numbers per unit area, which means more root channels and higher soil infiltration capacity.
Correlation analysis was used to explore the relationships between tree root density and soil porous characteristics. As
Table 3,
Table 4 and
Table 5 shows, root density was negatively correlated with soil bulk density, but positively correlated with soil total porosity and non-capillary porosity, which both had a significant relationship with the soil stable infiltration rate. There was a negative correlation among soil total porosity, non-capillary porosity, and soil depth.
4.3. Differences in Soil Porosity Corresponding to Tree Roots
Based on variance analysis, there was highly significant difference in soil porosity and non-capillary porosity among the 10 tree species (p < 0.01). For soil depth, only the differences in soil porosity were highly significant (p < 0.01). The variation of non-capillary porosity was also significant (p < 0.05).
Interstices of soil are the cavities between soil particles and aggregates that hold moisture and air, providing space for root expansion, animals, and microbial activity. Soil porosity is the percentage of interstitial volume in the soil. Soil porosity has direct effect on the capacity of water infiltration and air permeability, as well as the compaction degree. The results of variance analysis suggested that highly significant differences existed between species and soil depth (
p < 0.01). The soil depth slices from the surface to 30 cm could be affected by the roots of herbaceous plants and landscape maintenance. The phreatic water zone begins from 0.7–1.2 m underground; so, the soil data in that area could be influenced by underground water [
30]. For these reasons, the data from the middle three soil layers (15–30 cm, 30–45 cm, and 45–60 cm) were analyzed.
Figure 4A indicates that within a 1 m distance from the trunk, soil total porosity declined gradually with increased soil depth. Soil total porosity was significantly different between soil depths. For the ten tree species, the average value of soil total porosity was the highest in the depth slice of 15–30 cm, corresponding to the root systems. Among these trees, soil total porosity of
C. camphora was the highest (51.7%). Those of
M. grandiflora and
E. decipiens were lowest, with both at 42.4%. The soil total porosities of the other trees were similar, ranging from 45.7% to 48.1%.
At a distance of 4 m from the trunk, the soil total porosity of 6 out of 10 of the trees decreased sharply with the depth of the soil layer (
Figure 4B). The average porosity for samples at 4 m was slightly less than that at 1 m. Soil porosity was highest at the depth of 30–40 cm, in the order of
O. fragrans (51.1%),
K. paniculate (50.0%),
M. glyptostroboides (44.3%), and
C. deodara (43.5%), showing basically the same trend as root density, with the exception of
O. fragrans (
Figure 3). At a depth of 15–30 cm, the soil total porosity of
Z. serrata (53.0%) was the highest, followed by
E. decipiens (52.4%) and
C. camphora (52.2%), which still maintained a high level at the depth of 45–60 cm, but in the opposite order.
There was not a one-to-one correspondence between soil total porosity and root density for trees in at one and four meters. Nevertheless, the results of Spearman correlation analysis suggested that the relationship was significant (
p < 0.01), which meant that the tendency was for root density and soil porosity to coincide. Outlier species, such as
O. fragrans, might have been impacted by the spatial distribution characteristics of the root systems and organic content. The root systems of
O. fragrans in range and depth are limited to shallow soil layers, resulting in low root density in deeper soil depth slices. Organic content has an obvious linear relationship with soil water-stable aggregates, which affect infiltration, soil total porosity, and especially non-capillary porosity [
10].
Non-capillary porosity consists of large pores with diameters thicker than 0.1 mm due to soil particles in loose arrangement. Non-capillary porosity is significantly correlated with soil depth and decreases with the increase of soil depth. Furthermore, non-capillary porosity is correlated with the distribution of root systems. As
Figure 4C,D shows, the differences in non-capillary porosity were largest in the soil layer of 15–30 cm, but small in both deeper layers. At a distance of 1 m, the rankings of soil non-capillary porosity and root density were similar. However, in the layer of 15–30 cm, the non-capillary porosities of
Z. serrata,
O. fragrans, and
P. orientalis were larger, which might be due to the root systems being distributed in the shallow soil layer. At a radius of 4 m, there was more variation between root density and soil non-capillary porosity. By Spearman correlation analysis, the consistency was significant for both root density and soil non-capillary porosity (
p < 0.05).
4.4. Linear Relationship between Root Density and Soil Total Porosity and Non-Capillary Porosity
There was a positive correlation between root density and soil porosity, including total porosity and non-capillary porosity.
Figure 5 indicates a significant linear relationship between root density and soil total porosity (
p < 0.001), and between root density and non-capillary porosity (
p < 0.05) (
Table 6). The correlation was not significant for trees with DBH of 13–15 cm. However, for trees with DBH of 28–30 cm, the correlation was significant, which means that as a tree and its root system grow, the effects of unit root density on soil porosity become greater.
4.5. Effect of Tree Root Spatial Distributions on Soil Porosity and Non-Capillary Porosity
K-means cluster analysis was used to evaluate root density characteristics of four horizontal distances for the 10 species of trees. The results indicated that the 10 species could be separated into three categories. The first includes M. glyptostroboides, K. paniculata, and C. deodara. M. grandiflora and P. orientalis are in the second category, and the last includes E. decipiens, O. fragrans, L. lucidum, C. camphora, and Z. serrata. The root density of the first category was bigger than the other two on average (type 1 > 2 > 3).
Additionally, using K-means cluster analysis, root distribution characteristics could be classified into three types based on vertical direction, taking root density as the variable in soil depth layers in a 1-m radius. Type I includes
C. deodara,
P. orientalis, and
O. fragrans. Type II is
K. paniculata, and type III includes
C. camphora,
L. lucidum,
E. decipiens,
M. grandiflora,
M. glyptostroboides, and
Z. serrata. Using TreeWin software, three-dimensional images of the 10 species were created to observe tree root spatial distribution characteristics (
Figure 6). As the vertical distribution shows, root densities of trees in type I declined with the increase of soil depth, but the root densities of trees in type II decreased less and were stable in the 15–45 cm soil depth slice. The root densities of type III trees were highest in layer of 30–45 cm, and root distribution depth was deeper. Furthermore, all three types had similar root densities in the soil layer of 15–30 cm. In general, the root characteristics of type I trees could be described as shallow, type II as deep, and type III as intermediate.
We used cluster analysis of root distribution characteristics in the horizontal and vertical direction and integrated the two analyses to summarize the total root distribution features of the 10 tree species (
Figure 6). As a comprehensive classification, the root features could be sorted into three groups. Group A includes
C. camphora,
M. grandiflora,
C. deodara,
P. orientalis, and
Z. serrata. There were no obvious boundaries of root distributions for group A in the detectable range, and the general root density was high. The root systems were distributed relatively evenly in each soil layer, with wide distribution space especially in the horizontal direction. The vertical section of group A was like a rectangle, and the root density was highest in the soil depth slice from the surface to 40 cm. There were more roots expanded horizontally in the surface soil layer. As a result, group A can be called a horizontal root system (
Figure 6A).
E. decipiens,
K. paniculata, and
M. glyptostroboides are in group B, for which there was no obvious decline with the shift of soil depth. However, in the soil layer of 0–30 cm, few and small roots were distributed, and even fewer in the horizontal direction, but more in the vertical direction. The expanding direction of fibrous roots formed higher angles with the soil surface. Generally, the root density in deep soil layers was higher than that in the shallow layer. Group B can be described as a vertical root system (
Figure 6B). Group C consists of
O. fragrans and
L. lucidum, in which the distribution boundaries of the root systems could be detected by TRU. The root system presents as a triangle, with the highest root density in the soil depth slice of 0–30 cm, which declines fast in deeper layers. This suggests that the roots of trees in group C are distributed in the shallower soil layers, which is much shallower than those of groups A and B (
Figure 6C).
4.6. Consistency of Tendency for Root System Spatial Distribution, Soil Porosity, and Non-Capillary Porosity
Relationships between root density, soil total porosity, and non-capillary porosity in each radius from the trunk were not fully consistent. However, Spearman correlation showed a significant consistency of ranking (p < 0.01, p < 0.05). For soil total porosity for instance, the sorting was different at various depth slices. For different soil depth slices, the mean value of root density was consistent with root distribution classifications and soil total porosity. From the surface to 30 cm depth, the soil total porosities of O. fragrans (53.1%), L. lucidum (52.6%), and C. deodara (51.4%) were highest on average, while those of K. paniculata (45.9%), M. glyptostroboides (42.6%), and E. decipiens (40.5%) were lowest. In the middle, the mean values of soil total porosities were similar, with M. grandiflora (47.8%), C. camphora (46.4%), P. orientalis (46.1%), and Z. serrata (45.4%). Nevertheless, in the deeper soil slices between 30 and 60 cm, the magnitude of the decline is different. The soil total porosity was highest for M. glyptostroboides (50.5%) and K. paniculata (49.2%), followed by E. decipiens (48.7%), C. deodara (48.4%), C. camphora (48.2%), Z. serrata (44.6%), and P. orientalis (43.7%). The values for M. grandiflora (42.8%), O. fragrans (42.7%), and L. lucidum (40.2%) were lowest in deeper soil layers. These results suggested that there were three categories of soil total porosity respectively in shallow and deep soil layers, which was fairly consistent with the three groups of tree root system distribution. To some extent, this consistency verifies that root density and root system distribution affect soil total porosity and non-capillary porosity.
The regression analysis indicated that root density had a positive linear relationship with soil total porosity and non-capillary porosity. Considering root system distribution characteristics and soil investigation results on five depth slices, there was a significant effect of root distribution on soil total porosity and non-capillary porosity. The root system of Group A had better comprehensive impacts on soil, while group B had improved soil properties in the deep soil layer of 30–60 cm, and group C affected shallow soil depth from the surface to 30 cm.
5. Discussion
TRU can detect tree roots thicker than 1 cm, which are called skeleton roots, that have a support function for trees to resist strong wind and pressure [
31]. The biomass of skeleton roots is the majority of the root system [
32]. From the results of detection, the root distribution range of dunga-runga, such as
O. fragrans and
L. luidum, is obviously smaller than other megaphanerophytes (trees in Group A and B in
Figure 6). Our results verified the relationship between root spatial distribution characteristics and biomass of the overground portion. The larger the growth of the overground portion, the higher the supporting capacity of the root systems.
Statistically, for those 10 kinds of trees commonly used in Shanghai, there was a significant correlation between root density, and soil physical porosity (
p = 0.000). For objects in this research, the significant relationship has already been verified by correlation analysis. However, there are a lot of impacts affecting root distribution and soil physical porosities, as water table, tree-ages, height and DBH. Even trees selected in the research were at the same age, the trees grow at different rates, so the species in the same age could have diverse height and DBH. As a result, the DBH of trees ranged from 13 cm to 30 cm, which might cause the regressive equation in
Table 6, which R
2 was not big enough. However, the fact is that field experiments have a higher tolerance of R
2.
Previous studies have indicated that tree root systems have a positive effect on soil infiltration mainly for root diameters in the range of 0.5–5 mm [
33]. However, the limit of detection in this study was 10 mm, yet we still found a linear correlation between root density and soil infiltration or soil porosity. The reason might be that there was a positive relationship between the number of roots thicker than 10 mm and those that are thinner. As a result, the density of tree roots with diameters thicker than 10 mm could also be used as an indicator for soil porosity and permeability.
The results indicated that the variance of non-capillary porosity of trees was significant, and it primarily reflects the effects of tree root systems on non-capillary porosity in the shallow soil layer of 15–30 cm. Most soil samples had non-capillary porosities lower than 3%, which works against the growth of tree root systems. Previous studies have indicated that as a tree is growing in diameter at breast height (DBH), there is an obvious effect of root systems on non-capillary porosity [
23].
Moreover, this research was limited by many internal and external factors affecting root distribution and soil porosity. Among internal impacts, fallen leaves, fruiting, and branching affect the biomass allocation of trees and then influence the growth of roots. Moreover, irrigation, fertilization, and pruning affect root distribution during gardening maintenance [
34]. In addition to the root system, factors affecting soil total porosity and non-capillary porosity include organic matter, soil arrangement, structure, cultivation, rainfall, and fertilization [
10]. In addition, external impacts have significant influences on root systems. Moisture distribution in the soil is one of the most important factors to guide root system [
1]. The underground water level is high in the Shanghai area, and is approximately 0.7–1.2 m deep, so it is difficult for root systems to expand to deeper soil depths. In this study, the samples chosen were located in open lawns without limitations of physical space in the horizontal direction, such as buildings, pavement, and other trees. All samples grew inside the campus, and external factors such as gardening maintenance tended to be consistent, excluding most external impacts on tree root systems.
Furthermore, root distribution characteristics are related to the environment, growing speed, and drought tolerance in the source area [
35]. For instance,
C. deodara originally grew in the western part of the Himalayas, in which the climate is warm in summers and cool in winters, with deep and acidic soil layers, as well as great soil permeability and porosity. The main root of
C. deodara is undeveloped. The climate in Shanghai is warm and humid, with high levels of underground water that promote shallow root distributions.
K. paniculata is resistant to dry and barren environments over the long term, as well as waterlogging in the short term. The growth rate of the plant is relatively slow. The roots of drought-tolerant trees tend to be highly developed and deeply distributed in order to get more moisture.
C. camphora,
M. grandiflora, and
Z. serrata are all local species in Shanghai. They grow well, and their root distribution is horizontal, which accords with the water distribution characteristics.
E. decipiens prefers warm and humid environments in the southern part of China. The overall growth of
E. decipiens was not as great as in the source area. Its root system belongs to the vertical group, but the fibrous root density is low.
P. orientalis is a typical fast-growing tree species with a shallow root system.
M. glyptostroboides is also a rapidly growing tree with high requirements for the support of its root system.
Suggestions for Plant Design and Green Space Management
The results indicated that there was a correlation and linear relationship between root density and soil physical porosities in statistics, and for different tree species, the effect of root systems was various on soil porosity. The incidence and characteristics of root system spatial distribution could be sorted, screened, and clustered. The results of cluster analysis could be discussed, to guide management measures, plant community construction, meet residents’ demands, and improve the ecosystem service function in urban green space.
The results showed that the root density of 10 kinds of tress decreased gradually from 1 to 4 m radius. The root density of these trees nearly could not be detected by TRU in 6-meter radius, because the root diameter is less than detection range of TRU. To avoid the mutual influence, the planting space should be more than 4 to 6 m for trees. For instance, it is necessary to remove trees from the forests with high planting density, or to control the horizontal growth of the root system using the root barrier technique.
In addition, when transplanting trees, distribution and size of root system of trees could be considered when digging the soil ball. The horizontal direction of root fracture range of trees should be more than a radius of 1 m, and more than 2 m for large trees, with the soil depth deeper than 60 cm.
Based on the relationship between root characteristics of tree roots and soil porosity, as well as infiltration capacity, a new suggestion could be provided for layout of trees in green space design with certain functions. For example, green space in environment with high degree of pavement, as roads or square, undertake the traffic, gathering, distributing and recreational functions, which leads to heavy runoff and pollution. Moreover, due to disturbance of human activities, the soil bulk density of this kind of green space is relatively large, and there is conflict between plant root system and pavement, which might cause the ground uplift, rupture and blockage of soil porosity. As the green space is limited, it is advisable to choose trees with vertical and deep root distribution, such as E. decipiens, K paniculate, and M. glyptostroboides.
However, green spaces with large areas, such as parks, have more comprehensive functions, which affect the layout of trees. The green space in parks could be divided into two kinds as the green space with higher frequency of trample and the one with lower frequency.
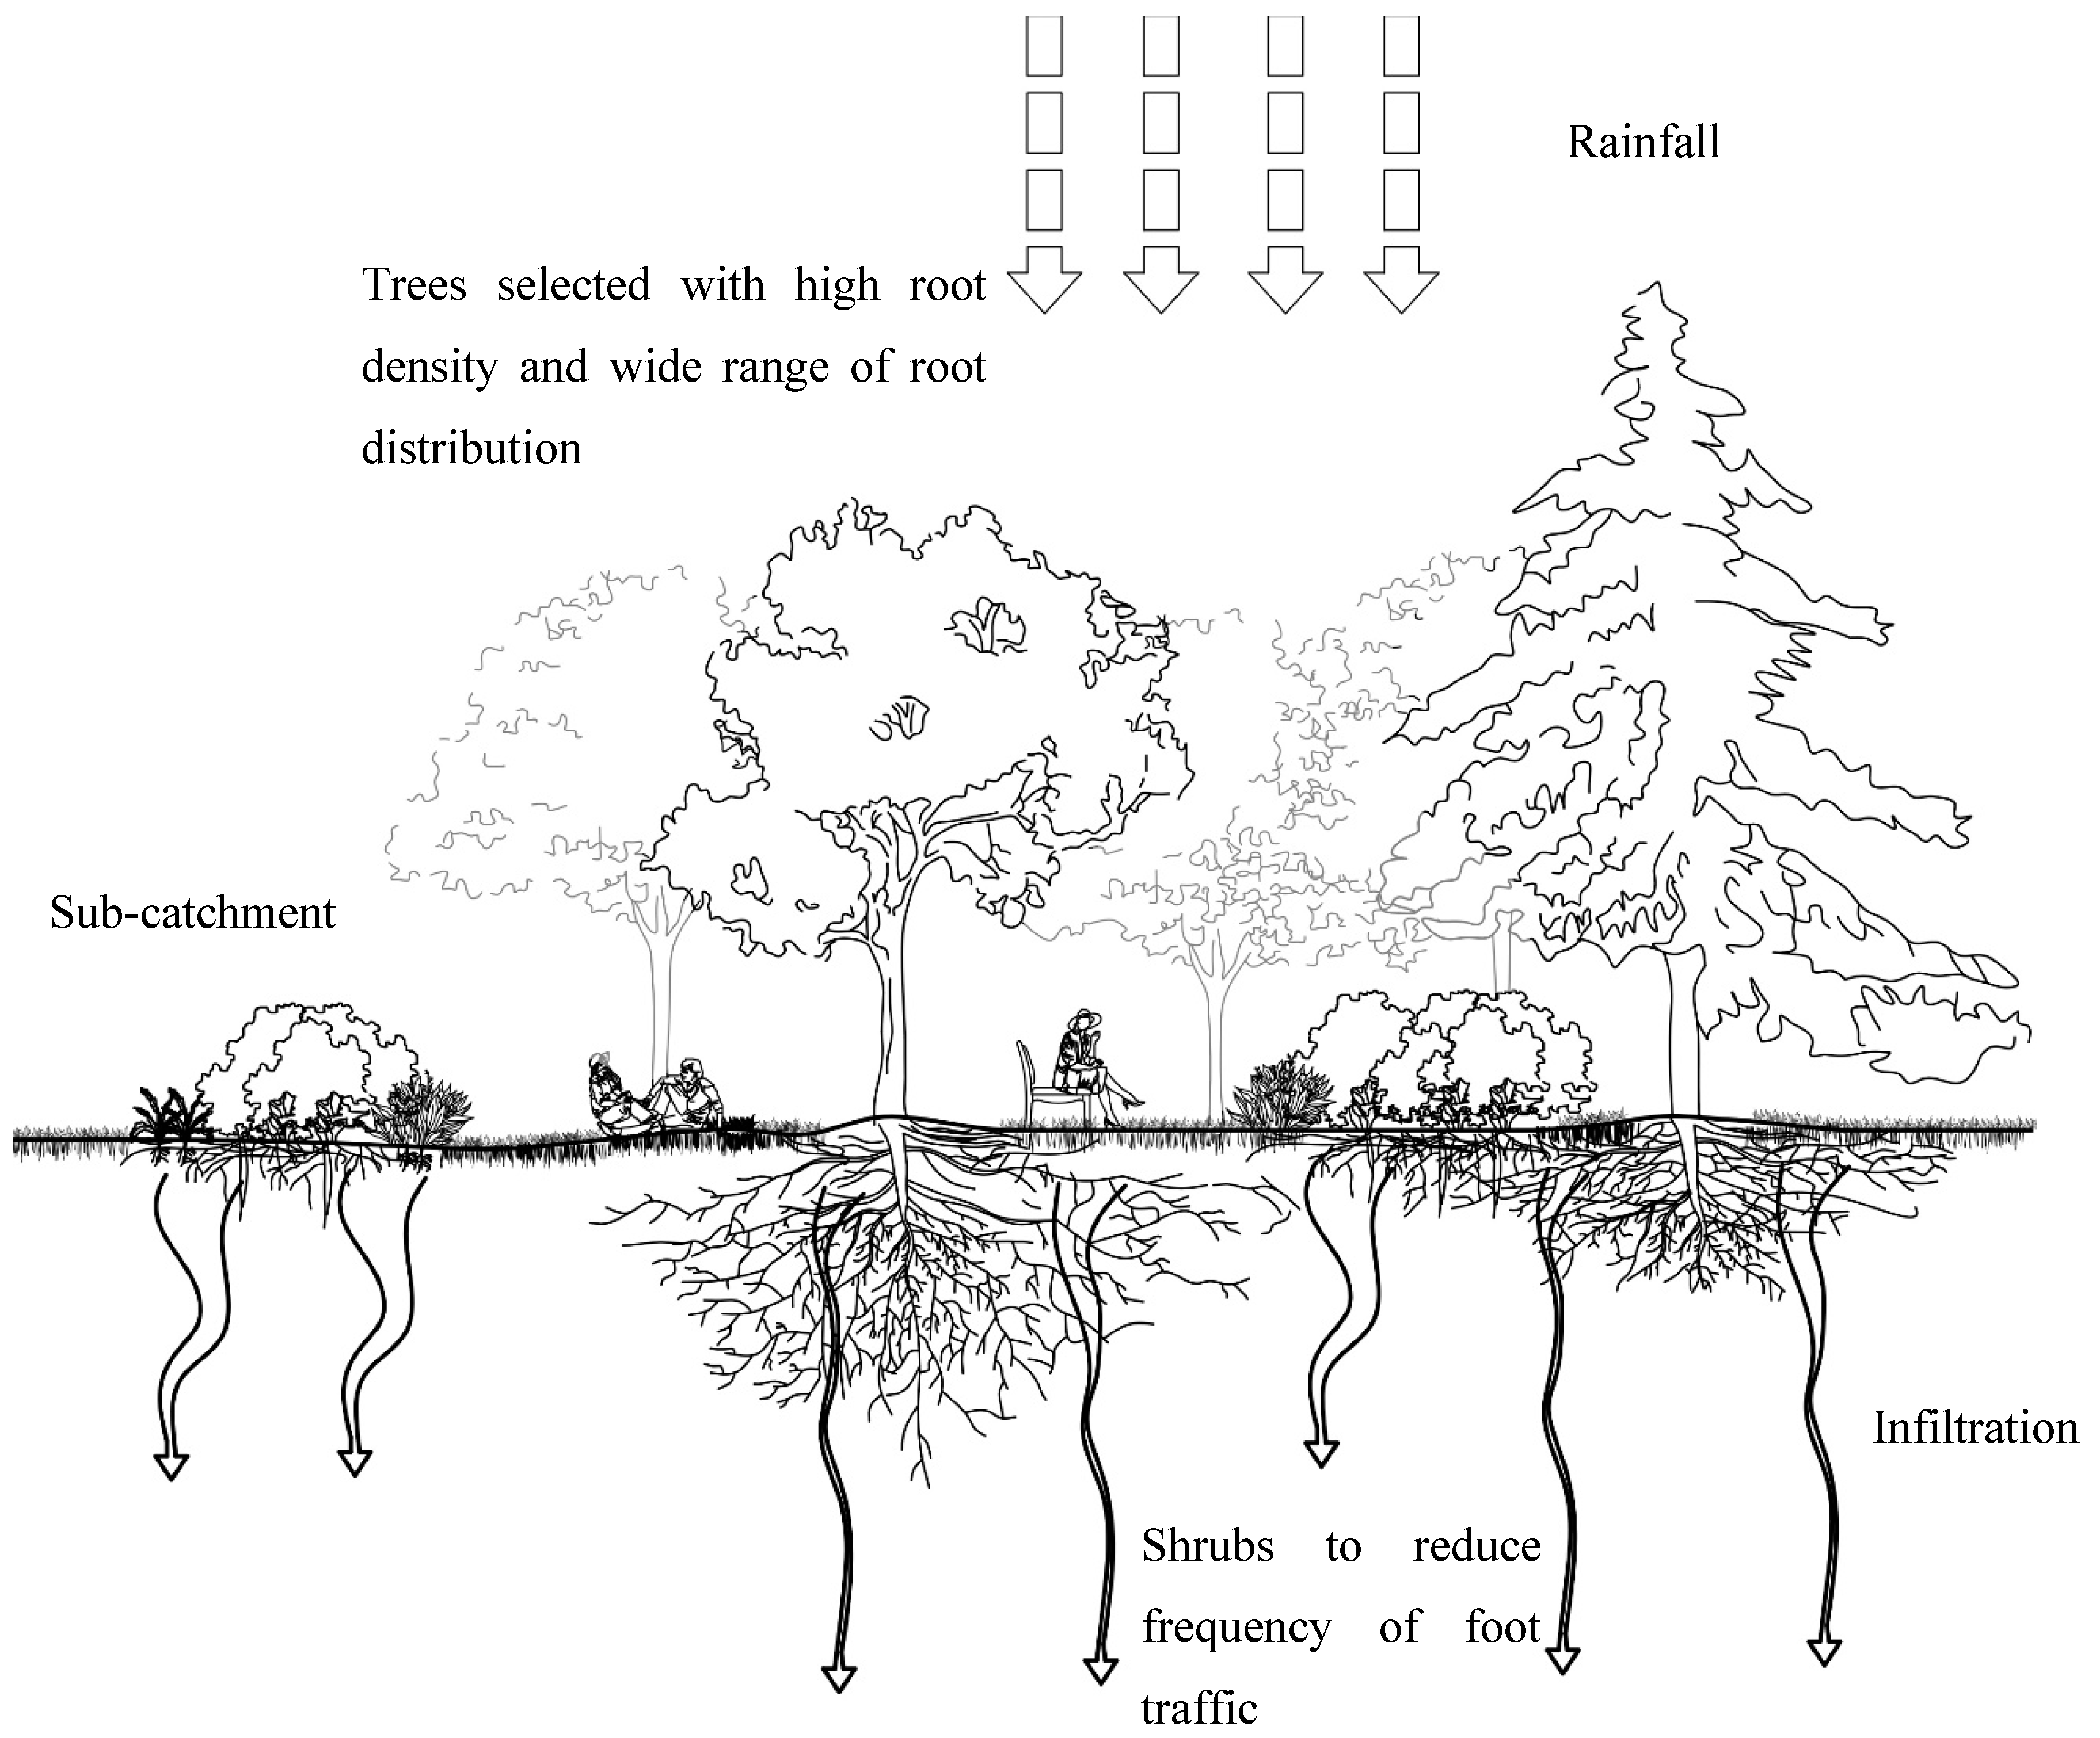
As to the high stamping frequency, the soil bulk density in green space is greater, and the soil porosity is lower, especially in the shallow soil slices. Considering the improvement of soil physical porosity, it makes sense to plant trees with high root density and wide range of root distribution, such as
C. camphora,
M. grandiflora,
Z. serrata and
P. orientalis, with dense root distribution, fast growing rate and strong resistance (
Figure 7). However, for trees such as
C. deodara, the roots of which are concentrated in the topsoil, their root system is more sensitive to soil trampling and compaction. As a result, it is important to focus on the maintenance and management, for instance, to periodically perforate and ventilate the topsoil around trees, or plant shrubs and herbs in 2-m-distance away from the tree trunk, to reduce the trampling frequency in this area.
While, for green space with low frequency of foot traffic and visitors flow rate, such as green space in university or green buffer, this kind of green space aims at high ecological function. There are not too much activities happening in this kind of green space. Therefore, the ecological benefits are more important, and the key of landscape trees design is to ensure a certain proportion of megaphanerophyte, control the space among trees between 4 to 6 m, and layout plants with different spatial distribution types, in order to maximize the benefits of root systems on soil physical conditions. Mixed forests could be formed with trees, the root systems of which are distributed in deep and shallow soil slices, vertical and horizontal types, to utilize the underground space beneath green space, forming a dense and uniform distribution network of root systems, to promote soil porosities and infiltration. For example, trees with shallow roots like O. fragrans could be matched with deep-root ones such as K. paniculate, Z. serrata, C. camphora, M. glyptostroboides, C. deodara and P. orientalis.
According to the experimental results, with the increase of soil depth, the bulk density increased, and the soil total porosity and non-capillary porosity decreased. The correlation is significant between the distribution of tree roots and these three physical properties of soil. The difference of root distribution and root density of trees significantly affects the soil porosities and water holding capacity. The soil porosity and infiltration capacity increased with the raise of root density. Therefore, the root density and distribution type could reflect soil infiltration performance, which might be used as an important parameter to evaluate soil infiltration capacity.
Through the correlation analysis of the root density and soil physical characteristics, it is shown that the tree with shallow and horizontal root system has a greater impact on soil porosities, especially on the soil depth slice of 15 to 30 cm. In additional, the distribution of tree roots could affect initial and stable permeability of soil. By principal component analysis, the infiltration capacity of root system could be ranked for trees commonly used in green space, Shanghai, as
K. paniculate,
Z. serrata,
C. camphora,
M. glyptostroboides,
C. deodara,
P. orientalis,
M. grandiflora,
E. decipiens,
O. fragrans,
L. lucidum. As
Table 7 showed, the infiltration capacity of trees could be classified according to the root density and spatial distribution type, which might provide a list of suitable plants for different soil condition in green space, Shanghai.


