1. Introduction
For most electricity utility companies, ensuring grid reliability, efficiency, and security is a major task. As electric-power grids develop and electrical load profiles change, pressure is being put on electricity transmission and distribution grids, thereby making the need for voltage reinforcement and electric-power grid management much more demanding. Electric-power utility authorities worldwide face many new electricity grid challenges and circumstances, including changes in electric-power production mix, decreases in traditional power production, increases in renewable power production and distributed generation, changes in environmental and regulatory policies, and the retirement of traditional thermal producing stations. These challenges have an operational effect on electric-power infrastructure, particularly bringing about a general inadequacy in reactive power compensation, voltage stability, power system inertia, and low short-circuit strength. As compared with traditional power sources, wind renewable power has a reputation of strong randomness, intermittency, and volatility. It shares the intermittent feature of renewable power sources which are controlled by environmental elements, such as instantaneous changes of weather, that eventually give rise to voltage and frequency instability. Application-related instances prove that connecting wind power plants to existing electricity grids has an adverse effect on the security and stable operation of modern electrical power systems [
1,
2,
3,
4,
5]. High impedance of a fragile or weak electricity grid connection limits the output power of a wind plant operating at unity power factor. This limitation can be reduced by adequately providing high reactive power compensation with the help of synchronous condenser technology. Although it is feasible for Type-4 wind power plants to produce the requisite reactive power compensation, this technique can appreciably increase the active power rating need and hence reduce the cost of wind power plants and control inverters, since only Type-3 wind power plants are involved in this instance [
6].
Synchronous condensers (SCs) were once generally put to practical use as a means of supplying reactive power compensation to power grids before the introduction of power electronic devices. The benefits of the synchronous condenser solution are that it is a long-standing, well-known, and well-understood technology. It is a very resilient solution, can have high overload capacity, and can provide excellent reactive power support for the grid under low-voltage situations. Synchronous condensers are an origin of short-circuit availability, which can be a significant benefit in weak electric-power grids, and they are not sources of harmonics. The drawbacks of the synchronous condenser include a higher level of losses, slower response time as compared to power electronic devices, and mechanical wear [
7,
8,
9,
10,
11,
12]. Synchronous condensers have been utilized conventionally in the electric-power industry to support weak electricity grids with poor voltage regulation. Static power electronics equipment, such as static VAR compensators (SVCs) and static synchronous compensators (STATCOMs), are now frequently utilized for reactive power production, and these static power electronics devices provide faster responses [
13,
14,
15]. Under certain electric-power grid fault circumstances, SCs provide higher reactive power compensation, and, more significantly, the kinetic energy stored in the rotor makes available inertial assistance to the electricity grid during fault conditions [
16,
17,
18,
19]. The inertia support ability of SCs becomes more significant as the electric-power grid connection needs, such as low-voltage ride-through for distributed generation networks, become stricter and SCs are needed to supply additional services to support electric-power grid stability [
1,
20]. With the continuous growth of the scale of wind power plant inclusion in electrical networks, the interconnection of wind renewable plants with electricity grids has brought remarkable drawbacks for electric-power system dispatching. Apart from the operating situation, wind plants are susceptible to many other factors, such as component faults, weather problems, power system disturbance, etc., that pose a growingly conspicuous threat to power system stability [
21,
22,
23,
24,
25,
26,
27,
28,
29,
30,
31]. Therefore, active and reactive power assessment methodologies and mechanisms have become a top priority among stakeholders in the electric-power industry.
This research work developed a methodology to generate active power by utilizing the Type-3 wind plant and reactive power by using the synchronous condenser, particularly on a 33-kV power network. To scrutinize the successfulness of the suggested methodology, it was applied to an interconnected power system with proliferated wind renewable electricity production. This paper should help to put in place strict guidelines for electricity network operators to make better use of synchronous condensers for reactive power generation and the Type-3 wind plant for active power generation, which will at long last pave the way for further integration of wind power plants into the electricity grid.
The remaining part of this article is organized in the following manner. In
Section 2, the vulnerability of the modern grid as a result of high penetration of wind power plants is discussed. In
Section 3, the benchmark case setup of the research is given. This consists of the benchmark line parameters, the benchmark transformer parameters, the benchmark load and three-phase lines parameters, and implementation of the benchmark case using MATLAB/Simulink software.
Section 4 explains the methodology used in this study and explores data from the simulation setup.
Section 5 presents the mathematical model of the system.
Section 6 illustrates a vivid case study, and
Section 7 provides the results and discussion of the study case. Conclusions are presented in
Section 8.
2. Vulnerability of the Modern Grid as a Result of High Penetration of Wind Power Plants
Independently and in combination, increasing grid voltage instability, reactive power control, short-circuit strength, power system inertia, frequency control, etc., affect the ability of the modern grid to effectively make use of high renewable energy penetration systems such as wind power plants. These also affect the demand for electricity and ability to access, produce, and distribute it. An evaluation of these impacts, both positive and negative, is needed to inform forward-looking endeavors to increase power system security. These effects occur and affect all modern electricity grids and the vulnerabilities faced by various stakeholders in the power industry may vary remarkably depending on their degree of specific exposure to wind renewable power penetration. In general, large-scale wind farms, consisting of many wind power plants, often cover large areas. When wind plants run at nearly full power, the voltage drop of the lines becomes significant [
32].
With the increasing share of wind renewable power plants in the present-day electric-power production mix, traditional fossil-fuel-based synchronous generators continue to be substituted from the electric-power production fleet. The high availability of wind power may equally be accountable for the planned retirement of thermal power plants. Nowadays, wind power plants are mostly based on Type-3 and Type-4 machine plants. These variable-speed wind plants are decoupled from the corresponding electricity grid by power electronic converters. Different from synchronous generators, some types of wind plants are not able to play a part in frequency control activities such as inertia and governor response after a disturbance [
33,
34,
35,
36,
37]. Although several control methodologies have been developed to allow Type-3 and Type-4 wind plants to be used for frequency regulation [
38,
39], such solutions are still not mandatory and normally do not operate for the Type-3 wind plant. Thus, owing to increased wind production, sustaining enough frequency response has become of vital concern for network operators. Aside from frequency response, short-circuit operation is one more vital issue in power system security owing to higher wind renewable power penetration on the grid [
40]. Short-circuit operation is determined by making use of an indicator called the short-circuit ratio (SCR). The short-circuit ratio at the electric-power grid connection point or point of common coupling (PCC) of a wind power plant is defined as the ratio between the short-circuit level at its PCC and the rated efficiency of the wind power plant [
41]. A minimal value of SCR at the PCC of a wind power plant is necessary for protection equipment to determine the development of a fault. Owing to the limitation of power electronics efficiency, Type-3 and Type-4 wind power plants commonly generate less fault current compared with traditional synchronous generators of equivalent rating [
42]. Consequently, the possibility of obtaining undesirable SCR at the PCC of a modern grid with wind plants very much increases for high penetration of wind machines [
43]. The insertion of large numbers of wind renewable power plants has changed the robustness of alternating current (AC) grids and made the electric-power grid ineffectual, which is marked by a low SCR or low inertia [
44]. SCR is closely associated with voltage stability, so the lower the level the SCR of wind power plants at the PCC, the quicker the response to voltage fluctuation. This leads to instability and, occasionally, to wind plants tripping, resulting in a breakdown of grid stability [
45], mostly in situations where a large concentration of wind power plants is joined to a relatively weak electric-power grid [
46,
47,
48].
It is obvious from the foregoing that, in most situations, frequency response and short-circuit functioning are scrutinized as separate issues. Traditionally, they are individually enhanced when necessary. Regardless, both are related to modern grid security as a result of high wind plant penetration and should be simultaneously considered. Owing to the accumulative entrance of wind power plants on today’s modern grids, most thermal power plants may be subjected to planned retirement [
49]. These traditional power generators may perhaps be taken out, which would result in a misuse of assets and lead to economic concern. Thus, a second use of these traditional plants could be anticipated in order to achieve some monetary return. For this reason, there is a need for retrofitting a reasonable portion of these synchronous generators into synchronous condensers. As a result of the utilization of new SCs or synchronous generators being retrofitted to SCs and joined to existing electricity substations to provide the required functionality of reactive power compensation, additional inertia and short-circuit current are made available to the grid, which in turn improves the security performances of the grid in case of high wind plant generation [
43].
5. Mathematical Model of the System
Considering the MV substation system (
S.
S1) and its vector components:
where:
is the apparent power of the substation system;
is the total line current of the substation system;
is the line current supplied to n number of power lines from the substation network;
is the apparent power supplied to n number of power lines from the substation network;
(i.e., n number of lines).
Hence, for n number of lines that supply n number of loads on the end of the line from the MV substation, the set of transformer and load is equal to the total number of loads. Thus, the total apparent power of each n number of sets is , where (i.e., number of loads). Therefore, line number = each load number.
is the active power supplied to n number of lines;
is the active power losses of n number of lines;
is the active power of n number of lines.
The power losses on the line is given by
The difference in voltage (voltage drop) of each phase is given by
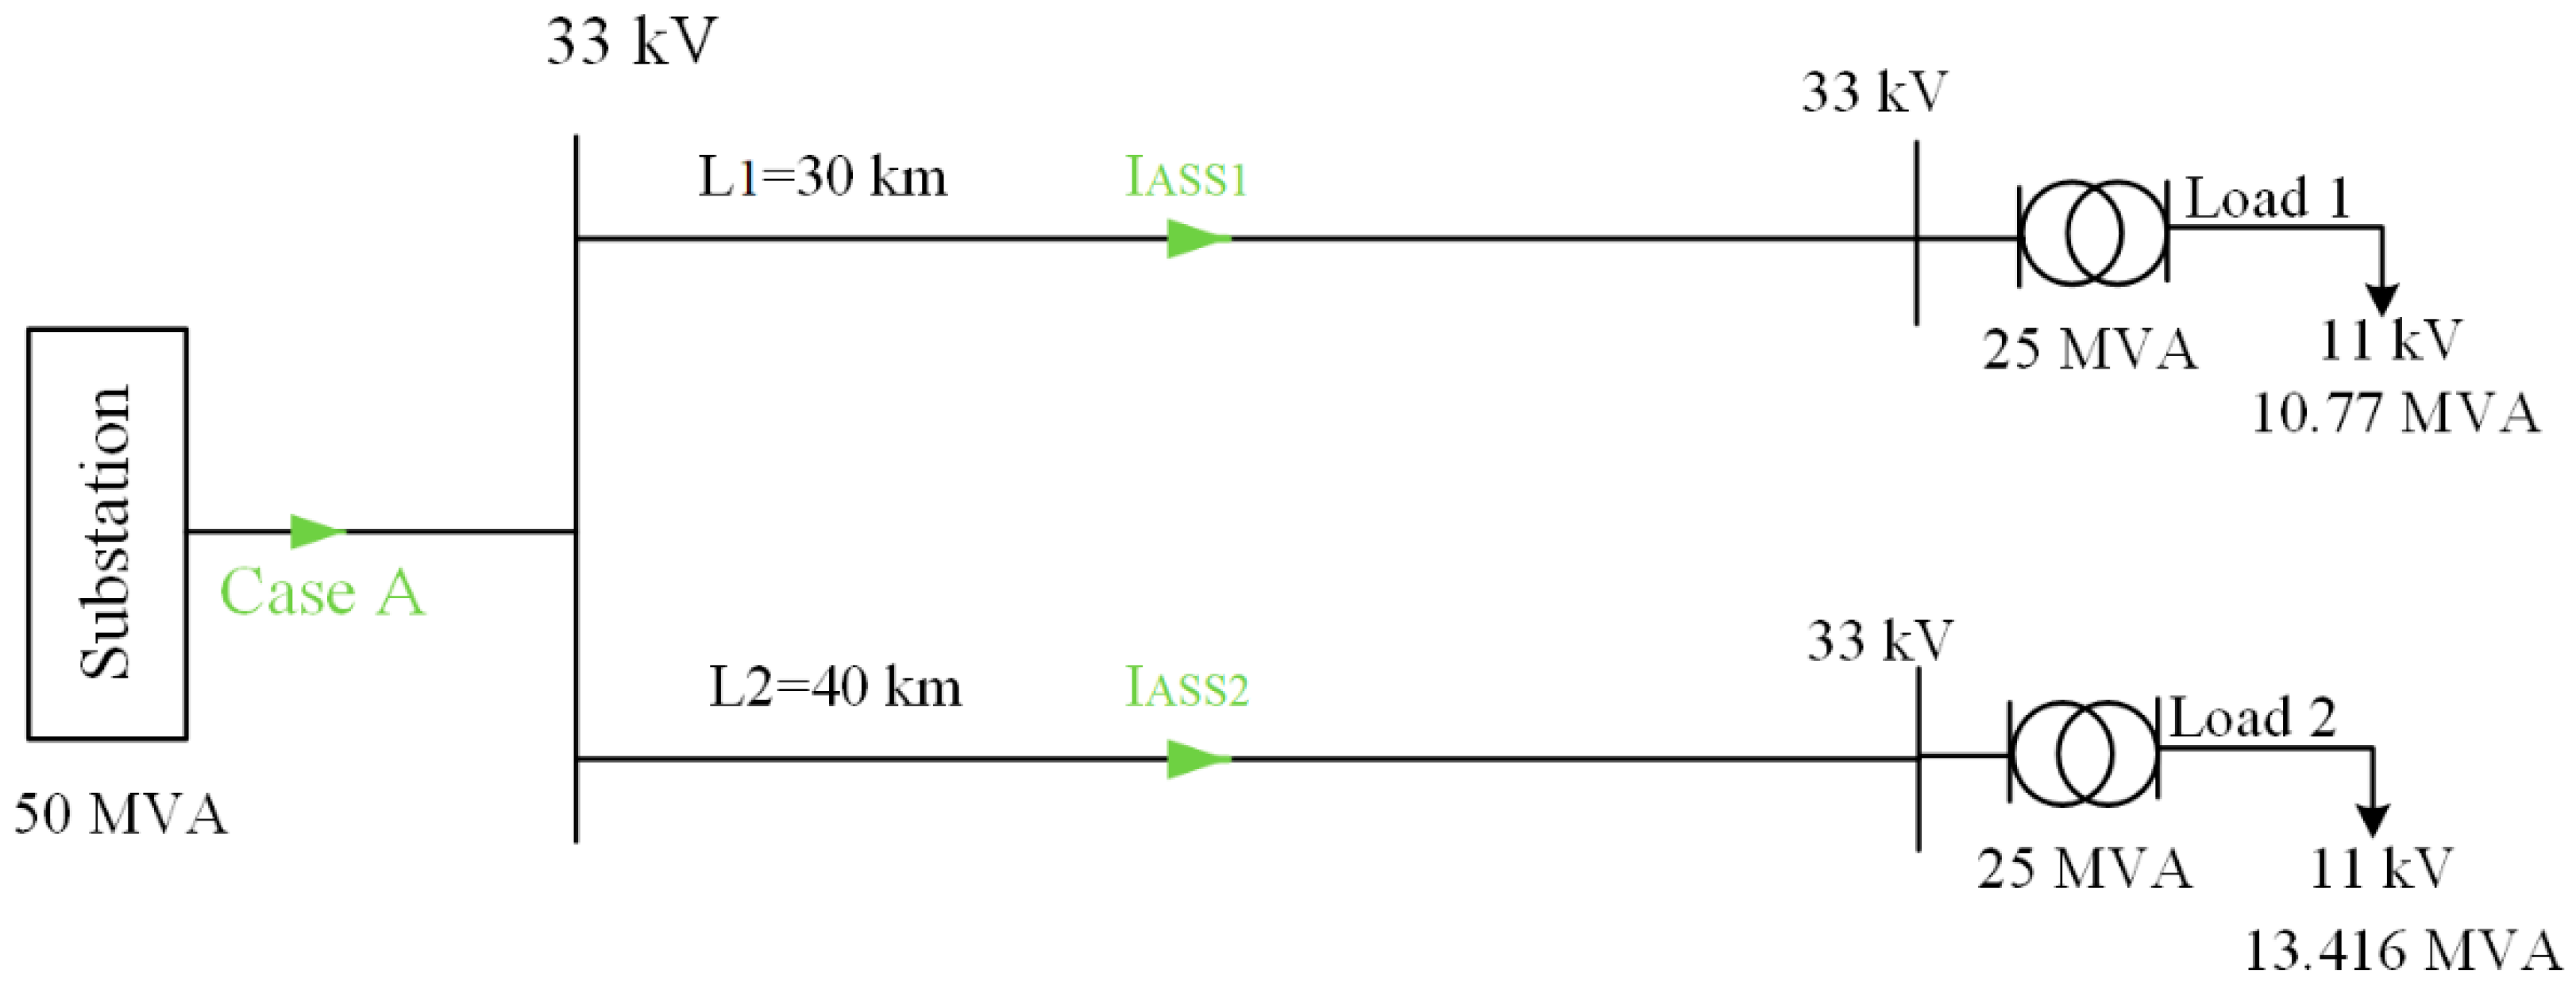
Considering Case A only, and from Equation (5) and
Figure 2:
Consequently, power losses for
n number of lines for Case A will be
where:
is the line current for n number of power lines, which equals for Case A;
is power losses of n number of lines for Case A.
Therefore, the total losses of
S.
S1 for Case A will be
Similarly, from Equations (6) and (9) and
Figure 2:
where:
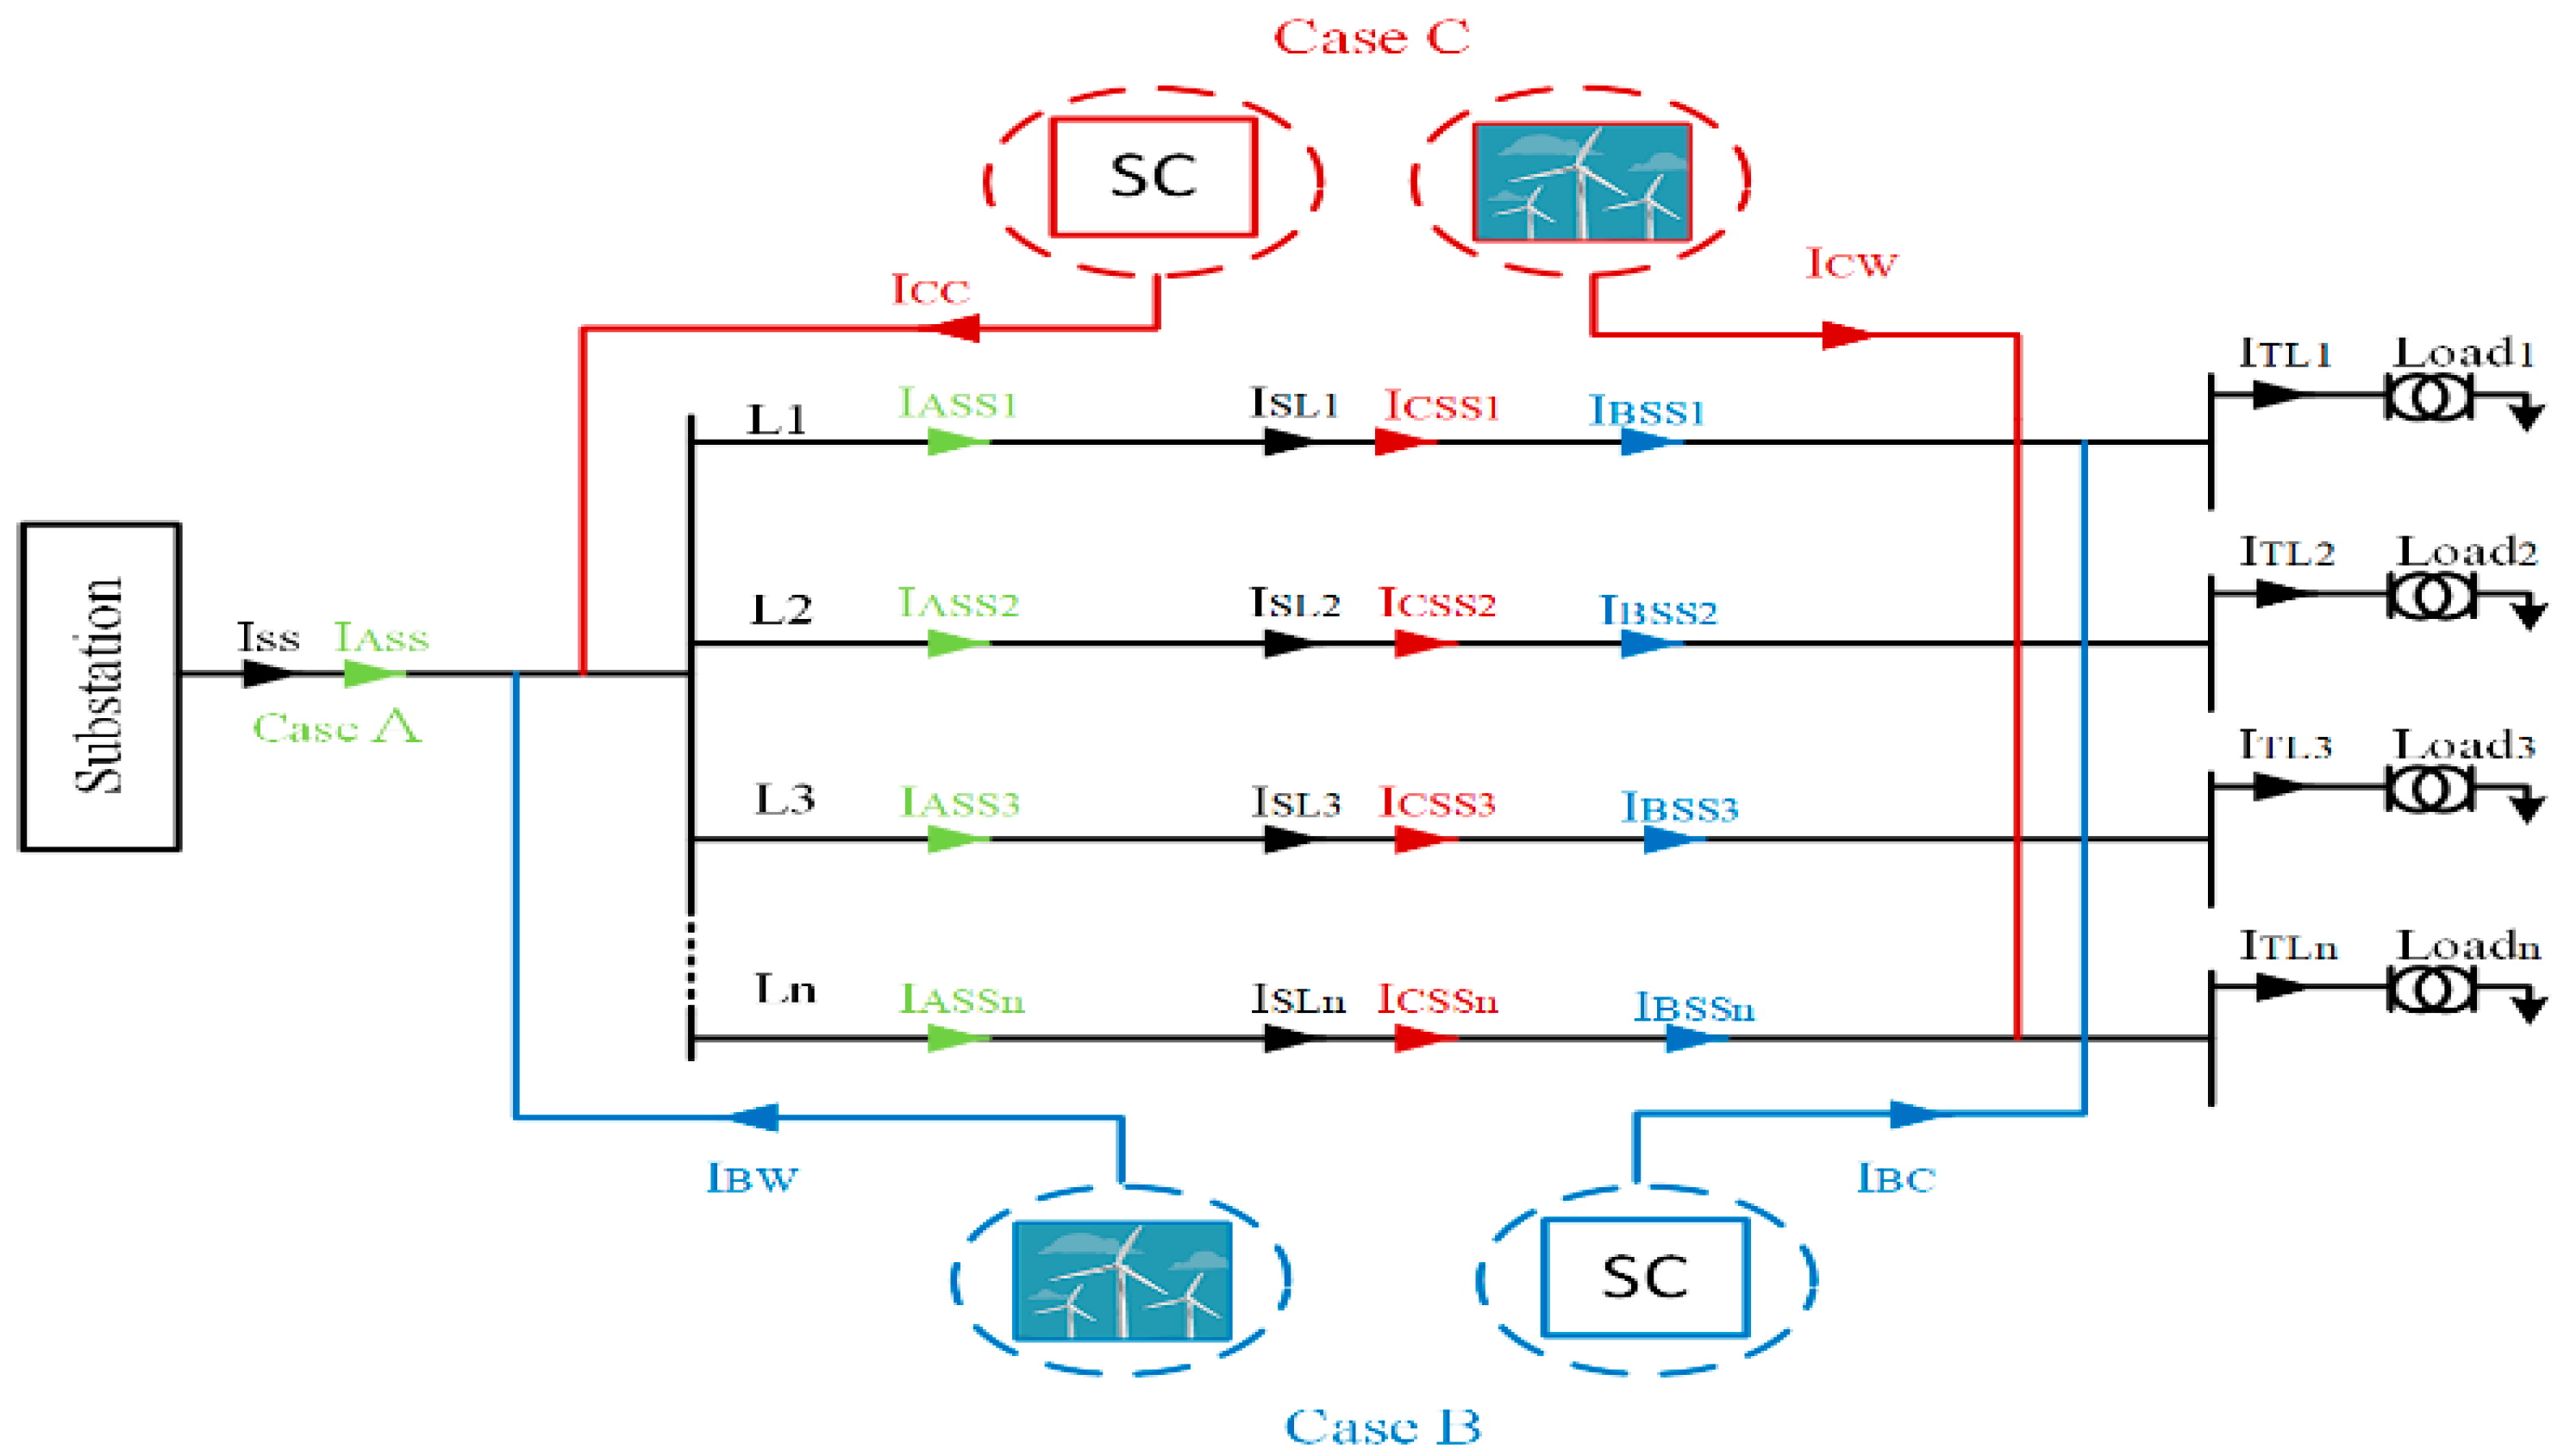
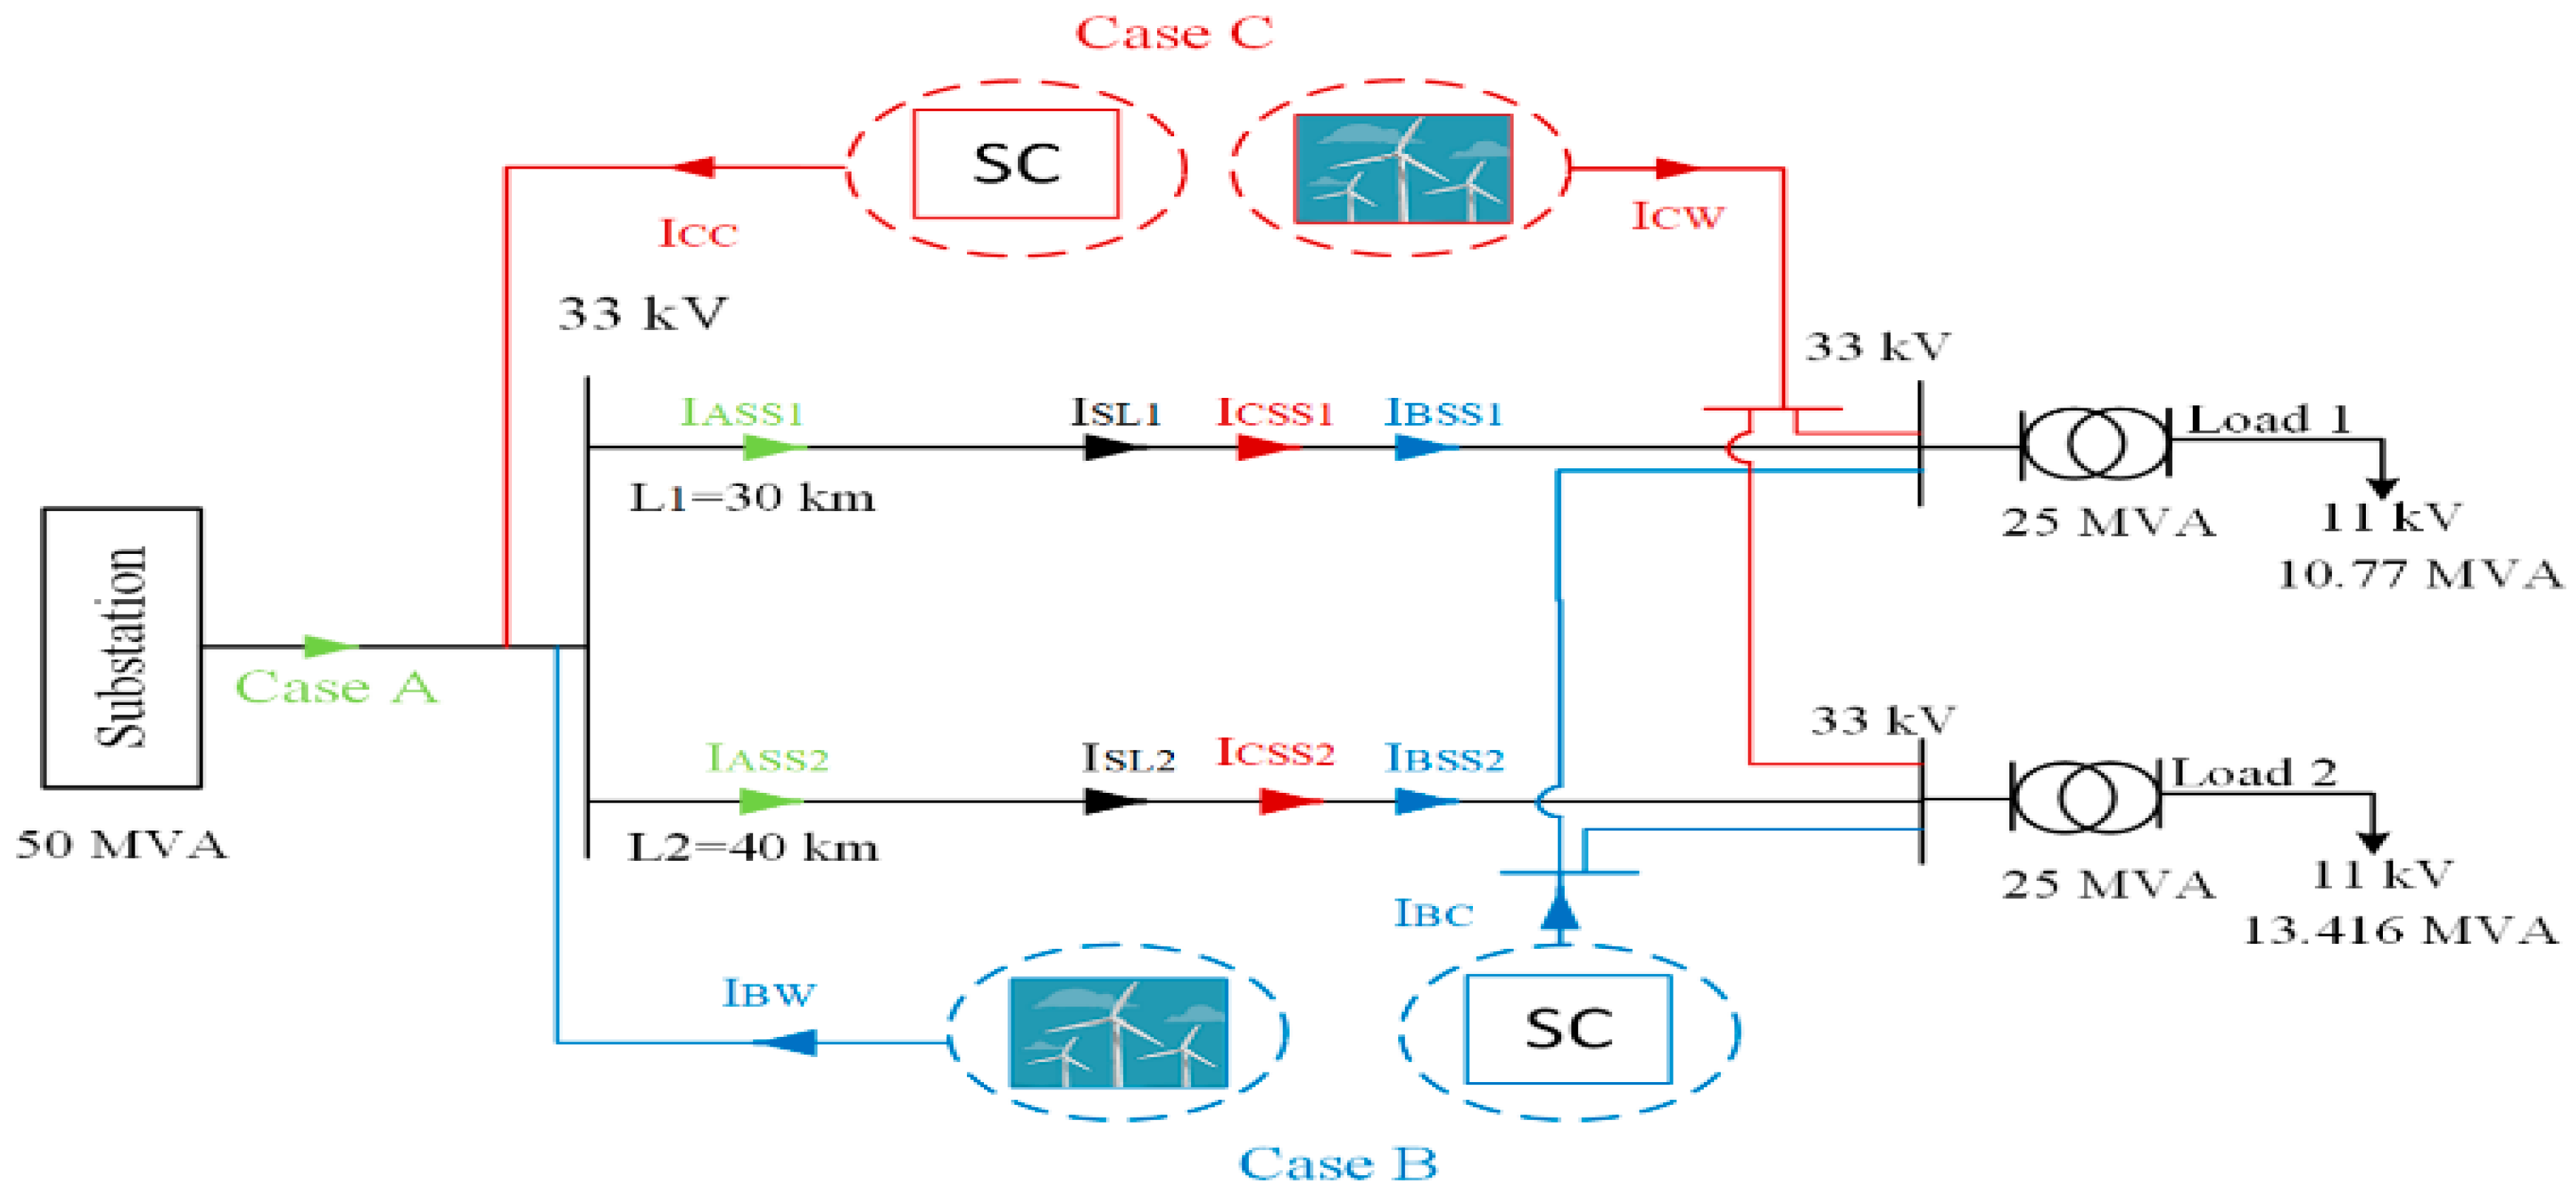
Also, considering Case B, the wind power plants are connected to the bus bar, which supplies all transmission lines, and the synchronous condenser is installed at the end of the MV transmission lines, as shown in
Figure 2. Applying Kirchhoff’s current law:
where:
: wind plant line current;
: synchronous condenser line current;
: total substation line current of Case B.
From Equation (12) and the vector directions of the wind power plants and synchronous condenser parameters in
Figure 2:
where:
is a constituent of the wind power plant line current going through n number of lines;
is a constituent of the synchronous condenser line current going through n number of lines;
is the new line current supplied to n number of power lines of Case B.
From Equations (5), (12), and (13), the power losses for
n number of lines of Case B is written as
where:
is the power losses for n number of lines of Case B.
Therefore, the total losses of
S.
S1 for Case B will be
Similarly, from Equations (6), (12), and (13) and
Figure 2:
where:
is the voltage drop of n number of lines of Case B.
In the same vein, considering Case C:
The synchronous condenser is installed into the bus bar, which supplies power to all sections of the MV transmission lines, and the wind machine is connected to the end of the transmission lines, as shown in
Figure 2. Applying Kirchhoff’s current law:
where:
: wind plant line current;
: synchronous condenser line current;
: total substation line current of Case C.
From Equation (19) and the vector directions of the wind power plants and synchronous condenser parameters in
Figure 2:
where:
is a constituent of the wind plants line current going through n number of lines;
is a constituent of the of synchronous condenser line current going through n number of lines;
is the new line current supplied to n number of power lines of Case C.
From Equations (5), (19), and (20), the power losses for
n number of lines of Case C is written as
where:
is the power losses for n number of lines of Case C.
Therefore, the total losses of
S.
S1 for Case C will be
Similarly, from Equations (6), (19), and (20) and
Figure 2:
where:
is the voltage drop of n number of lines of Case C.
7. Results and Discussion
Load 1 simulations were executed at several active power levels of 0%, 20%, 40%, and 60%, while the reactive power levels were 0%, 25%, 50%, and 75% respectively, as depicted in
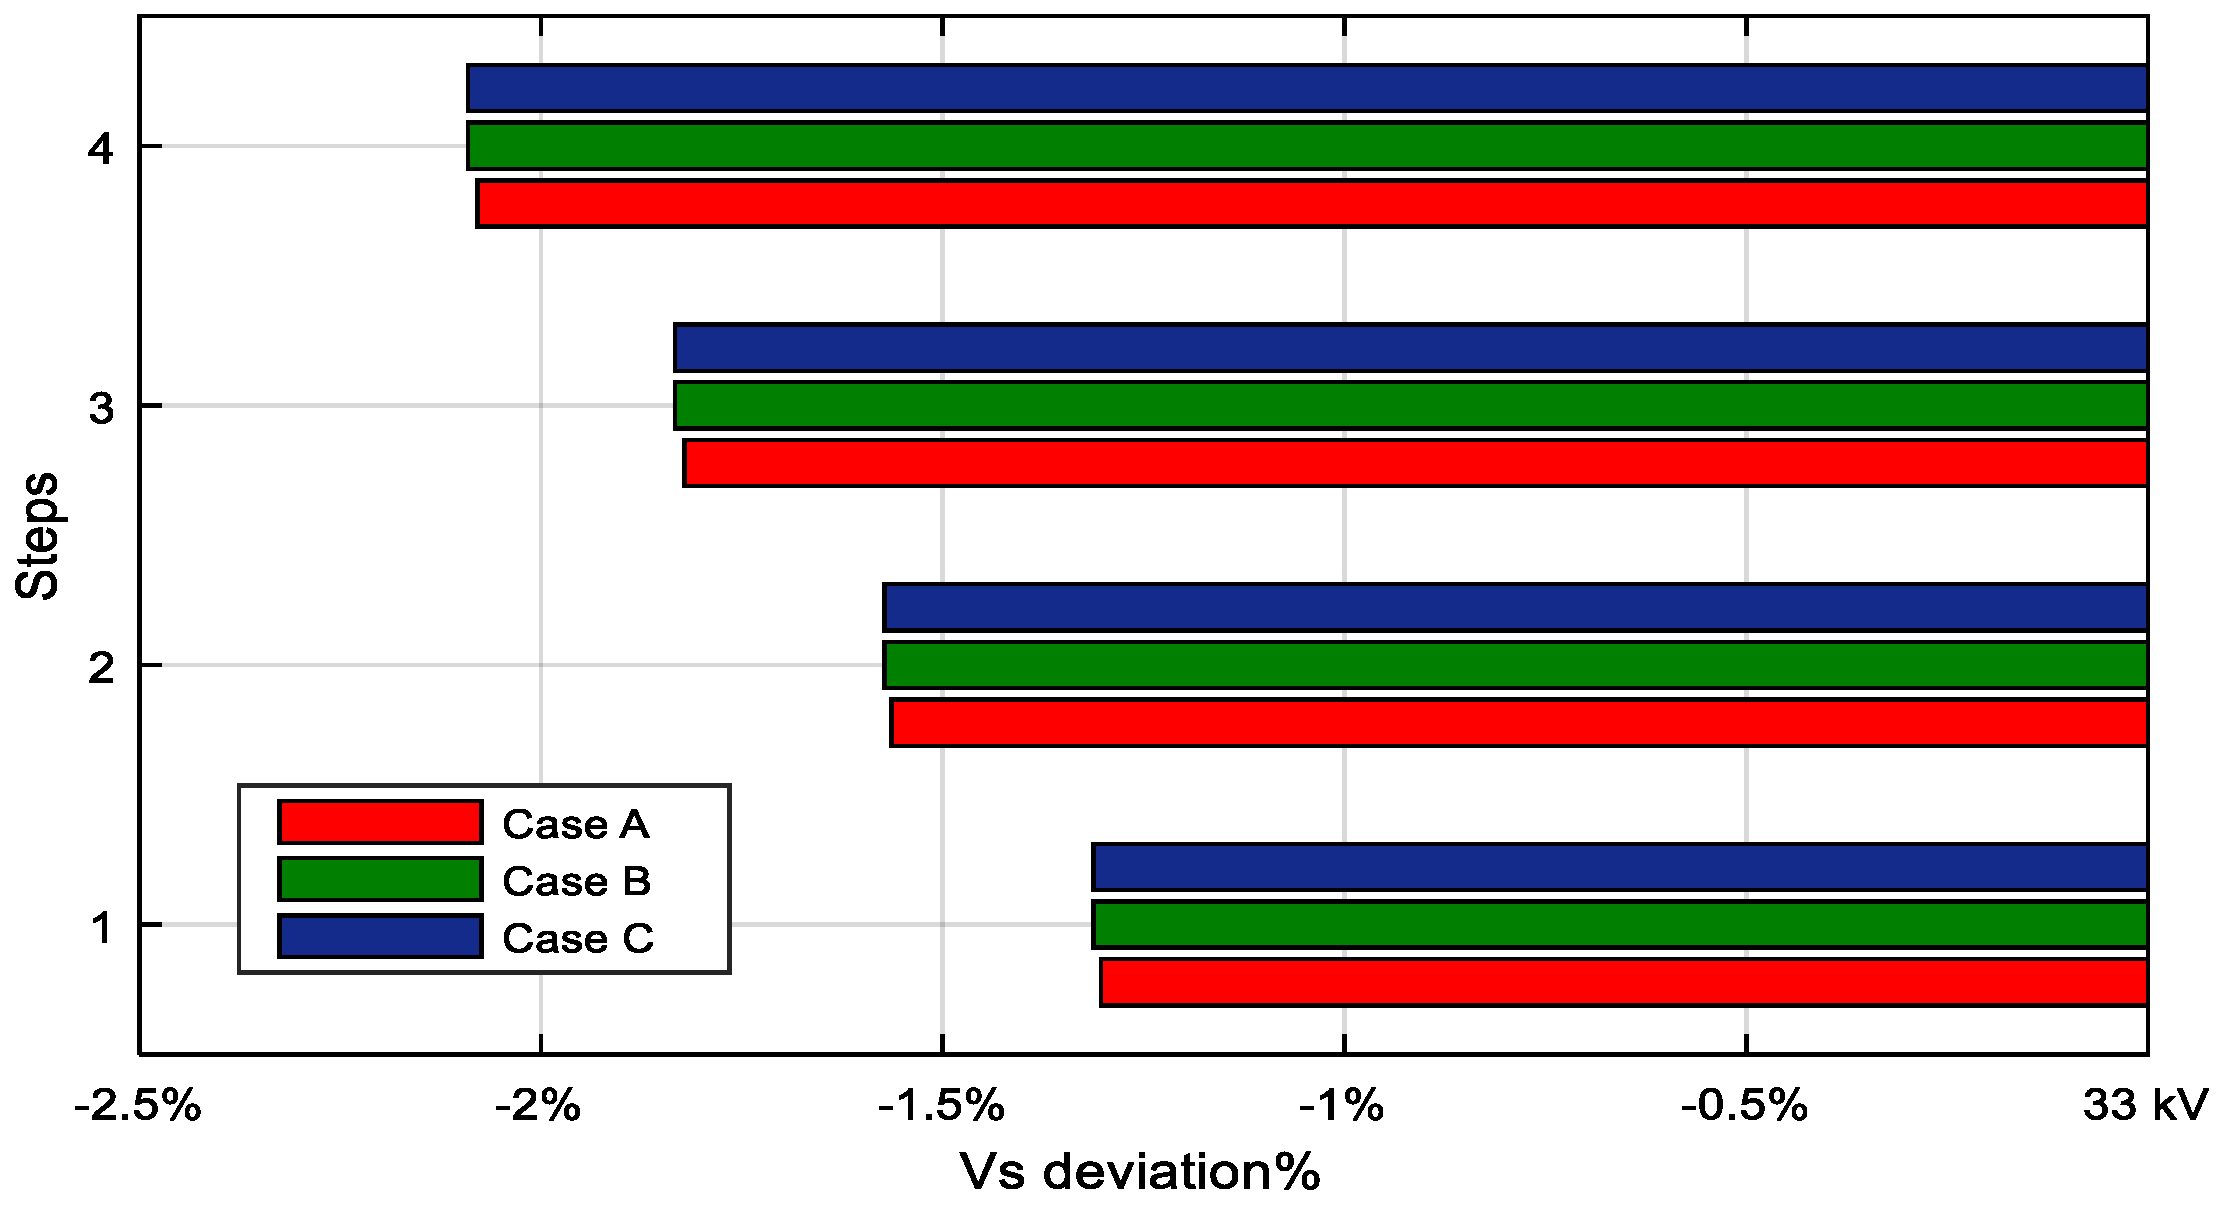
Table 5. The apparent power levels were 0%, 20.71%, 41.43%, and 62.15%. For load 2, active, reactive, and apparent power levels were of 0%, 16.67%, 33.33%, and 50%, implying that the same level of increment was used for the various steps. The percentage of sending voltage deviation from the nominal voltage of 33 kV for different steps in Cases A–C is presented in
Figure 4. It shows that the differences between Cases A–C were very small and unremarkable. It also depicts that the load increase in each step brought about an increase in the sending voltage deviation from the nominal voltage value of 33 kV. Equally,
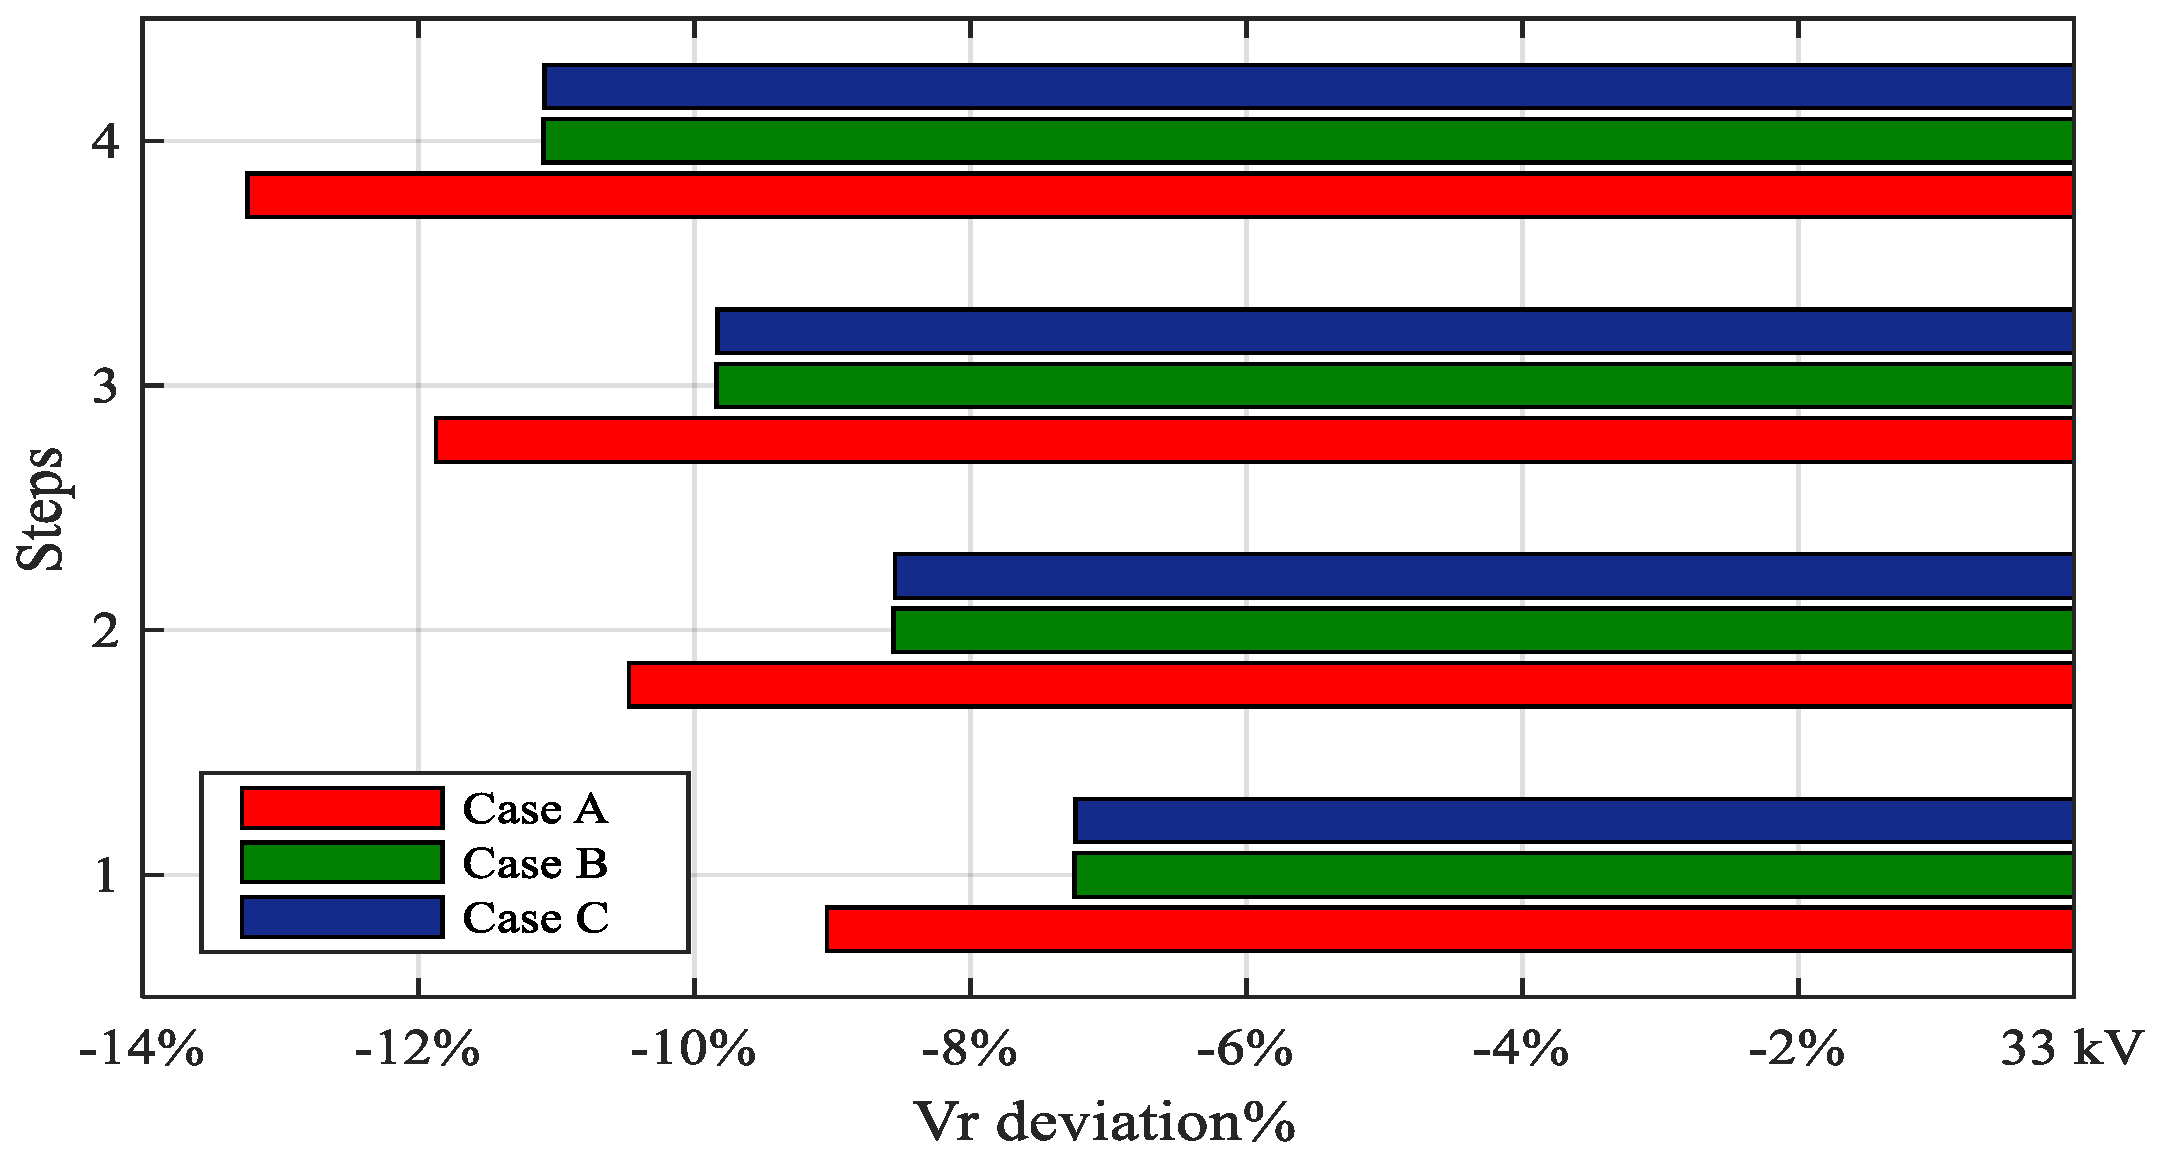
Figure 5 shows that the deviation of receiving voltage in Cases B and C was lower than that of Case A owing to the power injected onto the grid at the end of the 33 kV MV transmission lines. It can be noticed that deviations in Cases B and C were very close to each other.
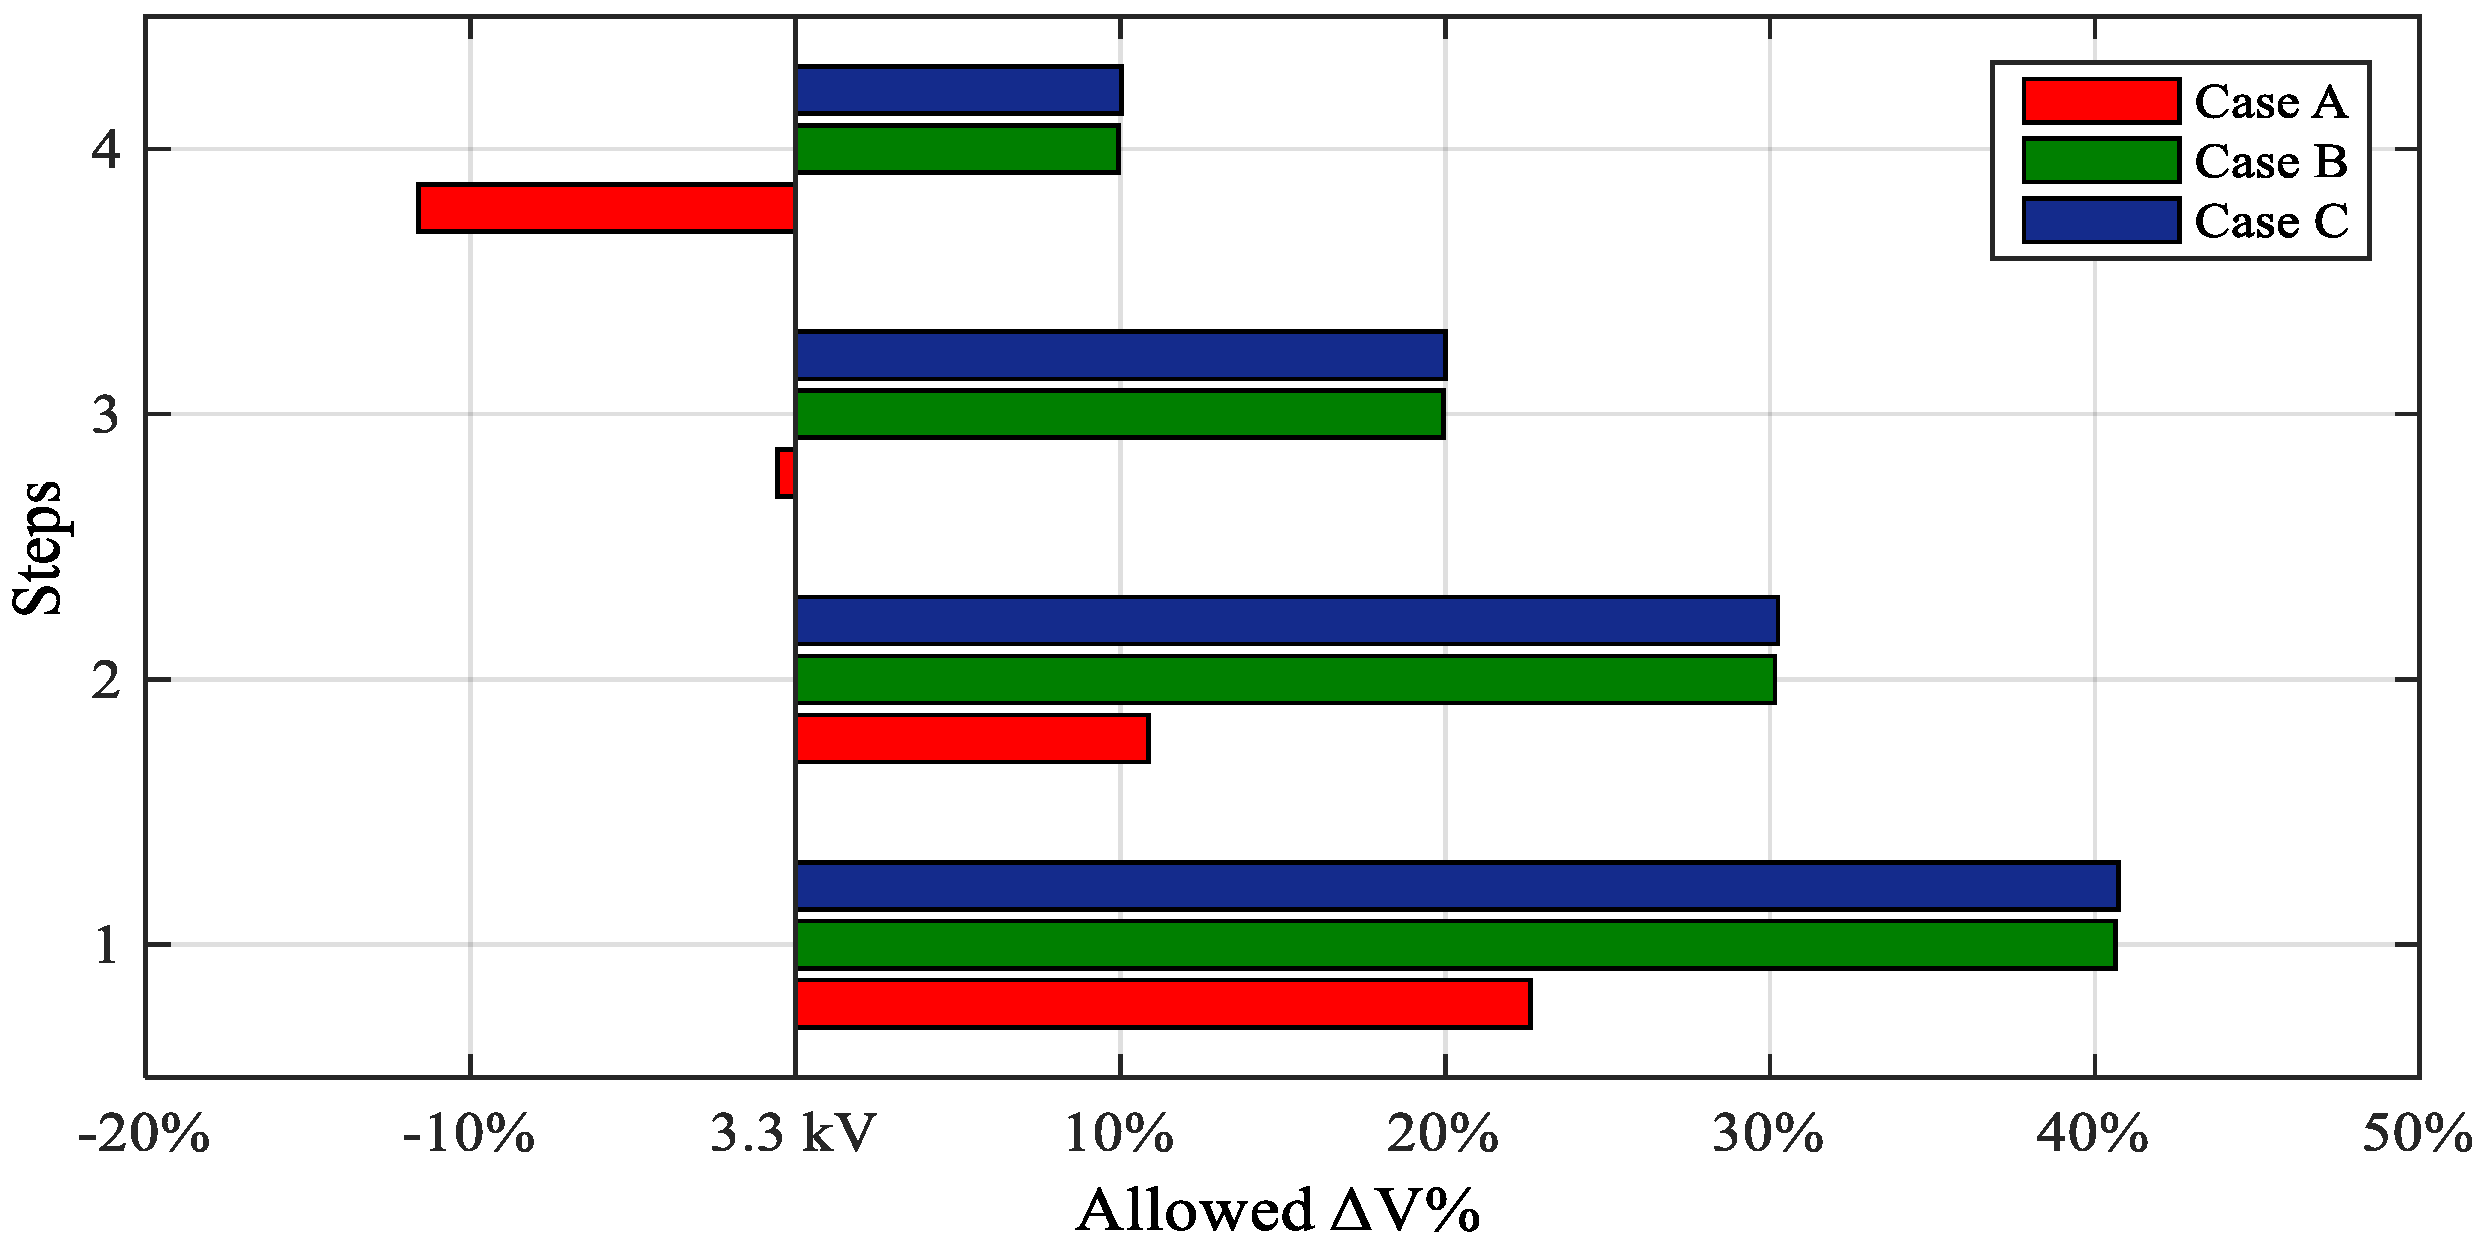
The performance of the wind plant and the synchronous condenser as regards to the percentage of allowed additional voltage drop for different steps in Cases A–C is plotted in
Figure 6; it shows that the percentage of allowed additional voltage drops of the lines before the voltage drop exceeded 3.3 kV, which is 10% of the nominal voltage. Here, the maximum allowed voltage drop was 3.3 kV, and visibly, the safety margin of Cases B and C was higher than that of Case A. Meanwhile, the achievable voltage drops in steps 3 and 4 did not exceed 3.3 kV, going by 1% for step 3 and 12% for step 4.
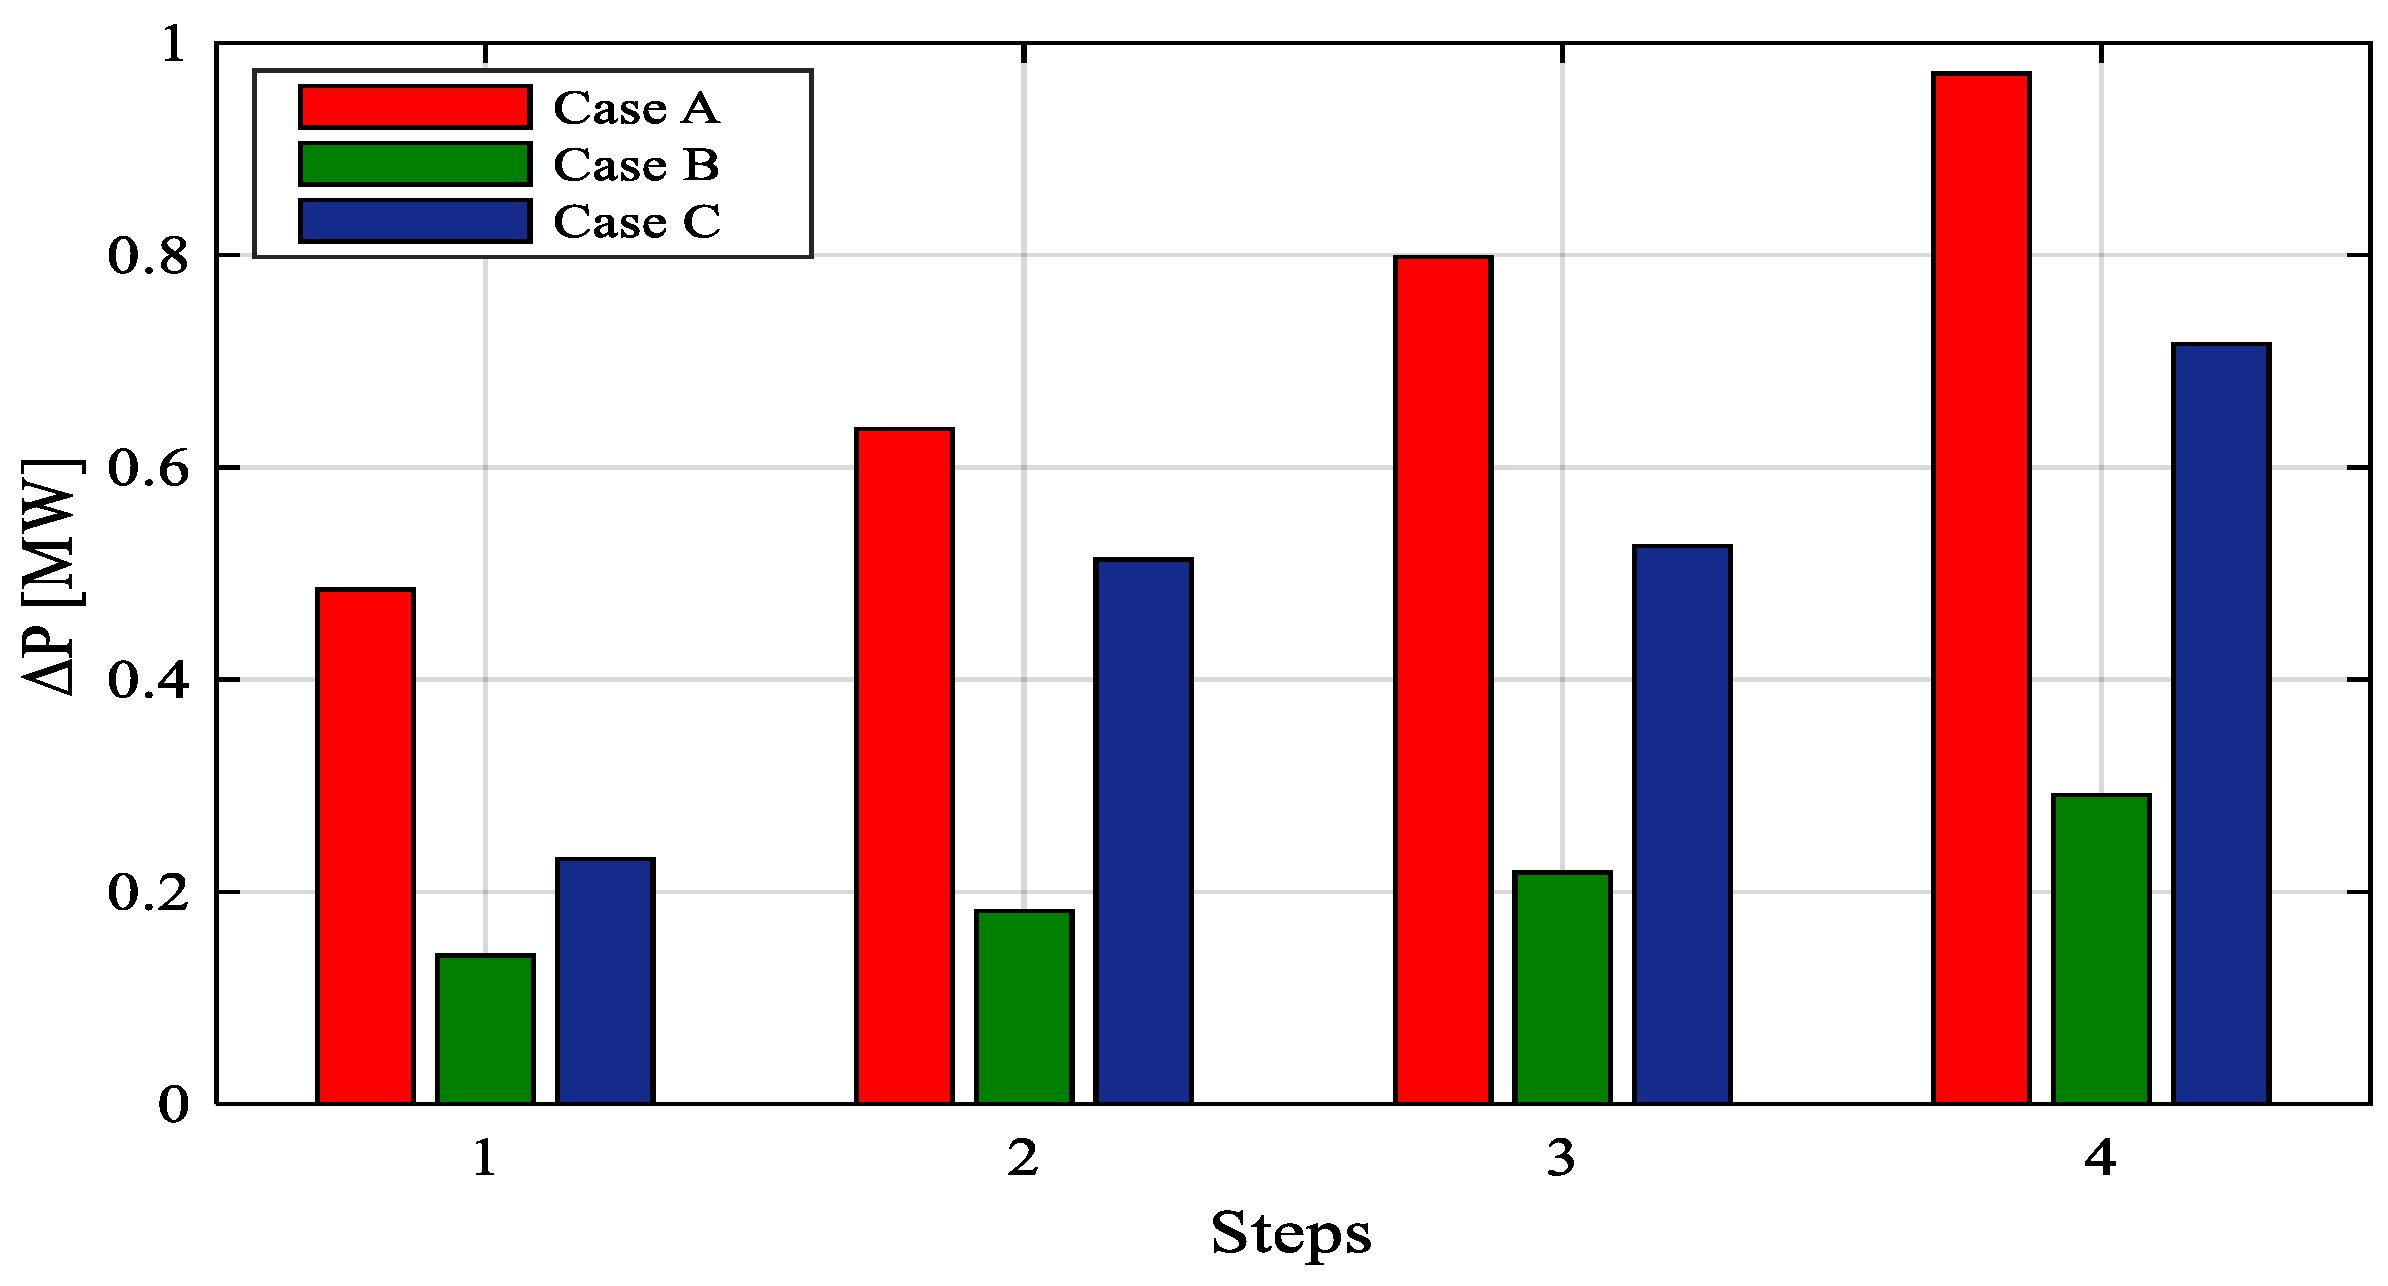
Figure 7 shows the power losses for the different steps in Cases A–C. In this analysis, the power losses for Cases B and C were lower than that of Case A. In addition, power losses in Case B were less than in Case C, which means that using wind power plants to inject active power at the start point of the 33-MV transmission line and the synchronous condenser to produce reactive power at the consumer end of the power line was more effective than what is obtained by the reverse positioning.
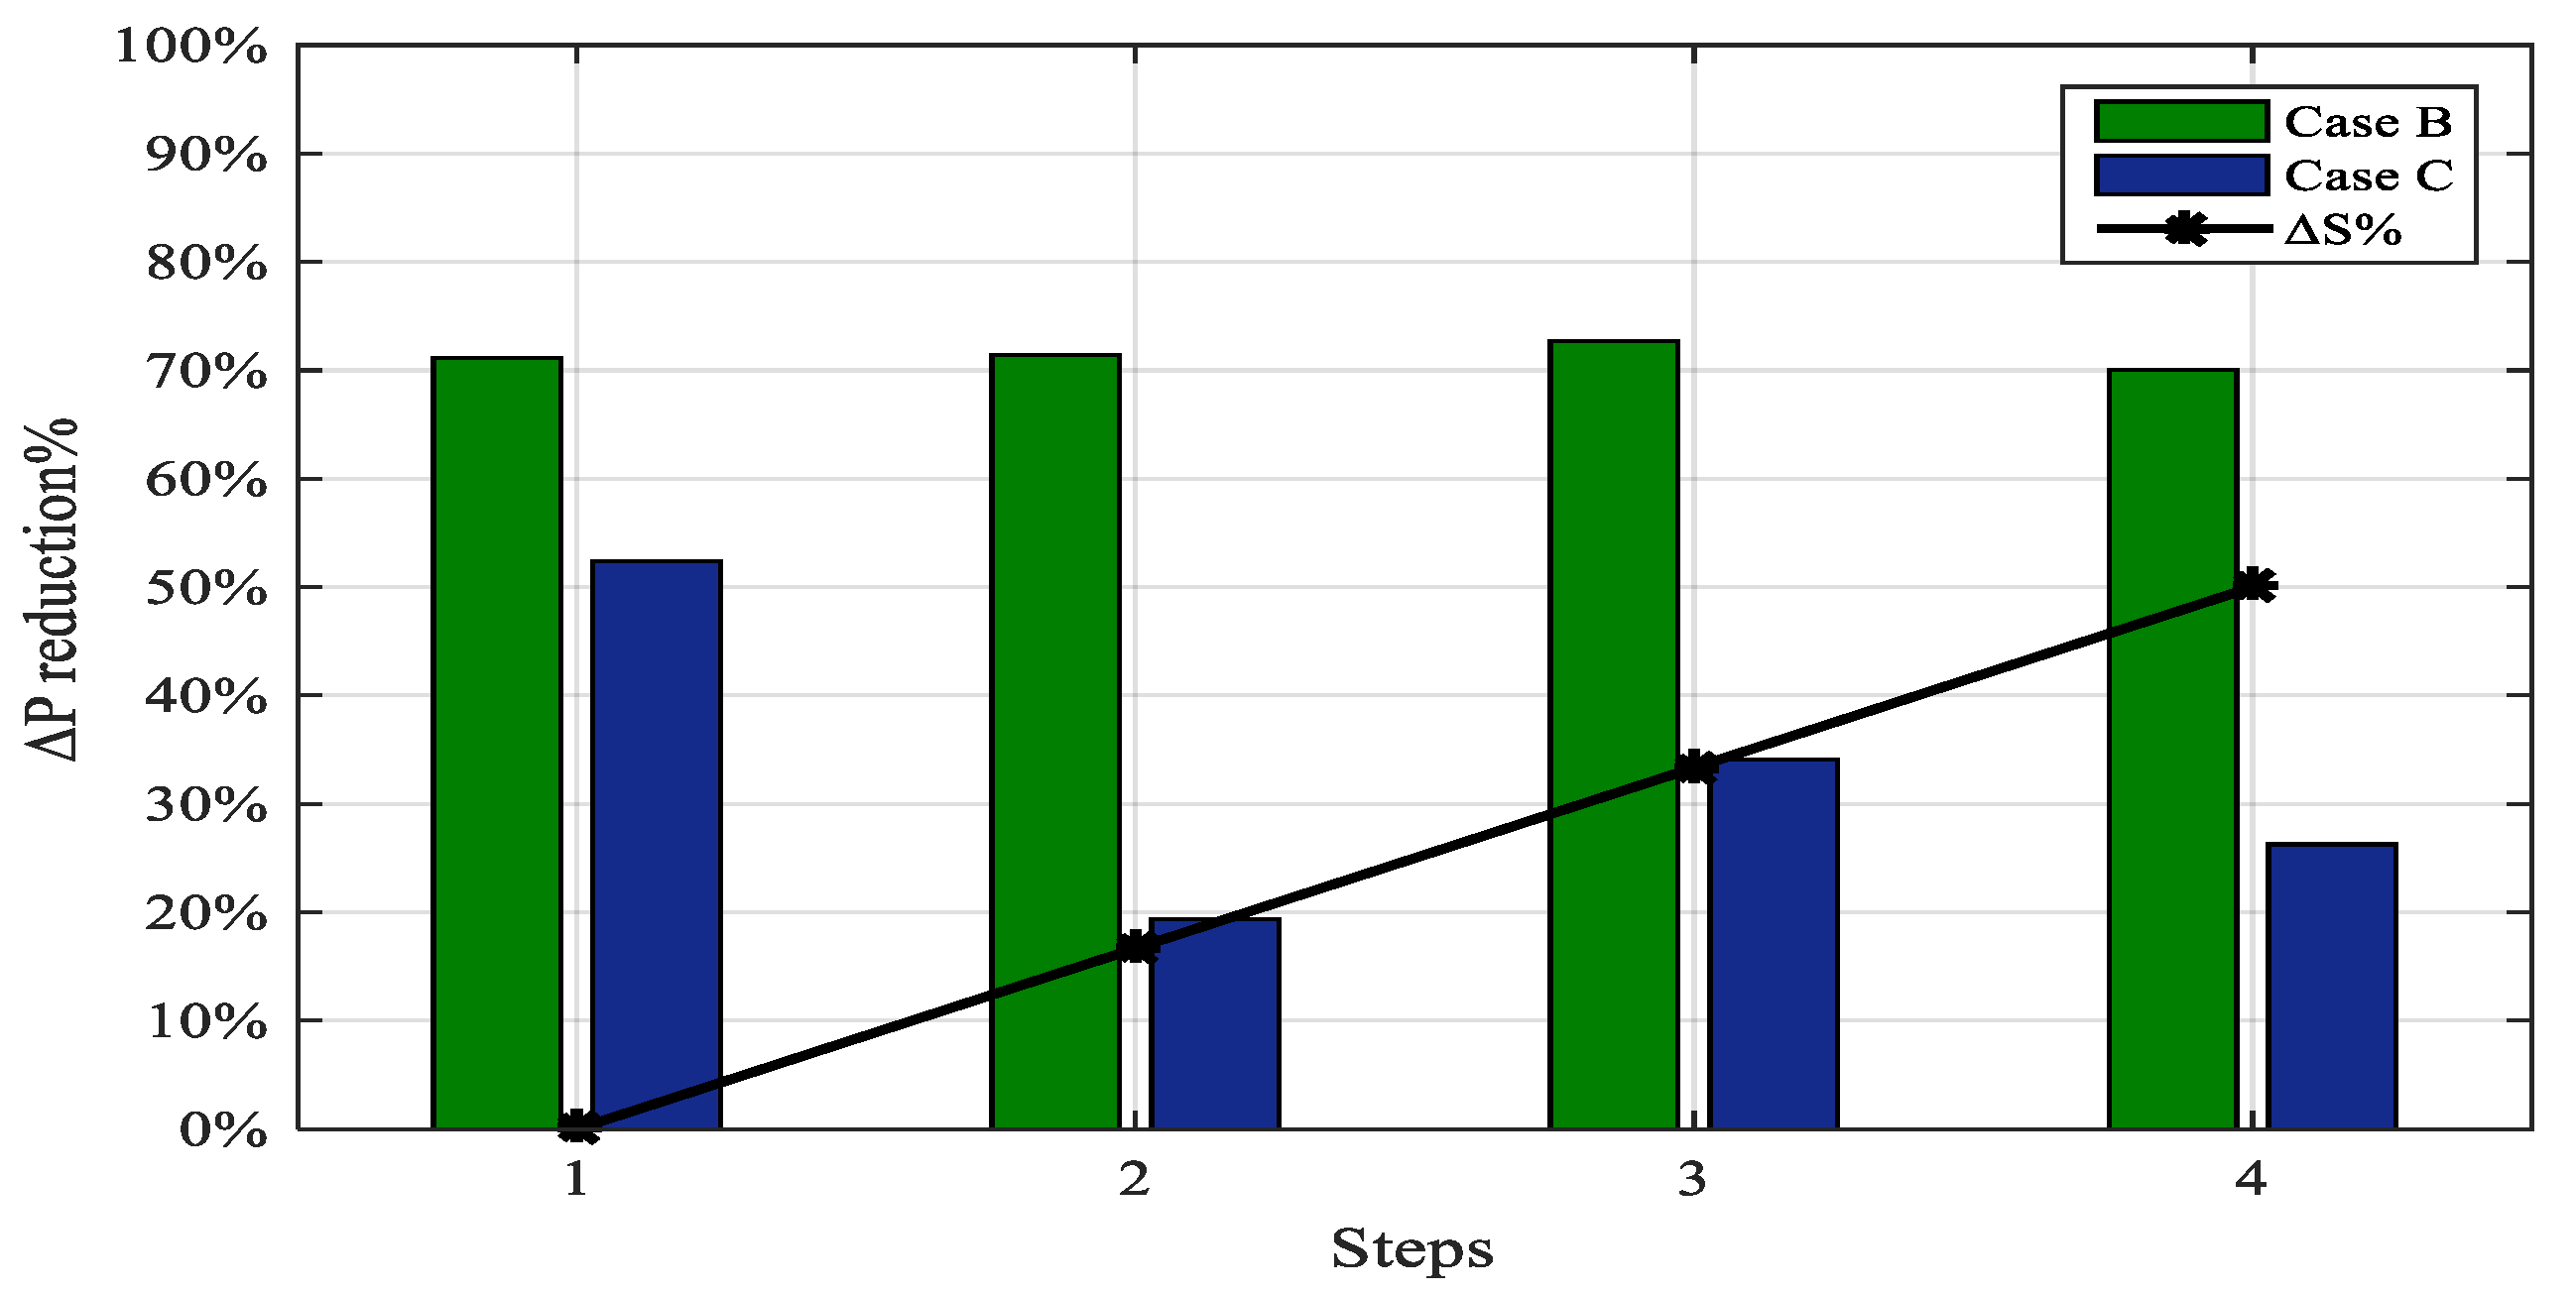
From
Figure 8, it is observed that the percentage of power loss reductions for different steps in Cases B and C compared with Case A decreased for all cases and steps, but the reduction in Case B was higher. The reduction in all steps was generally the same in each case. The apparent power was the percentage increase in load, and as the load increased, the results became more favorable.
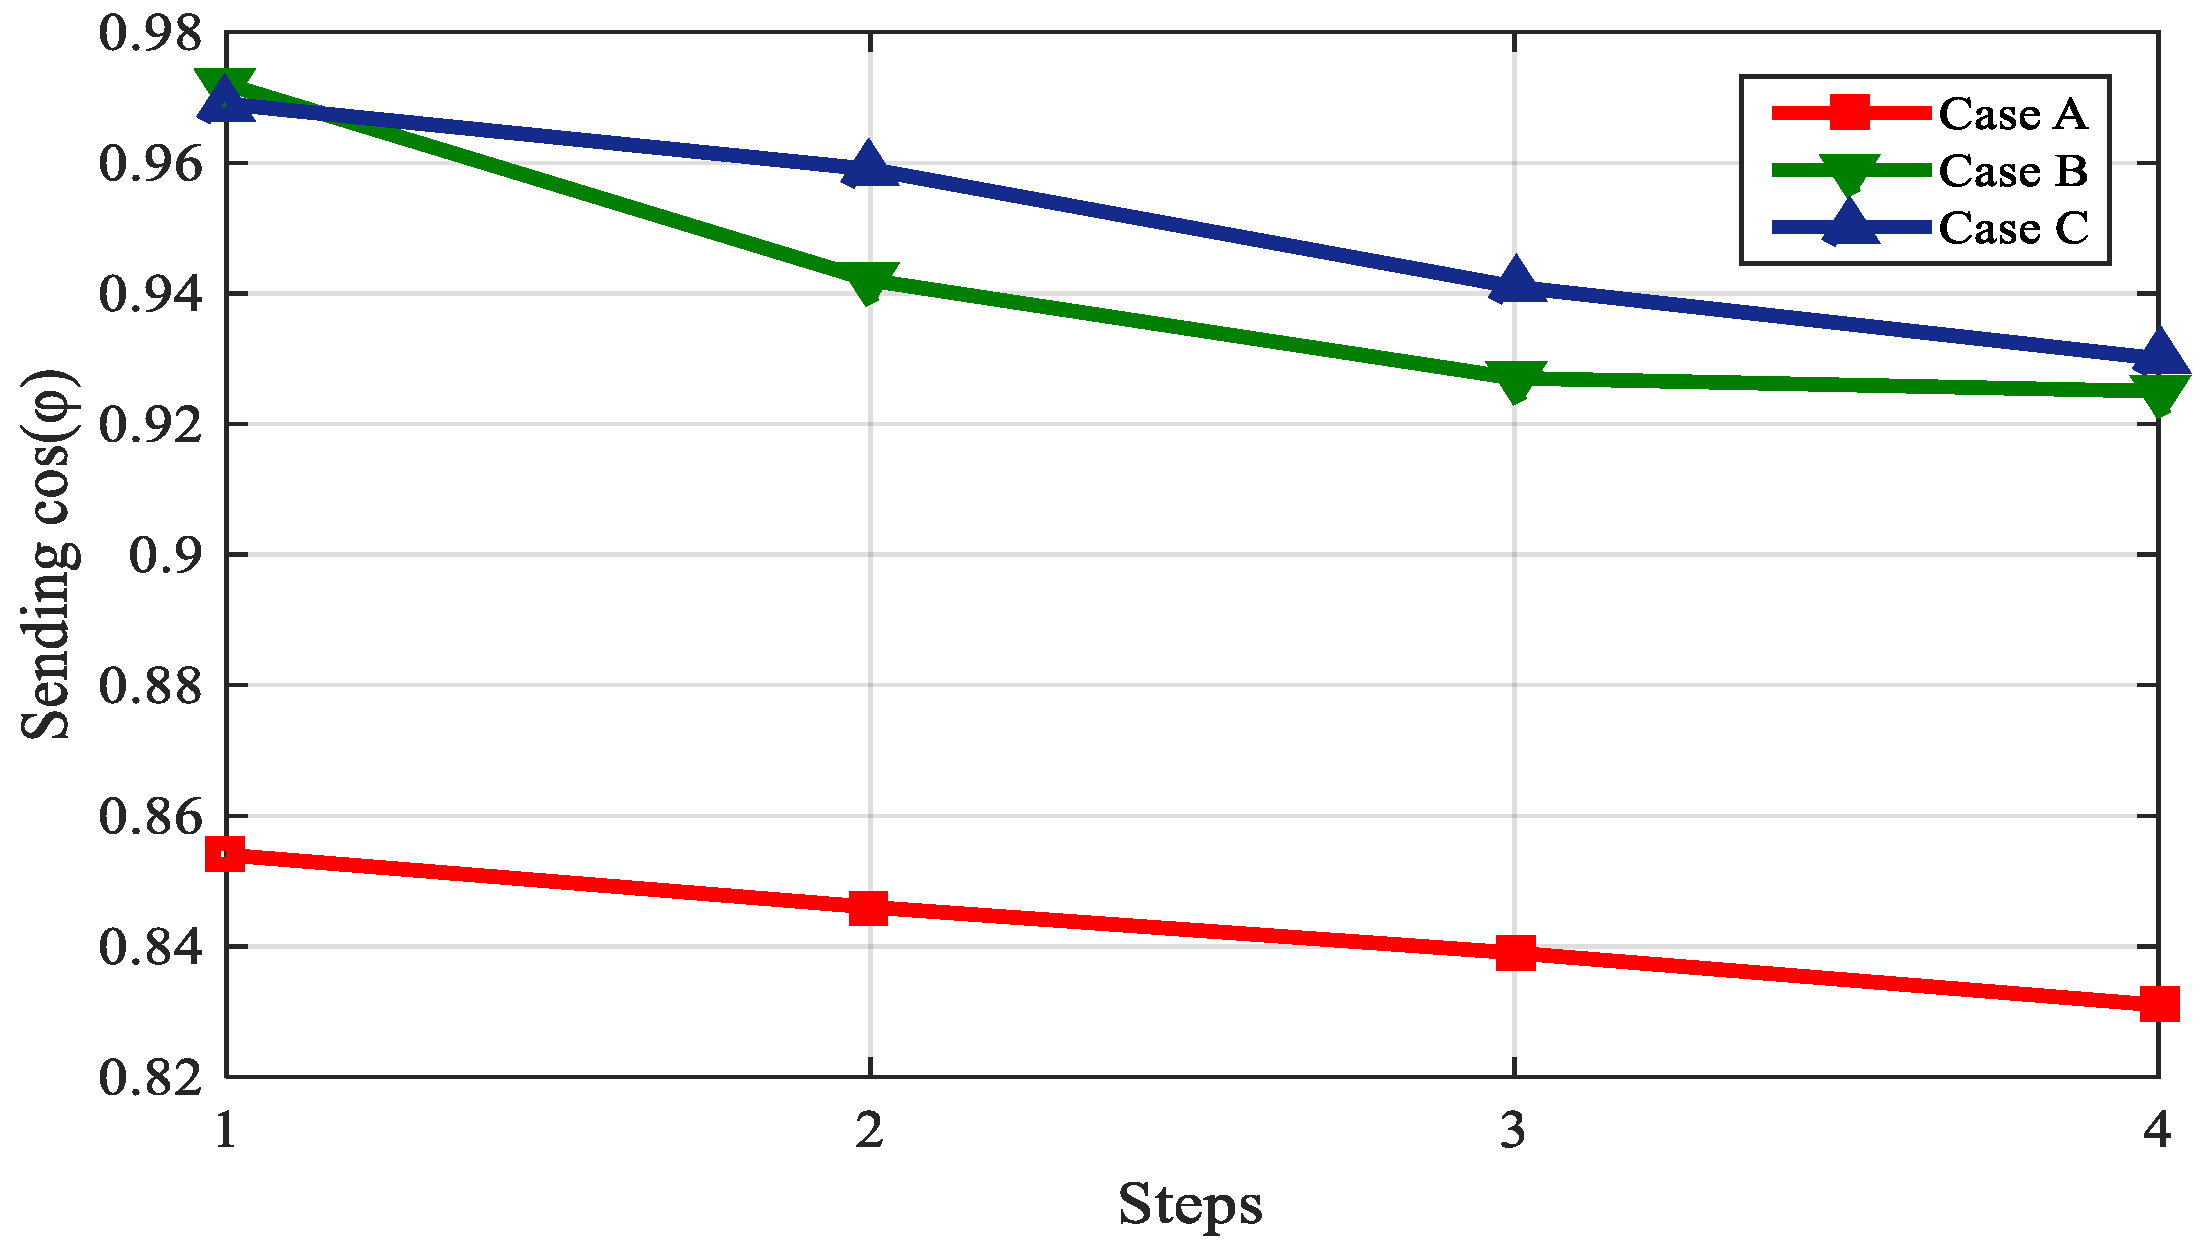
The sending power factor for different steps of Cases A–C is plotted in
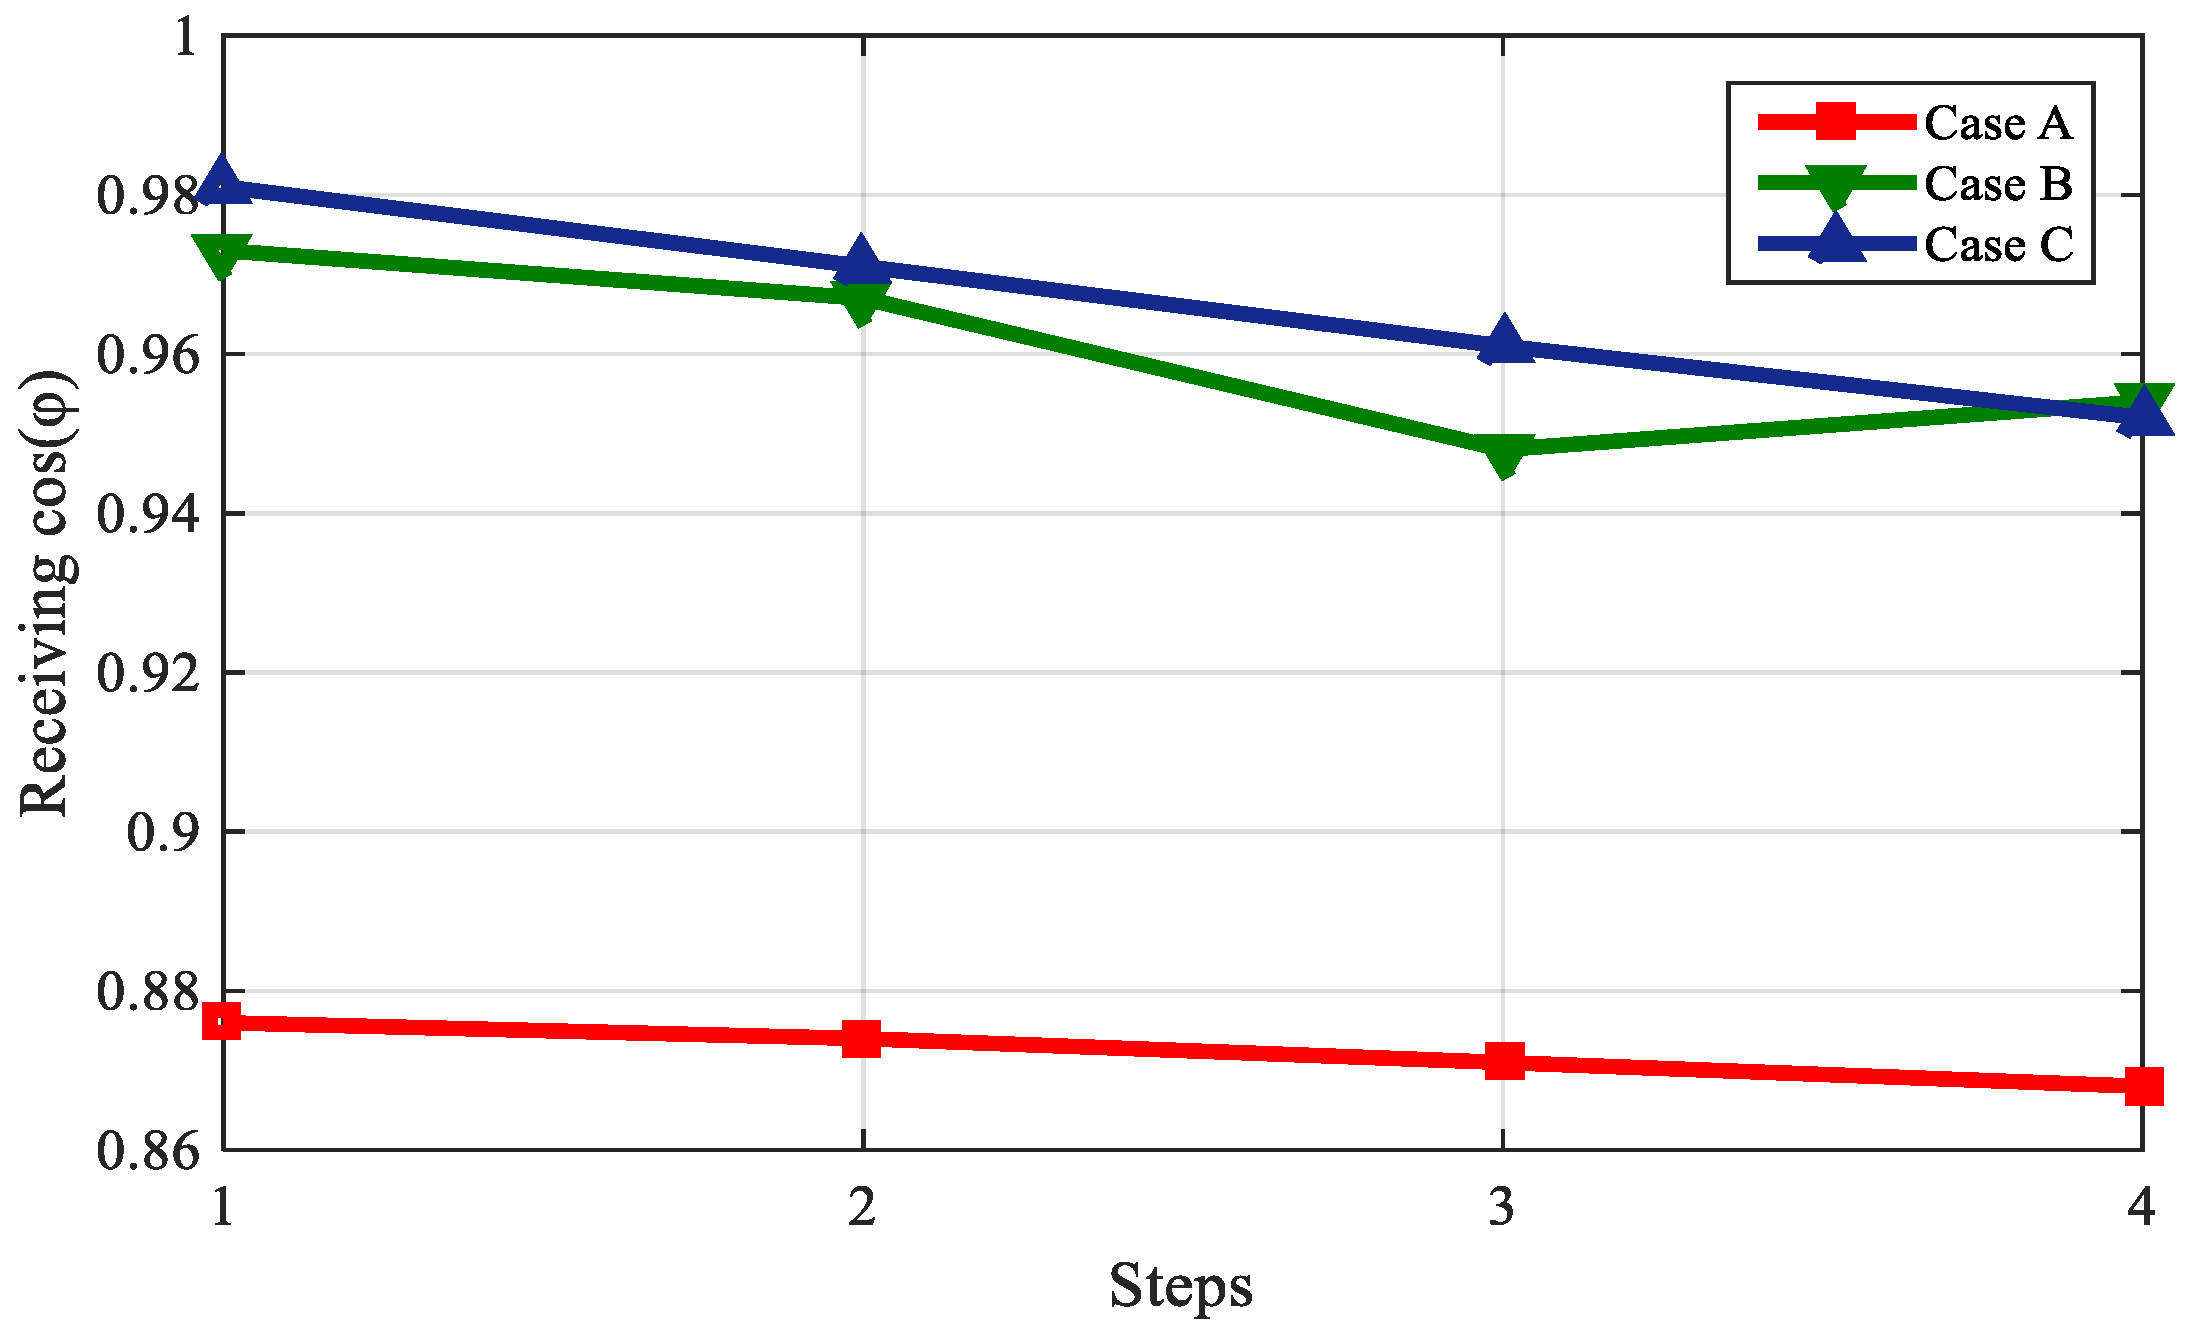
Figure 9. In this analysis, the sending power factor for Cases B and C was higher than that of Case A, ranging between 0.97 and 0.93, whereas the result for Case A was between 0.86 and 0.83. Note that the sending power factor for Case C was higher than that of Case B. The receiving power factor for different steps of Cases A–C is shown in
Figure 10. The result here was like that depicted in
Figure 9, where the power factor for Cases B and C was higher than that of Case A. The power factor values recorded for Cases B and C ranged between 0.99 and 0.95, whereas the values observed for Case A were between 0.88 and 0.87.
Figure 10 shows that the sending power factor of Case C was higher than that of Case B.
In power systems such as the proposed scheme, active power and a little amount of reactive power is needed. However, with a low power factor, the reactive power is higher than usually needed. A low power factor in the circumstance of Case A implies that reactive power was higher than active power. Hence, a low power factor means dealing with a high amount of reactive power. Therefore, a drawback of having a low power factor is the excessive reactive power. Hence, with a low power factor, the amount of apparent power in the network increases, although the power (KW) is still the same. This results in some significant losses both on the transmission line and on the consumer side, as was the situation for Case A, but the reverse was the situation for Cases B and C, where the losses on both the transmission line and the consumer side of the scheme were minimized due to the installation of the wind plant for active power regulation and the synchronous condenser for reactive power generation. In addition, the voltage drop of the proposed MV transmission lines and distributors increased as the power factor values decreased. In order to keep up with the voltage at the receiving end, Type-3 wind plants for active power control only and synchronous condensers for reactive power control only must be installed into the proposed scheme. The 33-kV transmission line voltage was also maintained owing to the observed power factor standing for both Cases B and C.
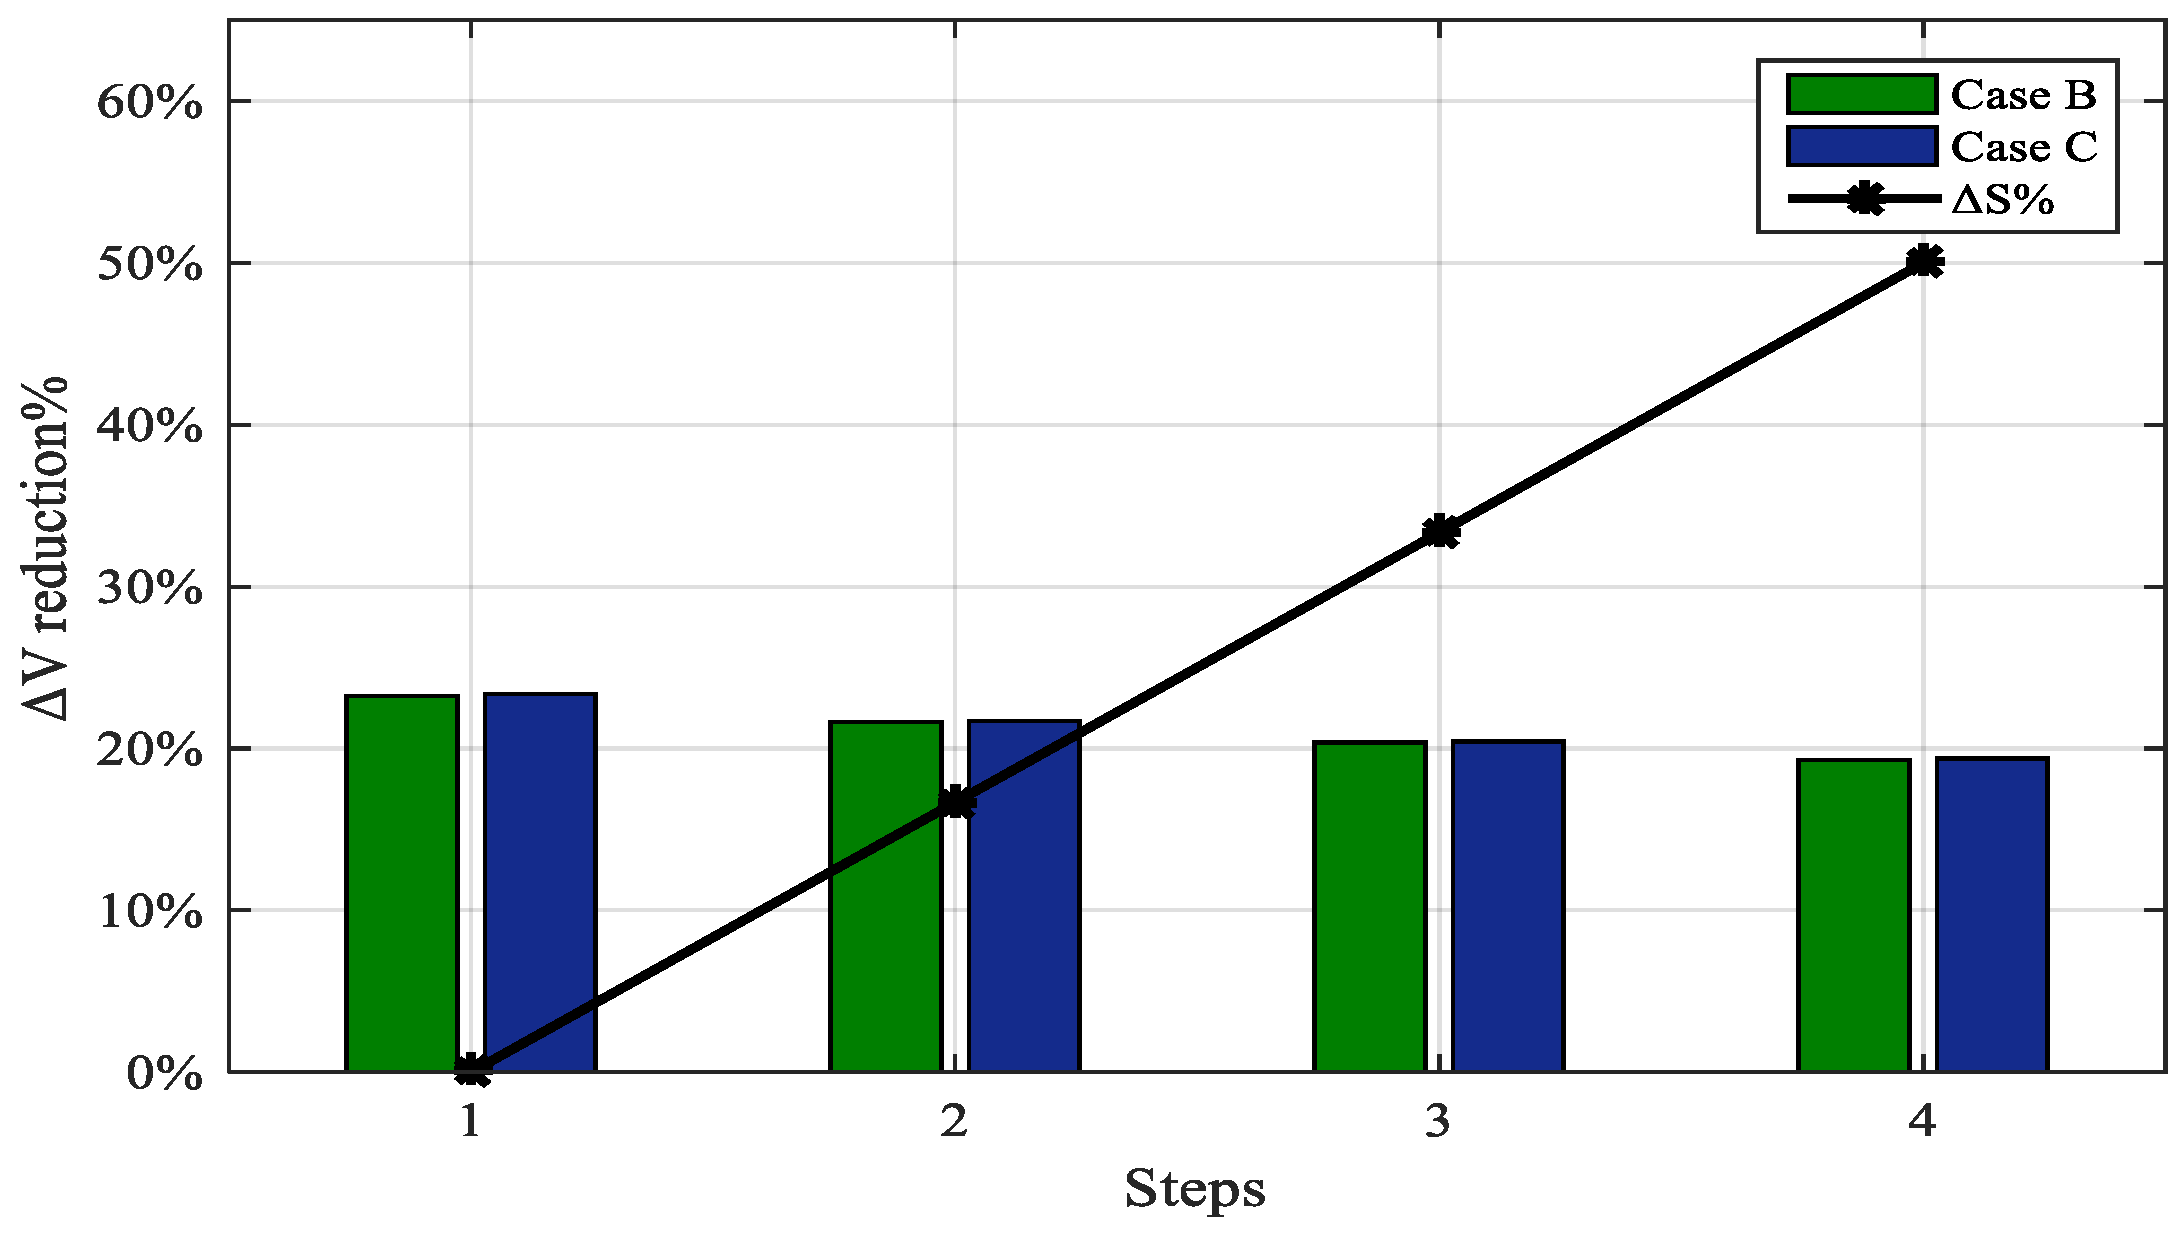
In
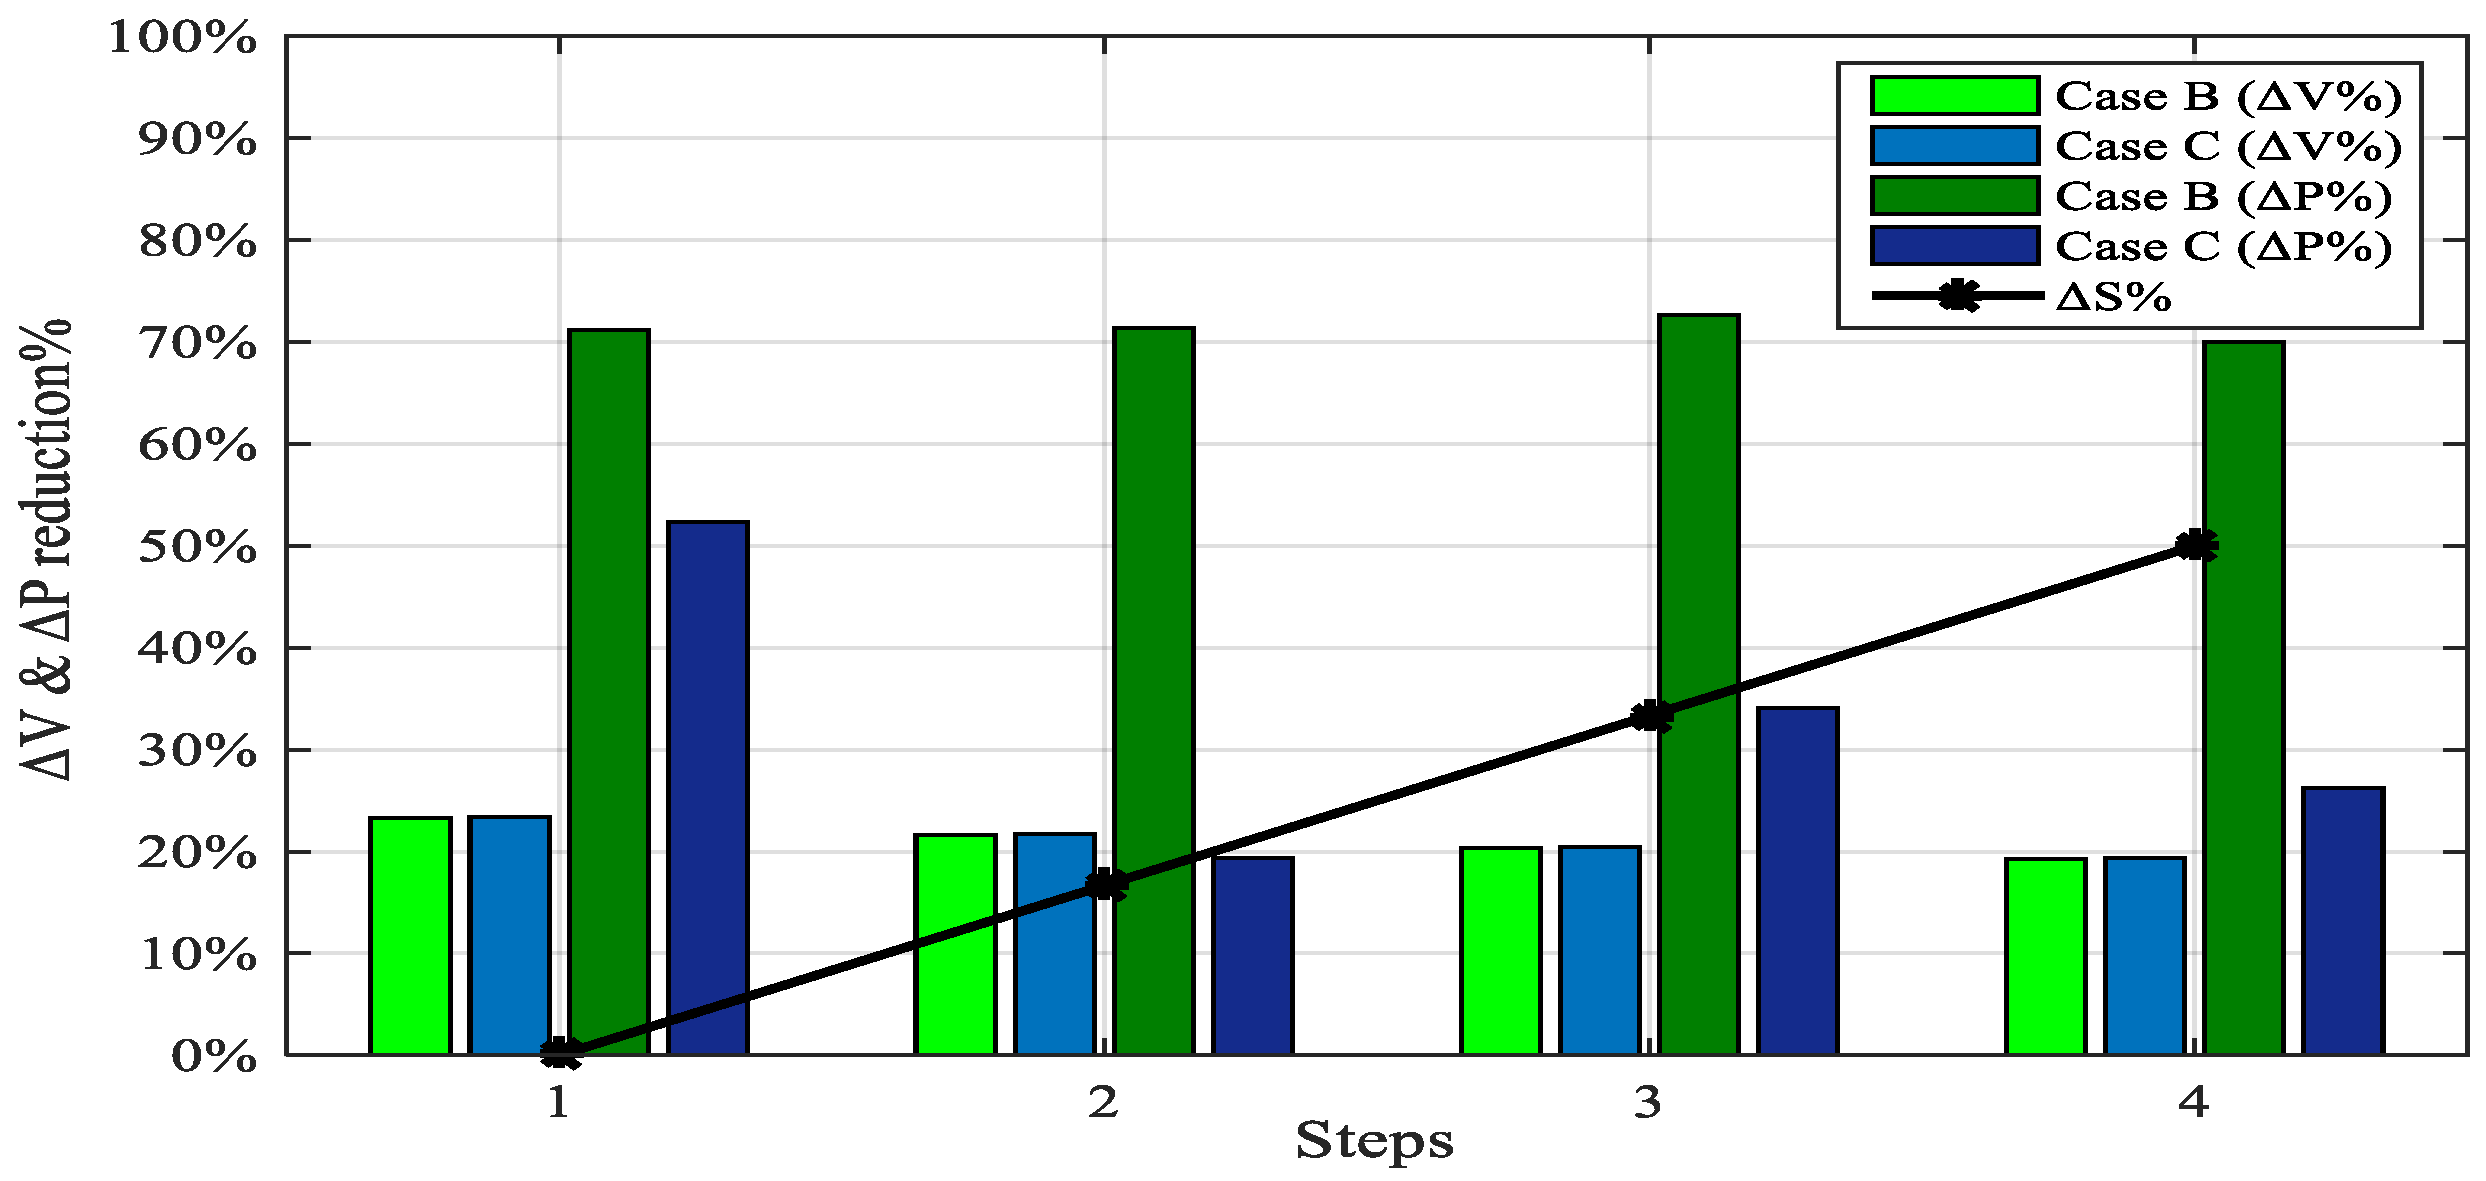
Figure 11, the percentage of voltage drop reduction for different steps of Cases B and C is compared with Case A. It is vividly clear that the voltage drop was reduced in Cases B and C as compared with Case A and the performance of the various case situations was the same for all steps. Additionally, the percentage of reduction of voltage drop was approximately the same for all steps (that is, 20%) but with a corresponding small decrease as we moved from steps 1 to 4. On the contrary, for Case A, the percentage of voltage drop steadily increased as we moved from steps 1 to 4. A voltage drop performance analysis was required to ensure that the end of the power lines had enough power to drive the final load. The issue of voltage drop only gets worse as more loads are connected onto the power lines. As the length of power lines increases or as the current increases, so does the voltage drop. Note that leaving some margin for future loads will ensure that electricity consumers get a reliable power system as expected. The resulting measured and modeled percentage of voltage drop and power loss reductions for different steps in Cases B and C compared with Case A is graphically illustrated in
Figure 12. It shows the general comparison of Cases B and C with Case A, where it was observed that the methodologies used in Cases B and C were better than that used in Case A. Results for Cases B and C showed the same performance of voltage drop, which was about 20%. However, regarding the power losses on the proposed scheme, Case B showed better performance than Case C. The loss reduction for Case B was about 70% but was 50% for Case C. Overall, the performance of Case B is seen to be the best case situation observed.
8. Conclusions
From the analysis of a normal power system, it was observed that when additional generation sources of active and reactive power were spread along the network, the proposed scheme attained stability. Conclusively, in a traditional power system, like that of Case A in the design model, the limitation of increasing load creates issues for the regulation of voltage level and this brings about an increase in the voltage drop of the MV power line, sometimes more than the allowed ratio of 10% from nominal voltage value, which also increases power losses. All of these issues cause instability, power losses, and are harmful to loads. In this model, the Type-3 renewable wind power plant was used to generate active power and the synchronous condenser to produce reactive power by choosing different points on the proposed scheme to separately connect both the wind renewable source and the synchronous condenser. The network was stabilized and power losses were equally reduced, even when the loads increased, implying that the proposed scheme can absorb more load. Hence, it can be posited that the Type-3 wind plant and the synchronous condenser scheme is economical. It is worth mentioning that the proposed technique of this paper can be applied to different load deployments in any power system in order to establish stability to preserve the acceptable security performances of electricity grids. This research paper establishes an effective application of synchronous condenser technology for the deployment of reactive power and the wind power plant for the deployment of active power in a modern electricity scheme. This methodology could effectively simulate the effect of an anticipated synchronous condenser on a power grid with participating wind plants, thereby generating useful information for managers, engineers, and researchers in the electricity industry. This information can improve modern electricity growth plans and can be used to formulate new electricity development strategies and action plans. It is important for electricity managers to develop management strategies and development plans that allow electricity resources to be utilized more effectively in a sustainable manner. It aids in improving power system security by providing adequate active and reactive power for the stability of the electricity grid and the minimization of power system losses. Therefore, the proposed methodology is likely to bring significant technical and financial benefits to power system operators.


