1. Introduction
There is a special migrant group called the rural migrant population (RMP) in China, because of the dual household registration system [
1]. Since the reform and opening-up, more rural surplus labor has transferred to cities in the accelerated urbanization process in China, and this has become the main body of industrial workers [
2,
3,
4]. According to the National Bureau of Statistics, the number of peasant workers in China has reached 286.52 million, among which 171.85 million or more than 70.43% are migrant workers [
5]. Due to the country’s large population base and rapid growth, the conversion of the RMP from farmers to residents must be a step-by-step process. In this process, there is differentiation by social class within the RMP, which generates a series of micro-communities with various characteristics. The development trends between these micro-communities manifest differently, according to aspects such as social factors. As a result, various demands occur for social resources, particularly housing demand, and these demands must receive attention as a critical part of sustainable urban development [
6].
On the other hand, the RMP is not eligible for the social benefits resulting from economic growth because of household registration restrictions [
7,
8]. This population’s position is on the edge of urban society; that is, it is excluded from urban society [
6,
9]. Although this social status quo has been improved by the housing security policy, current policy does not perfectly match the population’s needs [
10]. A serious contradiction between the social status quo and actual demand is generated, which poses a severe challenge to the sustainable urban development of population and housing [
11].
In the field of RMP, previous studies related to the complex relation between housing demand and housing security patterns have contributed to discovering the significance of improving housing policies based on actual demand. However, most researchers analyze this issue using theoretical logical analysis or case studies from the perspective of the housing or the security status quo of the RMP [
1,
12,
13]. This might be because of the difficulty of collecting data related to the RMP. There is less empirical analysis in this research field, based on statistical data from systematic surveys, and few studies associate the heterogeneity of the RMP with the housing demand.
The major objectives of this paper are (1) to analyze the actual housing demand of the RMP from the perspective of internal differentiation, and (2) to put forward proposals based on the improvement of housing security policies to promote the sustainable development of urban housing. To achieve these goals, we propose an improved clustering analysis algorithm to demographically differentiate groups within the RMP, which contributes to detecting the defects of the macroeconomic housing policies in China. To make the results more persuasive, our empirical analysis is discussed based on the microdata from the China Migrants Dynamic Survey (CMDS), which is the novelty of this study.
This paper is structured as follows.
Section 2 introduces the previous research and background of the internal differentiation within the RMP and the population’s housing demands.
Section 3 presents the data sources and definitions of influencing factors.
Section 4 elaborates the principle of the data processing algorithm used.
Section 5 outlines the experimental process and discusses the analytical results. Finally, the major conclusions are summarized, based on which the corresponding policy suggestions are given.
4. Method and Empirical Analysis
4.1. Partitioning around the Medoid (PAM)
The PAM algorithm, a variant of the K-medoids algorithm, is a clustering algorithm with the partitioning method. It is crucial for PAM to determine the center of each cluster. Compared with the traditional K-means algorithm, the PAM algorithm chooses “medoids” instead of the “mean value” to represent the center of the cluster; thus, PAM is less sensitive to outliers and noise data [
45], and has better clustering accuracy. In addition, the algorithm has the advantages of simple implementation, low space complexity, and stronger applicability to various types of data [
46]. While there is a positive correlation between the time complexity of the algorithm and the sample size, the PAM algorithm is still suitable for solving cluster analysis problems of multivariate cross-sectional data [
46]. In the first step of PAM, the initial medoids of each cluster are randomly generated based on the number of clusters (generally expressed in k). To reduce the errors of the objective function, the algorithm iteratively modifies the medoids. The final clustering results are obtained when the objective function is optimal.
In previous studies, this algorithm has been widely applied to different fields [
47,
48,
49]. Different packages can be directly applied in many kinds of software for data analysis. Therefore, the detailed procedure will not be described here. For more information about the principle and implementation of PAM, please refer to a previous study [
50].
4.2. Between-Class Distance Computation
In the process of clustering analysis, after choosing the clustering algorithm, we have to select the calculation method of the between-class distance according to the characteristics of our data. It is particularly important to choose the most suitable between-class distance computation, which can not only improve the credibility of the final clustering results, but also make the realistic conclusions drawn from the results more valuable. There are various kinds of between-class distance computations, for instance, Euclidean distance, Manhattan distance, and Chebyshev distance. Considering that there are two types of data (namely, numbers and characters) in the dataset of this paper, we attempted to overcome this problem by introducing Gower’s dissimilarity (GD) coefficient into the empirical model.
GD, a method used to measure the similarity among different samples, was proposed by J.C. Gower in 1971. The model introducing GD offers us more choices for determining a cluster algorithm because it can measure the between-class distance of a dataset with both continuous and categorical data.
According to Gower [
51], sample
xi and
xj are rewritten as
xi = (
xi1,
xi2,...,
xin)’ and
xj = (
xj1,
xj2,...,
xjn)’, respectively, and
k is defined as the size of the dimension. For continuous data, the GD between sample
i and sample
j can be calculated by the following equation (1):
where
Rk is the difference between the maximum and the minimum on the
k dimension of sample
x. For categorical data, variables with m categorical attributes are broken down into m 0–1 variables. Then, the distances between each sub-variable are weighted and summed by using the strategy of the Dice coefficient [
52] to obtain the final GD between samples
i and
j, by which the following equation (2) can be calculated:
where
and
are the markup and weight values, respectively, whose values depend on the value of certain attributes. The markup and weight values of different cases are reported in
Table 4.
4.3. Number of Clusters k
In a practical clustering analysis process, the
k value, which is the number of clusters we initially set, has a profound impact on the final clustering result. It is rather difficult to determine the appropriate
k value beforehand. To address this problem, a series of solutions based on practical experience and speculative knowledge have been proposed. On the one hand, the
k value must be less than the number of characteristic variables, because it is hoped that features of each cluster are part of the characteristic variables of the source data. On the other hand, a number of statistical indices, such as the Silhouette coefficient (SC) index, have been proposed to estimate the clustering performance with different
k values [
53].
Based on these solutions, we set a possible range of
k values, according to previous studies and the idiographic conditions of the dataset, after which the clustering results are evaluated by the SC. The calculations of the SC often involve the individual SC and the global SC. For each sample in the dataset, the individual SC can be expressed as:
where the subscripts
i indicate the sample,
ai is the average distance between sample
i and other samples belonging to the same cluster as sample
i, and bi is the average distance between sample
i and the sample belonging to the most similar but different clusters of sample
i. According to Equation (3), the maximum and minimum values of
si are 1 and −1, respectively, and the closer
si is to 1, the more accurate the clustering result is. The global SC is the average of the individual SC of all samples. We can use it to evaluate the rationality of the clustering results. The larger the value is, the better the performance.
4.4. A Mixed-Type Data Clustering Analysis Model
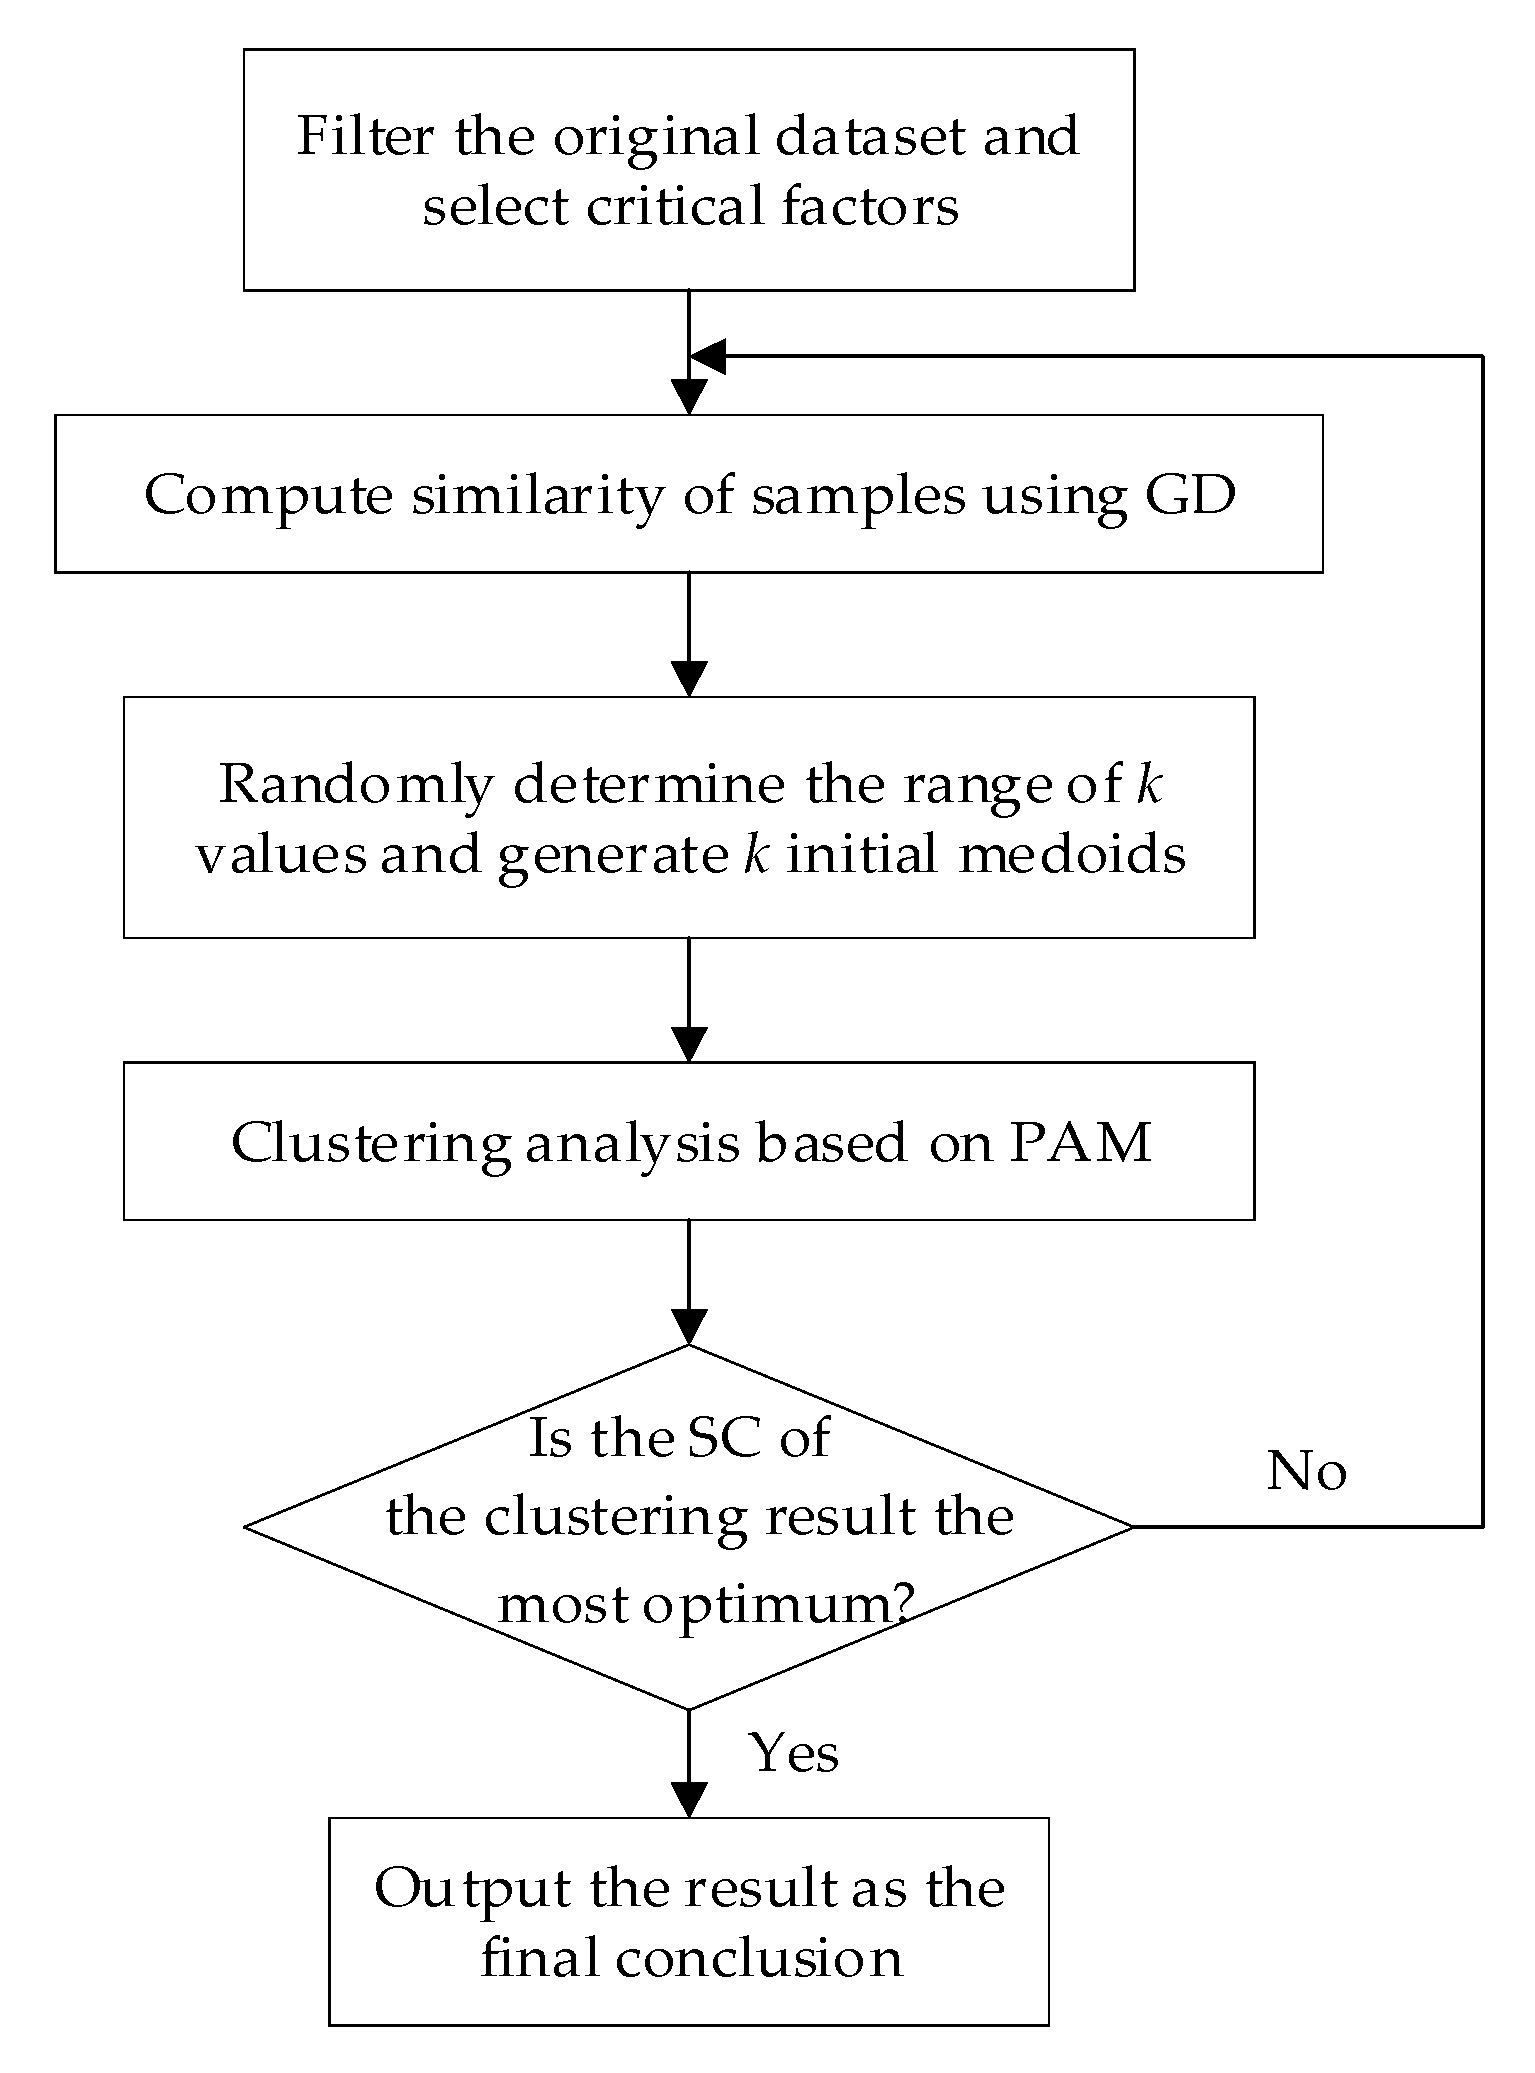
The general solution to mixed type data clustering analysis consists of two steps: A similarity measure, and algorithm selection. For the purposes of this study, an improved model based on PAM for solving the mixed type data clustering problem is provided. In this model, the similarity of samples is calculated by using the Gower coefficient. Then, the clustering experiments are carried out with different initial numbers of clusters, after which the clustering results are verified based on the theory of the SC. The best result has the characteristics of the maximum global SC value. The flowchart of the model is shown in
Figure 1.
4.5. Empirical Analysis
Both practical experience and data regularity should be considered when the
k value is determined subjectively. Previous researchers have suggested that two to five clusters might realistically represent the RMP class differentiation [
54]. Based on the requirements of the model that we discussed in Chapter 4, the initial k value must be less than the number of influencing factors that we selected. When the
k value varies in the interval [
2,
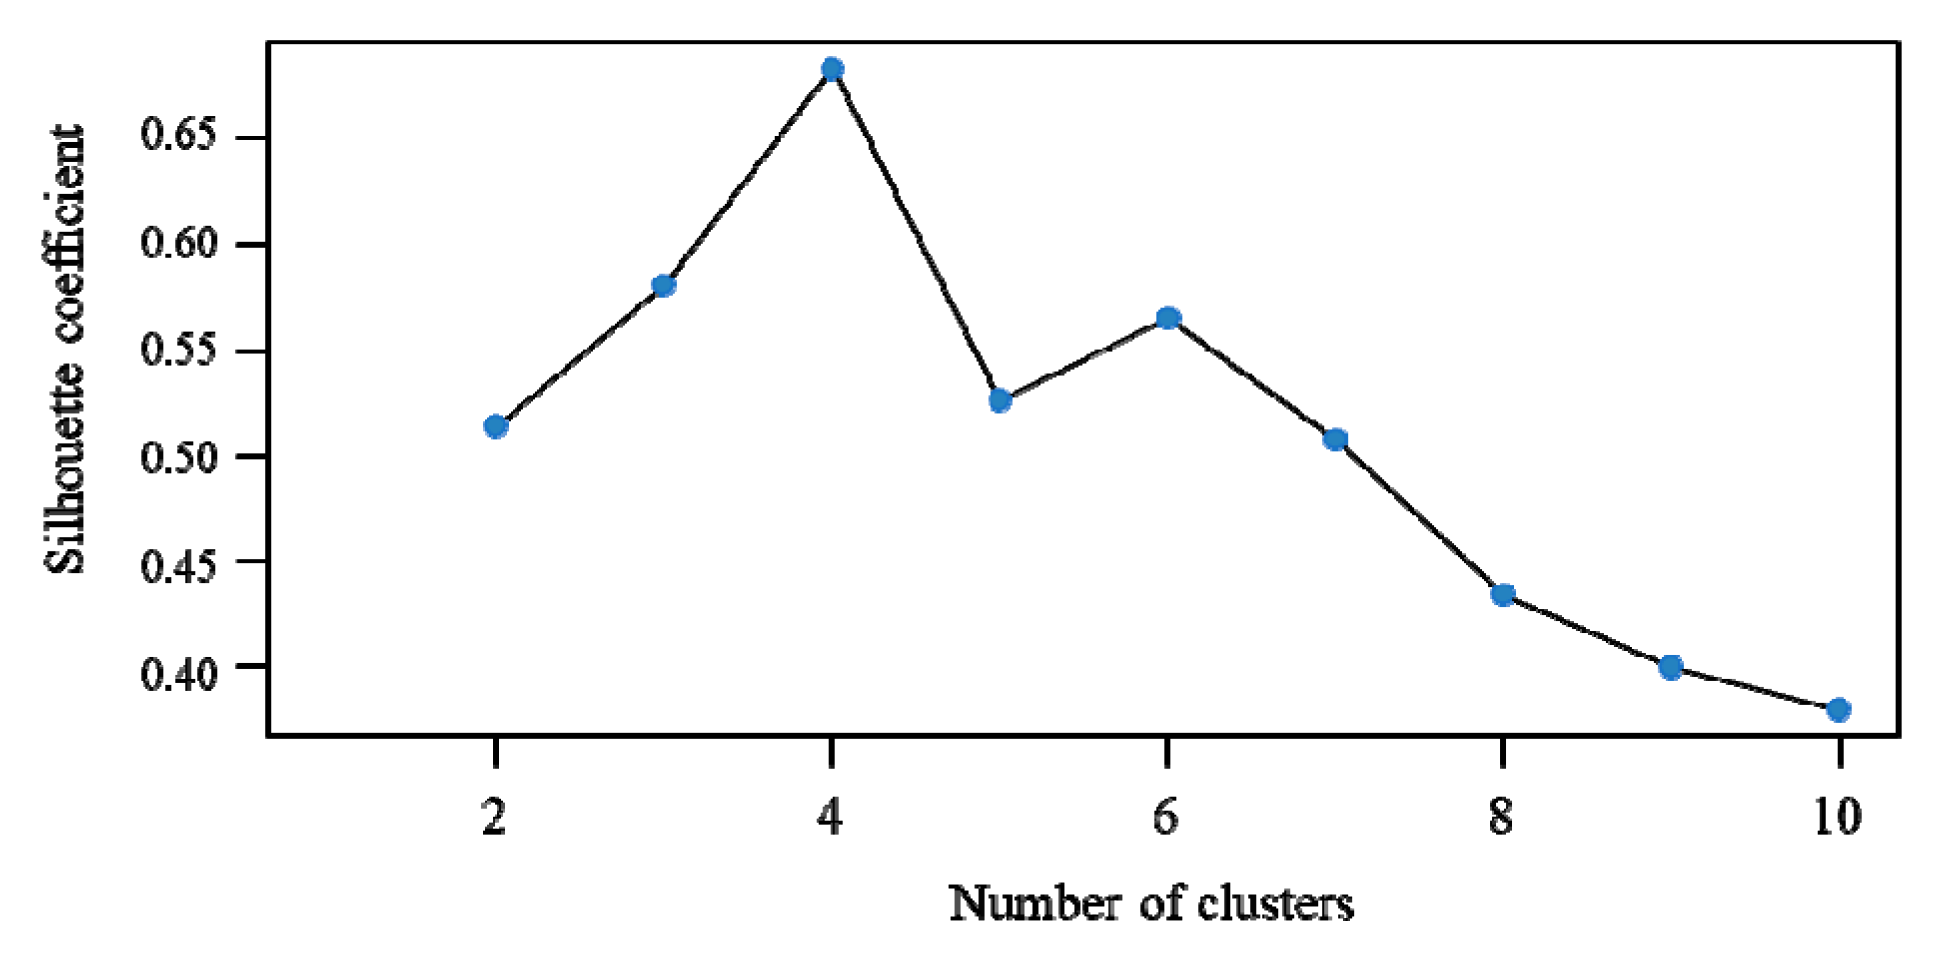
10], the dataset is analyzed by using the model that we proposed. The SC values of each clustering result are calculated and compared, and the results are displayed with the curve in
Figure 2.
The best k value can be obtained from
Figure 2. When
k < 4, the SC is positively correlated with the
k value, which indicates that the clustering result is closer to reality. Nevertheless, the SC falls sharply when
k = 5. After SC increases, it falls after
k > 6. According to the above analysis, we find that the SC peaks at 0.683 when
k = 4, which means that it is most ideal to aggregate the overall samples into four clusters.
RStudio v.1.1.456 (Copyright RStudio Inc., Boston, MA, USA), an integrated development environment for R language, was used for statistical analysis. The terse and effective programming environment with code editing is established by providing extensive program packages to reduce the time cost of modelling. There are two functions in the cluster package: daisy and pam. The former can be used to compute the pairwise dissimilarities between samples with mixed type variables, while the latter is a function implementation of the PAM algorithm. Furthermore, the SC can be acquired from the results computed by the pam function.
5. Empirical Results and Discussion
5.1. Population Clustering Results based on Housing Demand
Empirical analysis of the 10 variables of the RMP in our study is presented in the descriptive statistical summary in
Table 5. To highlight the unique characteristics of each cluster, and to make the results more intuitive, some variable groupings with an extremely small sample sizes are merged or modified.
As shown in
Table 5, it may be inferred that the class stratification of the RMP is mainly manifested in the following aspects.
First, there are some common characteristics among the four clusters. Populations with low housing consumption levels and personal housing renters make up a relatively high proportion in all four clusters of the RMP. This indicates that the living conditions of the RMP are likely to be poor, as most of this population has little capacity to pay for houses in the city. Worse, this difficult situation has not improved.
Second, while the above characteristic is common to the four groups, other characteristics display significant differences. For instance, the population of the first cluster (#1) is similar to that of the third cluster (#3) in terms of income level, education level, employment status, and settlement intention. The difference between them is that the former consists mainly of the new generation, and the latter is elderly.
Table 5 shows the descriptions of the four clusters. Next, some preliminary conclusions are presented. The population of the first cluster, with an average age of 26.21 years, has a considerable proportion with a junior high school education, is generally engaged in service occupations, and has a low income level, on average. However, due to the small average household dependency burden, the level of household consumption is lower. Characteristics of the individual and of the urban migration are deficient in this group. The third cluster, which is limited by a low education and an advanced age of 47.90 years, on average, obtains a meagre remuneration by participating in manual labor (such as construction work). Because of weighty family obligations, the people in this cluster are forced to hunt for a better-paying job in the city. When their living conditions improve, they will most likely return to the countryside to settle down, because they lack identity and belonging in the urban setting. According to the above analysis, the first and third clusters are defined as “new generations just entering” (#1) and “old generations just entering” (#3), respectively.
Third, there are some symbolic characteristics of each cluster. Taking the second cluster (#2) and the fourth cluster (#4) as examples, the keywords of the second cluster include middle-aged, married (at least 87.67%) with a child (81.4%), a talent in a technical profession (analysis based on the original dataset), and a higher level of education (71.73% with senior high school education). Therefore, the proportion of this cluster that is engaged in a technology-based occupation is larger, and the income is higher. Further analysis based on the original dataset indicates that the migration pattern of this cluster is family migration, involving peasant workers who migrate with their children. This group pays more attention to the supporting public resources than to other aspects, and has a greater possibility of settling in urban cities. The age composition of the fourth cluster is more complex and consists chiefly of middle-aged and elderly people. Most of them work as employers and self-employed workers, and they have a strong desire for settlement in urban cities. Either the income level or the social position of the population of the fourth cluster is higher than that of the people in the other clusters. Their long-term work experience and strong city identity make it possible for these people to hold a stable job and to live comfortably in urban cities. These are the reasons for why their homeownership rate is the highest among the four clusters. According to the above analysis, the second and fourth clusters are defined as being “technical employee class” (#2) and “employer or self-employed class” (#4), respectively.
5.2. Distribution of RMP Groups in Various Cities
In the process of the formulation and implementation of social security policies in China, obvious regional distribution differences are found between various clusters; that is, the population distribution of these clusters differs across cities [
55]. Practical experience suggests that the social security policy in China should be specifically devolved to the local level to balance the urban sustainability [
56,
57]. At present, there are obvious weaknesses in housing security for RMP in China. Both urban residents and RMP are regarded as security objects, based on the interim measures for the management of public rental housing, published in 2012. However, the major housing security resources are applicable for the urban population because of their urban identity (known in China as “urban hukou”). In fact, the problems of housing security policy for RMP, especially overlooking the regional features of RMP between various cities, still exist. It is essential to observe the regional distribution of the RMP from the city perspective as an effective measure to increase housing policy efficiency at the stage of macroeconomic policy-making. The State Council measures the urban population scale, based on the resident population size, to classify cities as super cities, mega cities, large cities, middle cities, and small cities [
58]. In this study, the numbers of primary sample units per city classification are 5, 8, 14, 40, and 15, respectively. The spatial distribution of the population at the city level is reported in
Table 6.
From the city perspective, it is obvious that major cities (namely, super cities, mega cities, and large cities), and especially super cities, attract the main portion of the RMP. On the one hand, many opportunities for employment are provided in major cities, which creates considerable private wealth to meet the household needs of low-income RMP families. On the other hand, there are many more housing security resources and public service resources in major cities than in other cities, which are more attractive for the long-term development of the RMP. However, blind population mobility may be responsible for aggravating the contradiction between rapid population influx growth and housing shortage, which is detrimental to the coordinated and orderly development of cities. Consequently, the countermeasures for major cities and medium-sized cities should be different. For major cities with strong population pressure, the inflow of the RMP should be restricted reasonably, and the threshold of housing security should be raised appropriately. However, positive housing security policies are appropriate for small and medium-sized cities with vast development potential, which contributes to enhancing their attractiveness. In other words, housing security policy should be initiated, based on the local city situation, to guide the reasonable flow of the RMP, which may effectively relieve pressure on population and housing in major cities. At the same time, this would promote the sustainable development of small and medium-sized cities.
From the perspective of the population, the characteristics of settlements in large cities is demonstrated by the first and the third clusters, which are defined by their original intentions to migrate. People in these clusters migrate to cities in search of more job opportunities and higher income levels. To accumulate wealth rapidly, these people may be more willing to compromise housing conditions. Makeshift houses, villages in cities, and shanty towns are currently the primary housing conditions of the people in these clusters. An effective approach to improving the situation is by providing more policy-based public housing with strict management roles. In contrast, most of the people in the second cluster are married, and favor mega-cities and middle cities as migrant destinations. Both harmonious family life and high income are highly valued by those in this cluster, which makes services such as educational resources and employment opportunities the key factor in their housing choice. The reality in China, however, is that major cities have more social public security resources, but the access threshold for housing buyers is relatively low in small and medium-sized cities. As a result, mega-cities become the best place for these people to migrate, while people who are limited by insufficient housing affordability will migrate to middle cities as an alternative. It is critical to distribute social public security resources fairly, and to provide better economic conditions and policy support to small- and medium-sized cities, which can promote the balanced development of urbanization between cities of different sizes. Moreover, this is an essential requirement for the sustainability of urban housing.
6. Conclusions and Suggestions
In this paper, a model for mixed-type data clustering analysis combined with the GD coefficient and PAM algorithm was proposed. Empirical analysis was conducted to explore the demographics of the RMP from a sustainable urban development perspective, based on the microdata of the RMP in eastern China. In the research results, four clusters of the RMP were identified: “new generations just entering”, “old generations just entering”, “technical employee class”, and “employer or self-employed class”. In general, the consumption level of all four clusters is low, and they prefer rental housing to other forms of housing, partly due to their meagre income. Further analysis indicates that large-sized cities are much more attractive to the RMP, while different clusters have unique preferences concerning the place to settle.
Some suggestions for the formulation of housing security policy based on this study are presented, to promote sustainable urban development.
At present, the contradictions between the single supply mode of housing security and the varied housing demand of the RMP have become the main problem in the field of the sustainable development of urban housing, which requires a diversified housing security system that is based on population stratification. Previous researchers tend to regard the RMP as a homogeneous group when making recommendations for building the housing security system. With the advancement of urbanization, demographic stratification has emerged within the RMP. The diversity of actual housing demand caused by social status and household background is reflected in intrinsic and extrinsic factors, which include age, education, occupation, duration of mobility, city identity, and income. The unitary housing security pattern cannot solve the current challenges, which may be resolved by diverse modalities, particularly the preferential policy of public housing. The most fundamental measure for the relevant administrative departments is to analyze and explore the actual housing security demand of the RMP, based on diverse group features, which is conducive to improving the housing affordability of the RMP through multiple approaches.
From the perspective of the city, both the demographic structure and the local regional features should be considered comprehensively in the period of designing housing security policy. Meanwhile, it is necessary to ensure that the common and individual demands are embodied in the policy, which can play an active role in sustainable urban development and urbanization. Metropolises, such as Beijing, have many employment opportunities and income levels, which have a strong appeal for the RMP who are interested in high income but who lack city identity. However, a consequence of this is that the serious contradictions in housing have caused a decline in living standards. Tighter policies for housing security can be adopted to limit the population inflow. We suggest that the access threshold of policy could be raised appropriately. The applicant satisfies the criteria of local urban residents who join social insurance schemes and sign work contracts. In contrast, the housing resources of small- and medium-sized cities cannot be fully utilized, because of the insufficient urban attractiveness of these cities. We suggest that the application conditions of security housing should be diluted. Meanwhile, we can explore diverse forms of housing security, such as housing subsidies and monetary subsidies. Increasing the supply of public housing can make it possible to incorporate RMP into the urban housing security system. Therefore, effective policy for housing security consists of multiple ways to meet diverse needs and to promote sustainable city development.
The group of participants that is concerned with the housing security policy is large and complex. Because such policy concerns distribution, there may be information gaps. Faced with this situation, the dominant approaches are to establish methodical cooperation between suppliers of RMP housing security, and to strengthen the interdepartmental sharing of information resources, which is beneficial for the improvement of governance capacity. Therefore, the irregular changes in the housing demand of the RMP should be analyzed based on the population’s demographic structure. In addition, the important prerequisite for solving the series of social security problems for RMP, especially the problem of sustainable urban housing, is to build a big data management platform that is based on information related to housing security and RMP households. On the one hand, it is useful to achieve the pluralistic management of housing security resources and the effective use of public service resources. On the other hand, it is beneficial to make the housing security policies more effective and the resource distribution more rational.


