Ecological Pressure of Carbon Footprint in Passenger Transport: Spatio-Temporal Changes and Regional Disparities


Abstract
:1. Introduction
2. Methodology
2.1. Carbon Footprint Model for Passenger Transport
2.2. Model for the Ecological Pressure of the Carbon Footprint in Passenger Transport (EPcfpt)
2.3. Spatial Autocorrelation Analysis of EPcfpt in China
2.4. The Coefficient of Variation of EPcfpt in Eight Comprehensive Economic Zones
3. Data Sources
4. Results and Discussion
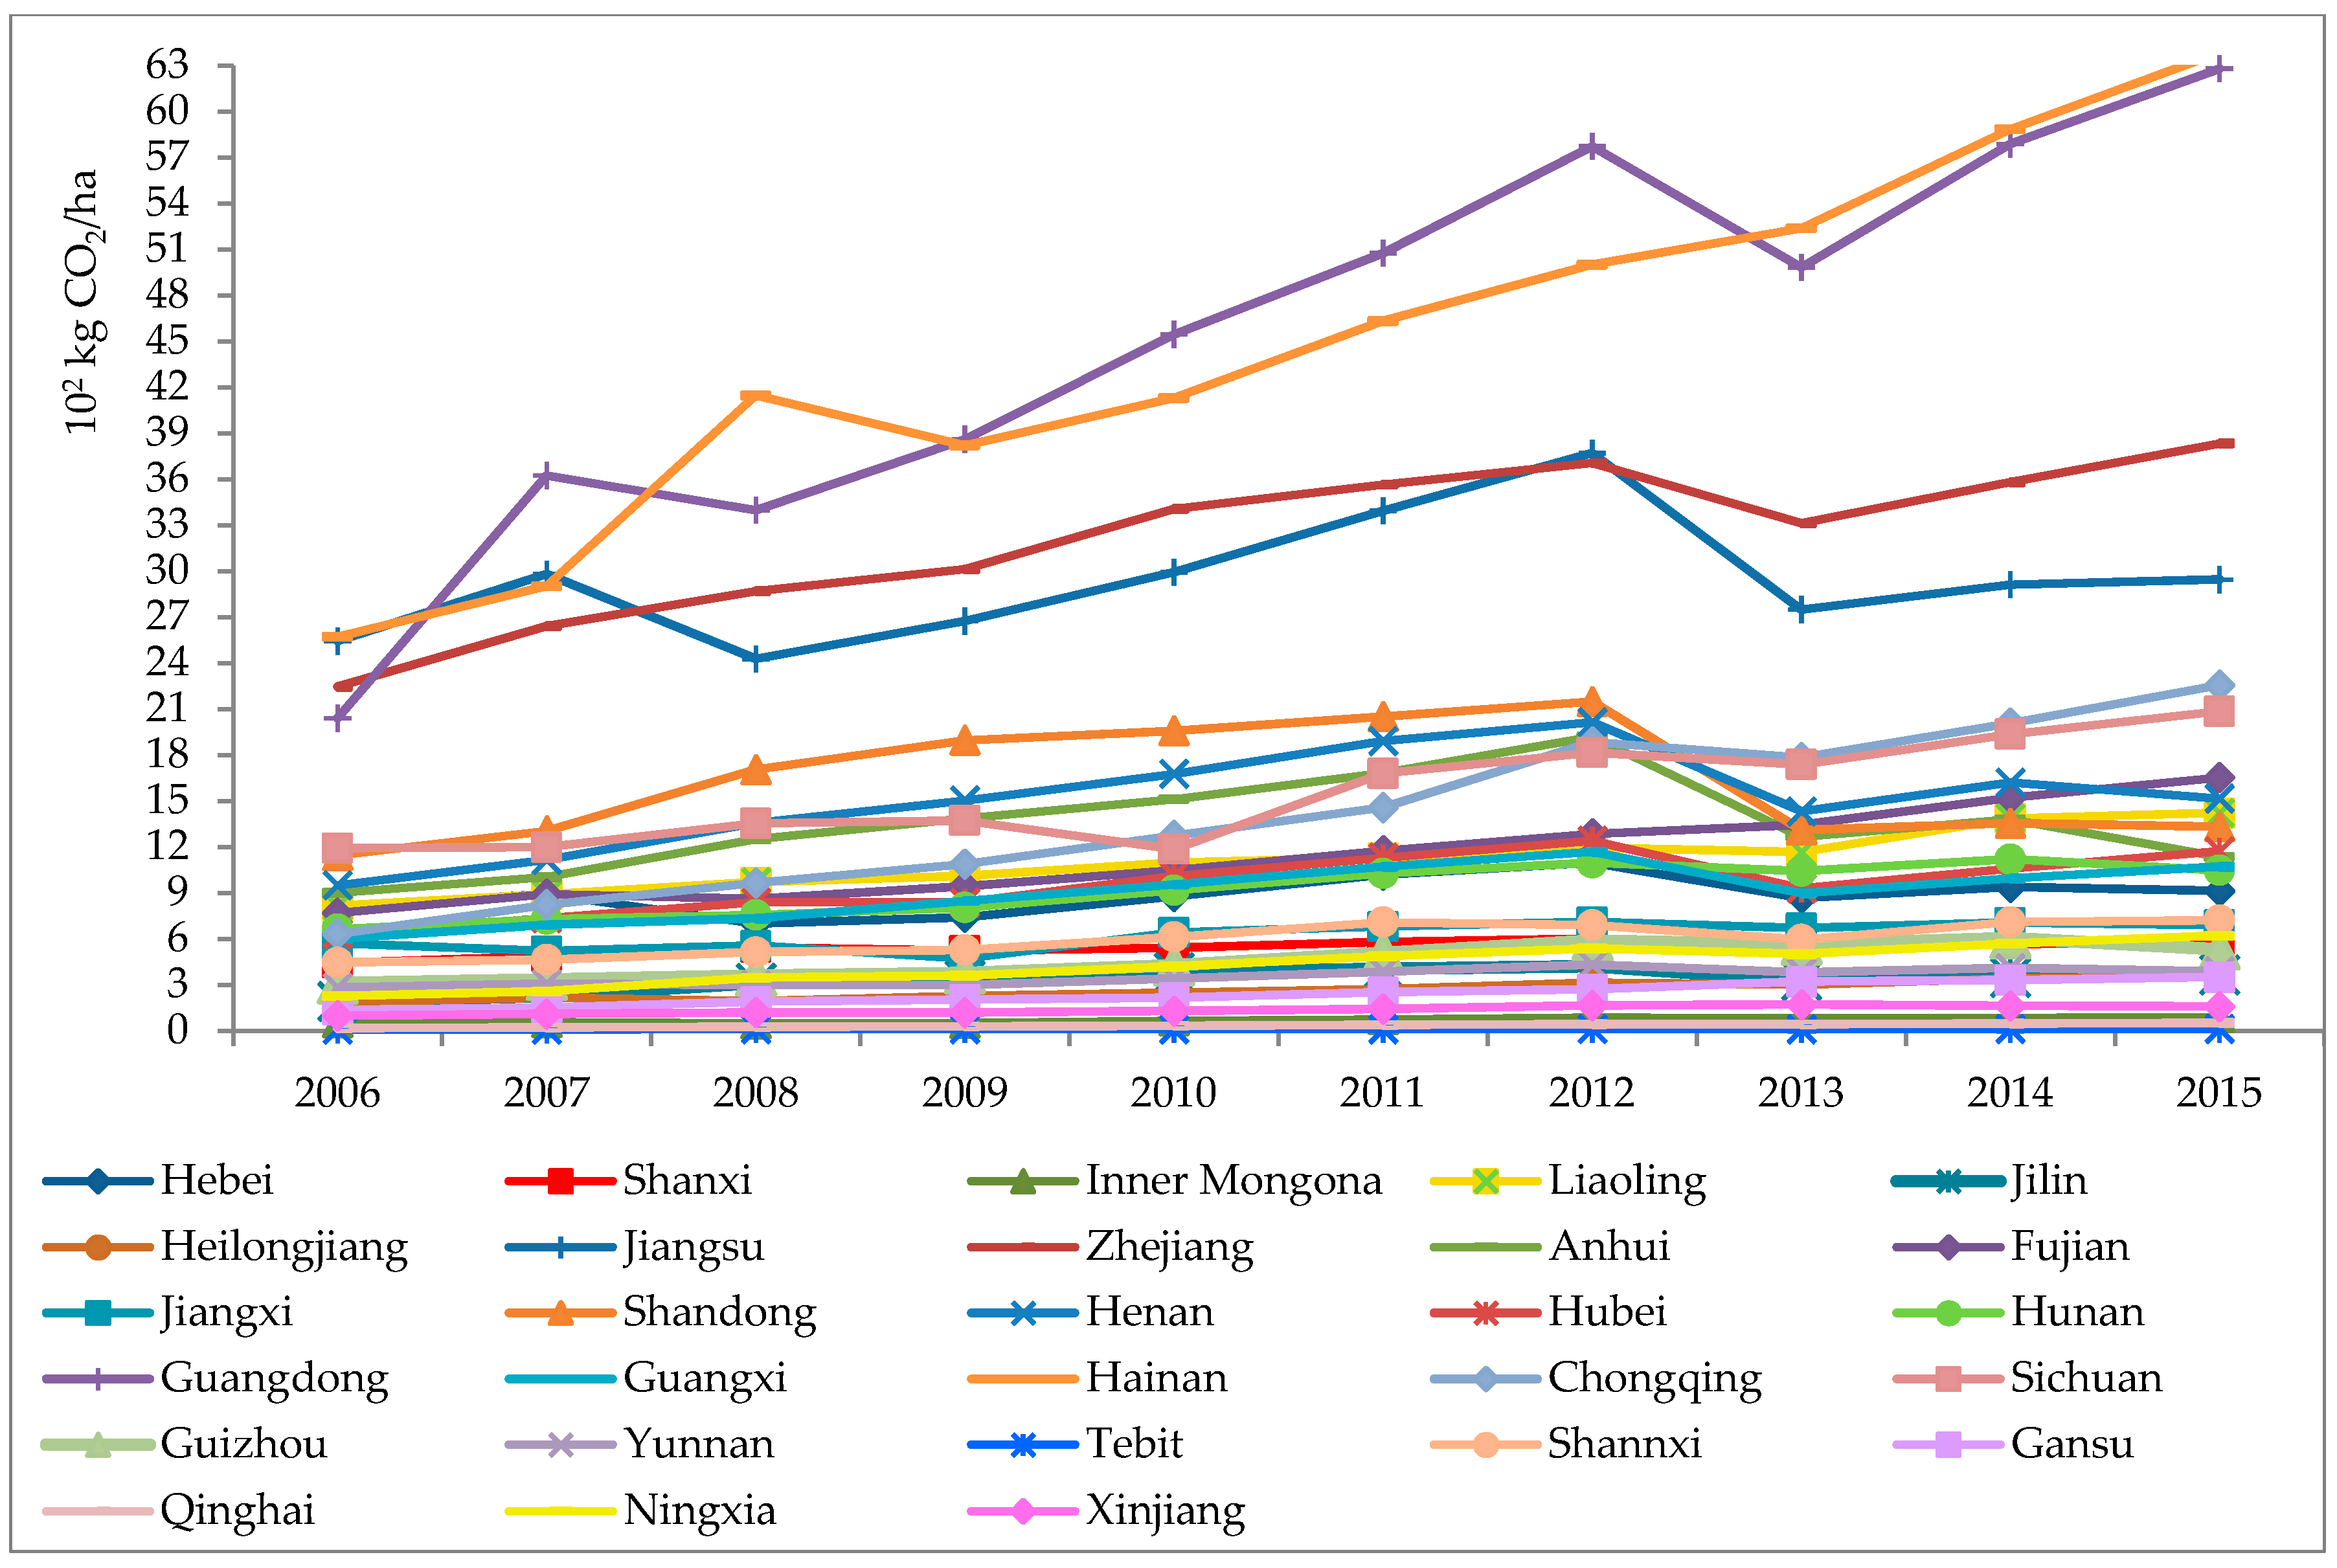
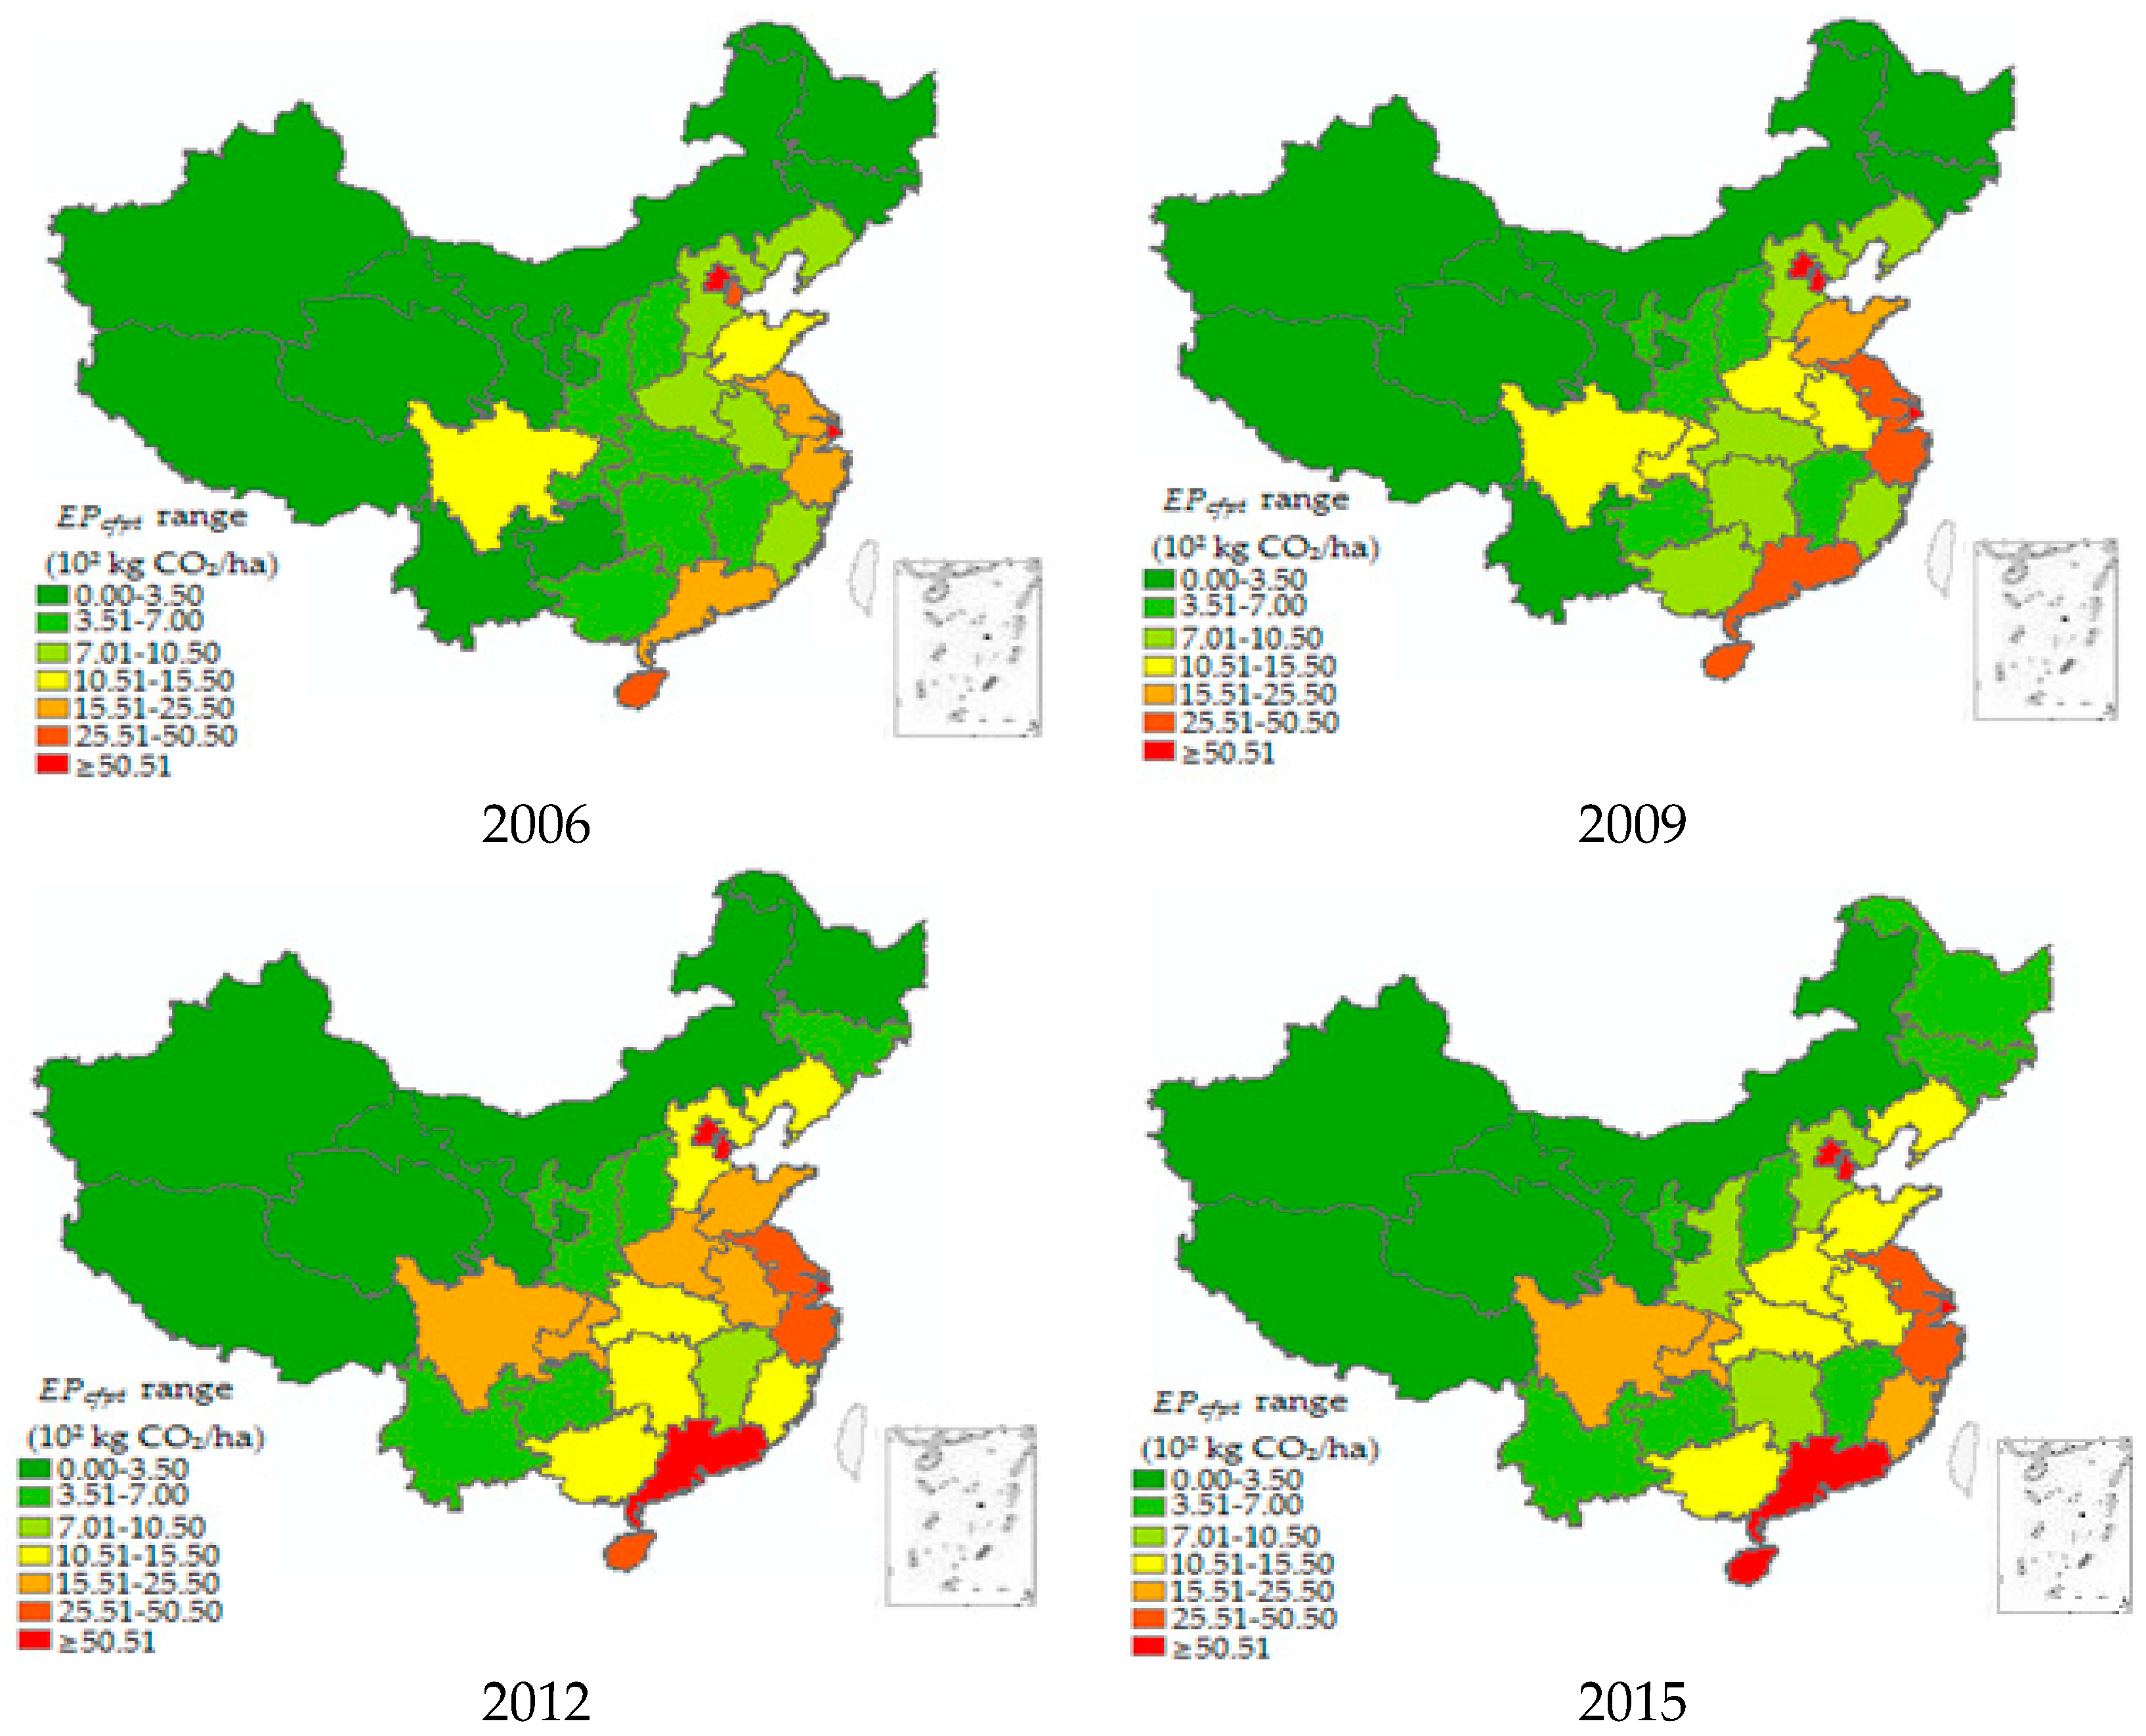
4.1. EPcfpt Results
4.2. Spatial Autocorrelation of EPcfpt in China
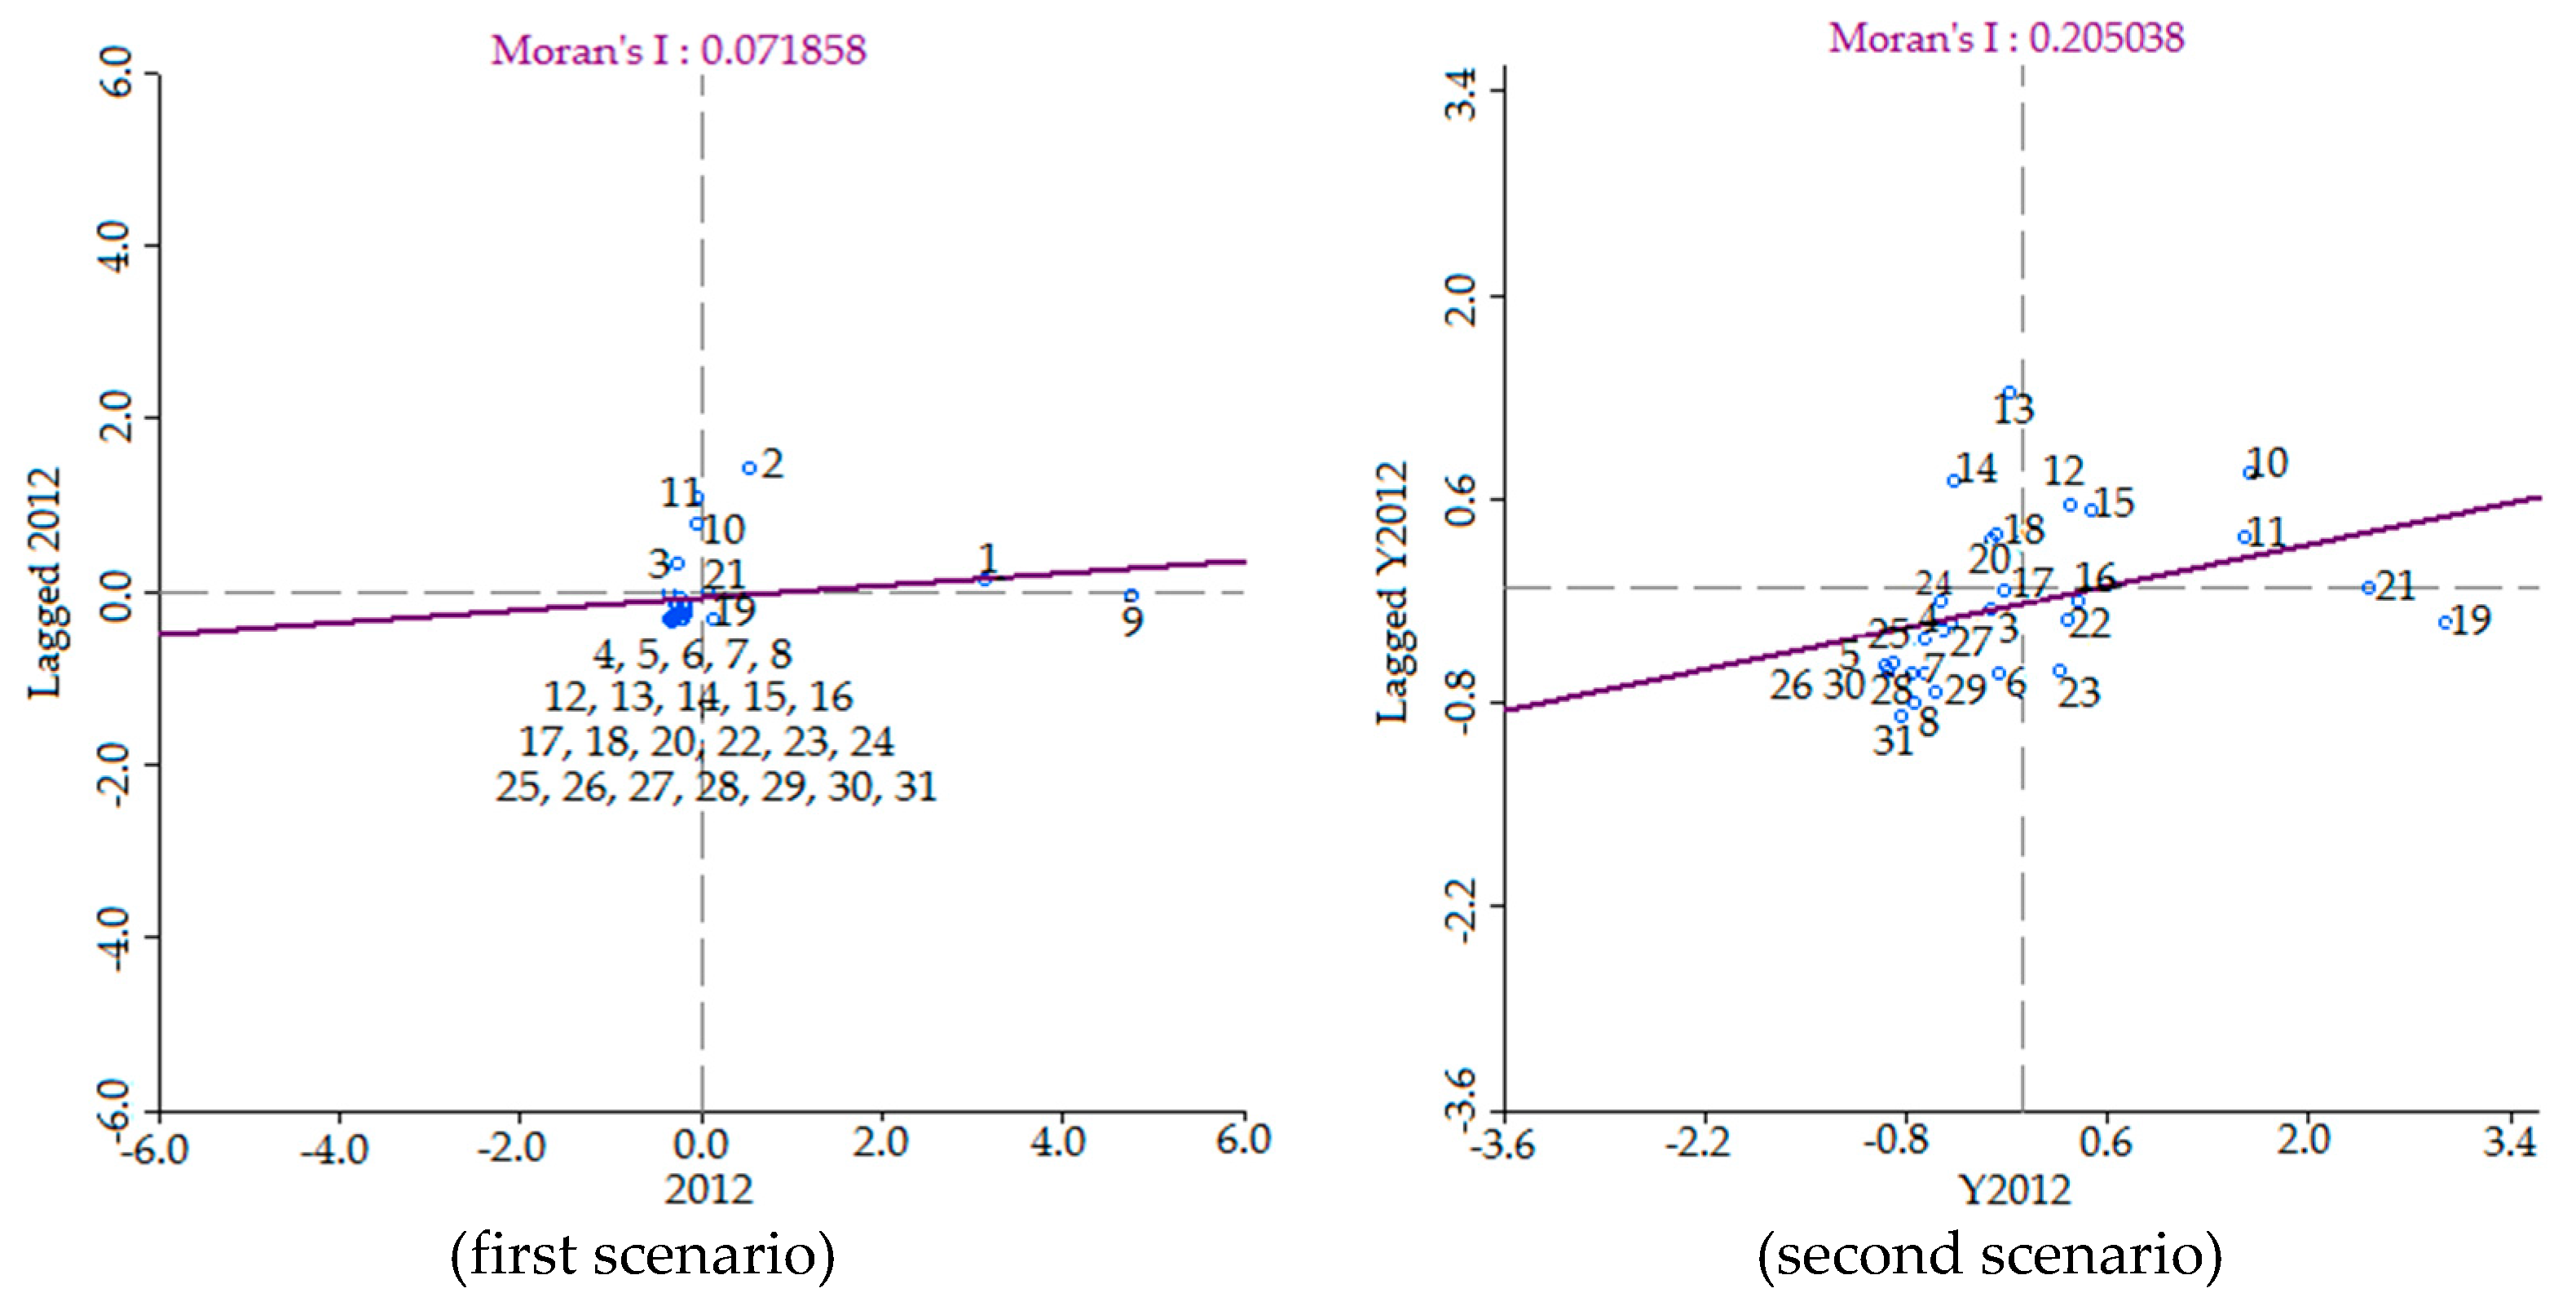
4.2.1. Global Spatial Autocorrelation Analysis
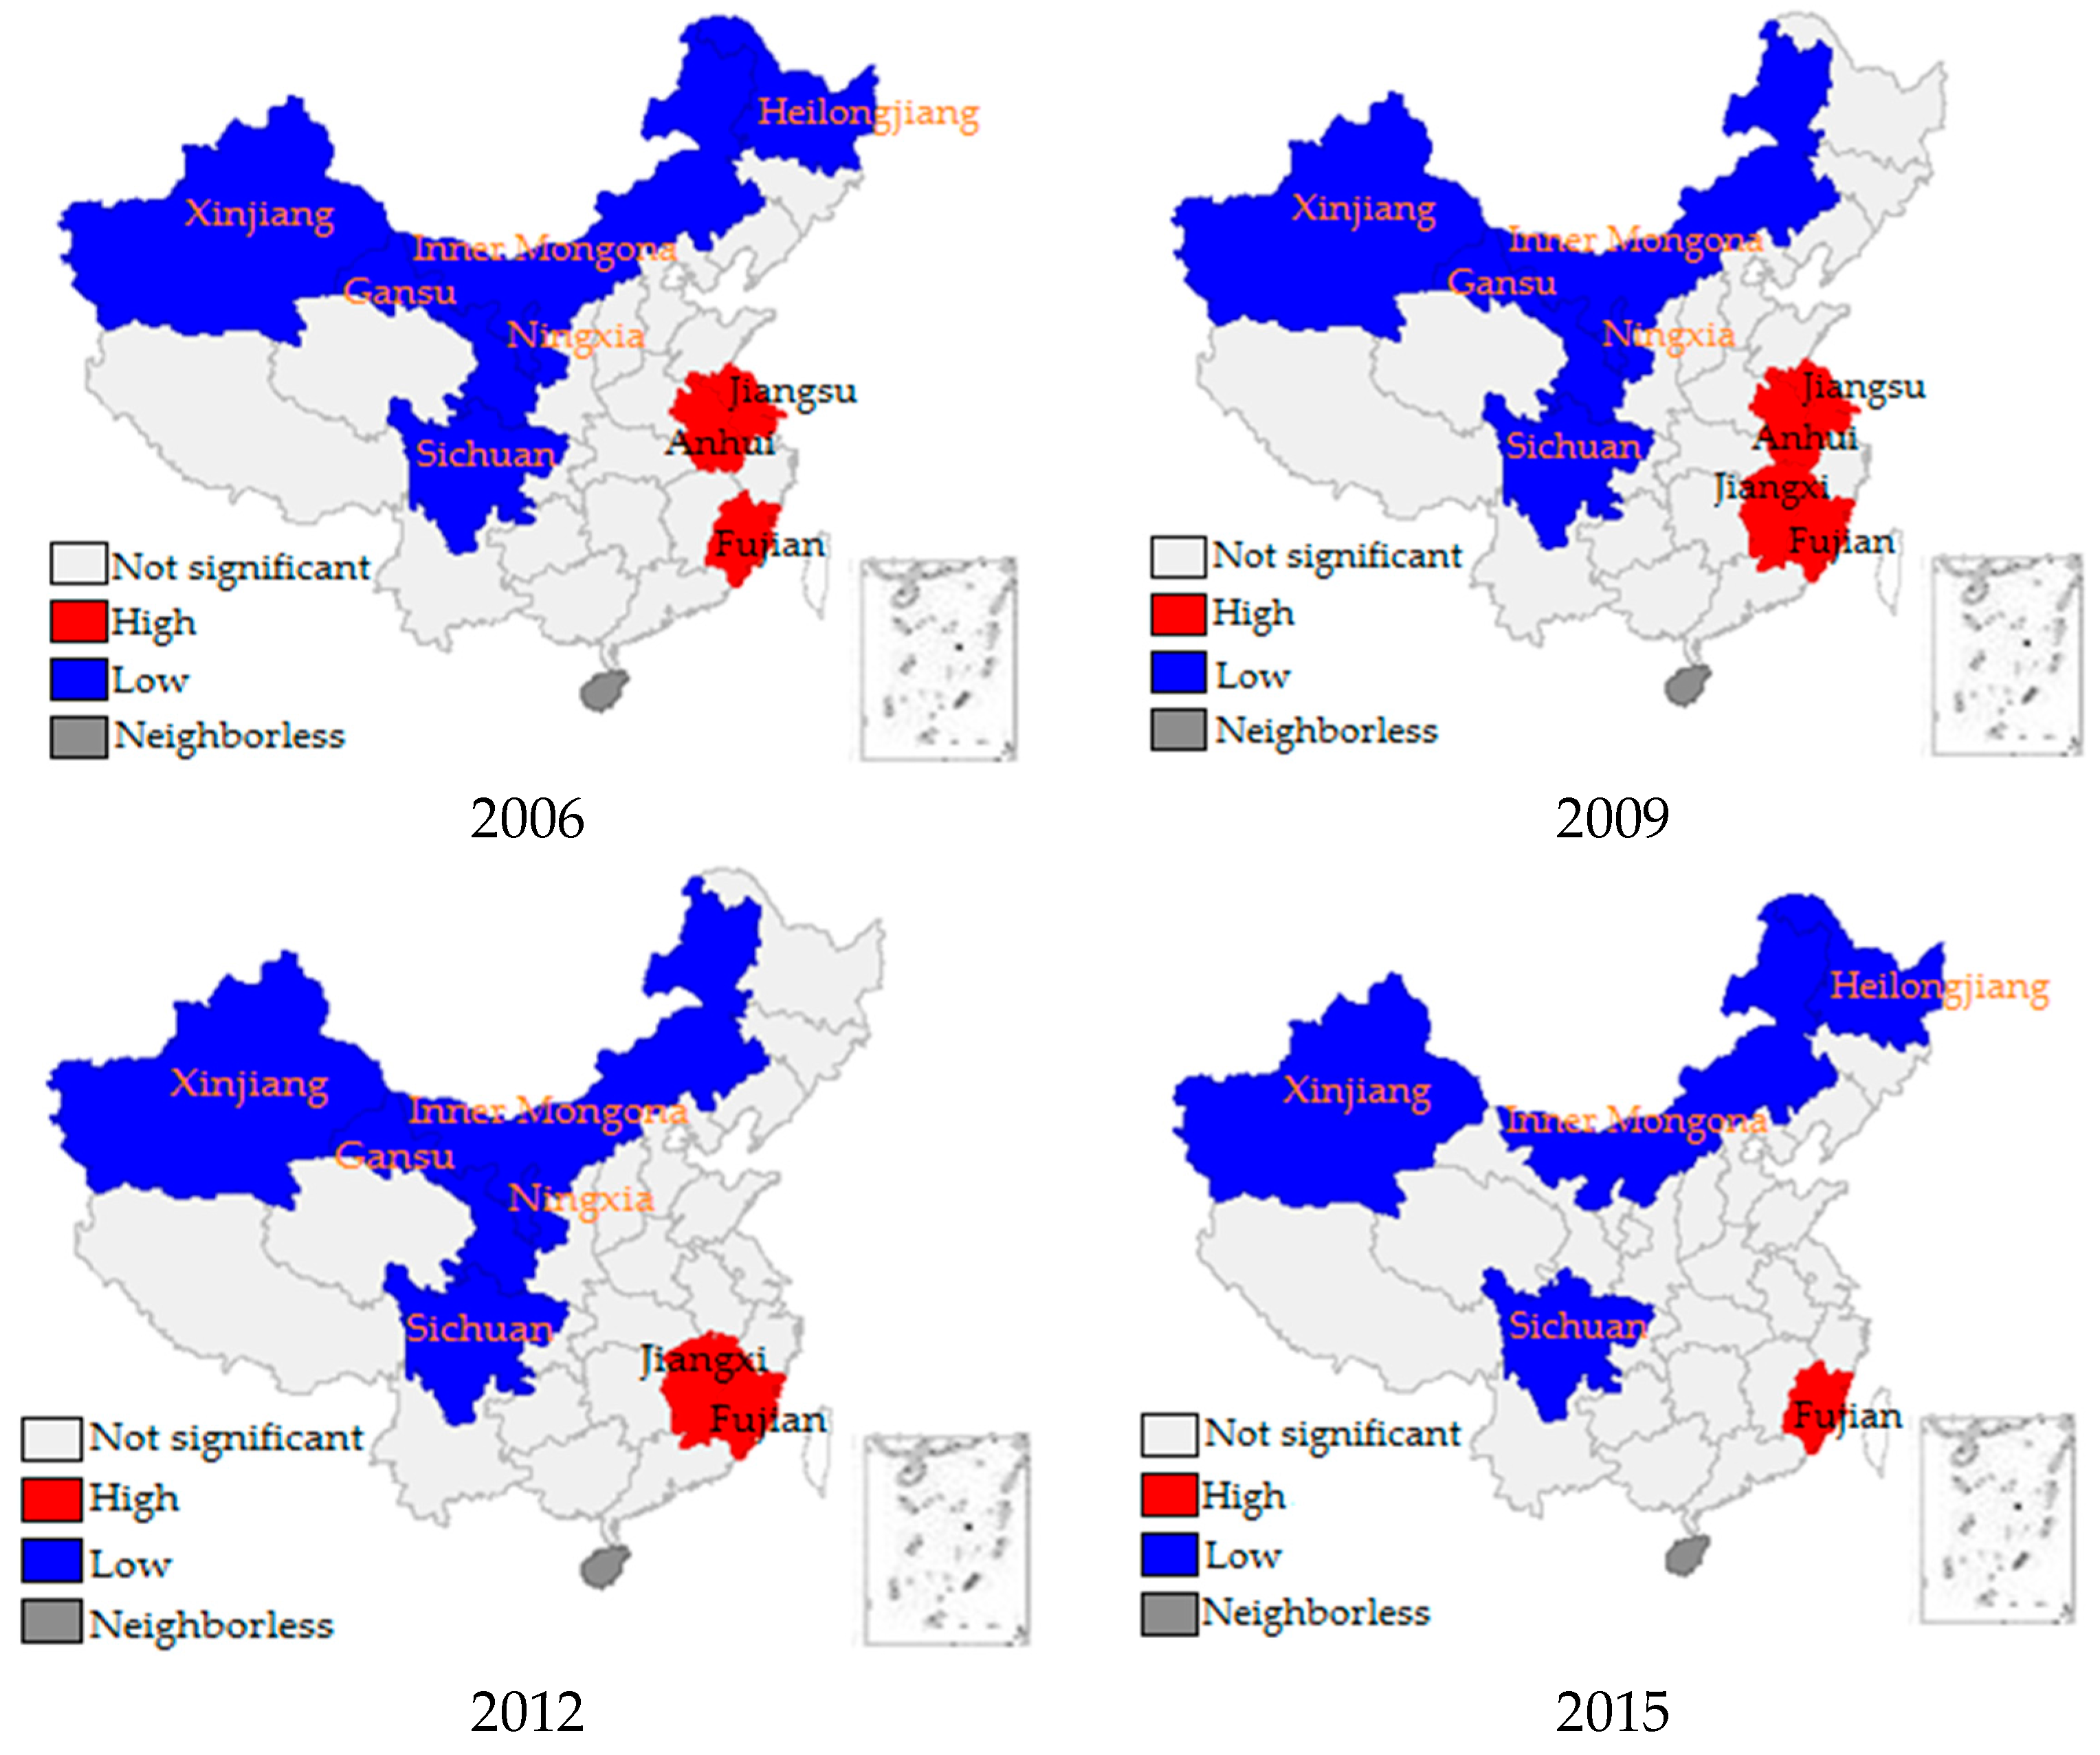
4.2.2. Local Spatial Autocorrelation Analysis
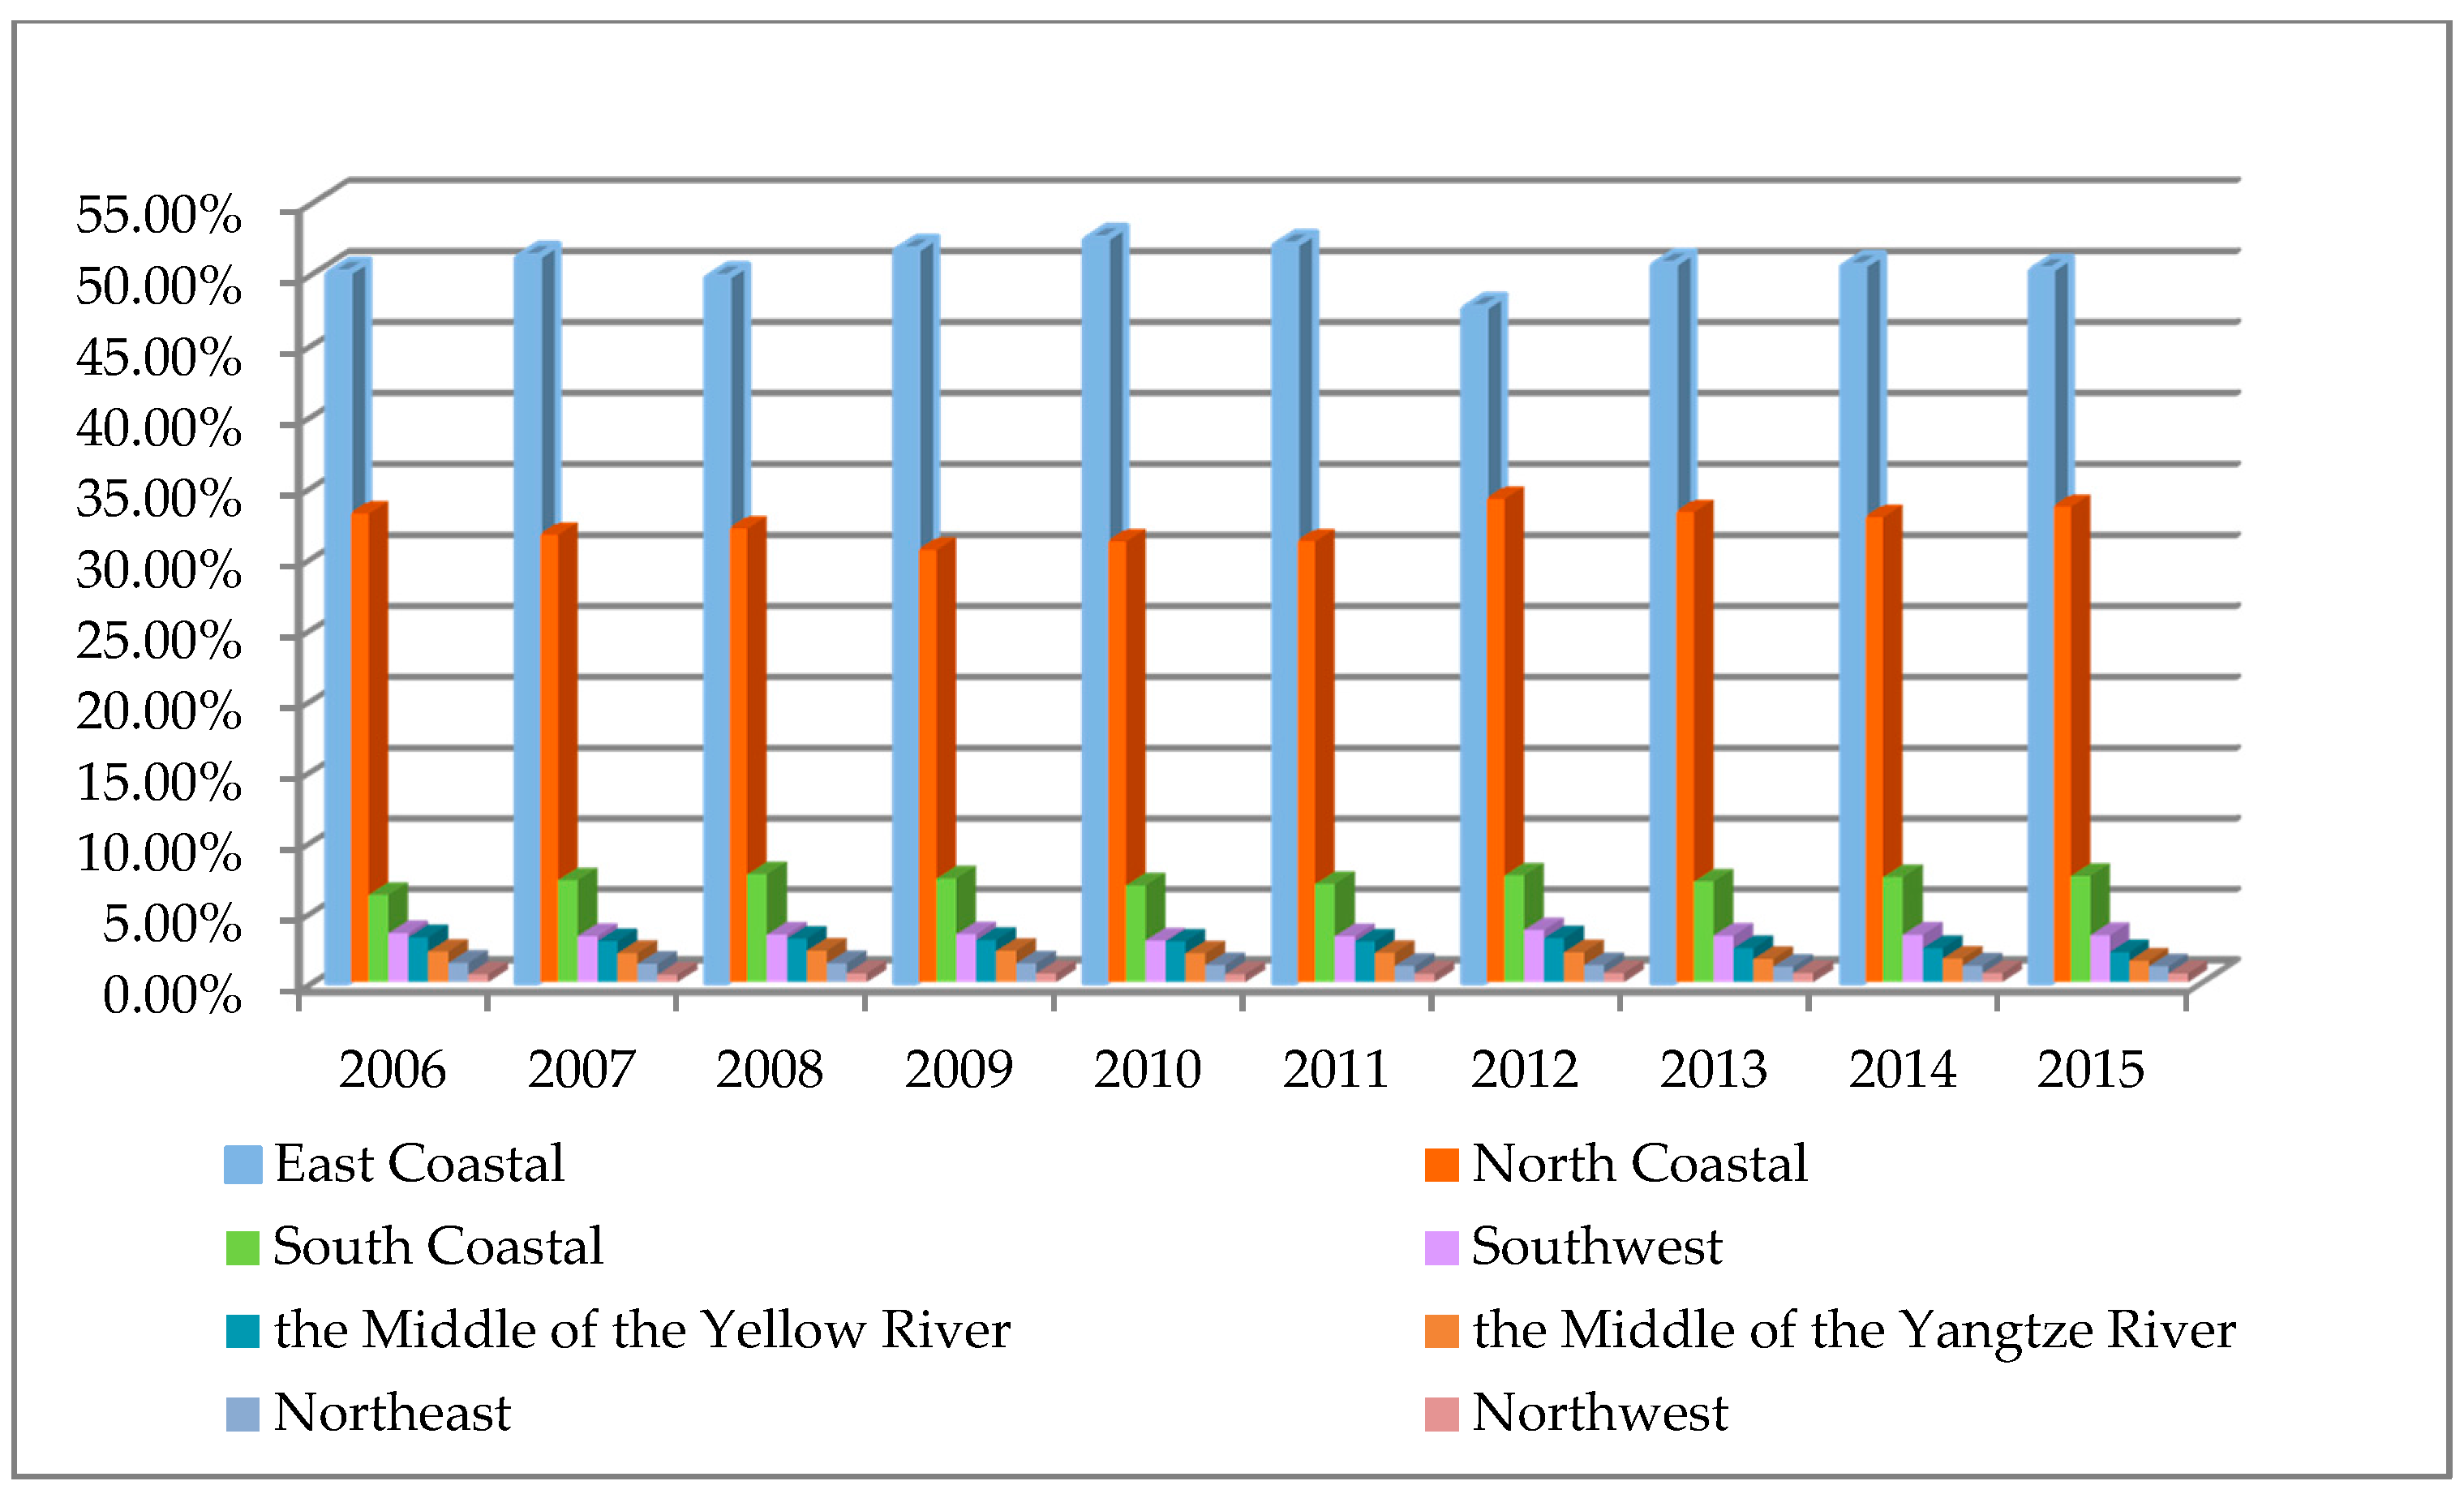
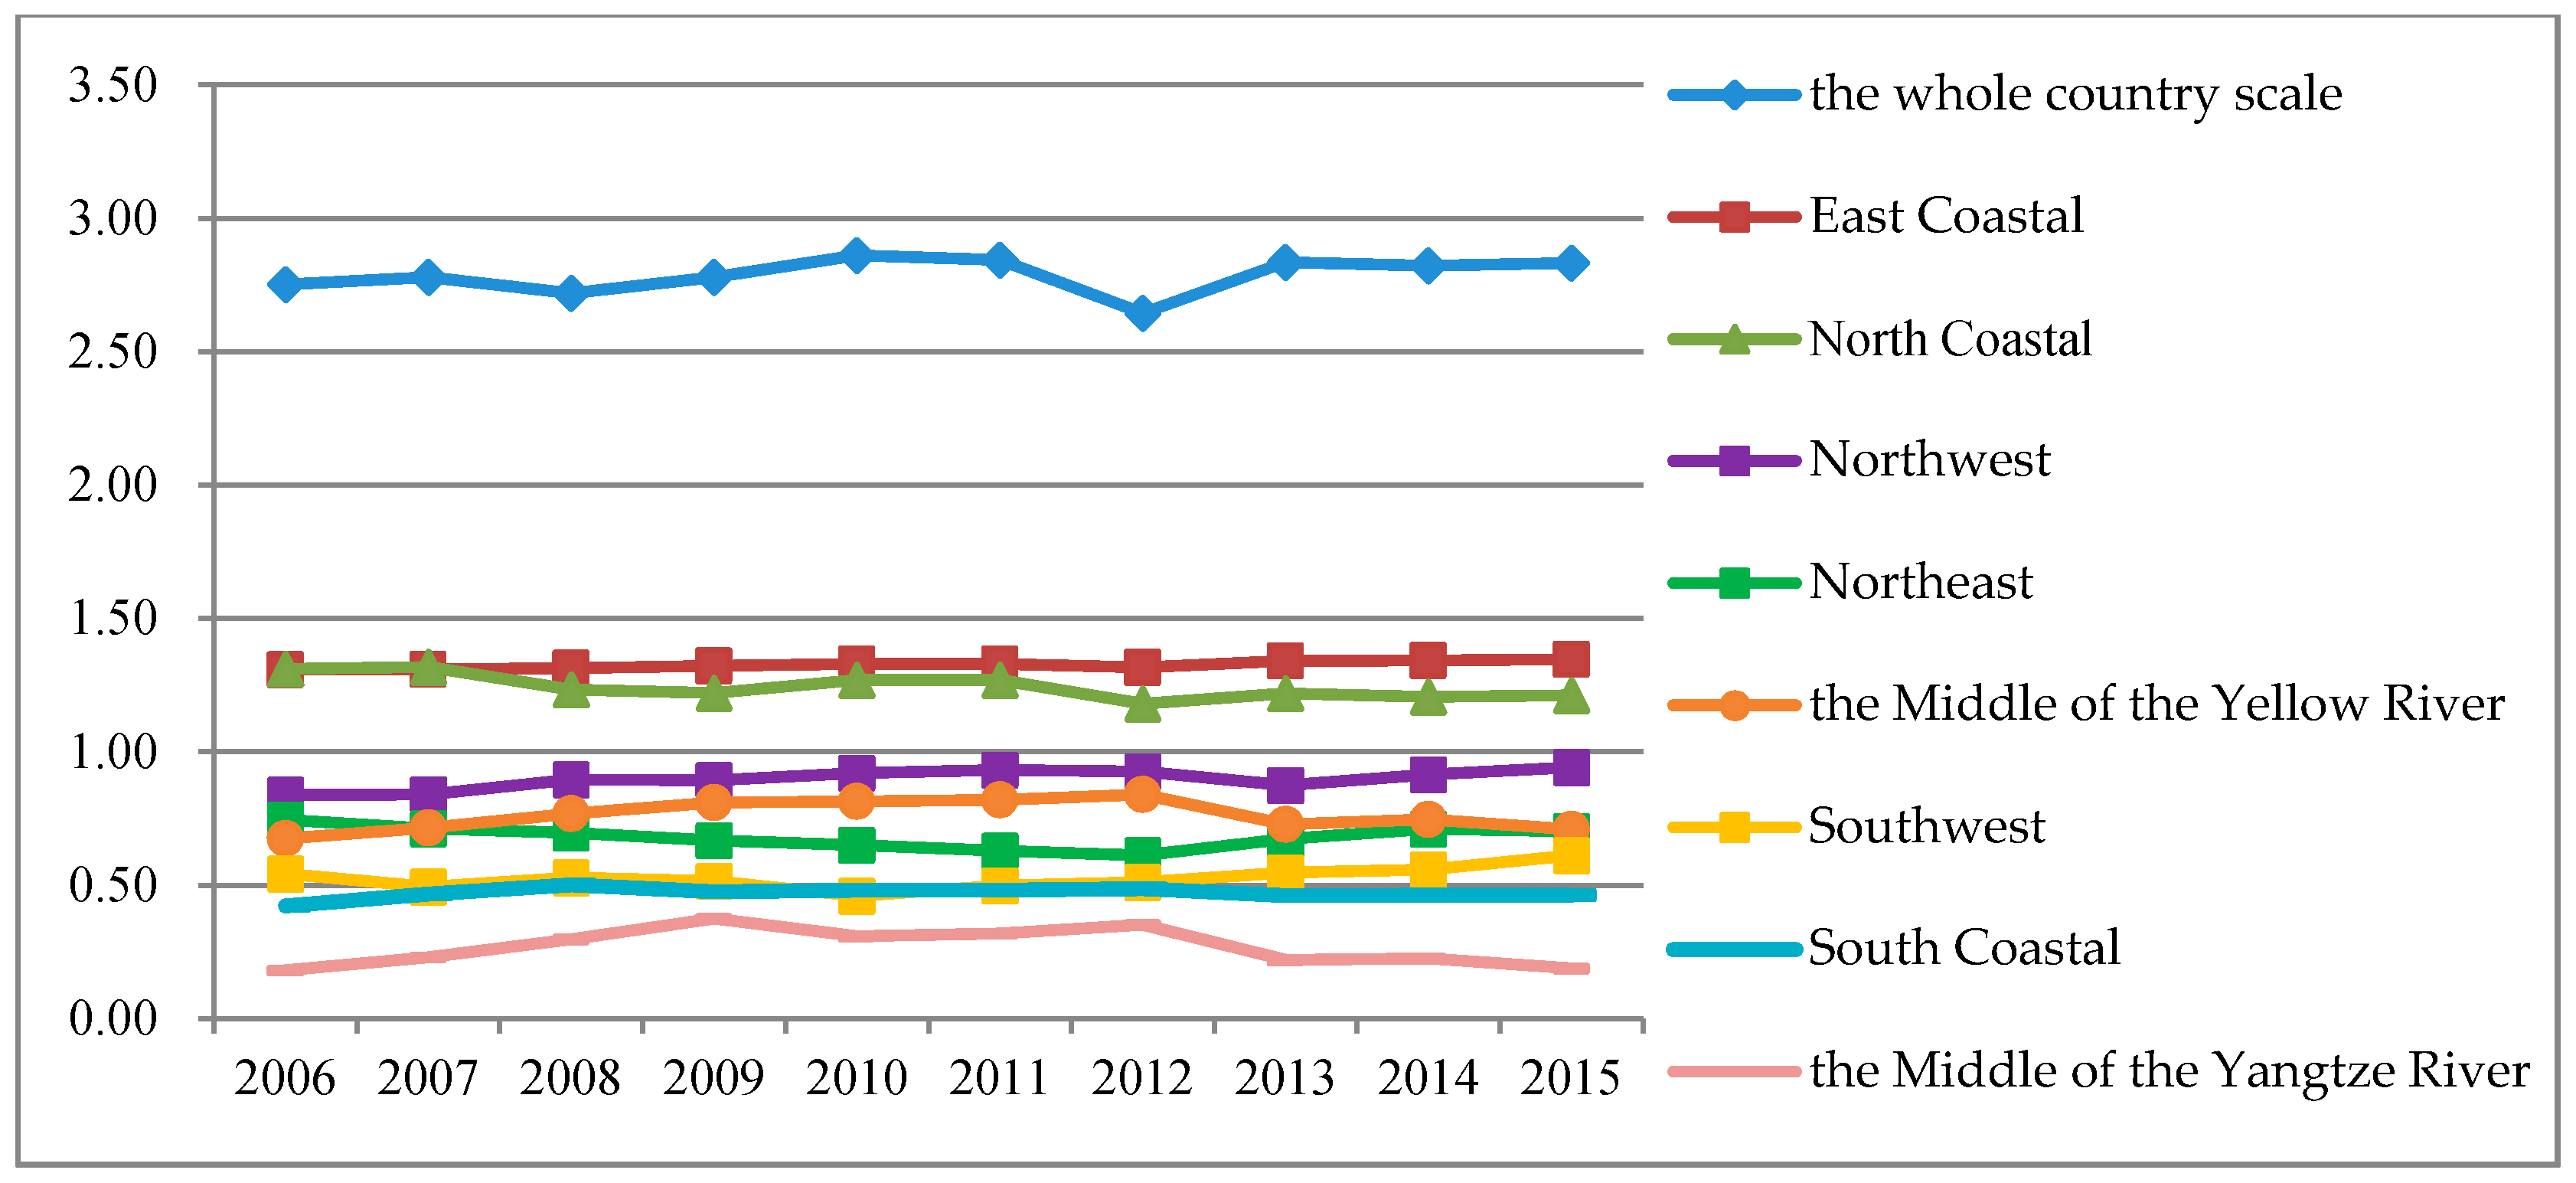
4.3. Regional Disparities of EPcfpt in China’s Eight Comprehensive Economic Zones
5. Conclusions and Recommendations
5.1. Conclusions
5.2. Recommendations and Future Research
Acknowledgments
Author Contributions
Conflicts of Interest
References
- Core Writing Team; Pachauri, R.K.; Meyer, L.A. Contribution of Working Groups I, II, and III to the Fifty Assessment Report of the Intergovernmental Panel on Climate Changes; Climate Change 2014: Synthesis Report; Intergovernmental Panel on Climate Changes (IPCC): Geneva, Switzerland, 2014. [Google Scholar]
- Li, Y.; Bao, L.; Li, W.X.; Deng, H.P. Inventory and Policy Reduction Potential of Greenhouse Gas and Pollutant Emissions of Road Transportation Industry in China. Sustainability 2016, 8, 1218. [Google Scholar] [CrossRef]
- Internal Energy Agency (IEA): CO2 Emission from Fuel Combustion-Highlights. Available online: http://www.iea.org/publications/freepublications/publication/name.31870.en.html (accessed on 13 April 2012).
- Dong, Q.H.; Meng, F.; Michael, Q.; Wang, K.H. Impacts of urban transportation mode split on CO2 emission in Jinan, China. Energies 2011, 4, 685–699. [Google Scholar]
- Wang, Z.J.; Chen, F.; Fujiyama, T. Carbon emission from urban passenger transportation in Beijing. Transp. Res. Part D 2015, 41, 217–227. [Google Scholar] [CrossRef]
- Mitali, D.G. Carbon Footprint from Road Transport Use in Kolkata City. Transp. Res. Part D 2014, 32, 397–410. [Google Scholar]
- Saboori, B.; Sapri, M.; Baba, M. Economic growth, energy consumption and CO2 emissions in OECD’s transport sector:A fully modified bi-directional relationship approach. Energy 2014, 66, 150–161. [Google Scholar] [CrossRef]
- Mckinnon, A.C.; Piecyk, M.I. Measurement of CO2 emissions from road freight transport: A review of UK experience. Energy Policy 2009, 37, 3733–3742. [Google Scholar] [CrossRef]
- Yin, X.; Chen, W.; Eom, J.; Clarke, L.E.; Kim, S.H.; Patel, P.L.; Yu, S. China’s transportation energy consumption and CO2 emissions from a global perspective. Energy Policy 2015, 82, 233–248. [Google Scholar] [CrossRef]
- Timilsiina, G.R.; Shrestha, A. Transportation sector CO2 emissions growth in Asia: Underlying factors and policy options. Energy Policy 2009, 37, 4523–4539. [Google Scholar] [CrossRef]
- Yang, L.; Yi, J.C.; Xiao, Z.; Yang, Q.S.; Zhi, Y.Z. A carbon emission evaluation for an integrated logistics system-a case study of the port of Shenzhen. Sustainability 2017, 9, 462. [Google Scholar] [CrossRef]
- Ercan, T.; Onat, N.C.; Tatari, O. Investigating Carbon Footprint Reduction Potential of Public Transportation in United States: A system dynamics approach. J. Clean. Prod. 2016, 133, 1260–1276. [Google Scholar] [CrossRef]
- Zheng, H.; Fang, Q.; Wang, C.; Hui, W.W.; Ren, R. China’s carbon footprint based on input-output table series: 1992–2020. Sustainability 2017, 9, 387. [Google Scholar] [CrossRef]
- Liu, H.B.; Zi, Y.; Xu, A. A comparative life-cycle energy and emission analysis for intercity passenger transportation in the U.S. aviation, intercity bus and automobile. Transp. Res. Part D 2016, 48, 267–483. [Google Scholar] [CrossRef]
- Patanavaraha, V.; Jomnonkwao, S. Trends in Thailand CO2 emissions in the transportation sector and Policy Mitigation. Transp. Policy 2015, 41, 136–146. [Google Scholar] [CrossRef]
- Seo, J.; Park, J.; Oh, Y.; Park, S. Estimation of total transport CO2 emission generation by medium-and heavy-duty vehicles in sector of Korea. Energies 2016, 9, 638. [Google Scholar] [CrossRef]
- Fan, F.Y.; Lei, Y.L. Decomposition analysis of energy-related carbon emissions from the transportation sector in Beijing. Transp. Res. Part D 2016, 42, 135–145. [Google Scholar] [CrossRef]
- Jie, F.D.; Deng, C.; Rong, R.L. Moving low-carbon transportation in Xinjiang: Evidence from STIRPAT and rigid regression models. Sustainability 2017, 9, 24–39. [Google Scholar]
- Andrade, C.E.S.D.; D’Agosto, M.D.A. The role of rail transit systems in reducing energy and carbon dioxide emission: The case of the city of Rio de Janeiro. Sustainability 2016, 8, 150. [Google Scholar] [CrossRef]
- Han, J.; Hayashi, Y. A system dynamics model of CO2 mitigation in China’s inter-city passenger transport. Transp. Res. Part D 2008, 13, 298–305. [Google Scholar] [CrossRef]
- Wiedmann, T.O.; Minx, J. A definition of ‘carbon footprint’. Ecol. Econ. Res. Trends 2008, 1, 1–11. [Google Scholar]
- Wiedmann, T.O. Carbon footprint and input-output analysis—An introduction. Econ. Syst. Res. 2009, 3, 175–186. [Google Scholar] [CrossRef]
- Melanta, S.; Miller-Hooks, E.; Avetisyan, G.H. Carbon footprint estimation tool for transportation project.Conster. Eng. Manag. 2013, 5, 547–555. [Google Scholar]
- Ribau, J.P.; Sousa, J.; Carla, M. Reducing the carbon footprint of urban bus fleets using multi-objective optimization. Energy 2015, 93, 1089–1104. [Google Scholar] [CrossRef]
- Padgett, J.P.; Steinemann, A.C.; Clarke, J.H.; Vandenbergh, M.P. A comparison of carbon calculators. Environ. Impact Assess. Rev. 2008, 28, 106–115. [Google Scholar] [CrossRef]
- Sharp, H.; Grundius, J.; Heinonen, J. Carbon footprint of inbound tourism to Iceland: A consumption-based life-cycle assessment including direct and indirect emission. Sustainability 2016, 8, 1147. [Google Scholar] [CrossRef]
- Wang, B.B.; Shao, C.F.; Ji, X. Influencing Mechanism Analysis of Holiday Activity-Travel Patterns on Transportation Energy Consumption and Emissions in China. Energies 2017, 10, 897. [Google Scholar] [CrossRef]
- Chen, G.W.; Wiedmann, T.; Wang, Y.F.; Hadjikakou, M. Transnational city carbon footprint networks—Exploring carbon links between Australian and Chinese cities. Appl. Energy 2016, 184, 1082–1092. [Google Scholar] [CrossRef]
- Xie, X.; Cai, W.J.; Jiang, Y.K. Carbon footprint and embodied carbon flows analysis for china’s eight regions:a new perspective for mitigation solutions. Sustainability 2015, 7, 10098–10114. [Google Scholar] [CrossRef]
- Zhao, R.Q.; Huang, X.J.; Liu, Y.; Zhong, T.; Ding, M.; Chuai, X. Urban Carbon Footprint and Carbon Cycle Pressure: The case study of Nanjing. J. Geogr. Sci. 2014, 24, 159–176. [Google Scholar] [CrossRef]
- Hertwich, E.G.; Peter, G.P. Carbon footprint of national: A global, trade-linked analysis. Envinon. Sci. Technol. 2009, 16, 6414–6420. [Google Scholar] [CrossRef]
- Matthews, H.S.; Hendrickson, C.; Weber, C. The importance of carbon footprint estimation boundaries. Environ. Sci. Technol. 2008, 42, 5839–5842. [Google Scholar] [CrossRef] [PubMed]
- Hillsman, E.L.; Cevallos, F.; Sando, T. Carbon footprint for public transportation agency in Florida transportation research record. J. Transp. Res. Board 2012, 10, 80–88. [Google Scholar] [CrossRef]
- Ji, X.; Chen, G.Q. Exergy analysis of energy utilization in the transportation sector in China. Energy Policy 2006, 14, 1709–1719. [Google Scholar] [CrossRef]
- Ji, X.; Chen, G.Q.; Chen, B.; Jiang, M.M. Exergy-based assessment for waste gas emissions from Chinese transportation. Energy Policy 2009, 6, 2231–2240. [Google Scholar] [CrossRef]
- Ji, X.; Chen, G.Q. Unified account of gas pollutants and greenhouse gas emissions: Chinese transportation 1978–2004. Commun. Nonlinear Sci. Numer. Simul. 2010, 19, 2710–2722. [Google Scholar] [CrossRef]
- The 13th“Five-Year” Planning about Energy Conservation and Emission Mitigation in Transportation. Available online: http://www.mot.gov.cn/zhuanti/shisanwujtysfzgh/ (accessed on 5 January 2017). (In Chinese)
- Xu, J.P.; Lin, X.Y. China’s urban passenger traffic ecological footprint calculation -to Beijing as an example. J. City Probl. 2015, 9, 74–80. [Google Scholar]
- Xu, L.H.; Wei, Y.N. An overview of carbon footprint research in transportation. J. Traffic Inf. Secur. 2014, 32, 1–7. [Google Scholar]
- Wu, P.; Shi, P.H. An estimation of energy consumption and CO2 emission in tourism sector of China. J. Geogr. Sci. 2011, 21, 744–745. [Google Scholar] [CrossRef]
- GÖsslinga, S.; Peeters, P. The eco-efficiency of tourism. Ecol. Econ. 2005, 54, 417–434. [Google Scholar] [CrossRef]
- Intergovernmental Panel on Climate Change (IPCC). Guidelines for National Greenhouse Gas Inventories; IPCC: Geneva, Switzerland, 2006; Volume 2. [Google Scholar]
- Pan, Y.D.; Birdsey, R.A.; Fang, J.Y.; Houghton, R.; Kauppi, P.K.; Kurz, W.A.; Phillips, O.L.; Shvidenko, A.; Lewis, S.L.; Canadell, J.G.; et al. A large and persistent carbon sink in the world’s forests. Science 2011, 333, 988–993. [Google Scholar] [CrossRef] [PubMed]
- He, Y.F.; Xie, H.L.; Fan, Y.H.; Wang, W.; Xie, X. Forested land use efficiency in china: Spatiotemporal patterns and influencing factors from 1999 to 2010. Sustainability 2016, 8, 772. [Google Scholar] [CrossRef]
- Zhang, S.L.; Zhang, K. Contrast study on the local indices of spatial autocorrelation. Stat. Res. 2007, 24, 65–67. [Google Scholar]
- Eight Major Economic Zones. Available online: https://baike.so.com/doc/6892804-7110349.html (accessed on 17 October 2014). (In Chinese).
- National Bureau of Statistics of the People’s Republic of China. China Statistical Yearbook; China Statistics Press: Beijing, China, 2006–2015.
- Ministry of Land and Resources of the People’s Republic of China. China’s Land and Resources Yearbook; Geological Publishing House: Beijing, China, 2006–2015.
- Openshaw, S. The Modifiable Areal Unit Problem; Geobooks; University of East Anglia: Norwich, UK, 1984. [Google Scholar]


| Transport Mode | Road | Railway | Aviation | Waterway |
|---|---|---|---|---|
| βi (kg CO2/pkm) | 0.132 | 0.065 | 0.369 | 0.07 |
| Economic Zones | Provinces a | Economic Zones | Provinces a |
|---|---|---|---|
| North Coastal | 1, 2, 3, 15 | East Coastal | 9, 10, 11 |
| South Coastal | 13, 19, 21 | Northwest | 26, 28, 29, 30, 31 |
| The Middle of the Yangtze River | 4, 5, 16, 27 | Southwest | 20, 22, 23, 24, 25 |
| The Middle of the Yellow River | 12, 14, 17, 18 | Northeast | 6, 7, 8 |
| Province a | Ecological Pressure of Carbon Footprint in Passenger Transport (102 kg CO2/ha) | |||||||||
|---|---|---|---|---|---|---|---|---|---|---|
| 2006 | 2007 | 2008 | 2009 | 2010 | 2011 | 2012 | 2013 | 2014 | 2015 | |
| 1 | 234.42 | 265.33 | 273.69 | 276.58 | 350.37 | 386.91 | 406.72 | 410.92 | 439.37 | 483.87 |
| 2 | 33.89 | 37.14 | 54.68 | 55.47 | 62.74 | 69.78 | 104.94 | 106.21 | 119.31 | 133.00 |
| 3 | 8.09 | 8.92 | 6.98 | 7.40 | 8.76 | 10.17 | 10.97 | 8.66 | 9.37 | 9.12 |
| 4 | 4.42 | 4.86 | 5.43 | 5.22 | 5.41 | 5.78 | 5.99 | 5.64 | 5.65 | 5.72 |
| 5 | 0.51 | 0.54 | 0.45 | 0.48 | 0.64 | 0.72 | 0.85 | 0.80 | 0.82 | 0.86 |
| 6 | 8.14 | 8.88 | 9.69 | 10.09 | 10.97 | 11.29 | 11.94 | 11.65 | 13.86 | 14.21 |
| 7 | 1.90 | 2.26 | 3.10 | 3.28 | 3.79 | 4.03 | 4.19 | 3.26 | 3.48 | 3.65 |
| 8 | 1.85 | 2.14 | 1.92 | 2.25 | 2.47 | 2.70 | 3.12 | 2.99 | 3.39 | 3.53 |
| 9 | 387.68 | 469.68 | 494.49 | 550.19 | 680.25 | 745.00 | 684.33 | 762.19 | 830.60 | 890.25 |
| 10 | 25.43 | 29.80 | 24.26 | 26.73 | 29.93 | 33.93 | 37.70 | 27.49 | 29.11 | 29.44 |
| 11 | 22.45 | 26.41 | 28.69 | 30.12 | 34.06 | 35.64 | 37.04 | 33.11 | 35.80 | 38.32 |
| 12 | 9.00 | 10.03 | 12.50 | 13.85 | 15.11 | 16.82 | 19.18 | 12.66 | 13.80 | 11.35 |
| 13 | 7.68 | 8.92 | 8.60 | 9.42 | 10.47 | 11.75 | 12.85 | 13.44 | 15.20 | 16.52 |
| 14 | 5.70 | 5.19 | 5.55 | 4.70 | 6.41 | 6.79 | 7.09 | 6.69 | 7.05 | 6.89 |
| 15 | 11.44 | 13.04 | 17.04 | 18.95 | 19.56 | 20.49 | 21.48 | 13.10 | 13.53 | 13.31 |
| 16 | 9.49 | 11.14 | 13.56 | 15.02 | 16.75 | 18.90 | 20.12 | 14.31 | 16.19 | 15.15 |
| 17 | 6.31 | 7.34 | 8.38 | 8.36 | 10.10 | 11.28 | 12.40 | 9.29 | 10.57 | 11.71 |
| 18 | 6.61 | 7.27 | 7.54 | 8.03 | 9.16 | 10.26 | 10.95 | 10.41 | 11.19 | 10.46 |
| 19 | 20.39 | 36.23 | 33.97 | 38.60 | 45.44 | 50.74 | 57.71 | 49.81 | 57.87 | 62.78 |
| 20 | 5.99 | 6.91 | 7.32 | 8.47 | 9.54 | 10.70 | 11.67 | 8.97 | 9.94 | 10.70 |
| 21 | 25.71 | 29.02 | 41.46 | 38.20 | 41.29 | 46.32 | 49.99 | 52.37 | 58.83 | 63.84 |
| 22 | 6.32 | 8.22 | 9.65 | 10.87 | 12.74 | 14.57 | 18.84 | 17.82 | 20.07 | 22.55 |
| 23 | 11.91 | 11.97 | 13.53 | 13.71 | 11.85 | 16.79 | 18.15 | 17.37 | 19.35 | 20.84 |
| 24 | 3.10 | 3.33 | 3.59 | 3.76 | 4.27 | 5.09 | 5.89 | 5.62 | 6.04 | 5.30 |
| 25 | 2.81 | 3.06 | 2.98 | 2.98 | 3.40 | 3.85 | 4.30 | 3.80 | 4.09 | 3.87 |
| 26 | 0.07 | 0.08 | 0.10 | 0.10 | 0.10 | 0.10 | 0.11 | 0.10 | 0.11 | 0.11 |
| 27 | 4.45 | 4.63 | 5.12 | 5.26 | 6.11 | 7.08 | 6.89 | 5.94 | 7.09 | 7.21 |
| 28 | 1.35 | 1.49 | 1.89 | 2.03 | 2.16 | 2.52 | 2.70 | 3.20 | 3.30 | 3.50 |
| 29 | 0.16 | 0.20 | 0.24 | 0.28 | 0.32 | 0.37 | 0.42 | 0.41 | 0.47 | 0.51 |
| 30 | 2.26 | 2.57 | 3.46 | 3.59 | 4.19 | 4.86 | 5.37 | 5.00 | 5.68 | 6.20 |
| 31 | 0.97 | 1.09 | 1.18 | 1.17 | 1.28 | 1.42 | 1.64 | 1.70 | 1.62 | 1.57 |
| Unadjusted (First Scenario) | Adjusted (Second Scenario) | |||||
|---|---|---|---|---|---|---|
| Year | Moran’s I-Value | Z-Value | p-Value | Moran’s I-Value | Z-Value | p-Value |
| 2006 | 0.0471 | 1.0254 | 0.135 | 0.299 | 3.093 | 0.010 |
| 2007 | 0.0423 | 0.9367 | 0.150 | 0.232 | 2.427 | 0.020 |
| 2008 | 0.0469 | 1.0349 | 0.138 | 0.204 | 2.358 | 0.018 |
| 2009 | 0.0441 | 1.0561 | 0.126 | 0.221 | 2.203 | 0.029 |
| 2010 | 0.0490 | 0.8746 | 0.116 | 0.232 | 2.465 | 0.013 |
| 2011 | 0.0541 | 0.9045 | 0.110 | 0.214 | 2.246 | 0.023 |
| 2012 | 0.0718 | 1.1480 | 0.127 | 0.205 | 2.270 | 0.025 |
| 2013 | 0.0470 | 0.9699 | 0.142 | 0.150 | 1.993 | 0.043 |
| 2014 | 0.0467 | 1.0002 | 0.146 | 0.135 | 1.978 | 0.041 |
| 2015 | 0.0478 | 1.0815 | 0.133 | 0.115 | 2.149 | 0.036 |
| Year | Low Aggregation Provinces a | High Aggregation Provinces a |
|---|---|---|
| 2006 | 5, 8, 23, 28, 29, 31 | 10, 12, 13 |
| 2007 | 5, 8, 23, 28, 29, 31 | 12, 13, 14 |
| 2008 | 5, 23, 28, 29, 31 | 12, 13 |
| 2009 | 5, 23, 28, 29, 31 | 10, 12, 13, 14 |
| 2010 | 5, 8, 23, 28, 29, 30, 31 | 10, 12, 13, 14 |
| 2011 | 5, 23, 28, 29, 31 | 12, 13, 14 |
| 2012 | 5, 23, 28, 29, 31 | 13, 14 |
| 2013 | 5, 8, 23, 28, 29, 31 | 13 |
| 2014 | 5, 8, 23, 28, 29, 31 | 13, 14 |
| 2015 | 5, 8, 23, 31 | 13 |
© 2018 by the authors. Licensee MDPI, Basel, Switzerland. This article is an open access article distributed under the terms and conditions of the Creative Commons Attribution (CC BY) license (http://creativecommons.org/licenses/by/4.0/).
Share and Cite
Ma, F.; Wang, W.; Sun, Q.; Liu, F.; Li, X. Ecological Pressure of Carbon Footprint in Passenger Transport: Spatio-Temporal Changes and Regional Disparities. Sustainability 2018, 10, 317. https://doi.org/10.3390/su10020317
Ma F, Wang W, Sun Q, Liu F, Li X. Ecological Pressure of Carbon Footprint in Passenger Transport: Spatio-Temporal Changes and Regional Disparities. Sustainability. 2018; 10(2):317. https://doi.org/10.3390/su10020317
Chicago/Turabian StyleMa, Fei, Wenlin Wang, Qipeng Sun, Fei Liu, and Xiaodan Li. 2018. "Ecological Pressure of Carbon Footprint in Passenger Transport: Spatio-Temporal Changes and Regional Disparities" Sustainability 10, no. 2: 317. https://doi.org/10.3390/su10020317