Eco-Efficiency Evaluation of Regional Circular Economy: A Case Study in Zengcheng, Guangzhou


Abstract
:1. Introduction
2. Study Area
3. Data and Methods
3.1. Data
3.2. Methods
4. Results
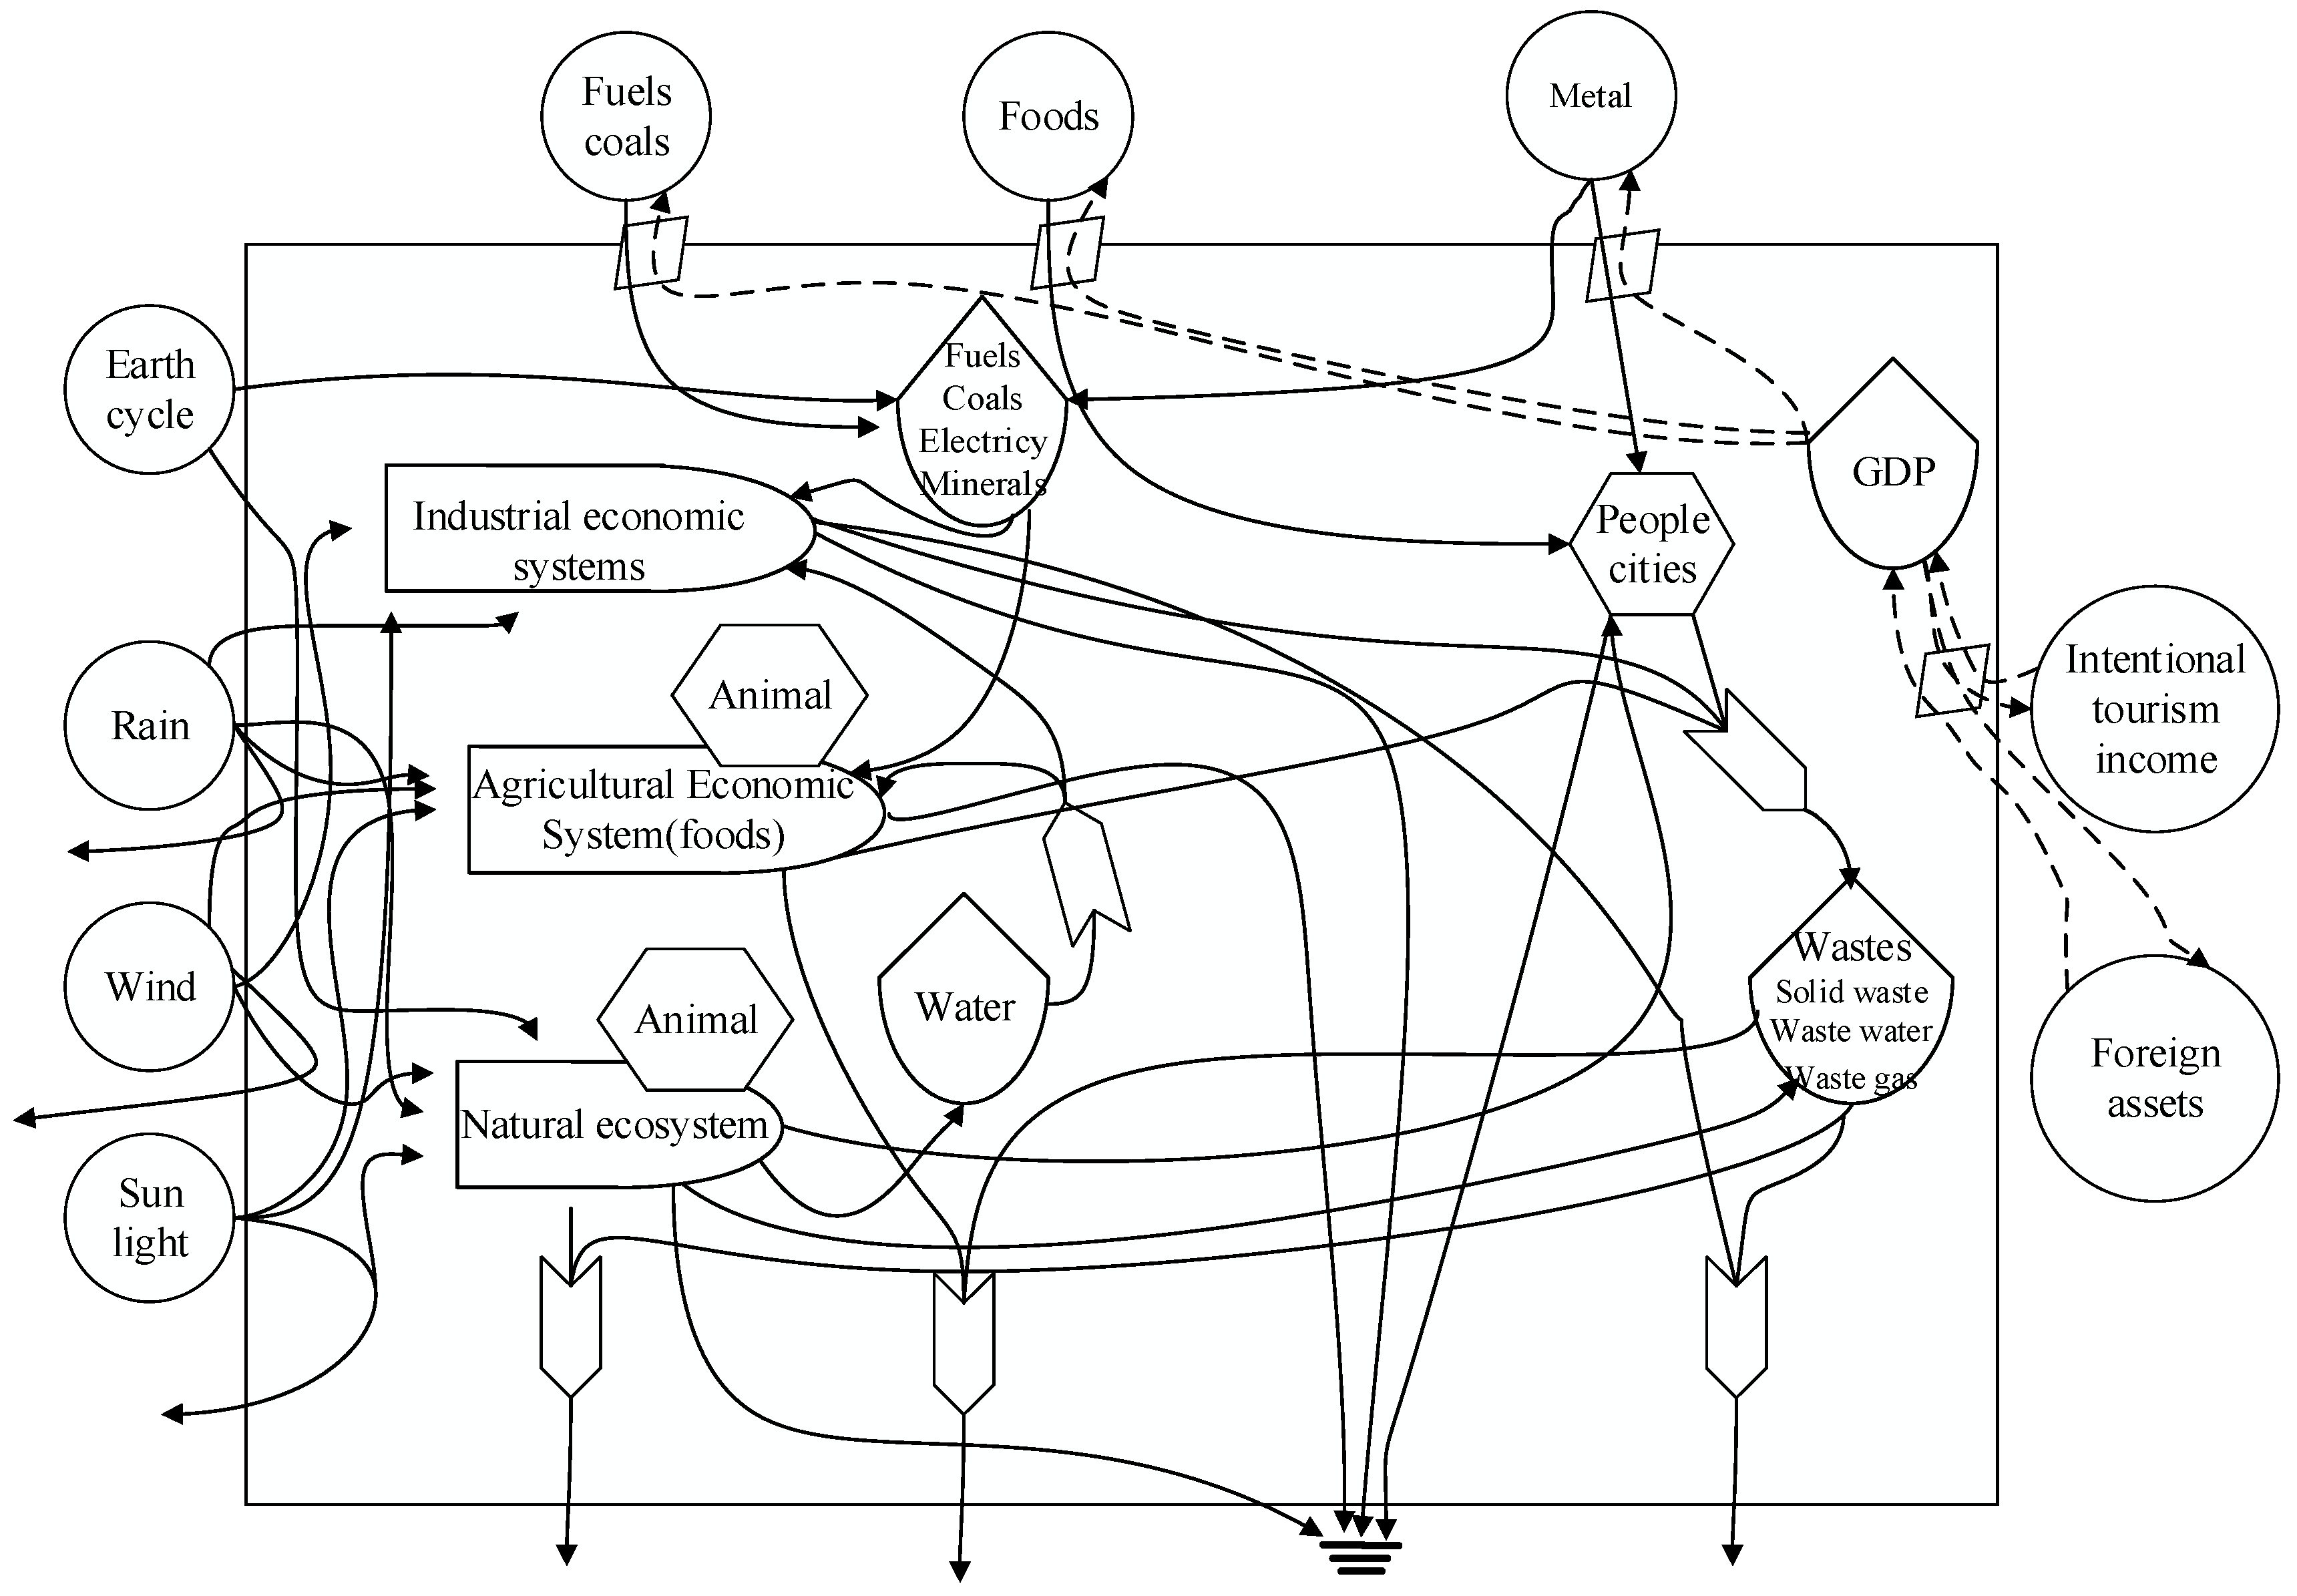
4.1. Changes of Emergy Flow of Circular Economy
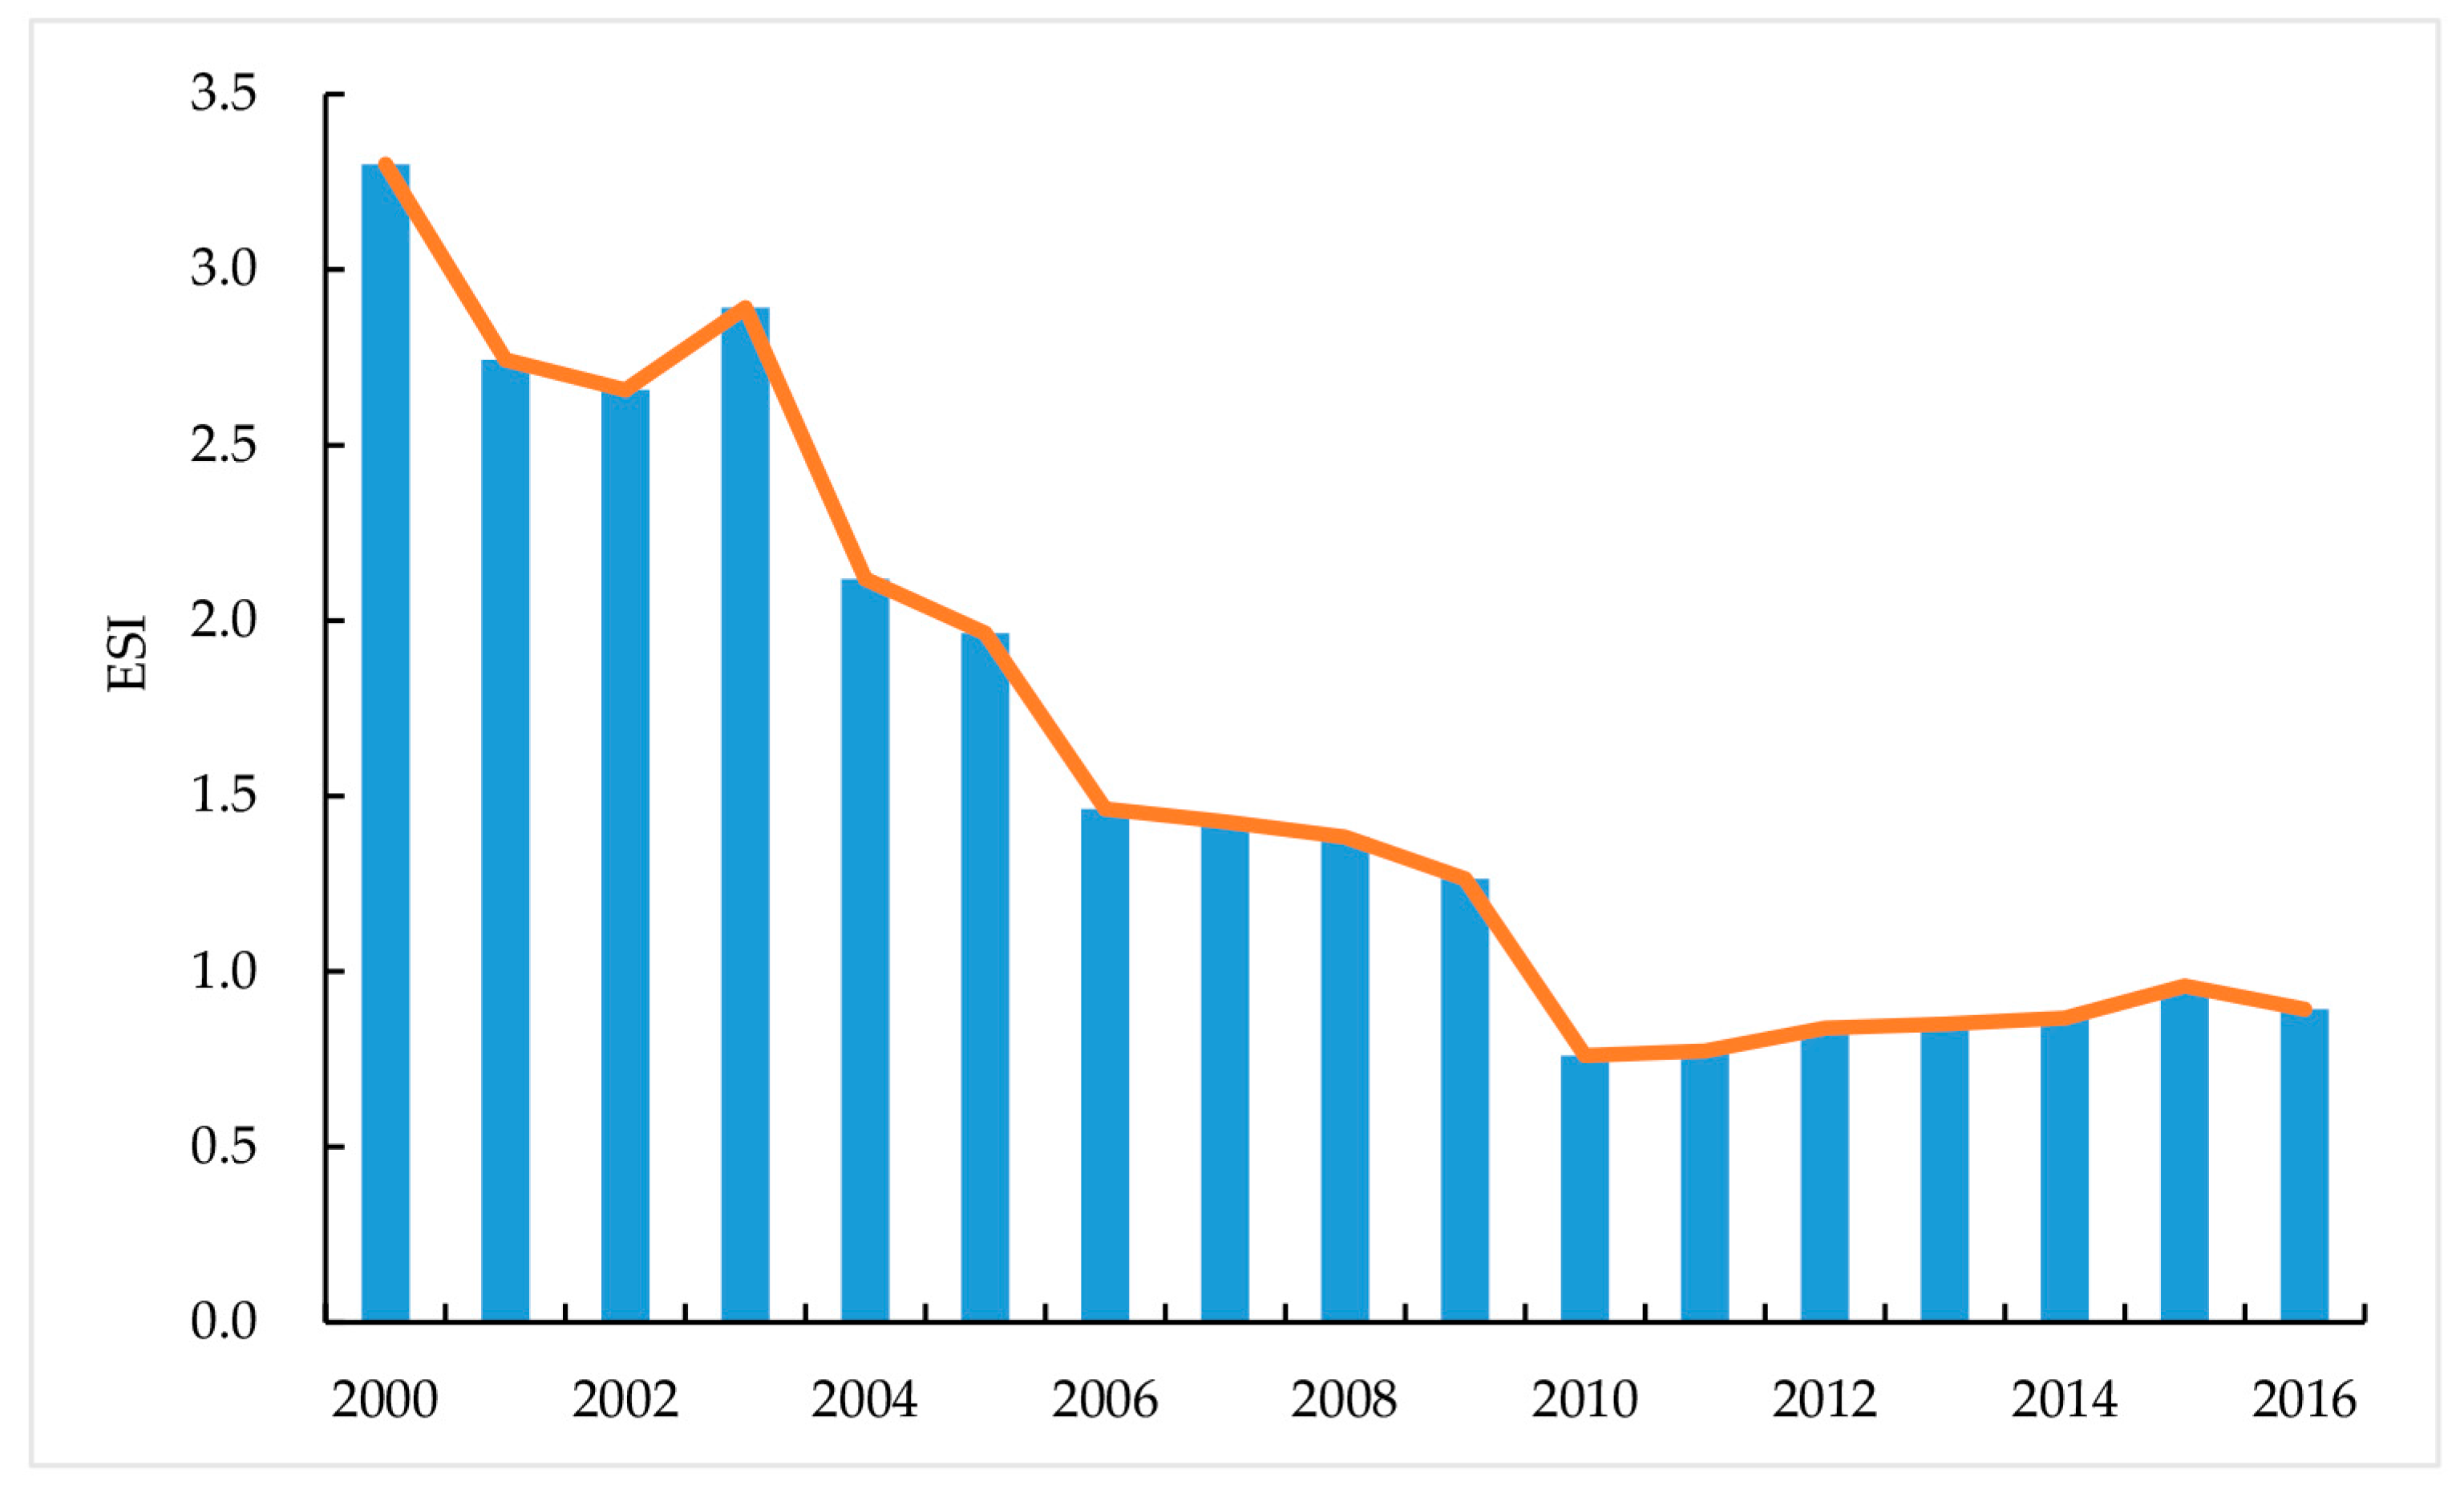
4.2. Changes in the Emergy Evaluation Index of the Circular Economy
5. Conclusions and Discussion
Acknowledgments
Author Contributions
Conflicts of Interest
Appendix A

| Types | 2000 | 2001 | 2002 | 2003 | 2004 | 2005 | 2006 | 2007 | 2008 | 2009 | 2010 | 2011 | 2012 | 2013 | 2014 | 2015 | 2016 | |
|---|---|---|---|---|---|---|---|---|---|---|---|---|---|---|---|---|---|---|
| Local renewable energy | Sunlight (×1018) | 7.10 | 7.10 | 7.10 | 7.10 | 7.10 | 7.10 | 7.10 | 7.10 | 7.10 | 7.10 | 7.10 | 7.10 | 7.10 | 7.10 | 7.10 | 7.10 | 7.10 |
| Wind (×1019) | 4.99 | 4.99 | 4.99 | 4.99 | 4.99 | 4.99 | 4.99 | 4.99 | 4.99 | 4.99 | 4.99 | 4.99 | 4.99 | 4.99 | 4.99 | 4.99 | 4.99 | |
| Rain (chemical potential) (×1020) | 5.27 | 5.80 | 4.17 | 3.89 | 3.37 | 5.55 | 6.37 | 4.78 | 6.58 | 4.73 | 4.86 | 3.67 | 5.03 | 5.31 | 5.19 | 5.53 | 6.04 | |
| Rain (geopotential) (×1019) | 1.56 | 1.72 | 1.24 | 1.15 | 1.00 | 1.65 | 1.89 | 1.42 | 1.95 | 1.40 | 1.44 | 1.09 | 1.49 | 1.57 | 1.54 | 1.64 | 1.79 | |
| Earth cycle (×1019) | 9.38 | 9.38 | 9.38 | 9.38 | 9.38 | 9.38 | 9.38 | 9.38 | 9.38 | 9.38 | 9.38 | 9.38 | 9.38 | 9.38 | 9.38 | 9.38 | 9.38 | |
| Total (rain) (×1020) | 5.42 | 5.98 | 4.29 | 4.01 | 3.47 | 5.71 | 6.56 | 4.93 | 6.78 | 4.87 | 5.00 | 3.78 | 5.18 | 5.46 | 5.34 | 6.47 | 6.98 | |
| Import renewable resources | Grain (×1020) | 3.61 | 6.07 | 7.74 | 2.23 | 6.80 | 7.09 | 11.16 | 5.98 | 5.83 | 5.31 | 10.98 | 6.34 | 5.01 | 5.25 | 5.22 | 4.85 | 5.97 |
| Fruit (×1016) | 9.17 | 8.13 | 8.67 | 6.60 | 7.07 | 6.33 | 7.63 | 8.52 | 8.37 | 9.96 | 8.44 | 8.92 | 11.04 | 9.70 | 11.78 | 13.27 | 16.03 | |
| Vegetable (×1020) | 2.74 | 2.83 | 2.77 | 2.79 | 2.19 | 2.31 | 2.32 | 2.42 | 2.68 | 2.63 | 3.29 | 3.29 | 3.37 | 2.36 | 2.96 | 3.08 | 3.40 | |
| Meat (×1020) | 2.00 | 2.13 | 2.03 | 2.10 | 2.03 | 2.37 | 2.28 | 2.29 | 1.94 | 1.99 | 2.57 | 3.01 | 1.40 | 2.92 | 2.97 | 1.93 | 2.10 | |
| Total (×1020) | 8.45 | 11.11 | 12.63 | 7.19 | 11.09 | 11.83 | 15.84 | 10.77 | 10.54 | 10.03 | 16.93 | 12.74 | 9.89 | 10.64 | 11.27 | 10.00 | 11.63 | |
| Local renewable resources | Grain (×1021) | 5.72 | 5.23 | 5.88 | 5.98 | 5.23 | 5.18 | 4.32 | 4.95 | 4.51 | 4.19 | 3.27 | 3.59 | 3.82 | 3.64 | 3.86 | 4.14 | 4.33 |
| Egg (×1016) | 1.26 | 1.51 | 1.32 | 1.50 | 1.45 | 1.61 | 1.51 | 1.50 | 1.76 | 1.73 | 1.91 | 2.26 | 2.17 | 2.10 | 2.28 | 2.46 | 2.88 | |
| Fishery (×1016) | 2.05 | 2.05 | 2.02 | 1.81 | 1.80 | 1.99 | 2.08 | 2.09 | 2.43 | 2.41 | 2.64 | 3.09 | 2.91 | 3.03 | 3.08 | 3.27 | 3.73 | |
| Fruit (×1019) | 2.75 | 2.25 | 2.29 | 1.65 | 1.76 | 1.55 | 1.74 | 1.86 | 1.74 | 2.00 | 1.97 | 1.59 | 1.73 | 1.80 | 2.50 | 2.69 | 3.36 | |
| Vegetable (×1020) | 9.12 | 9.25 | 8.70 | 8.24 | 8.05 | 7.17 | 7.82 | 8.05 | 6.90 | 6.38 | 7.33 | 6.39 | 5.27 | 6.39 | 6.52 | 6.98 | 7.40 | |
| Meat (×1020) | 4.91 | 5.21 | 4.76 | 5.14 | 4.98 | 5.79 | 5.58 | 5.37 | 6.43 | 6.95 | 6.95 | 8.58 | 8.82 | 7.71 | 7.70 | 5.36 | 5.65 | |
| Total (×1021) | 7.15 | 6.70 | 7.25 | 7.34 | 6.55 | 6.49 | 5.68 | 6.31 | 5.86 | 5.54 | 4.72 | 5.11 | 5.24 | 5.07 | 5.31 | 5.40 | 5.67 | |
| The total renewable emergy (×1021) | 7.99 | 7.81 | 8.51 | 8.05 | 7.66 | 7.67 | 7.26 | 7.38 | 6.91 | 6.55 | 6.41 | 6.38 | 6.23 | 6.13 | 6.43 | 6.40 | 6.84 | |
| Import non-renewable resources | Coal (×1021) | 2.23 | 2.21 | 2.24 | 2.26 | 2.25 | 2.27 | 2.45 | 2.49 | 2.48 | 2.49 | 2.64 | 2.78 | 2.52 | 2.49 | 2.47 | 2.56 | 2.32 |
| Oil (×1020) | 0 | 0 | 0 | 0 | 0 | 0 | 0 | 5.42 | 6.87 | 6.23 | 11.62 | 15.63 | 24.92 | 21.74 | 24.19 | 24.3 | 34.6 | |
| Metal (×1019) | 8.90 | 5.51 | 4.59 | 4.98 | 8.65 | 17.37 | 9.28 | 9.50 | 14.59 | 18.42 | 28.08 | 17.67 | 28.63 | 34.14 | 22.01 | 24 | 26.9 | |
| Total (×1021) | 2.32 | 2.27 | 2.29 | 2.31 | 2.34 | 2.44 | 2.54 | 3.13 | 3.31 | 3.30 | 4.09 | 4.52 | 5.30 | 5.00 | 5.11 | 5.23 | 6.05 | |
| Local non-renewable resources | Oil (×1021) | 2.84 | 2.91 | 3.15 | 3.20 | 3.23 | 3.36 | 3.56 | 3.73 | 4.05 | 4.42 | 4.57 | 4.45 | 3.89 | 4.62 | 4.49 | 5.82 | 6.05 |
| Electricity (×1021) | 3.25 | 3.73 | 4.60 | 5.77 | 6.84 | 7.81 | 8.04 | 8.92 | 8.57 | 8.55 | 9.66 | 10.24 | 10.65 | 10.96 | 11.48 | 12.1 | 12.8 | |
| Cement (×1021) | 2.60 | 2.55 | 2.94 | 4.24 | 3.58 | 3.96 | 4.17 | 3.10 | 2.06 | 2.00 | 1.97 | 2.07 | 2.19 | 2.28 | 1.89 | 2.45 | 2.13 | |
| Metal (×1020) | 1.51 | 2.07 | 2.31 | 3.65 | 4.44 | 3.82 | 6.21 | 7.36 | 5.49 | 5.24 | 5.97 | 5.30 | 4.67 | 6.07 | 4.68 | 4.70 | 4.81 | |
| Water (×1016) | 3.97 | 5.39 | 5.18 | 5.63 | 5.94 | 5.69 | 5.53 | 5.67 | 5.78 | 5.81 | 5.96 | 5.95 | 5.92 | 6.05 | 6.17 | 6.32 | 6.5 | |
| Total (×1021) | 8.84 | 9.40 | 10.92 | 13.58 | 14.10 | 15.51 | 16.39 | 16.48 | 15.23 | 15.49 | 16.80 | 17.29 | 17.20 | 18.47 | 18.32 | 20.8 | 21.5 | |
| The non-renewable emergy (×1022) | 1.12 | 1.12 | 1.17 | 1.32 | 1.59 | 1.64 | 1.79 | 1.89 | 1.96 | 1.85 | 1.88 | 2.09 | 2.18 | 2.25 | 2.35 | 2.61 | 2.75 | |
| Foreign input | Foreign assets (×1020) | 5.07 | 6.30 | 6.83 | 7.47 | 9.25 | 11.10 | 13.14 | 18.09 | 16.52 | 16.32 | 22.48 | 25.81 | 19.62 | 17.80 | 18.10 | 12.2 | 12.3 |
| International tourism income (×1019) | 8.19 | 9.01 | 11.2 | 8.56 | 9.73 | 10.92 | 13.71 | 18.39 | 14.53 | 16.61 | 26.83 | 22.61 | 16.91 | 15.79 | 17.60 | 19.1 | 20.3 | |
| Total (×1020) | 5.88 | 7.20 | 7.95 | 8.32 | 10.23 | 12.19 | 14.51 | 19.93 | 17.98 | 17.98 | 25.16 | 28.07 | 21.31 | 19.38 | 19.9 | 14.1 | 14.4 | |
| Net output | GDP (×1022) | 1.45 | 1.67 | 1.87 | 2.18 | 2.49 | 2.89 | 3.57 | 4.36 | 5.42 | 6.12 | 7.68 | 9.16 | 10.20 | 12.05 | 12.31 | 13.1 | 14.6 |
| Total annual export (×1021) | 1.99 | 2.43 | 2.45 | 2.79 | 3.66 | 5.34 | 7.22 | 9.64 | 10.61 | 10.31 | 14.01 | 16.77 | 17.31 | 19.52 | 20.50 | 21 | 19.8 | |
| Total (×1022) | 1.65 | 1.91 | 2.11 | 2.46 | 2.86 | 3.42 | 4.30 | 5.33 | 6.49 | 7.15 | 9.08 | 10.84 | 11.93 | 14.01 | 14.36 | 15.2 | 16.6 | |
| Wastes | Solid waste (×1020) | 4.69 | 5.75 | 6.23 | 7.63 | 8.44 | 7.49 | 8.56 | 7.41 | 8.05 | 9.19 | 10.34 | 9.00 | 8.20 | 7.76 | 6.16 | 8.53 | 9.38 |
| Waste water (×1019) | 8.94 | 9.56 | 9.66 | 8.05 | 8.65 | 7.53 | 7.42 | 6.89 | 11.25 | 9.99 | 9.46 | 8.99 | 8.13 | 8.45 | 6.39 | 6.34 | 6.57 | |
| Waste gas (×1018) | 3.41 | 4.17 | 4.52 | 3.33 | 5.02 | 4.18 | 3.70 | 3.12 | 3.82 | 4.68 | 6.07 | 7.24 | 6.26 | 6.75 | 6.57 | 6.39 | 7.32 | |
| Total (×1020) | 5.62 | 6.75 | 7.24 | 8.47 | 9.36 | 8.28 | 9.34 | 8.13 | 9.22 | 10.24 | 11.35 | 9.97 | 9.08 | 8.68 | 6.86 | 9.23 | 10.1 | |
References
- Deng, X.Z.; Huang, J.K.; Rozelle, S.; Zhang, J.P.; Li, Z.H. Impact of urbanization on cultivated land changes in China. Land Use Policy 2015, 45, 1–7. [Google Scholar] [CrossRef]
- Liu, Y.; Chen, Z.M.; Xiao, H.W.; Yang, W.; Liu, D.H.; Chen, B. Driving factors of carbon dioxide emissions in China: An empirical study using 2006–2010 provincial data. Front. Earth Sci. 2017, 11, 156–161. [Google Scholar] [CrossRef]
- Xu, M.; Weissburg, M.; Newell, J.P.; Crittenden, J.C. Developing a science of infrastructure ecology for sustainable urban systems. Environ. Sci. Technol. 2012, 46, 7928–7929. [Google Scholar] [CrossRef] [PubMed]
- Yin, K.; Wang, R.; An, Q.; Yao, L.; Liang, J. Using eco-efficiency as an indicator for sustainable urban development: A case study of Chinese provincial capital cities. Ecol. Indic. 2014, 36, 665–671. [Google Scholar] [CrossRef]
- Chen, S.Y.; Santos-Paulino, A.U. Energy Consumption and Carbon Emission Based Industrial Productivity in China: A Sustainable Development Analysis. Rev. Dev. Econ. 2013, 17, 644–661. [Google Scholar] [CrossRef]
- Wu, H.Q.; Shi, Y.; Xia, Q.; Zhu, W.D. Effectiveness of the policy of circular economy in China: A DEA-based analysis for the period of 11th five-year-plan. Resour. Conserv. Recycl. 2014, 83, 163–175. [Google Scholar] [CrossRef]
- Haas, W.; Krausmann, F.; Wiedenhofer, D.; Heinz, M. How Circular is the Global Economy? An Assessment of Material Flows, Waste Production, and Recycling in the European Union and the World in 2005. J. Ind. Ecol. 2015, 19, 765–777. [Google Scholar] [CrossRef]
- Gu, Y.F.; Wu, Y.F.; Xu, M.; Mu, X.Z.; Zuo, T.Y. Waste electrical and electronic equipment (WEEE) recycling for a sustainable resource supply in the electronics industry in China. J. Clean. Prod. 2016, 127, 331–338. [Google Scholar] [CrossRef]
- Ma, S.J.; Hu, S.Y.; Chen, D.J.; Zhu, B. A case study of a phosphorus chemical firm’s application of resource efficiency and eco-efficiency in industrial metabolism under circular economy. J. Clean. Prod. 2015, 87, 839–849. [Google Scholar] [CrossRef]
- Peters, G.P.; Weber, C.L.; Guan, D.; Hubacek, K. China’s growing CO2 emissions—A race between increasing consumption and efficiency gains. Environ. Sci. Technol. 2007, 41, 5939–5944. [Google Scholar] [CrossRef] [PubMed]
- Mickwitz, P.; Melanen, M.; Rosenström, U.; Seppälä, J. Regional eco-efficiency indicators—A participatory approach. J. Clean. Prod. 2006, 14, 1603–1611. [Google Scholar] [CrossRef]
- Govindan, K.; Sarkis, J.; Jabbour, C.J.C.; Zhu, Q.; Geng, Y. Eco-efficiency based green supply chain management: Current status and opportunities. Eur. J. Oper. Res. 2014, 233, 293–298. [Google Scholar] [CrossRef]
- Su, M.R.; Fath, B.D.; Yang, Z.H.; Chen, B.; Liu, G.Y. Ecosystem health pattern analysis of urban clusters based on emergy synthesis: Results and implication for management. Energy Policy 2013, 59, 600–613. [Google Scholar] [CrossRef]
- Ansari, Z.N.; Kant, R. A state-of-art literature review reflecting 15 years of focus on sustainable supply chain management. J. Clean. Prod. 2017, 142, 2524–2543. [Google Scholar] [CrossRef]
- Yuan, Z.W.; Bi, J.; Moriguichi, Y. The circular economy: A new development strategy in China. J. Ind. Ecol. 2006, 10, 4–8. [Google Scholar] [CrossRef]
- Musa, H.D.; Yacob, M.R.; Abdullah, A.M.; Ishak, M.Y. Delphi Method of Developing Environmental Well-being Indicators for the Evaluation of Urban Sustainability in Malaysia. Procedia Environ. Sci. 2015, 30, 244–249. [Google Scholar] [CrossRef]
- Dakhia, K.; Berezowska-Azzag, E. Urban institutional and ecological footprint A new urban metabolism assessment tool for planning sustainable urban ecosystems. Manag. Environ. Qual. Int. J. 2010, 21, 78–89. [Google Scholar] [CrossRef]
- Lee, G.K.L.; Chan, E.H.W. The Analytic Hierarchy Process (AHP) Approach for Assessment of Urban Renewal Proposals. Soc. Indic. Res. 2007, 89, 155–168. [Google Scholar] [CrossRef]
- Blancard, S.; Hoarau, J.F. A new sustainable human development indicator for small island developing states: A reappraisal from data envelopment analysis. Econ. Model. 2013, 30, 623–635. [Google Scholar] [CrossRef]
- Langella, I.M.; Zanoni, S. Eco-efficiency in logistics: A case study on distribution network design. Int. J. Sustain. Eng. 2011, 4, 115–126. [Google Scholar] [CrossRef]
- Hau, J.L.; Bakshi, B.R. Expanding exergy analysis to account for ecosystem products and services. Environ. Sci. Technol. 2004, 38, 3768–3777. [Google Scholar] [CrossRef] [PubMed]
- Scofield, J.H. Do LEED-certified buildings save energy? Not really…. Energy Build. 2009, 41, 1386–1390. [Google Scholar] [CrossRef]
- Newsham, G.R.; Mancini, S.; Birt, B.J. Do LEED-certified buildings save energy? Yes, but…. Energy Build. 2009, 41, 897–905. [Google Scholar] [CrossRef]
- Lou, B.; Ulgiati, S. Identifying the environmental support and constraints to the Chinese economic growth—An application of the Emergy Accounting method. Energy Policy 2013, 55, 217–233. [Google Scholar] [CrossRef]
- Pouriyeh, A.; Khorasani, N.; Hosseinzadeh Lotfi, F.; Farshchi, P. Efficiency evaluation of urban development in Yazd City, Central Iran using data envelopment analysis. Environ. Monit. Assess. 2016, 188, 618. [Google Scholar] [CrossRef] [PubMed]
- Lou, B.; Qiu, Y.; Ulgiati, S. Emergy-based indicators of regional environmental sustainability: A case study in Shanwei, Guangdong, China. Ecol. Indic. 2015, 57, 514–524. [Google Scholar] [CrossRef]
- Odum, H.T. Environmental Accounting. Emergy and Environmental Decision Making; John Wiley & Sons: New York, NY, USA, 1996. [Google Scholar]
- Brown, M.T.; Ulgiati, S. Updated evaluation of exergy and emergy driving the geobiosphere: A review and refinement of the emergy baseline. Ecol. Model. 2010, 221, 2501–2508. [Google Scholar] [CrossRef]
- Liu, G.Y.; Yang, Z.F.; Chen, B. A spatial comparative analysis of environmental impacts in Chinese urban metabolic processes. Energy Procedia 2011, 5, 43–50. [Google Scholar] [CrossRef]
- Falkowski, T.B.; Martinez-Bautista, I.; Diemont, S.A.W. How valuable could traditional ecological knowledge education be for a resource-limited future? An emergy evaluation in two Mexican villages. Ecol. Model. 2015, 300, 40–49. [Google Scholar] [CrossRef]
- Liu, G.; Yang, Z.; Chen, B.; Ulgiati, S. Emergy-based dynamic mechanisms of urban development, resource consumption and environmental impacts. Ecol. Model. 2014, 271, 90–102. [Google Scholar] [CrossRef]
- Zhou, S.Y.; Zhang, B.; Cai, Z.F. Emergy analysis of a farm biogas project in china: A biophysical perspective of agricultural ecological engineering. Commun. Nonlinear Sci. Numer. Simul. 2010, 15, 1408–1418. [Google Scholar] [CrossRef]
- Merlin, G.; Boileau, H. Eco-efficiency and entropy generation evaluation based on emergy analysis: Application to two small biogas plants. J. Clean. Prod. 2016, 143, 257–268. [Google Scholar] [CrossRef]
- Guangzhou District Statistical Bureau. Guangzhou Statistical Yearbook, 2000–2014. Available online: http://210.72.4.52/gzStat1/chaxun/njsj.jsp (accessed on 29 January 2017).
- Lomas, P.L.; Alvarez, S.S.; Rodriguez, M.F.; Montes, C. Environmental accounting as a management tool in the Mediterranean context: The Spanish economy during the last 20 years. J. Environ. Manag. 2008, 88, 326–347. [Google Scholar] [CrossRef] [PubMed]
- Odum, H.T. Systems Ecology: An Introduction; Wiley: New York, NY, USA, 1983; p. 644. [Google Scholar]
- Viglia, S.; Civitillo, D.F.; Cacciapuoti, G.; Ulgiati, S. Indicators of environmental loading and sustainability of urban systems. An emergy-based environmental footprint. Ecol. Indic. 2017. [Google Scholar] [CrossRef]
- Chen, S.Q.; Chen, B. Sustainability and future alternatives of biogas-linked agrosystem (BLAS) in China: An emergy synthesis. Renew. Sustain. Energy Rev. 2012, 16, 3948–3959. [Google Scholar] [CrossRef]
- Wang, C.D.; Zhang, S.Y.; Yan, W.L.; Wang, R.Q.; Liu, J.; Wang, Y.T. Evaluating renewable natural resources flow and net primary productivity with a GIS-Emergy approach: A case study of Hokkaido, Japan. Sci. Rep. 2016, 6, 37552. [Google Scholar] [CrossRef] [PubMed]
- Dong, H.J.; Fujita, T.; Geng, Y.; Dong, L.; Ohnishi, S.; Sun, L.; Dou, Y.; Fujii, M. A review on eco-city evaluation methods and highlights for integration. Ecol. Indic. 2016, 60, 1184–1191. [Google Scholar] [CrossRef]
- Vega-Azamar, R.; Romero-López, R.; Oropeza-García, N.; Glaus, M.; Hausler, R.; Silva-Poot, H. Emergy evaluation of dwelling operation in five housing units of Montreal Island, Canada. Sustainability 2017, 9, 663. [Google Scholar] [CrossRef]
- Costanza, R.; De Groot, R.; Farberk, S.; Grasso, M.; Hannon, B.; Limburg, K.E. The value of the world's ecosystem services and natural capital. Nature 1987, 387, 253–260. [Google Scholar] [CrossRef]
- Liu, G.; Brown, M.T.; Casazza, M. Enhancing the sustainability narrative through a deeper understanding of sustainable development indicators. Sustainability 2017, 9, 1078. [Google Scholar] [CrossRef]
- Chen, S.Q.; Chen, B. Energy efficiency and sustainability of complex biogas systems: A 3-level emergetic evaluation. Appl. Energy 2014, 115, 151–163. [Google Scholar] [CrossRef]
- Li, F.; Liu, X.S.; Hu, D.; Wang, R.; Yang, W.S.; Li, D.; Zhao, D. Measurement indicators and an evaluation approach for assessing urban sustainable development: A case study for China’s Jining City. Landsc. Urban Plan. 2009, 90, 134–142. [Google Scholar] [CrossRef]
- Liu, X.; Liu, G.; Yang, Z.; Chen, B.; Ulgiati, S.; Kazmerski, L. Comparing national environmental and economic performances through emergy sustainability indicators: Moving environmental ethics beyond anthropocentrism toward ecocentrism. Renew. Sustain. Energy Rev. 2016, 58, 1532–1542. [Google Scholar] [CrossRef]
- Sweeney, S.; Cohen, M.J.; King, D.M.; Brown, M.T. Creation of a Global Emergy Database for Standardized National Emergy Synthesis. In Proceedings of the 4th Biennial Emergy Research Conference, Gainesville, FL, USA, 19–21 January 2006. [Google Scholar]


| Types | Resources | Emergy Code |
|---|---|---|
| Local renewable energy | Sunlight, wind, rain, earth cycle | EmR1 |
| Local renewable resources | Foods (Grain, vegetable, fruit, egg, meat, fishery) | EmR2 |
| Import renewable resources | Foods (Grain, vegetable, fruit, egg, meat) | EmR3 |
| Local non-renewable resources | Water, electricity, metal, cement, oil | EmN1 |
| Import non-renewable resources | Coal, fuel oil, metal | EmN2 |
| Foreign Import | Foreign assets, international tourism income | EmIMP1 |
| Net Output | GDP, total annual exports | EmY |
| Wastes | Solid waste, waste water, waste gas | EmW |
| First-Level Indicator | Second-Level Indicator | Formula |
|---|---|---|
| Structure | Ratio of renewable emergy | (EmR1 + EmR2 + EmR3)/EmU |
| Ratio of non-renewable emergy | (EmN1 + EmN2)/EmU | |
| Ratio of foreign import emergy | EmIMP1/EmU | |
| Function | Emergy to money ratio (EMR) | EmU/GDP |
| Emergy yield ratio (EYR) | EmU/EmIMP | |
| Emergy use per person | EmU/Population | |
| Emergy use per unit area | EmU/A | |
| Efficiency | Environmental loading ratio (ELR) | (EmU − EmR1 − EmR2)/(EmR1 + EmR2) |
| Ratio of waste to total import (EWR) | EmW/EmU | |
| Ratio of waste to yield | EmW/EmY | |
| Comprehensive index | Emergy sustainability index (ESI) | EYR/ELR |
| Emergy | 2000 | 2001 | 2002 | 2003 | 2004 | 2005 | 2006 | 2007 | 2008 | 2009 | 2010 | 2011 | 2012 | 2013 | 2014 | 2015 | 2016 |
|---|---|---|---|---|---|---|---|---|---|---|---|---|---|---|---|---|---|
| Local renewable energy (×1020) | 5.42 | 5.98 | 4.29 | 4.01 | 3.47 | 5.71 | 6.56 | 4.93 | 6.78 | 4.87 | 5 | 3.78 | 5.18 | 5.46 | 5.34 | 6.47 | 6.98 |
| Import renewable resources (×1020) | 8.45 | 11.11 | 12.63 | 7.19 | 11.09 | 11.83 | 15.84 | 10.77 | 10.54 | 10.03 | 16.93 | 12.74 | 9.89 | 10.64 | 11.27 | 10 | 11.63 |
| Local renewable resources (×1021) | 7.15 | 6.7 | 7.25 | 7.34 | 6.55 | 6.49 | 5.68 | 6.31 | 5.86 | 5.54 | 4.72 | 5.11 | 5.24 | 5.07 | 5.31 | 5.4 | 5.67 |
| The total renewable emergy (×1021) | 7.99 | 7.81 | 8.51 | 8.05 | 7.66 | 7.67 | 7.26 | 7.38 | 6.91 | 6.55 | 6.41 | 6.38 | 6.23 | 6.13 | 6.43 | 6.4 | 6.84 |
| Import non-renewable resources (×1021) | 2.32 | 2.27 | 2.29 | 2.31 | 2.34 | 2.44 | 2.54 | 3.13 | 3.31 | 3.3 | 4.09 | 4.52 | 5.3 | 5 | 5.11 | 5.23 | 6.05 |
| Local non-renewable resources (×1021) | 8.84 | 9.4 | 10.92 | 13.58 | 14.1 | 15.51 | 16.39 | 16.48 | 15.23 | 15.49 | 16.8 | 17.29 | 17.2 | 18.47 | 18.32 | 20.8 | 21.5 |
| The non-renewable resources (×1022) | 1.12 | 1.12 | 1.17 | 1.32 | 1.59 | 1.64 | 1.79 | 1.89 | 1.96 | 1.85 | 1.88 | 2.09 | 2.18 | 2.25 | 2.35 | 2.61 | 2.75 |
| Foreign input (×1020) | 5.88 | 7.2 | 7.95 | 8.32 | 10.23 | 12.19 | 14.51 | 19.93 | 17.98 | 17.98 | 25.16 | 28.07 | 21.31 | 19.38 | 19.9 | 14.1 | 14.4 |
| Net output (×1022) | 1.65 | 1.91 | 2.11 | 2.46 | 2.86 | 3.42 | 4.3 | 5.33 | 6.49 | 7.15 | 9.08 | 10.84 | 11.93 | 14.01 | 14.36 | 15.2 | 16.6 |
| Wastes (×1020) | 5.62 | 6.75 | 7.24 | 8.47 | 9.36 | 8.28 | 9.34 | 8.13 | 9.22 | 10.24 | 11.35 | 9.97 | 9.08 | 8.68 | 6.86 | 9.23 | 10.1 |
| 2000 | 2001 | 2002 | 2003 | 2004 | 2005 | 2006 | 2007 | 2008 | 2009 | 2010 | 2011 | 2012 | 2013 | 2014 | 2015 | 2016 | |
|---|---|---|---|---|---|---|---|---|---|---|---|---|---|---|---|---|---|
| EYR | 5.41 | 5.07 | 5.28 | 6.52 | 5.70 | 5.66 | 5.08 | 4.76 | 4.53 | 4.53 | 3.65 | 3.65 | 3.73 | 4.01 | 3.94 | 4.52 | 4.22 |
| ELR | 1.64 | 1.85 | 1.99 | 2.25 | 2.69 | 2.88 | 3.47 | 3.34 | 3.27 | 3.58 | 4.81 | 4.72 | 4.45 | 4.71 | 4.55 | 4.71 | 4.73 |
| Ratio of waste to yield (%) | 3.41 | 3.53 | 3.43 | 3.45 | 3.28 | 2.42 | 2.17 | 1.53 | 1.42 | 1.43 | 1.25 | 0.92 | 0.76 | 0.62 | 0.48 | 0.61 | 0.61 |
| Ratio of emergy use to GDP (seJ/$10,000) | 12.15 | 10.8 | 10.66 | 10.02 | 8.86 | 8.33 | 7.01 | 6.03 | 6.03 | 4.53 | 3.93 | 3.50 | 2.96 | 2.64 | 2.33 | 2.24 | 2.28 |
| EWR (%) | 2.77 | 3.25 | 3.16 | 3.36 | 3.68 | 3.02 | 3.30 | 2.76 | 3.30 | 3.71 | 3.74 | 3.18 | 2.89 | 2.70 | 2.12 | 2.67 | 2.77 |
| ESI | 3.30 | 2.74 | 2.66 | 2.89 | 2.12 | 1.96 | 1.46 | 1.43 | 1.38 | 1.26 | 0.76 | 0.77 | 0.84 | 0.85 | 0.87 | 0.96 | 0.89 |
© 2018 by the authors. Licensee MDPI, Basel, Switzerland. This article is an open access article distributed under the terms and conditions of the Creative Commons Attribution (CC BY) license (http://creativecommons.org/licenses/by/4.0/).
Share and Cite
Liu, W.; Zhan, J.; Li, Z.; Jia, S.; Zhang, F.; Li, Y. Eco-Efficiency Evaluation of Regional Circular Economy: A Case Study in Zengcheng, Guangzhou. Sustainability 2018, 10, 453. https://doi.org/10.3390/su10020453
Liu W, Zhan J, Li Z, Jia S, Zhang F, Li Y. Eco-Efficiency Evaluation of Regional Circular Economy: A Case Study in Zengcheng, Guangzhou. Sustainability. 2018; 10(2):453. https://doi.org/10.3390/su10020453
Chicago/Turabian StyleLiu, Wei, Jinyan Zhan, Zhihui Li, Siqi Jia, Fan Zhang, and Yifan Li. 2018. "Eco-Efficiency Evaluation of Regional Circular Economy: A Case Study in Zengcheng, Guangzhou" Sustainability 10, no. 2: 453. https://doi.org/10.3390/su10020453
APA StyleLiu, W., Zhan, J., Li, Z., Jia, S., Zhang, F., & Li, Y. (2018). Eco-Efficiency Evaluation of Regional Circular Economy: A Case Study in Zengcheng, Guangzhou. Sustainability, 10(2), 453. https://doi.org/10.3390/su10020453