3.1. Design Quality Indicator(DQI)
The DQI is a tool for evaluating the design quality of buildings. It is an improvement toolkit that was developed by the United Kingdom Construction Industry Council in 1999 for measuring, evaluating, and improving the design quality of the buildings [
24]. The purpose of the DQI is to establish a clear product quality model for buildings that can be used in the decision-making process. The model can be sampled in stages in order to improve and control the quality of buildings under development [
25].
The framework of the DQI originates from the Roman architect, Vitruvius, who published a paper in the first century BC describing the factors of Western architecture culture and design. These factors consisted of utilitas, firmitas, and venustas, which are often translated as useful, durable, and beautiful [
24]. Based on the aforementioned framework, the DQI comprises three major design quality dimensions and 10 indicators. (1) Functionality—the arrangement, quality, and interrelationship of spaces and how the building is designed to be useful to all. (2) Build Quality—the engineering performance of the building, which includes structural stability and the integration, safety, and robustness of the systems, finishes, and fittings. (3) Impact—the building’s ability to create a sense of place and have a positive effect on the local community and environment [
26].
According to the results of a case study published on DQI.org.uk, the percentage of contractors implementing DQI into the briefing stage of their construction projects was the highest. In a Market and Opinion Research International (MORI) poll commissioned by Chartered Association of Building Engineers (CABE) in the UK, through the DQI, 85% of respondents agree that: better quality buildings and public spaces improve the quality of people’s lives. These results are consistent with the quality assurance concepts of the presale housing system. Specifically, homebuyers are able to participate in project planning and assess the level of HQ, thereby maximizing quality control. The aforementioned 10 indicators of DQI also serve as categories for the presale HQ items in Taiwan.
3.2. Differentiation Strategies for Cost and Quality
The implementation of differentiation strategies represents a company’s ability to create unique value during its pursuit of profit [
27,
28]. From a cost–quality perspective, effective differentiation strategies that are cost-free or only require minimal cost should be prioritized. Those that necessitate a higher cost should be prioritized according to market and user demands [
29]. However, differentiation strategies manifest an underlying risk. Consumers may choose to forfeit differentiation for low-cost strategies if the cost of differentiation is excessive. This explains why developers are inclined to choose standardized products and quality.
Differentiation emphasizes the provision of unique value to the customer. When customers are satisfied with the quality of the product, they are more willing to pay a price equivalent to or exceeding the quality [
21,
30,
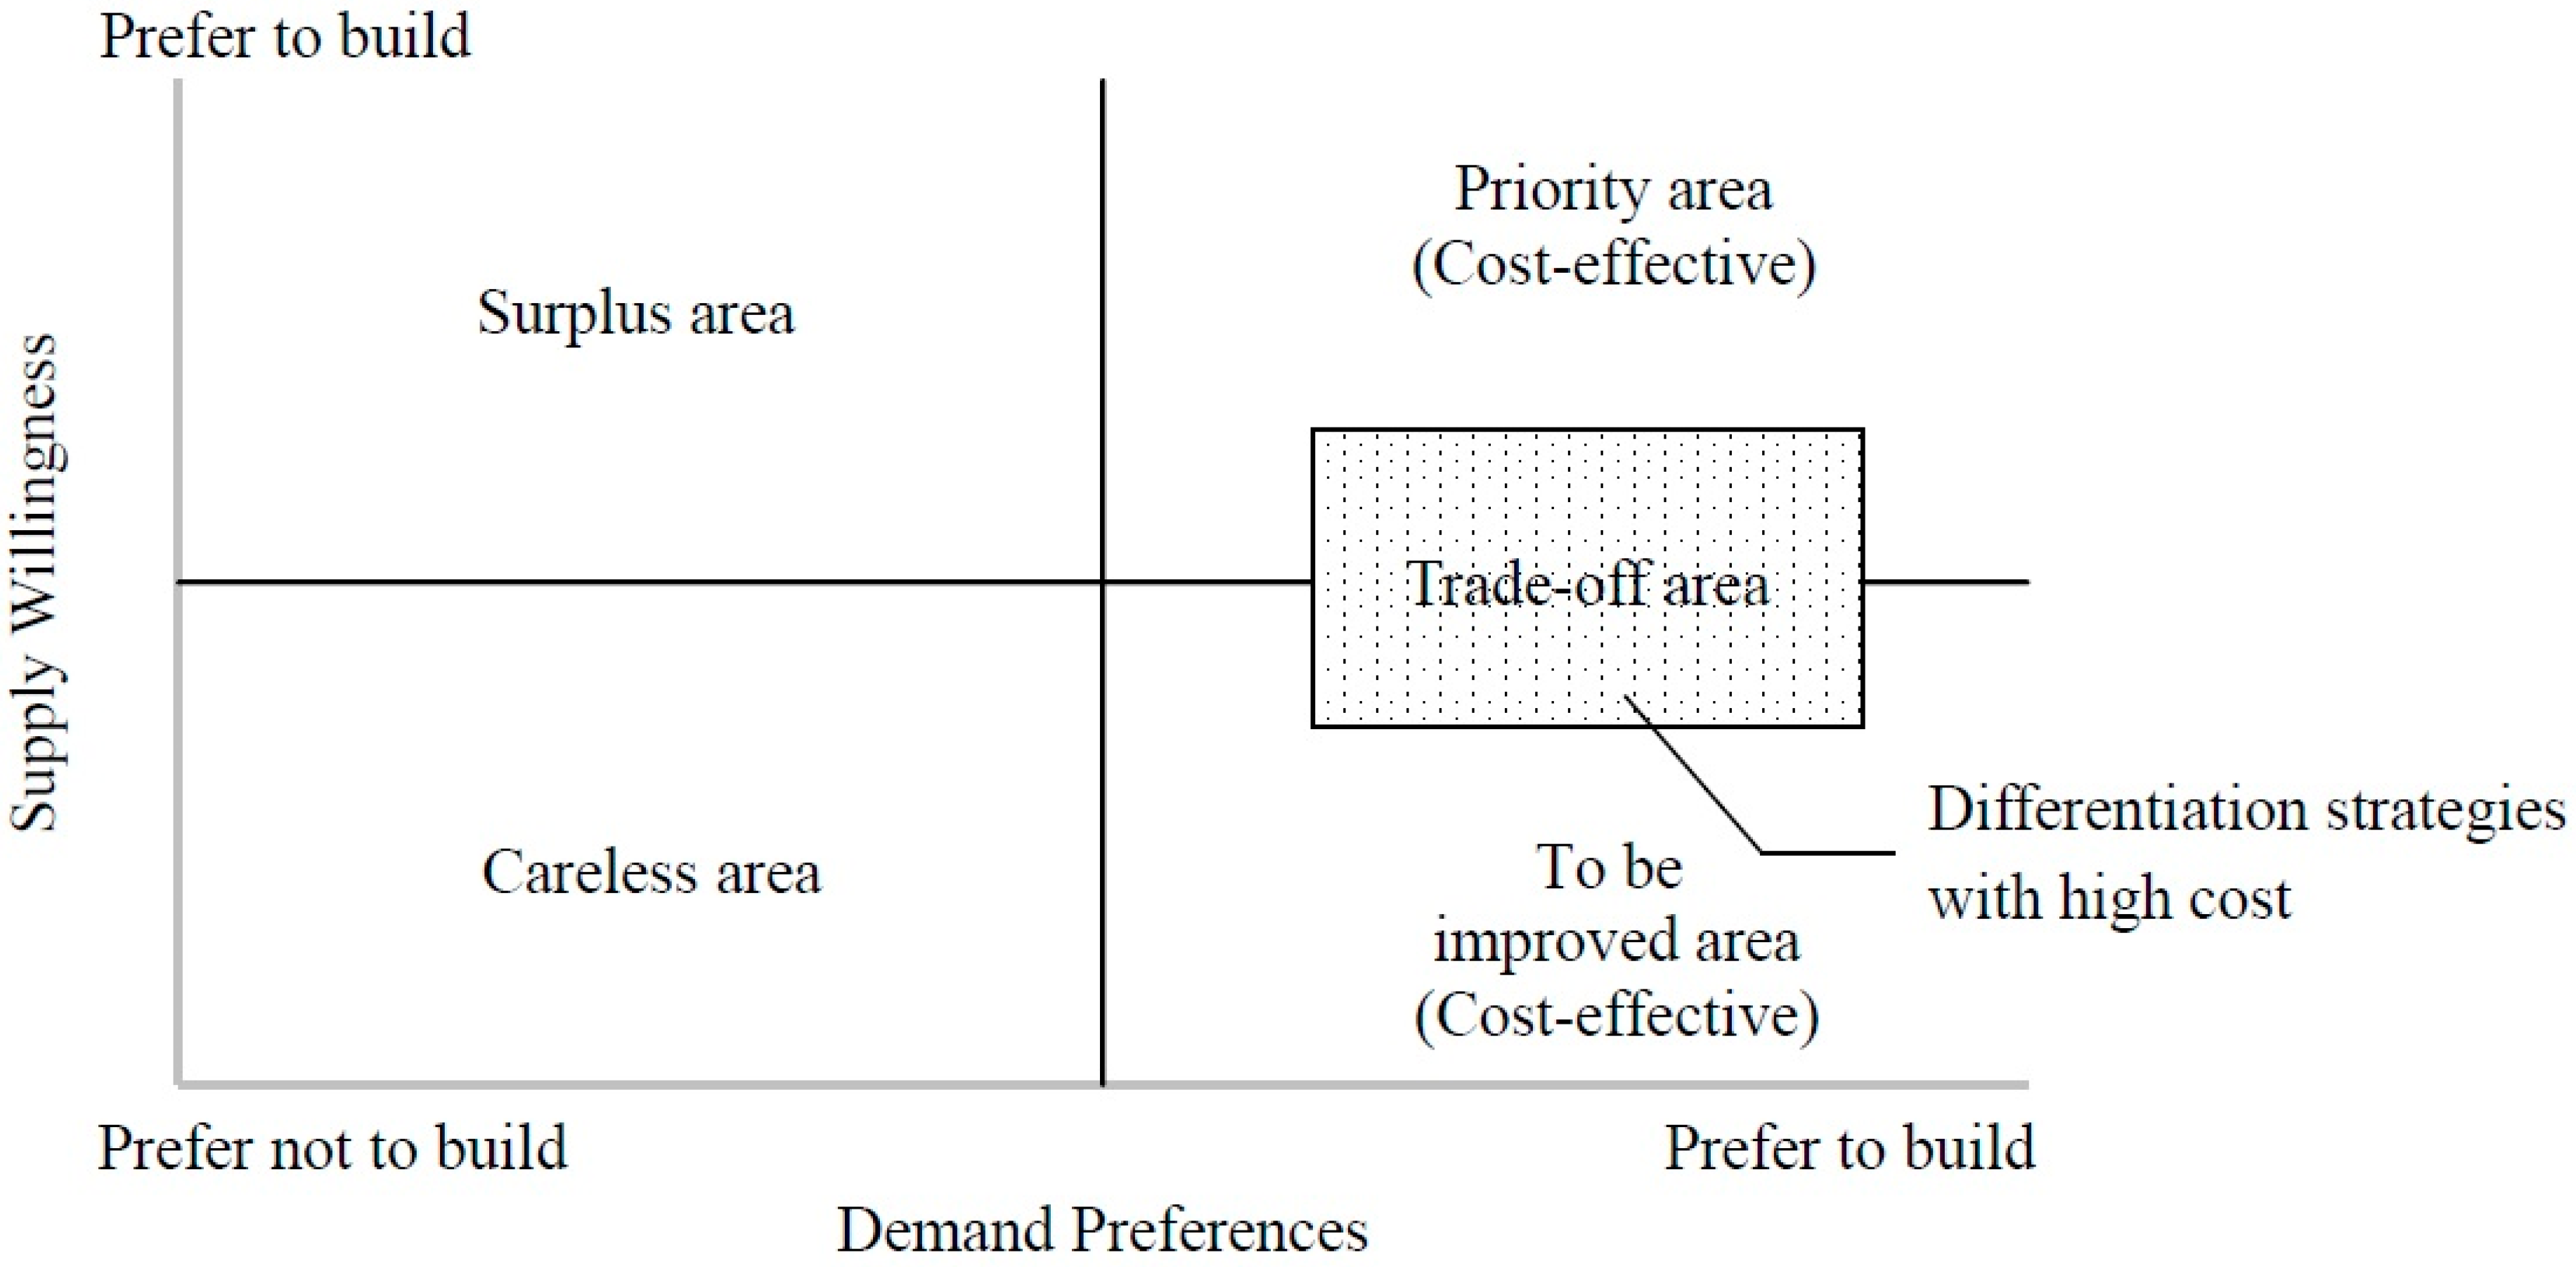
31]. Therefore, quality differentiation is defined as the provision of value other than that required to satisfy standardized housing products in the present study. Developers are less willing to provide such benefit, which includes unique designs, facilities, equipment, materials, and services. A matrix with demand (
X-axis) and supply preferences (
Y-axis) can be depicted (see
Figure 2) to address the relationship between the differentiation strategies of the two sides. Demand preferences mean that the level at which homebuyers regard these differentiation strategies as important items, and prefer to have these items in their housing. Supply willingness mean the developers’ willingness to provide differentiation strategies after considering the construction cost, time, and technology difficulty. In other words, differentiation items that are not preferred by homebuyers should not be considered. These items can be allocated to the “
Surplus area” or “
Careless area”.
By elucidating homebuyers’ demands and values, developers can prioritize quality differentiation items that are cost-effective and preferred by the homebuyers, such as those that are located in the quadrant
I (“
Priority area”) in
Figure 2. Items located in this area imply that these items have greater impacts on increasing homebuyer’s preferences and satisfaction, and should be implemented first. Items that are cost-effective, preferred by homebuyers, and less preferred by developers should also be allocated to the “
To be improved area” in order to enhance quality satisfaction greatly. Items that are more costly should be allocated the “
Trade-off area”, depending on the relationship between the costs of differentiation strategies and the willingness difference (synergy) of homebuyers and developers. If the cost of differentiation is high and the synergy of two sides is low (not cost-effective), these items might be excluded from the optimal process. Through this process, a customer-focused design can be created. With differentiation strategies, homebuyers are willing to increase their WTPs in order to improve their living satisfaction, and developers can meanwhile take these increased WTPs as incentives to provide high-quality housing.
3.3. A New Model for Housing Cost–Quality Trade-Off
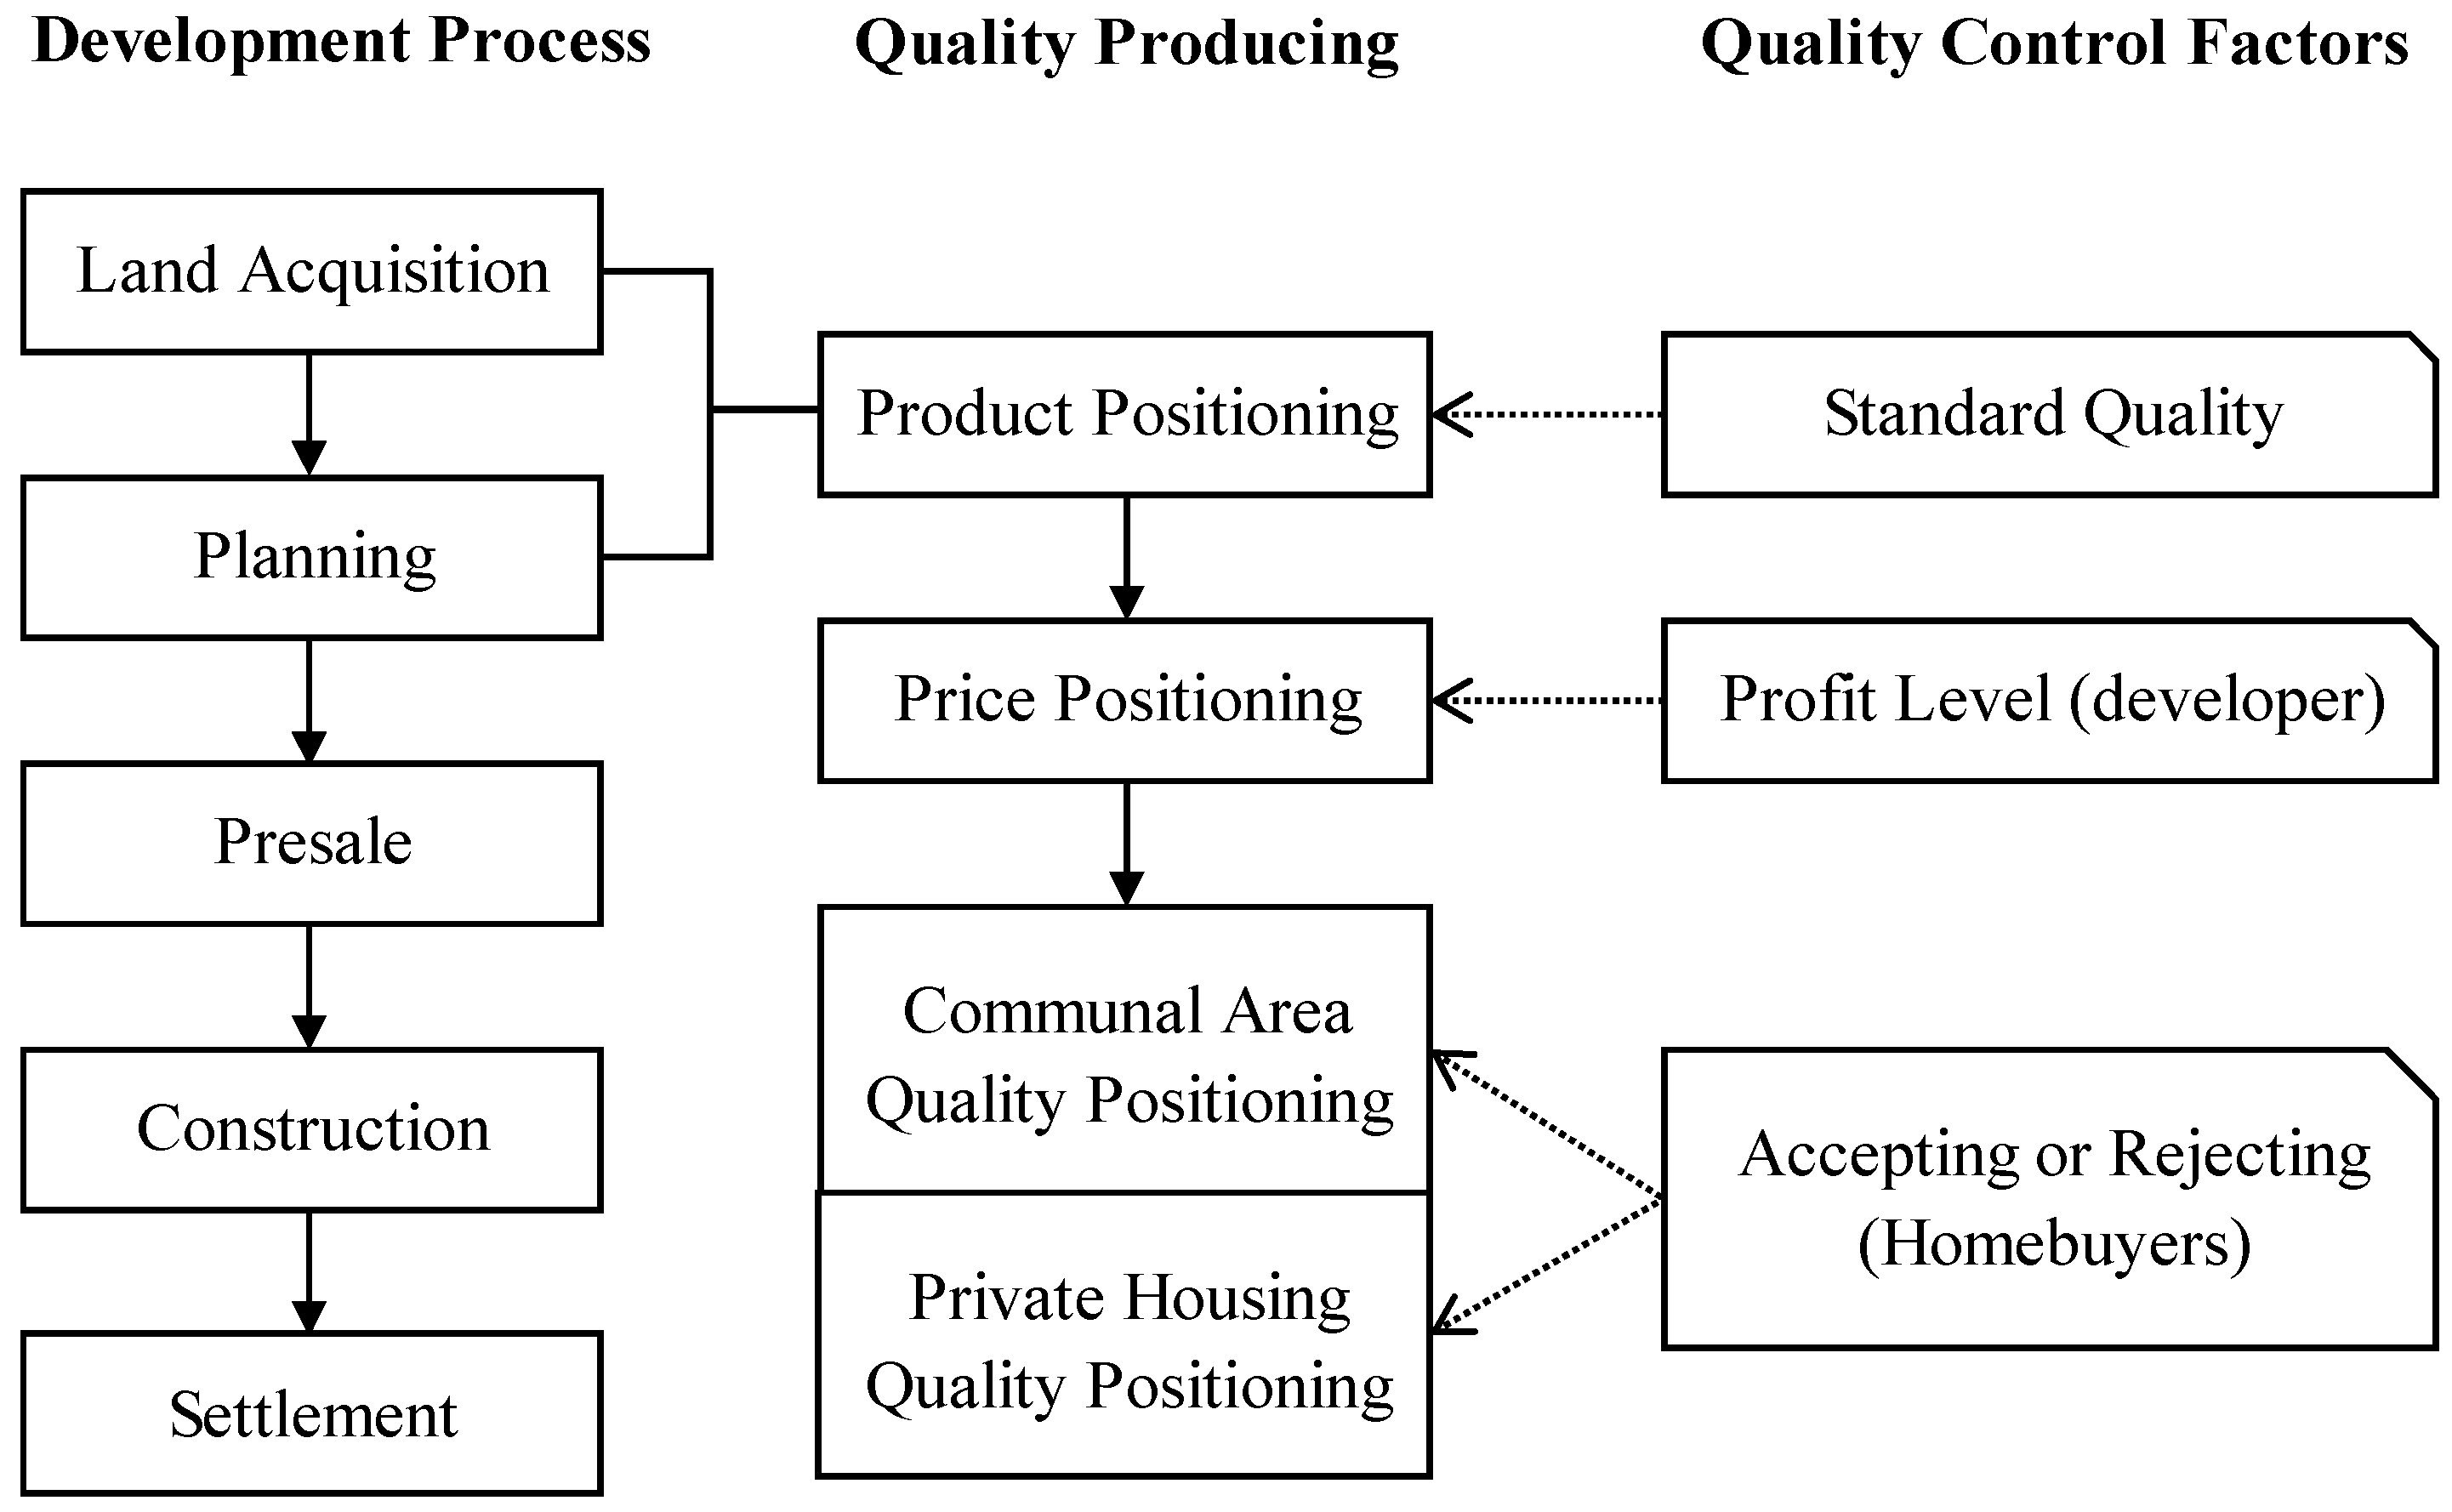
Current cost-oriented HQ supply models present numerous problems. They are unable to meet the HQ expectations of homebuyers, and developers are only willing to provide standardized products and quality. The present study examined the housing demands, quality recognition, and cost (including sales price and profit) problems of both homebuyer and developers, and proposed a novel housing cost–quality trade-off model (
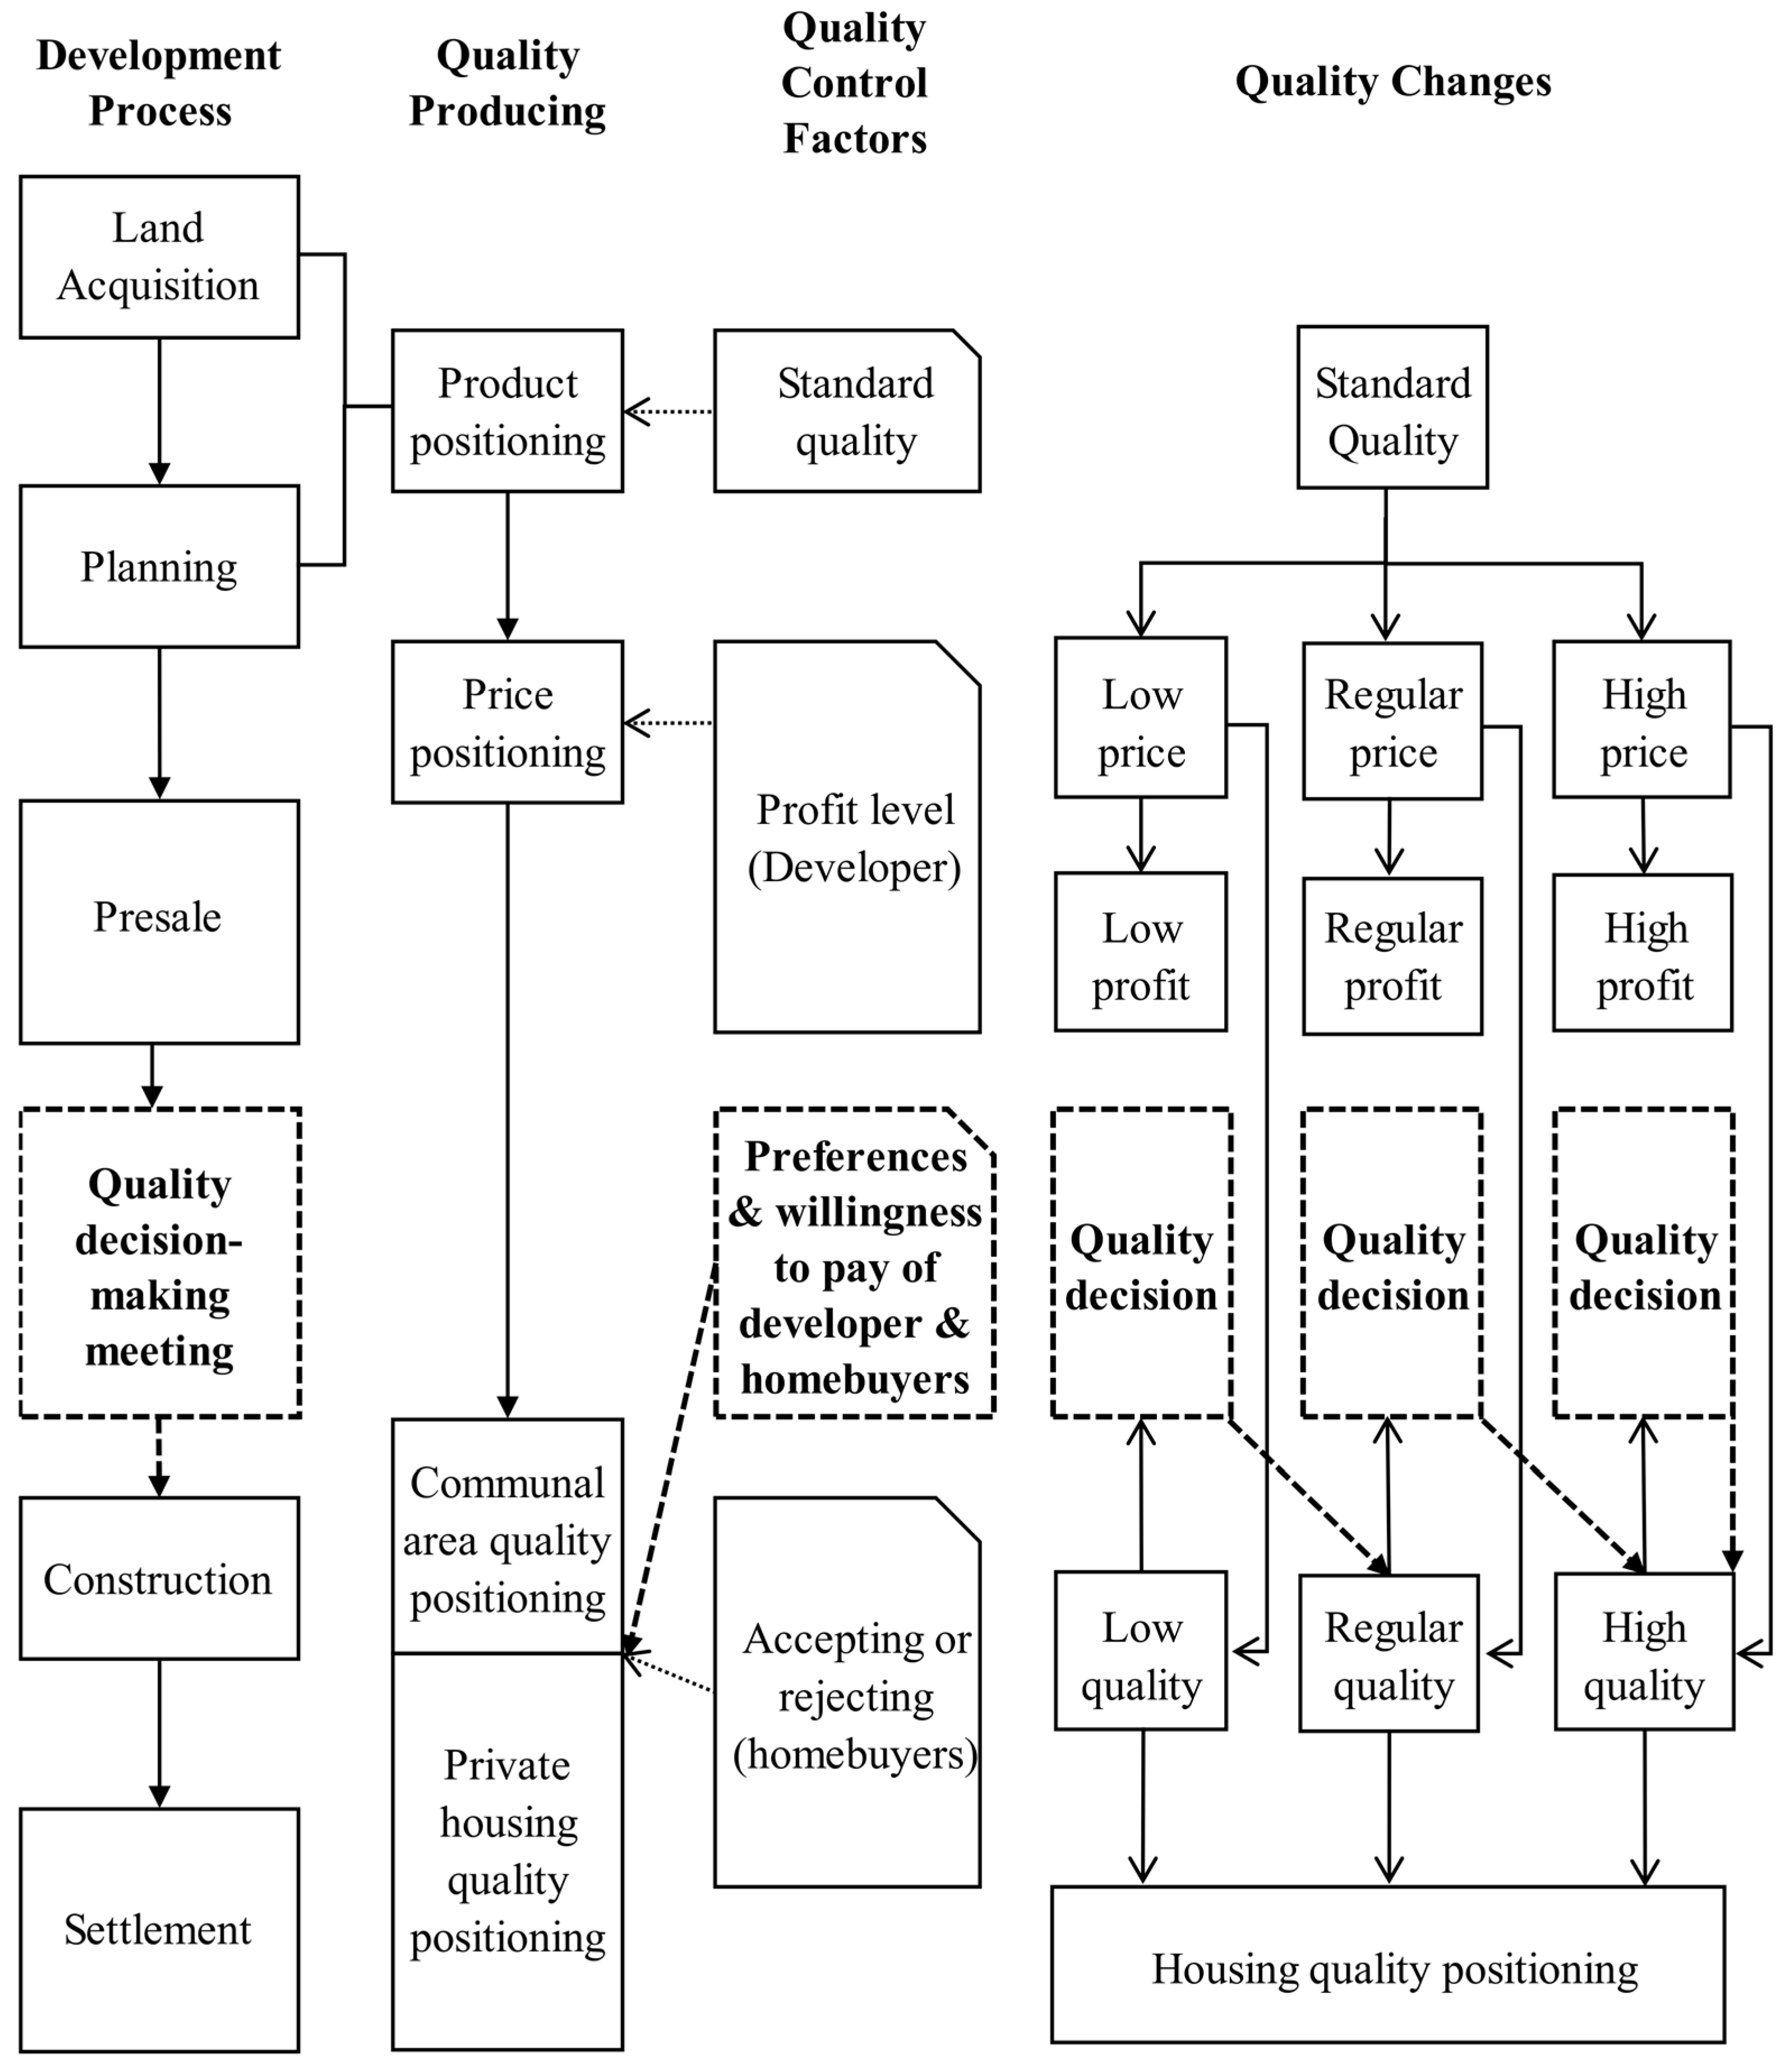
Figure 3). Moreover, a presale HQ decision-making meeting was incorporated into the development process. Both developers and homebuyers participate in this meeting in order to reach a consensus concerning quality, where cost is adjusted by including or excluding quality items.
Theoretically, homebuyers are willing to increase their budget in order to gain an increased quality of products. Developers are willing to satisfy homebuyers’ quality expectations without compromising profits. Therefore, the trade-off problem for homebuyers and developers is to identify the optimal quality level that fits homebuyers’ budget, while retaining developers’ profit.
3.4. Genetic Algorithms (GAs)
The quality item selection set for a package may exceed more than billions of combinations. In order to optimize the trade-off between cost and quality, this study adopts the GA as an effective analytic tool and stochastic search technique. It is helpful in solving large and complicated problems by using ideas from natural genetics and evolutionary principles [
32]. Combining problem-solving algorithms with the principles of evolution, the GA demonstrates great operations in combinatorial optimization [
33]. By giving more chances to the better elements to have offspring in the next generation, the GA facilitates an evolutionary process in which elements in a population progressively improve over time [
34].
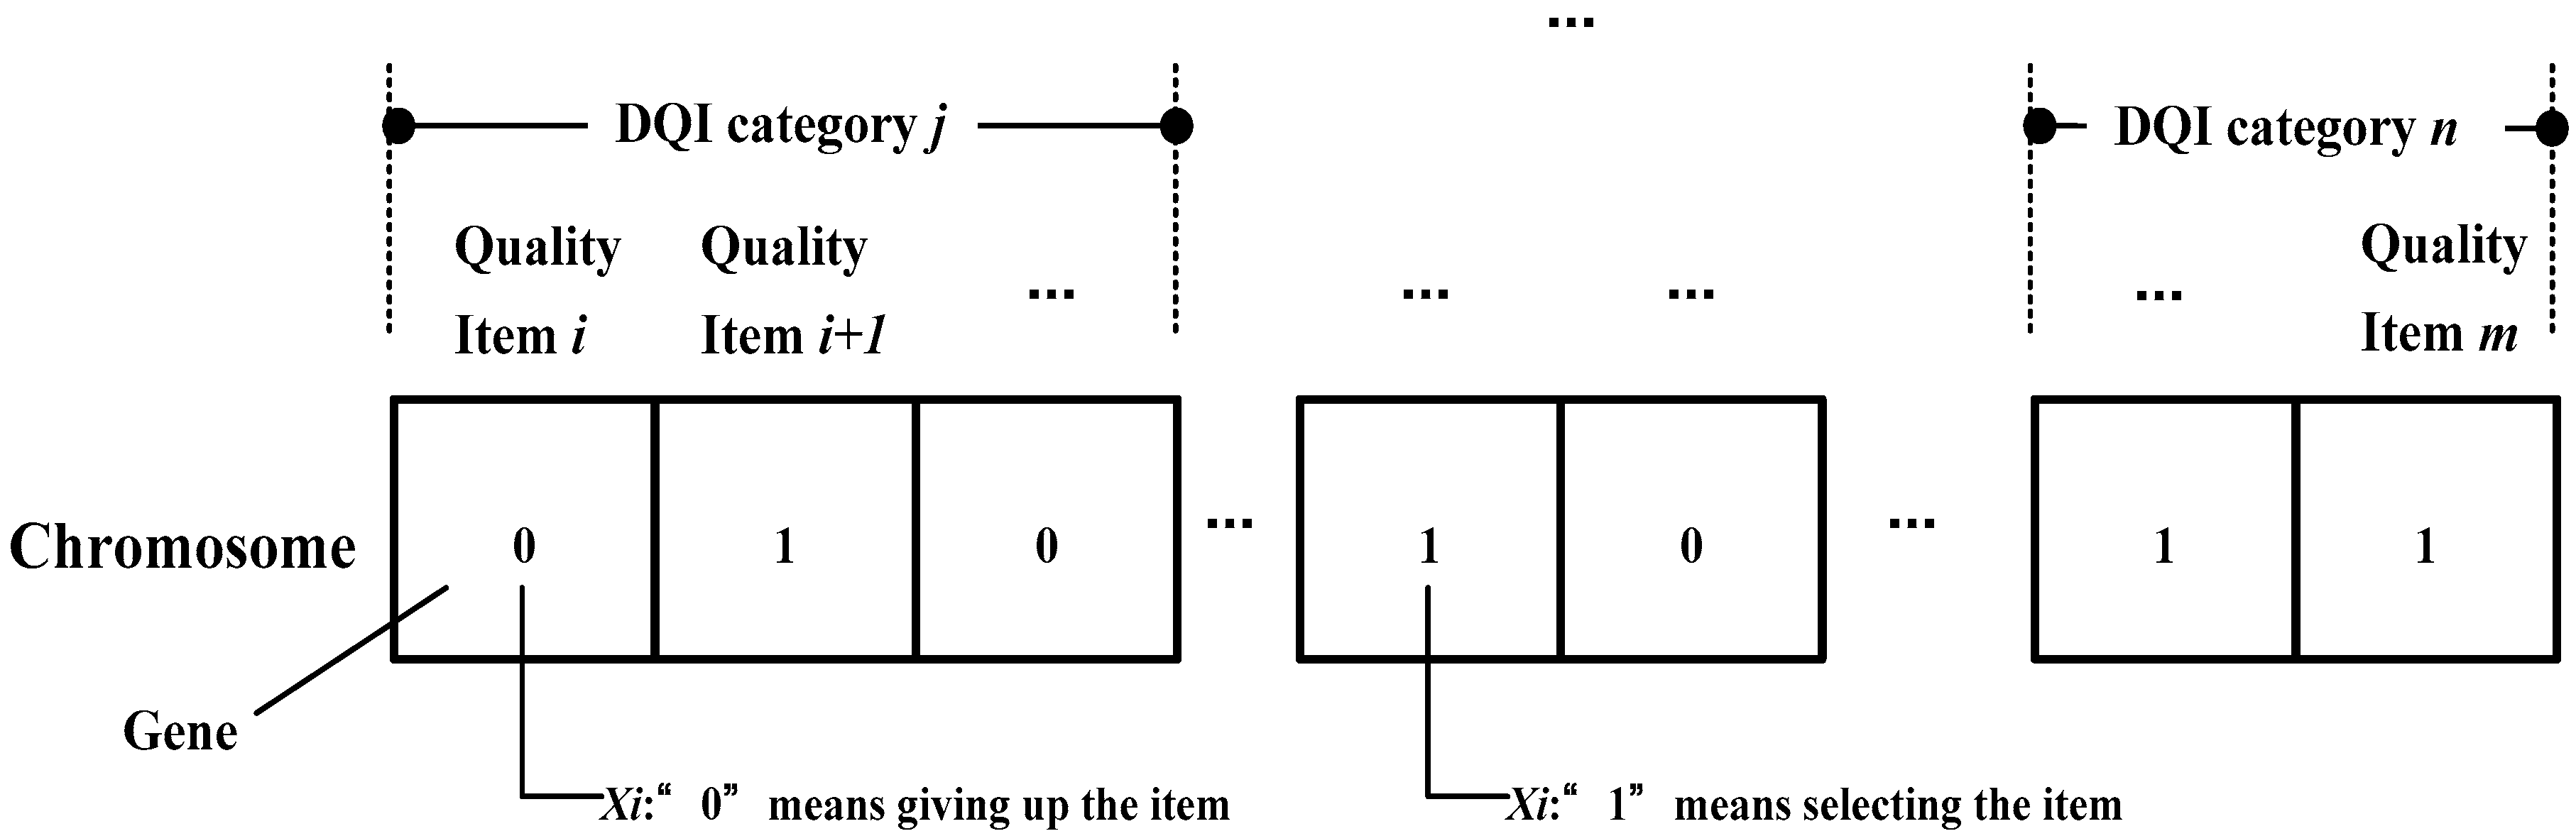
Implementing the GA entails a set of trial solutions that are coded as chromosomes. A chromosome is composed of genes representing variables (quality items). Each chromosome is evaluated on its performance with respect to the fitness function. The ones with better performance are more likely to survive than the ones with worse performance. This evolutionary process of genetic information is preceded by crossover, and perturbed by mutation. The result is a new generation with better survival abilities. The process is repeated until the chromosomes in the new generation are identical, or certain termination conditions are reached [
35]. For the chromosome structure, as illustrated in
Figure 4, the value of a variable is specified as the content of the gene, which means the quality item selections (the items of improving housing quality from the framework of the DQI, see
Table A1) in this study.
Assuming that the proposed model comprises an mth number of quality items, Bi (i = 1, 2, 3, …, m) represents the cost that homebuyers would have to pay for the ith quality item, and Di (i = 1, 2, 3, …, m) represents the cost that developers would have to pay for the ith quality item. B represents the value that homebuyers are willing to increase their total housing purchasing budget, and D represents the value that developers are willing to provide a total budget for quality after taking into account their profit. In addition, Gi (i = 1, 2, 3, …, m) represents homebuyers’ willingness to pay for the ith quality item, and Hi (i = 1, 2, 3, …, m) represents the developers’ willingness to provide the ith quality item.
Subsequently,
xi represents the benefit of investing in the
ith quality item. The following problems are expressed using the fitness function of the GA. First,
Ci (=
Gi +
Hi) is used to express the synergy between developers and homebuyers. If
Gi and
Hi are higher than the mean value of homebuyers’ and developers’ willingness values (items located in the quadrant
I in
Figure 2), respectively, then the items with higher
Ci are more advantageous to be selected during the optimal process.
Quality items with high homebuyer preferences and developer willingness, as well as items with high homebuyer preferences and low developer willingness, are listed as priority improvement items (Equations (1) and (2)). Second, quality items with a homebuyers’ preferences value lower than the mean value
a were allocated to the “
Careless area” and “
Surplus area”. These are the priority items for exclusion (Equation (3)). Third, the total cost of the quality items generated by the optimal solution must be smaller than the total budget that the homebuyers and developers are willing to pay (Equations (4) and (5)). If the cost of differentiation is high, and the synergy of two sides is low (not cost-effective), these items might be also excluded.


