Comparing the Sustainable Development Potential of Industries: A Role for Sustainability Disclosures?


Abstract
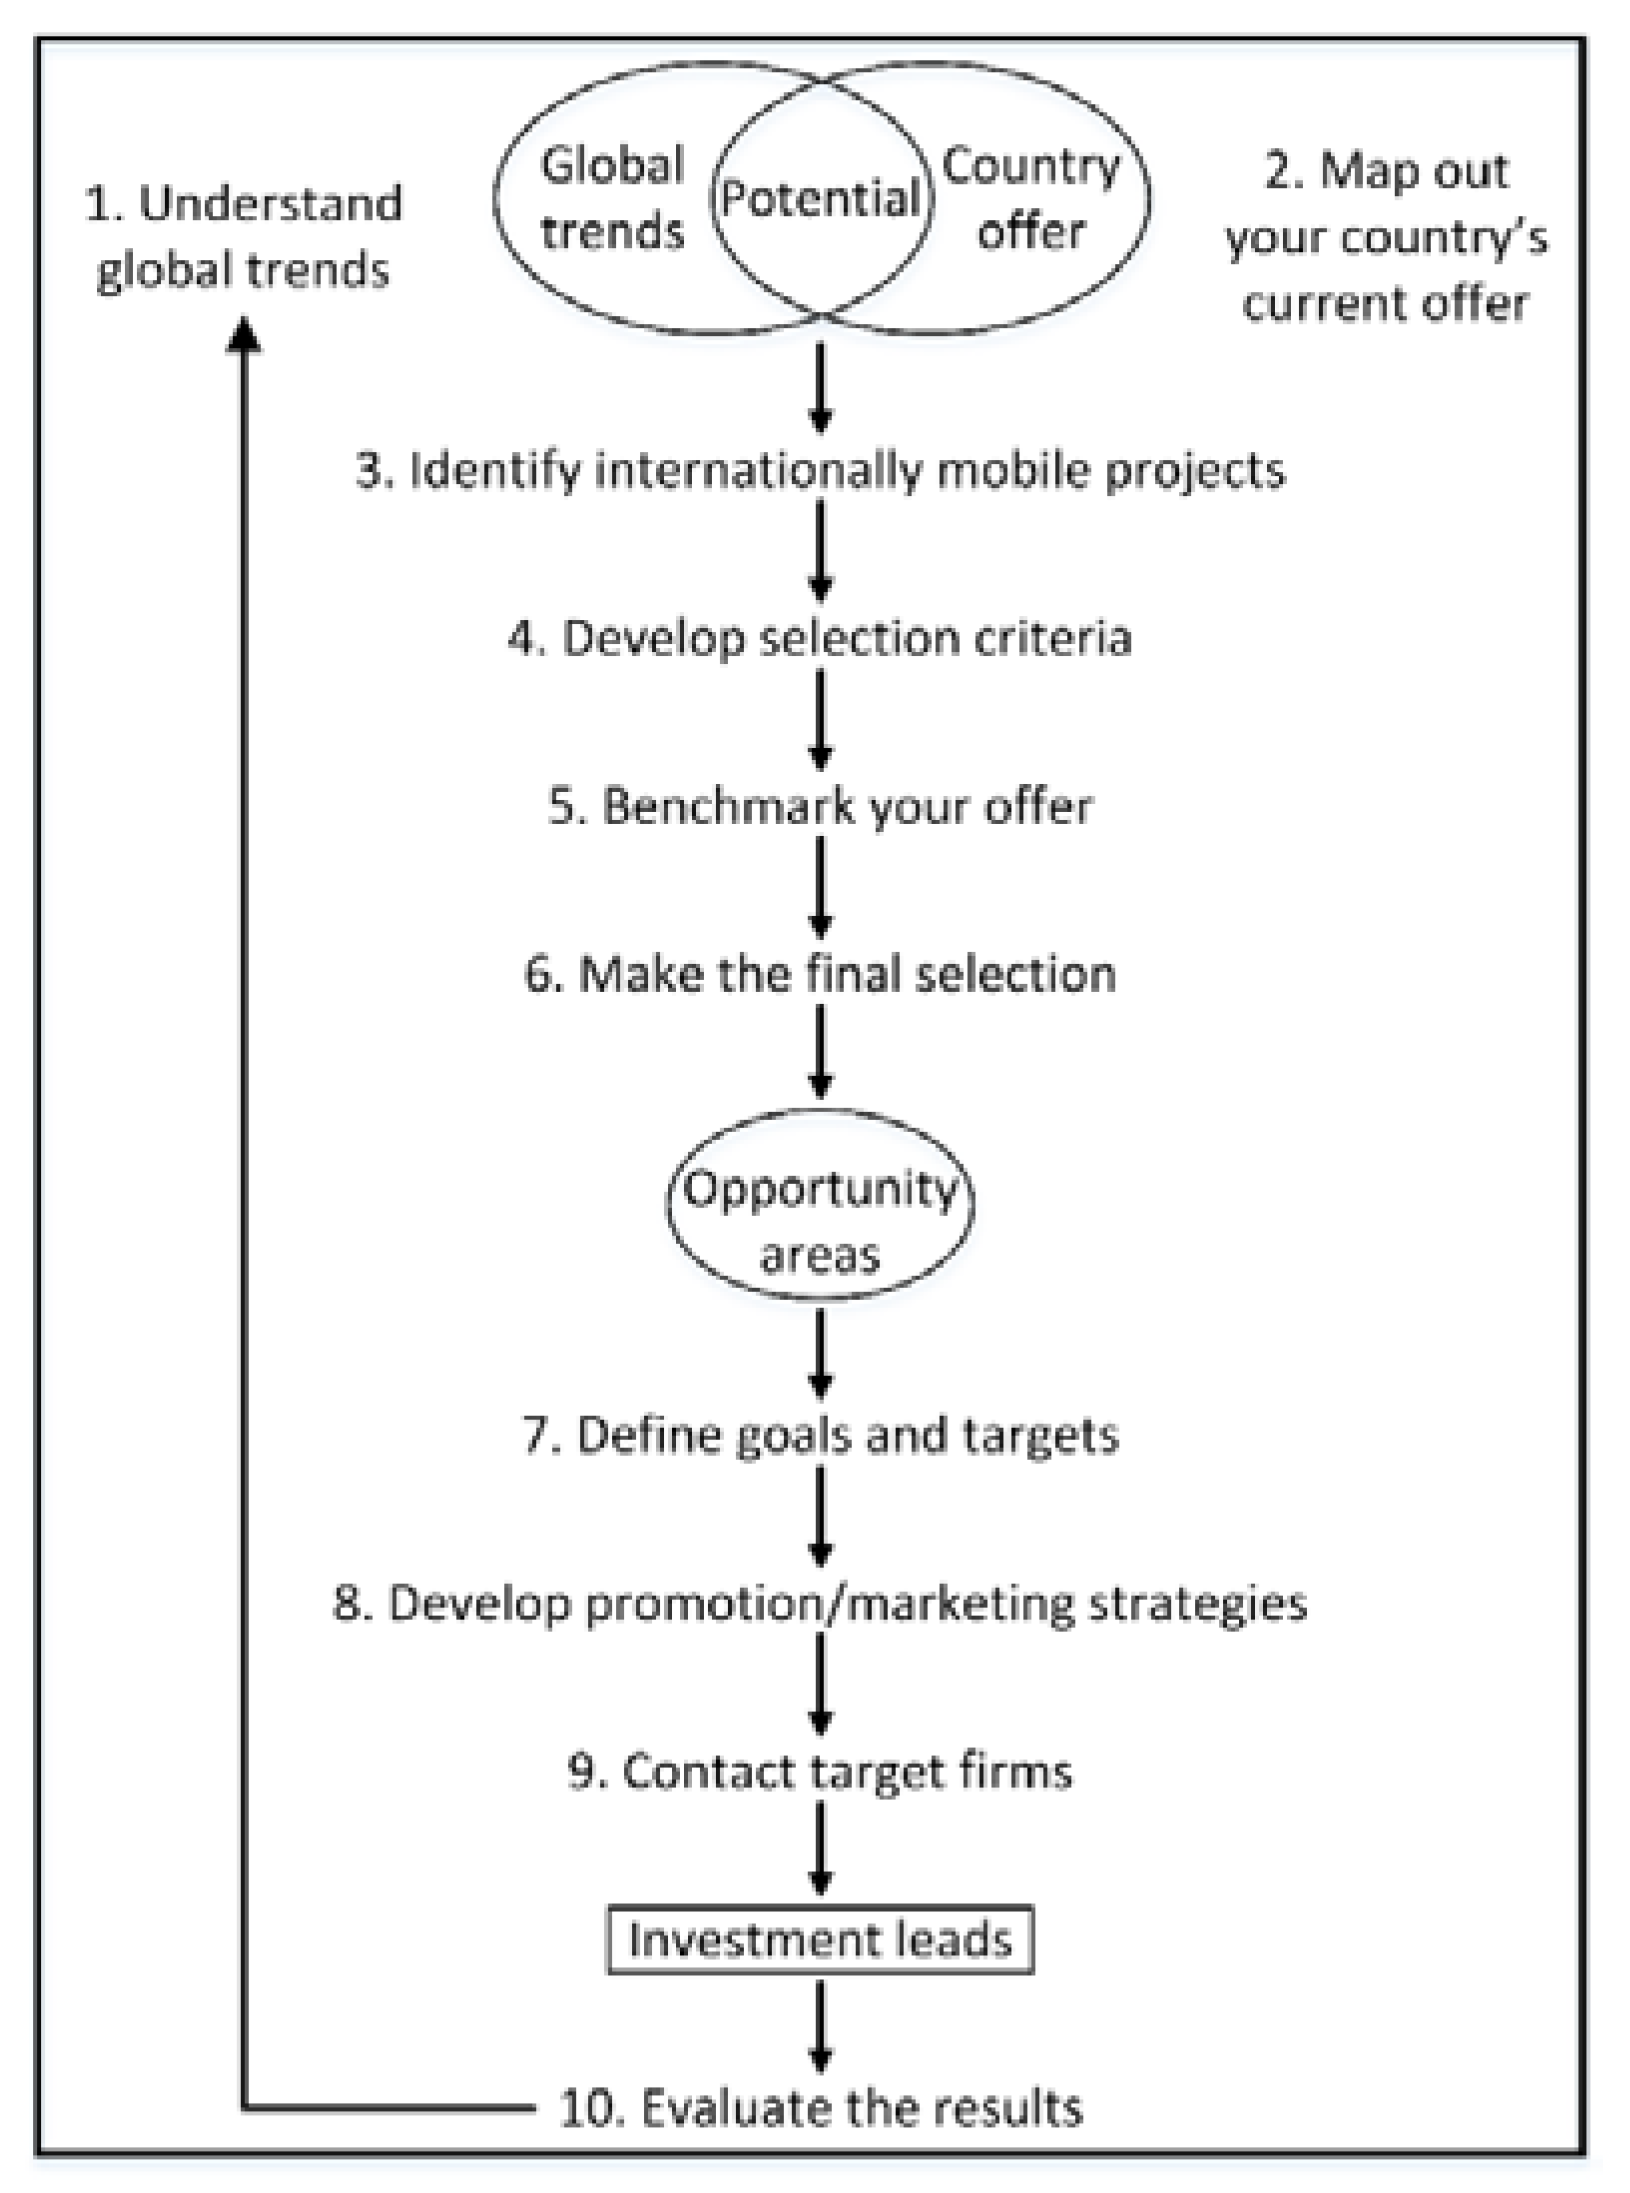
:1. Introduction
2. Literature
2.1. Sustainability Assessment
2.2. Sustainability Indicators and Aggregation
2.3. Comparison of Sustainable Development Potential
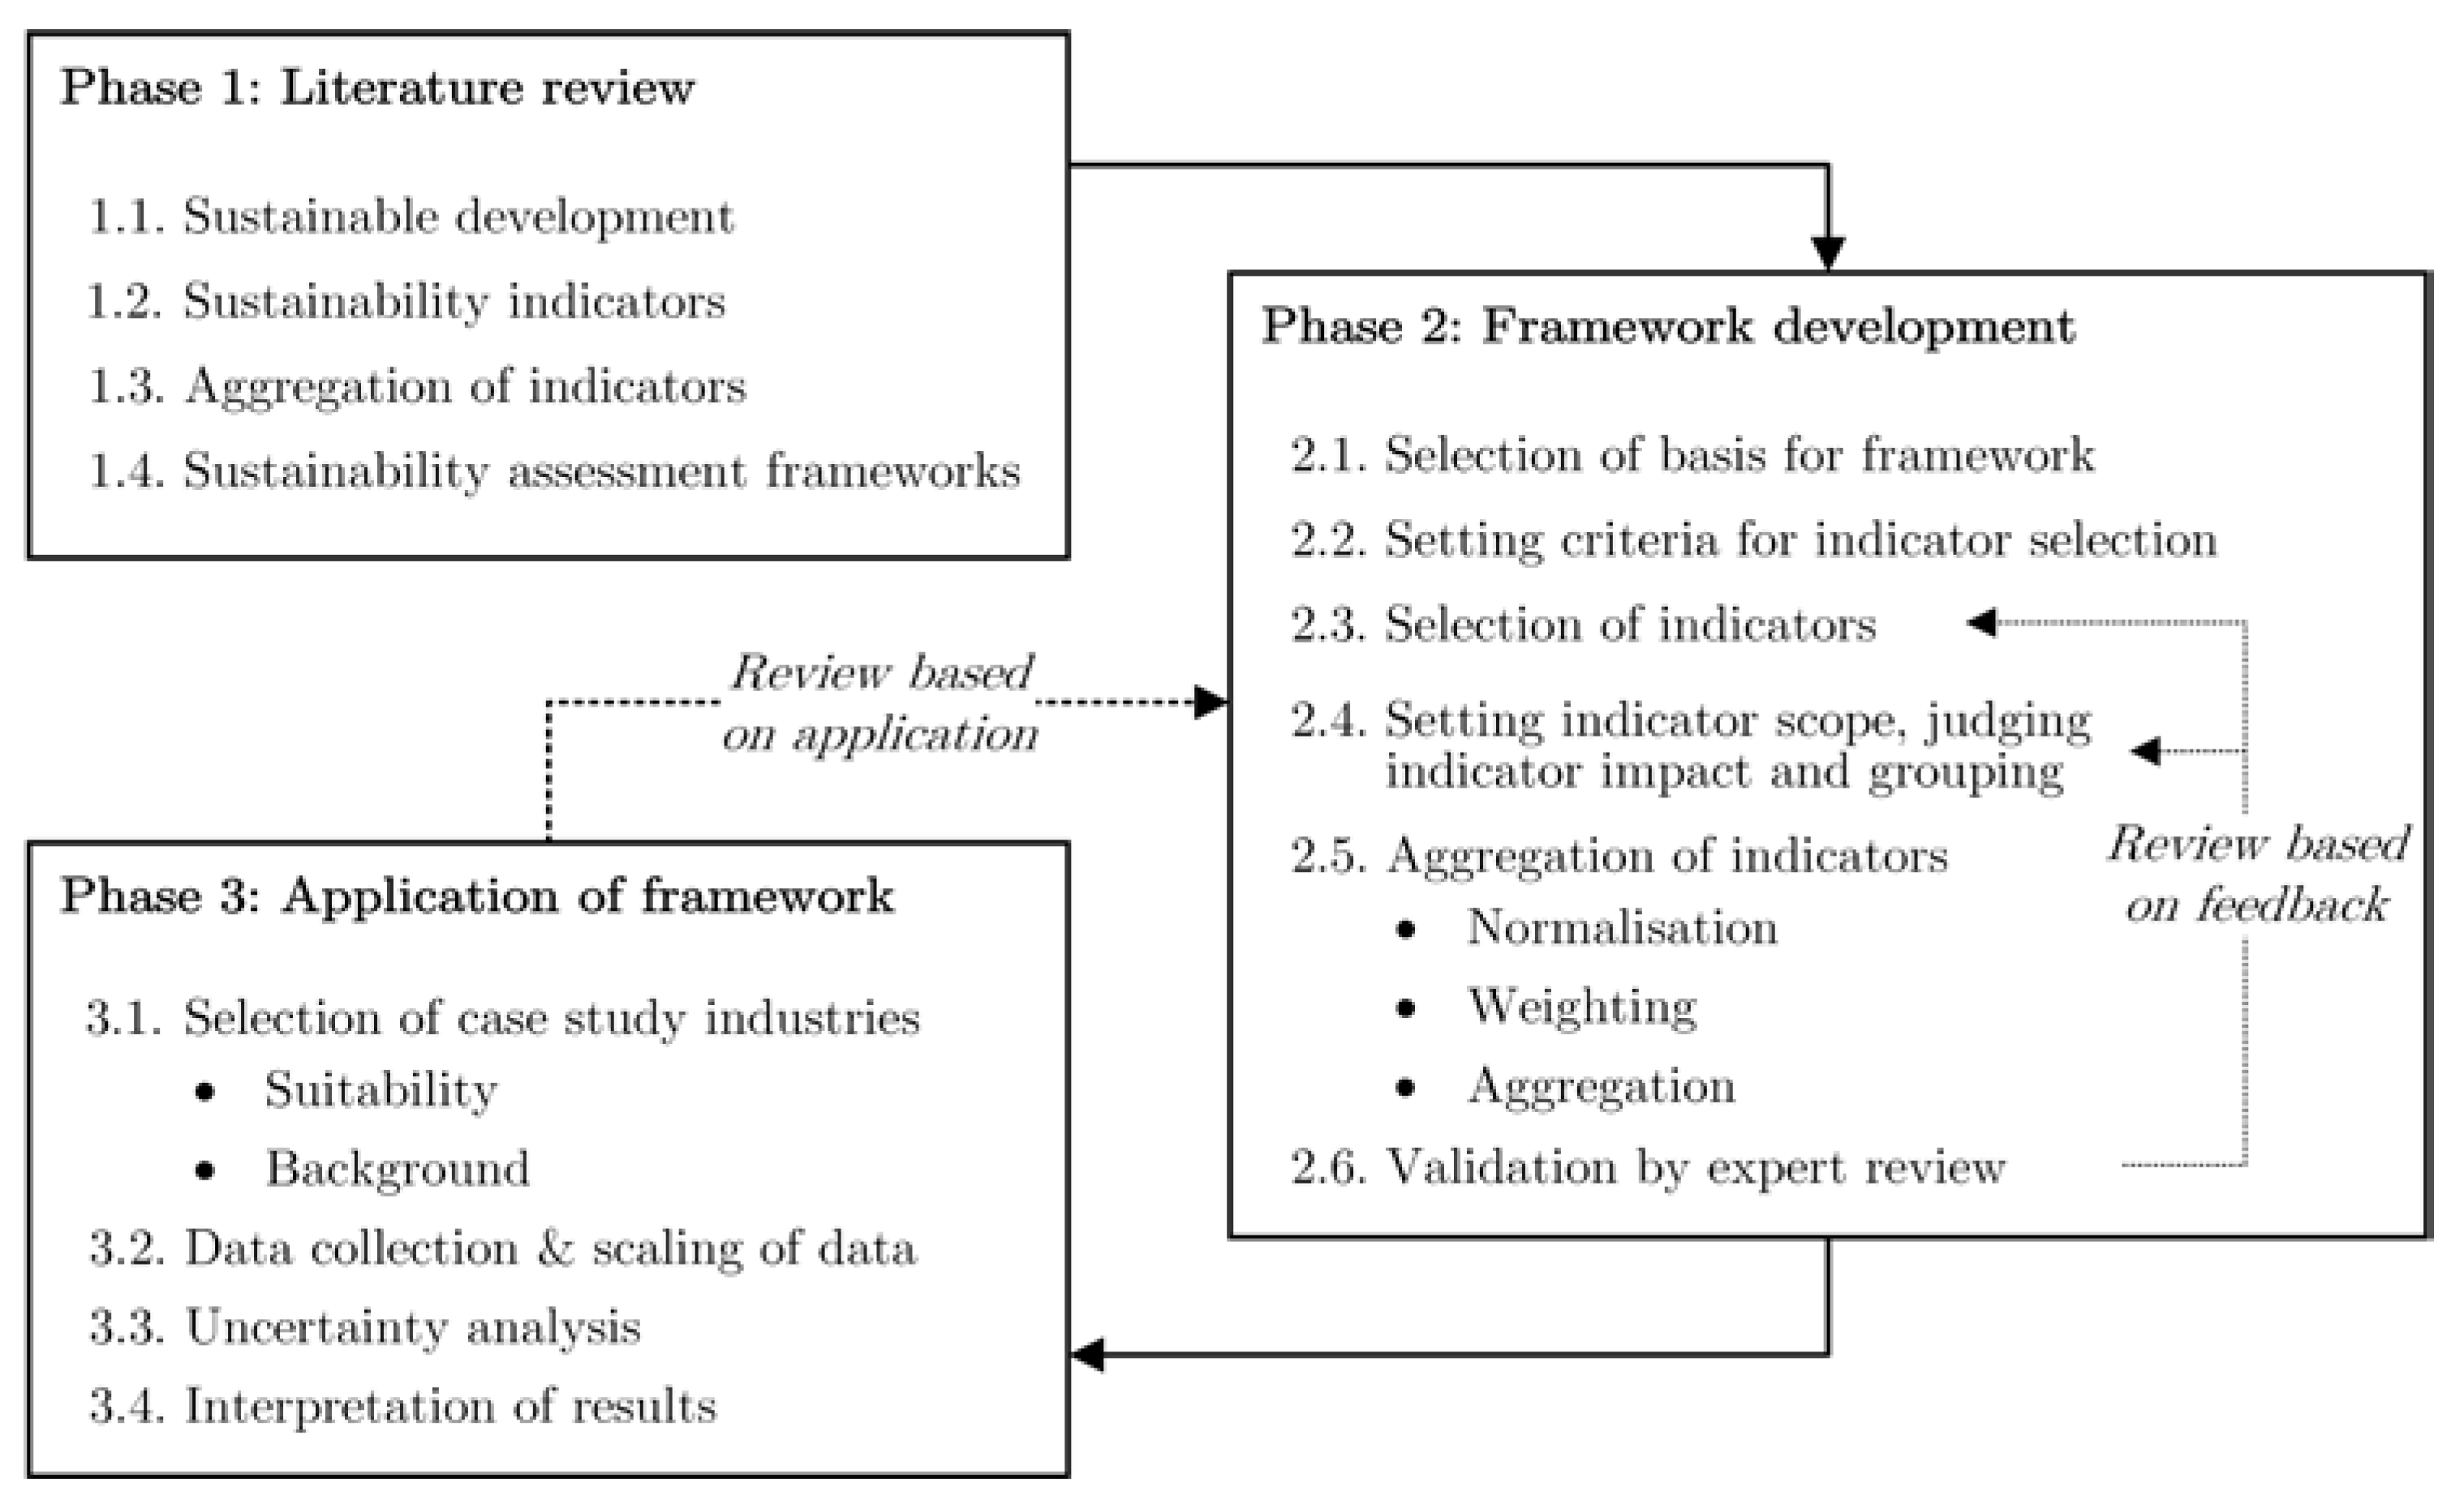
3. Method
4. Proposed Assessment Framework
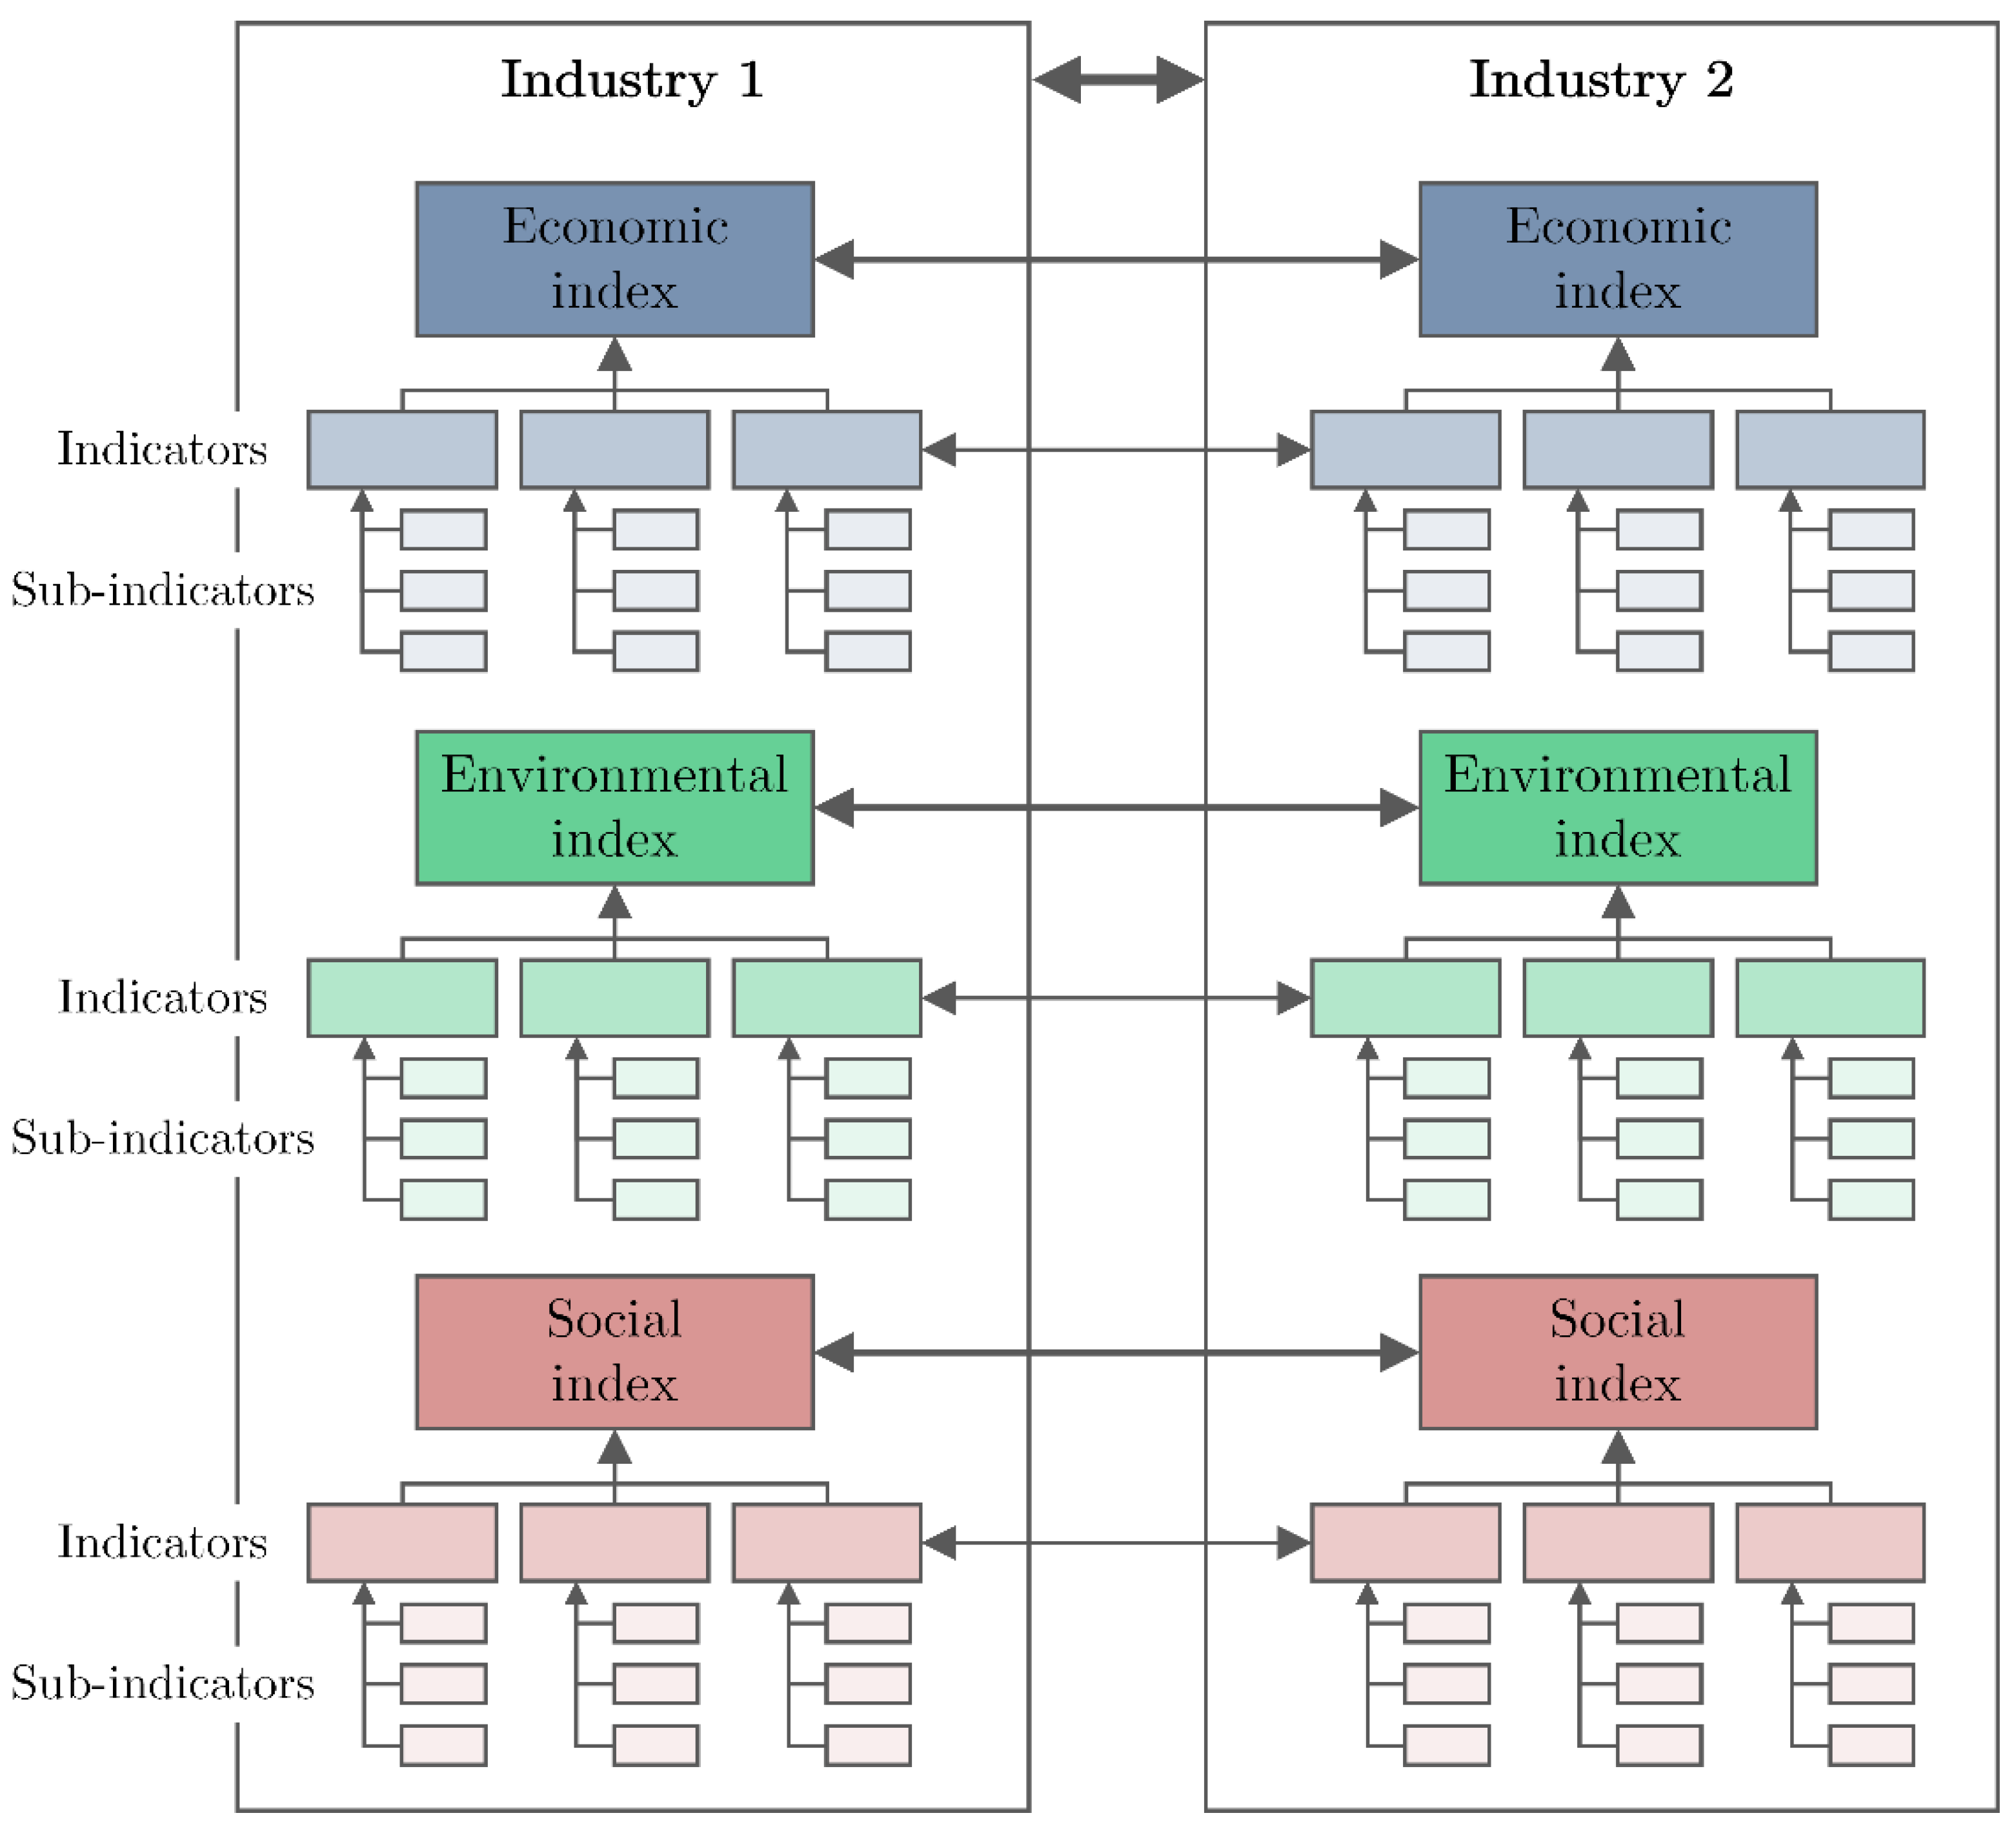
4.1. Framework Structure
4.2. Framework Development
4.2.1. Foundation of the Framework
4.2.2. Selection of Indicators
4.2.3. Indicator Scope, Grouping and Judgement of Impact
4.2.4. Weighting of Indicators
4.2.5. Aggregation of Indicators
4.2.6. Validation of the Framework
4.3. Case Study Methodology
4.3.1. Case Selection
4.3.2. Data Collection
4.3.3. Scaling of Data
4.3.4. Uncertainty Analysis
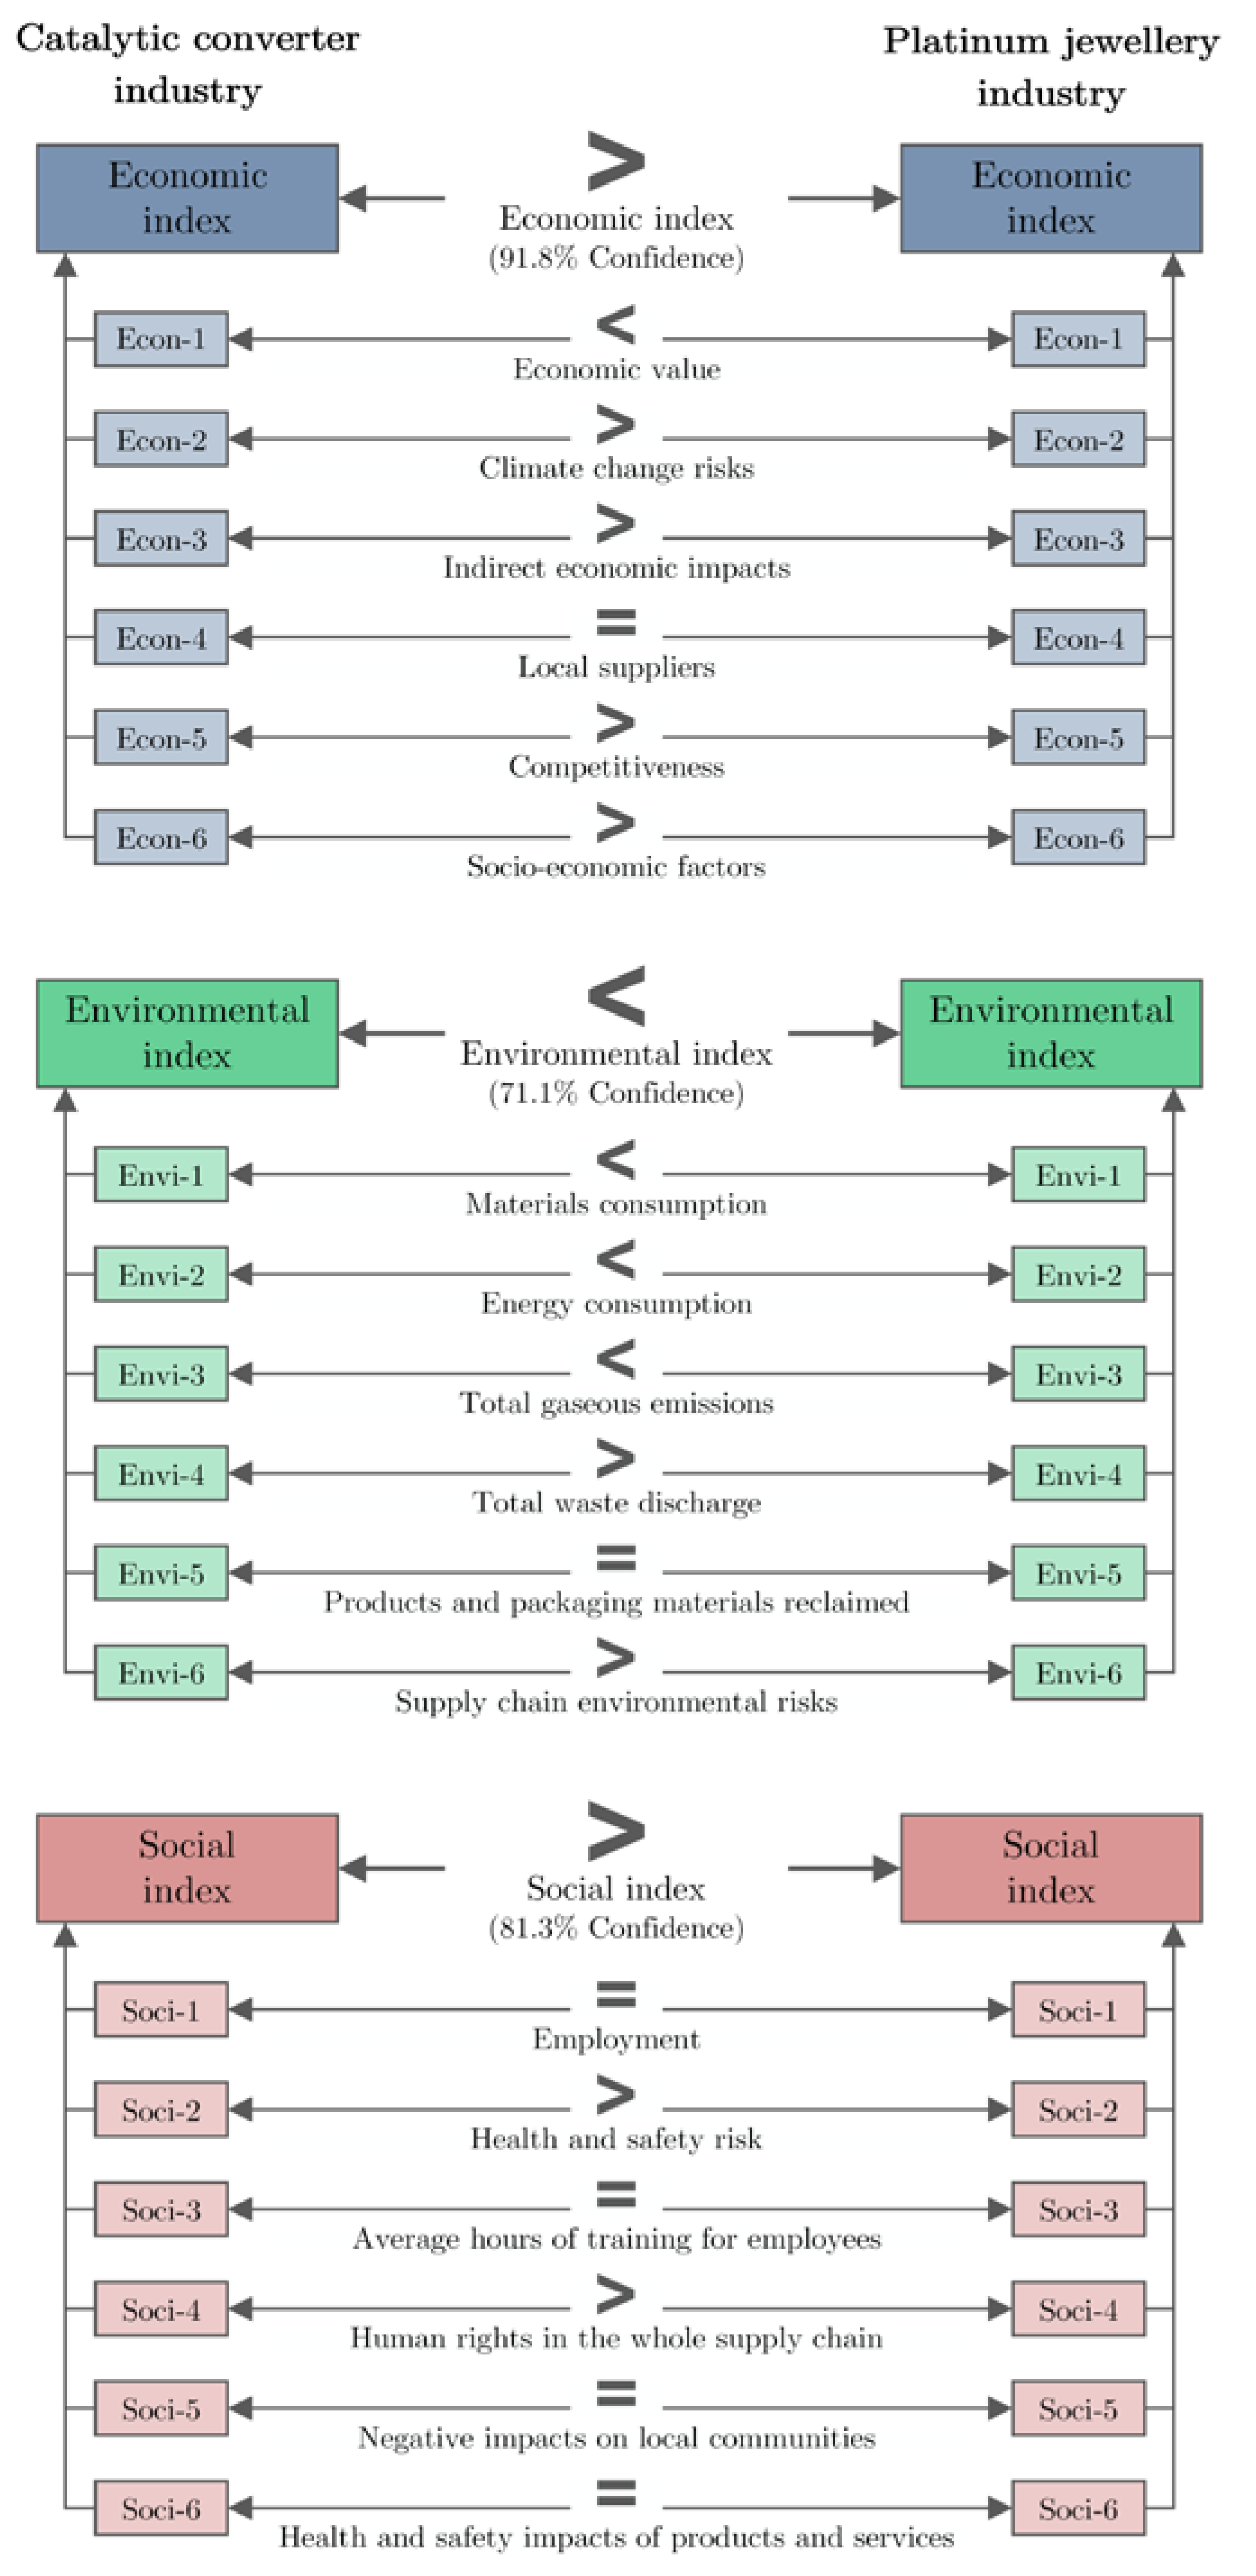
5. Case Study Results
5.1. Economic Index
5.2. Environmental Index
5.3. Social Index
5.4. Brief Perspective on the Results
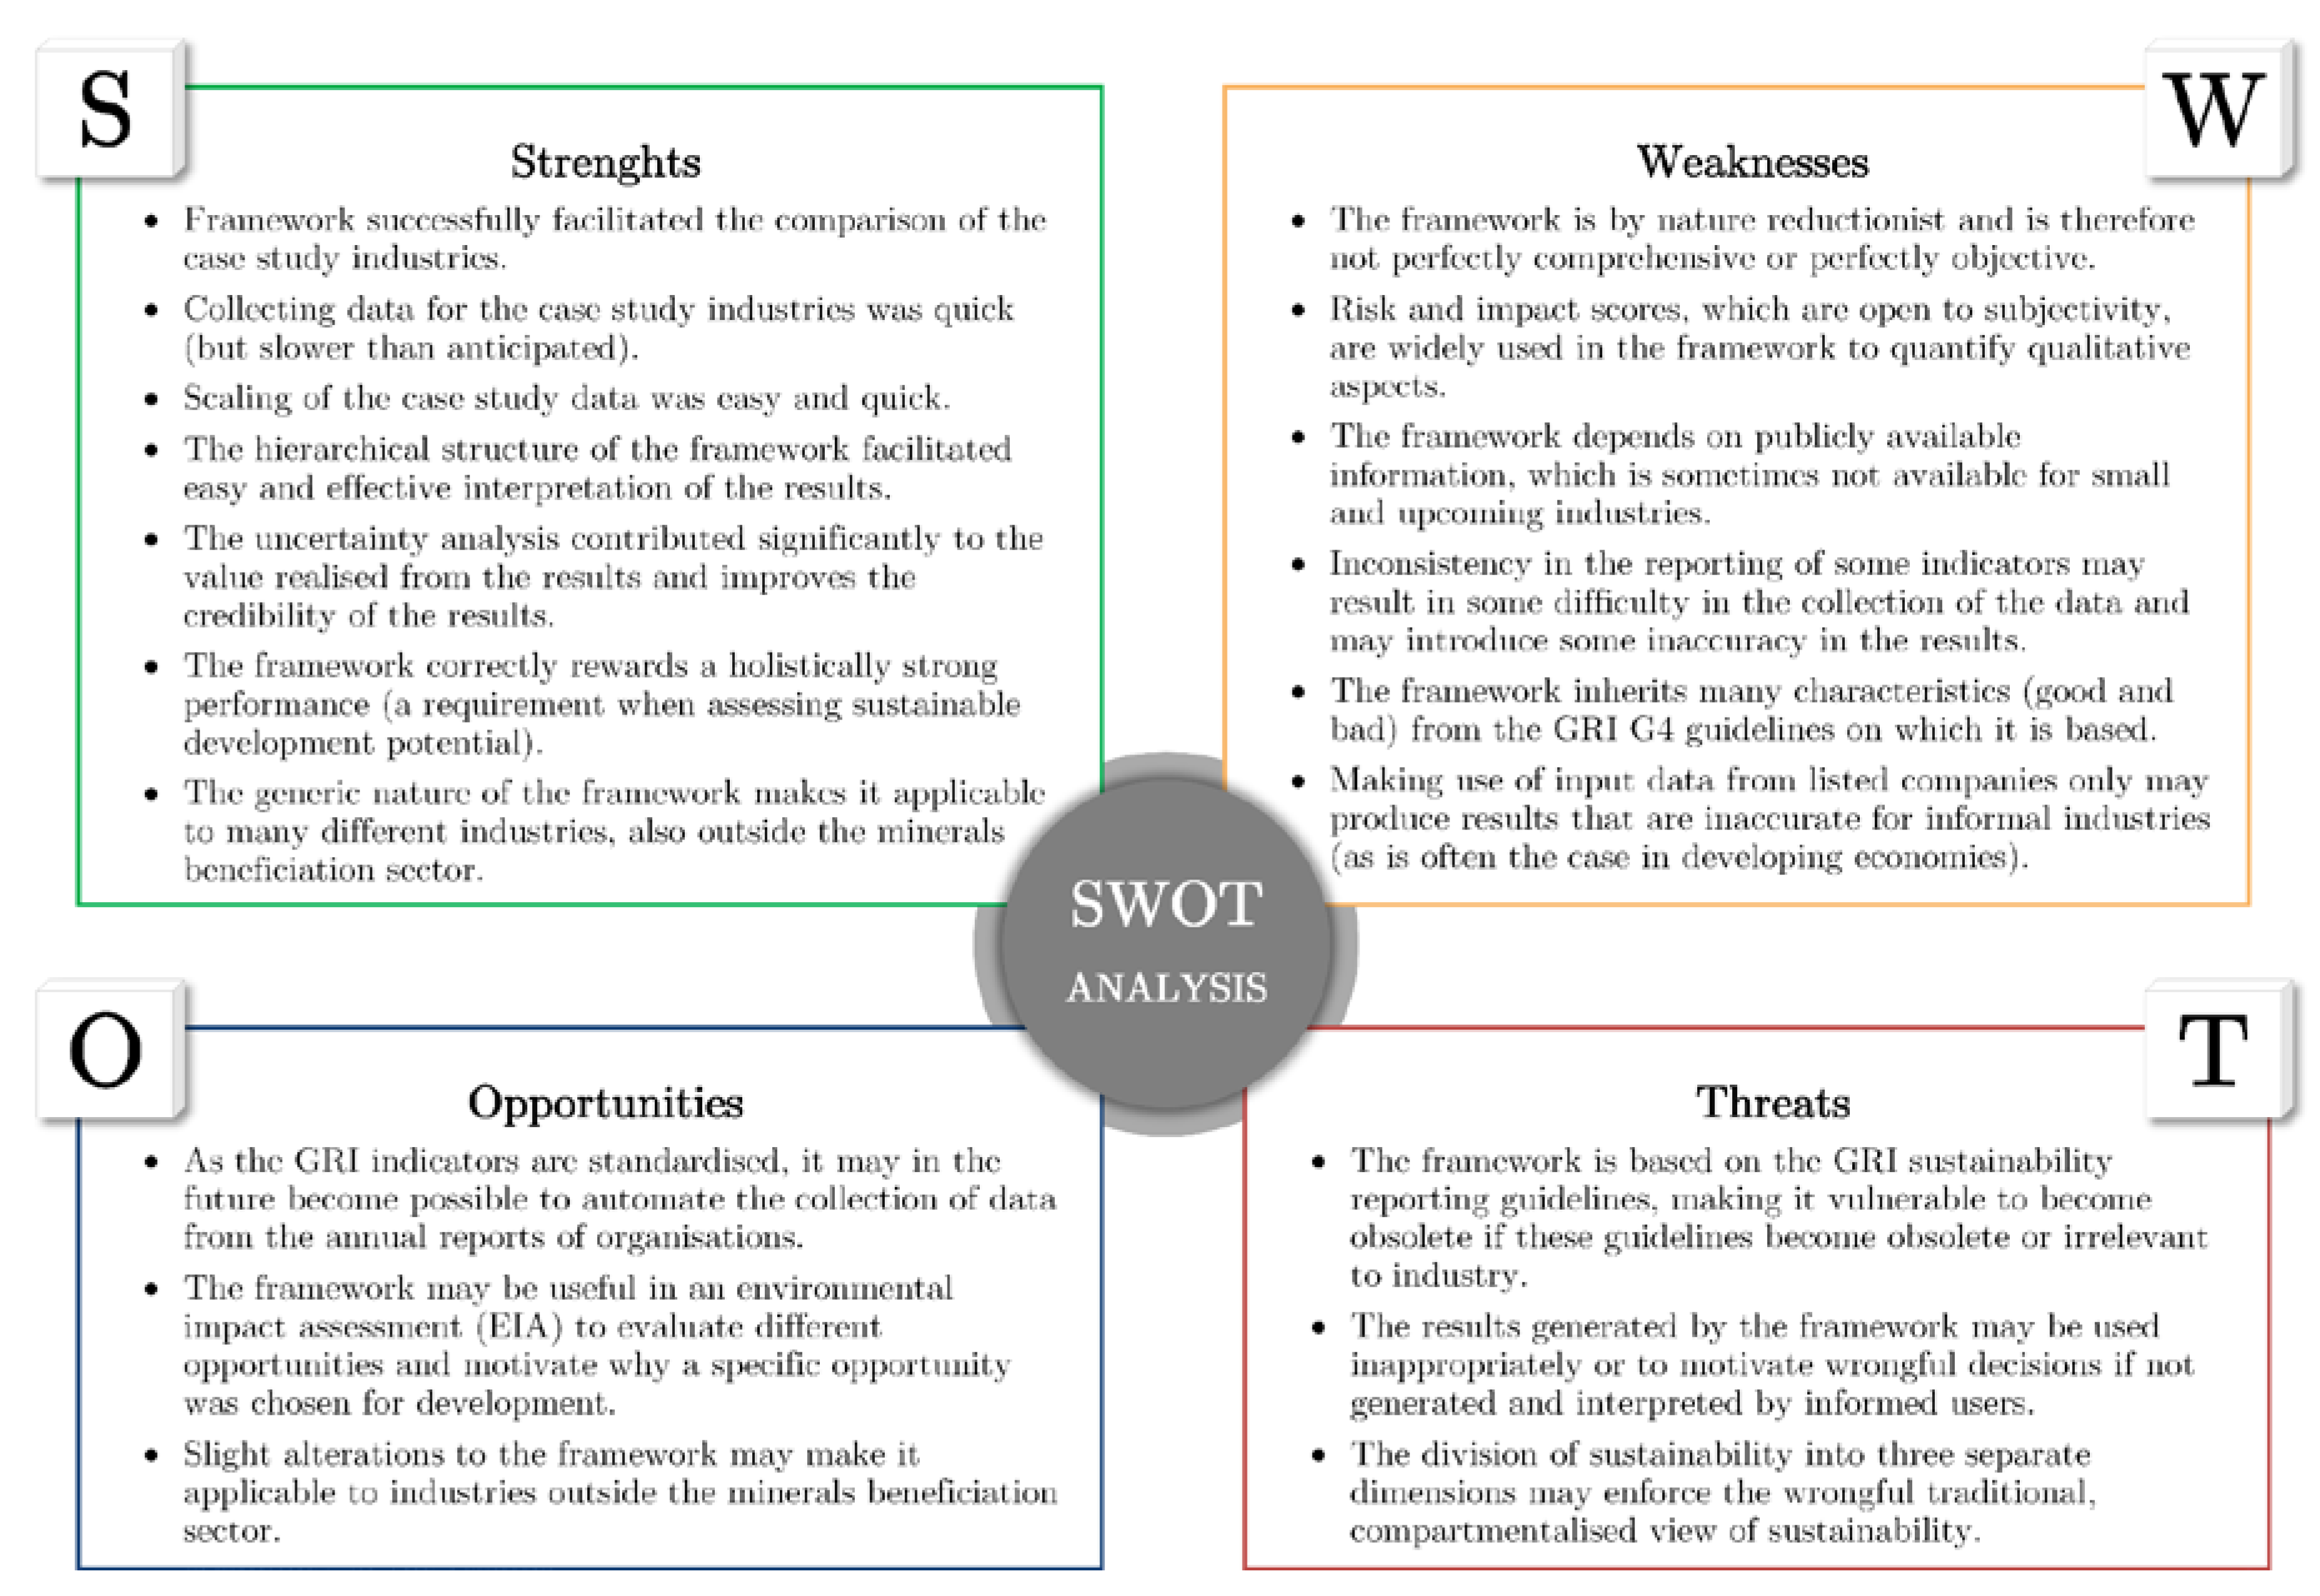
6. Discussion
6.1. S.W.O.T. Analysis of the Framework
6.2. Recommendations for Improving the Framework
6.3. Discussion of the Use of Publicly Available Sustainability Information for Selecting Industries for Developement
7. Concluding Remarks
Supplementary Materials
Acknowledgments
Author Contributions
Conflicts of Interest
Appendix A

| Study | Level of Assessment | Target Industry | TBL Dimensions Addressed | Aggregation of Indicators | Objective |
|---|---|---|---|---|---|
| Labuschagne et al. [78] | Project-level | Process industry | All | None | Assess sustainability of business operations. |
| Chee Tahir and Darton [79] | Organization-level | None | Organization-specific dimensions with high impact. | None | Present a method for assessing the sustainability of a business operation. |
| Krajnc and Glavic [80] | Organization-level | None | All (predominantly environmental). | None | Propose a list of indicators to assess the sustainability level of a company. |
| Singh et al. [52] | Organization-level | Steel industry | All | 5-point rating system and Z score method [81] | Present a method for development of a composite sustainability performance index that measures the sustainability performance of an organisation. |
| Long et al. [82] | Organization-level | Iron & steel industry | All | Linear aggregation (using AHP to establish indicator weights). | Propose a sustainable assessment system specifically designed for Chinese iron and steel firms. |
| Salvado et al. [83] | Organization-level Supply chain-level | Automotive industry | All | Linear aggregation (using AHP to establish indicator weights). | Propose a sustainability index that provides companies with information about their TBL sustainability, at both individual and supply chain level. |
| Ghadimi et al. [84] | Product-level | Automotive components manufacturing industry | All | Linear aggregation of fuzzy input data (using fuzzy AHP to establish indicator weights). | Propose a weighted fuzzy assessment method for product sustainability assessment. |
| Study | Level of assessment | Target industry | TBL dimensions addressed | Aggregation of indicators | Objective |
| Winroth et al. [85] | Factory-level | None | All | None | Identify a list of performance indicators relevant for a production manager. |
| Garbie [86] | Organisation-level | Manufacturing industry | All | Linear aggregation (using AHP to establish indicator weights). | Modelling the required components and the introduction of a new assessment framework for assessing sustainability. |
| Vinodh et al. [87] | Organisation-level | Manufacturing industry | All | Linear aggregation | Propose a fuzzy-logic-based sustainability evaluation decision sup- port system for manufacturing organizations. |
| Lodhia and Martin [88] | Organisation-level | Mining industry | All (using integrated indicators) | None | Propose corporate sustainability indicators for a major Australian diversified resources company and engaged with expert stakeholders in determining the indicators' value and explanatory capacity. |
| Chen et al. [36] | Factory-level | Manufacturing industry | N/A | N/A | Present a review and evaluation study of existing assessment tools for factory sustainability assessment to clarify the difference between these tools. |
| Step | Description | Methods Used in Literature | Literature Sources |
|---|---|---|---|
| Selection of basis for framework | Selection of an existing reporting framework to serve as basis from which selected indicators can be used in the present framework | Specific to every project. | |
| Setting criteria for indicator selection | Setting appropriate criteria that have to be met by all indicators to be included in the framework. | Specific to every project. | |
| Selection of indicators | Selection of aspects to be quantified. Selection of appropriate indicator(s) to measure each aspect. | Data-driven approach Theory-driven approach Policy-driven approach | Zhou et al. [33] OECD and European Commission [35] Niemeijer [53] |
| Setting indicator scope, judging indicator impact and grouping | Setting scope of what aspects are included in each indicator. Establish whether each indicators measure a positive or negative impact. Structure indicators according to sub-groups of phenomenon (if applicable). | Specific to every project. | Zhou et al. [33] OECD and European Commission [35] |
| Aggregation of indicators Weighting of indicators | Assign weights to indicators to account for the relative importance of the aspects measured. | Equal weighting Statistical methods (using statistical analysis of large datasets, including principal components analysis, factor analysis, data envelopment analysis, the benefit of the doubt approach and unobserved components models). Participatory methods (making use of expert knowledge by consultation of industry experts, including the budget allocation process, analytic hierarchy process and conjoint analysis). | Brandi et al. [30] OECD and European Commission [35] |
| Normalization of indicators | Normalize indicators to allow aggregation of indicators measured in different units. | Ranking Min-max Distance to a reference Percentage of annual differences | Krajnc and Glavič [31] OECD and European Commission [35] Sikdar et al. [32] Zhou et al. [33] |
| Aggregation of indicators | Aggregate indicators into one index or a few indices. | Linear aggregation Geometric aggregation Non-compensatory multi-criteria (NCMC) aggregation | Munda and Nardo [58] OECD and European Commission [35] Zhou et al. [33] |
| Validation by expert review | Collection of feedback from knowledgeable people on the selected indicators and the structure of the framework. | Delphi Method Interview and/or questionnaire | Geist [89] Flick [90] |
Appendix B
| ID | Name | Units | Weight | Impact | Jewellery Industry | Cat. Conv. Industry | Jewellery Industry Score | Cat. Conv. Industry Score |
|---|---|---|---|---|---|---|---|---|
| Economic indicators | 3/12 | 9/12 | ||||||
| Econ-1 | Economic value | Expected earnings | 1/6 | 1 | US$ 339 944 523 | US$ 94 954 290 | 1/6 | 0 |
| Econ-2 | Climate change risks | Risk score | 1/6 | 1 | 0 | 3 | 0 | 1/6 |
| Econ-3 | Indirect economic impacts | Impact score | 1/6 | 1 | 2 | 4 | 0 | 1/6 |
| Econ-4 | Local suppliers | Percentage of operating cost | 1/6 | 1 | 85% | 85% | 1/12 | 1/12 |
| Econ-5 | Competitiveness | Impact score | 1/6 | 0 | 1/6 | |||
| Econ-5.1 | Factor conditions | Impact score | 1/4 | 1 | 5 | 5 | 1/8 | 1/8 |
| Econ-5.2 | Demand conditions | Impact score | 1/4 | 1 | 2 | 5 | 0 | 1/4 |
| Econ-5.3 | Related & supporting industries | Impact score | 1/4 | 1 | 7 | 7 | 1/8 | 1/8 |
| Econ-5.4 | Rivalry | Impact score | 1/4 | 1 | -6 | -3 | 0 | 1/4 |
| Econ-6 | Socio-economic factors | Impact score | 1/6 | 0 | 1/6 | |||
| Econ-6.1 | Political factors | Impact score | 1/3 | 1 | 5 | 7 | 0 | 1/3 |
| Econ-6.2 | Regulatory factors | Impact score | 1/3 | 1 | 1 | 1 | 1/6 | 1/6 |
| Econ-6.3 | Cultural & demographic factors | Impact score | 1/3 | 1 | 1 | 1 | 1/6 | 1/6 |
| Environmental indicators | 7/12 | 5/12 | ||||||
| Envi-1 | Materials consumption | Mass & impact of consumption | 1/6 | 1/6 | 0 | |||
| Envi-1.1 | Materials by weight | Mass of material | 1/3 | −1 | 0 | 0 | 1/6 | 1/6 |
| Environmental indicators (continued) | ||||||||
| Envi-4.2 | Waste by type and disposal method | Mass of waste generated | 1/3 | −1 | 0 | 0 | 1/6 | 1/6 |
| Envi-4.3 | Overall quality of waste | Impact score | 1/3 | 1 | -6 | -3 | 0 | 1/3 |
| Envi-5 | Products and packaging materials reclaimed | Percentage reclaimed | 1/6 | 1 | 0 | 0 | 1/12 | 1/12 |
| Envi-6 | Supply chain environmental impacts | Risk score | 1/6 | −1 | 6 | 5 | 0 | 1/6 |
| Social indicators | 4/12 | 8/12 | ||||||
| Soci-1 | Employment | Number of employees & impact of employment | 1/6 | 1/12 | 1/12 | |||
| Soci-1.1 | Number of new employee hires | Number of employees | 1/2 | 1 | 8425 | 1461 | 1/2 | 0 |
| Soci-1.2 | Impact of employment | Impact score | 1/2 | 1 | 6 | 7 | 0 | 1/2 |
| Soci-2 | Health & safety risk | Total rate of injury and occupational disease (occurrences/time) | 1/6 | −1 | 186 | 18 | 0 | 1/6 |
| Soci-3 | Average hours of training for employees | Average hours of training per employee per year | 1/6 | 1 | 0 | 0 | 1/12 | 1/12 |
| Social indicators (continued) | ||||||||
| Soci-4 | Human rights in whole supply chain | Risk score | 1/6 | 0 | 1/6 | |||
| Soci-4.1 | Negative impacts for labor practices in the supply chain | Risk score | 1/6 | −1 | 5 | 3 | 0 | 1/6 |
| Soci-4.2 | Incidents of discrimination | Risk score | 1/6 | −1 | 0 | 0 | 1/12 | 1/12 |
| Soci-4.3 | Significant risk of freedom of association in operations and suppliers | Risk score | 1/6 | −1 | 0 | 0 | 1/12 | 1/12 |
| Soci-4.4 | Significant risk of child labor in operations and suppliers | Risk score | 1/6 | −1 | 0 | 0 | 1/12 | 1/12 |
| Soci-4.5 | Significant risk of forced or compulsory labor in operations and suppliers | Risk score | 1/6 | −1 | 0 | 0 | 1/12 | 1/12 |
| Soci-4.6 | Human rights impacts in the supply chain | Risk score | 1/6 | −1 | 7 | 3 | 0 | 1/6 |
| Soci-5 | Negative impacts on local communities | Risk score | 1/6 | 1/12 | 1/12 | |||
| Soci-5.1 | Negative impacts on local communities | Risk score | 1/3 | −1 | 3 | 6 | 1/3 | 0 |
| Soci-5.2 | Risks related to corruption | Risk score | 1/3 | −1 | 0 | 0 | 1/6 | 1/6 |
| Soci-5.3 | Negative impacts on society in the supply chain | Risk score | 1/3 | -1 | 7 | 5 | 0 | 1/3 |
| Soci-6 | Health and safety impacts of products and services | Risk score | 1/6 | 1/12 | 1/12 | |||
| Soci-6.1 | Health and safety impacts of products and services | Risk score | 1/2 | −1 | 1 | 5 | 1/2 | 0 |
| Soci-6.2 | Sale of banned or disputed products | Risk score | 1/2 | −1 | 6 | 4 | 0 | 1/2 |
Appendix C
| Indicator | SDGs Addressed | Indicator | SDGs Addressed | Indicator | SDGs Addressed |
|---|---|---|---|---|---|
| Economic indicators | Economic indicators | Social indicators | |||
| Econ-1 | 2,5,7,8,9 | Envi-1 | 6,8,12 | Soci-1 | 5,8 |
| Econ-2 | 13 | Envi-2 | 7,8,12,13 | Soci-2 | 3,8 |
| Econ-3 | 1,2,3,8,10,17 | Envi-3 | 3,12,13,14,15 | Soci-3 | 4,5,8 |
| Econ-4 | 12 | Envi-4 | 3,6,12,14 | Soci-4 | 5,8,16 |
| Econ-5 | 8 | Envi-5 | 8,12 | Soci-5 | 1,2,16 |
| Econ-6 | 9 | Envi-6 | None | Soci-6 | None |
References
- UNCTAD. Investment Promotion Handbook for Diplomats; UNCTAD: Geneva, Switzerland, 2011; pp. 585–589. [Google Scholar]
- UNCTAD. World Investment Report 2013; UNCTAD: Geneva, Switzerland, 2013. [Google Scholar]
- Harding, T.; Javorcik, B.S. Roll out the Red Carpet and They Will Come: Investment Promotion and FDI Inflows. Econ. J. 2011, 121, 1445–1476. [Google Scholar] [CrossRef]
- Heidenberger, K.; Stummer, C. Research and development project selection and resource allocation: A review of quantitative modelling approaches. Int. J. Manag. Rev. 1999, 1, 197–224. [Google Scholar] [CrossRef]
- Mackenzie, W.; Cusworth, N. The Use and Abuse of Feasibility Studies. In Proceedings of the Project Evaluation Conference 2007, Melbourne, Australia, 19–20 June 2007. [Google Scholar]
- Hodgson, G. Institutions and economic development: Constraining, enabling and reconstituting. In Reimagining Growth: Towards a Renewal of Development; De Paula, S., Dymski, G.A., Eds.; Zed Books: London, UK, 2005; pp. 88–95. ISBN 9781842775851. [Google Scholar]
- Kates, R.W.; Parris, T.M.; Leiserowitz, A.A. What Is Sustainable Development? Goals, Indicators, Values, and Practice. Environ. Sci. Policy Sustain. Dev. 2005, 47, 8–21. [Google Scholar] [CrossRef]
- UNCTAD. Indicators for Measuring and Maximizing Economics Value Added and Job Creation from Private Sector Investment in Value Chains; UNCTAD: Geneva, Switzerland, 2011. [Google Scholar]
- KPMG. The KPMG Survey of Corporate Responsibility Reporting 2013; KPMG: Amstelveen, The Netherland, 2013. [Google Scholar]
- Du Plessis, J.A.; Bam, W.G. Scoping phase comparison of development opportunities by making use of publicly available sustainability information. Procedia Manuf. 2017, 8, 207–214. [Google Scholar] [CrossRef]
- Elkington, J. Towards the Sustainable Corporation: Win-Win-Win Business Strategies for Sustainable Development. Calif. Manag. Rev. 1994, 36, 90–100. [Google Scholar] [CrossRef]
- Pope, J.; Bond, A.; Hugé, J.; Morrison-Saunders, A. Reconceptualising sustainability assessment. Environ. Impact Assess. Rev. 2017, 62, 205–215. [Google Scholar] [CrossRef]
- Bond, A.; Morrison-Saunders, A.; Pope, J. Sustainability Assessment: The State of the Art. Impact Assess. Proj. Apprais. 2012, 30, 53–62. [Google Scholar] [CrossRef]
- Gasparatos, A.; Scolobig, A. Choosing the most appropriate sustainability assessment tool. Ecol. Econ. 2012, 80, 1–7. [Google Scholar] [CrossRef]
- Loh, L.; Thomas, T.; Wang, Y. Sustainability reporting and firm value: Evidence from Singapore-Listed companies. Sustainability 2017, 9, 2112. [Google Scholar] [CrossRef]
- Gamerschlag, R.; Möller, K.; Verbeeten, F. Determinants of voluntary CSR disclosure: Empirical evidence from Germany. Rev. Manag. Sci. 2011, 5, 233–262. [Google Scholar] [CrossRef] [Green Version]
- Branco, M.C.; Rodrigues, L.L. Factors Influencing Social Responsibility Disclosure by Portuguese Companies. J. Bus. Ethics 2008, 83, 685–701. [Google Scholar] [CrossRef]
- Berthelot, S.; Coulmont, M.; Serret, V. Do Investors Value Sustainability Reports? A Canadian Study. Corp. Soc. Responsib. Environ. Manag. 2012, 19, 355–363. [Google Scholar] [CrossRef]
- Clarke, J.; Gibson-Sweet, M. The use of corporate social disclosures in the management of reputation and legitimacy: A cross sectoral analysis of UK Top 100 Companies. Bus. Ethics A Eur. Rev. 1999, 8, 5–13. [Google Scholar] [CrossRef]
- Reverte, C. Determinants of corporate social responsibility disclosure ratings by Spanish listed firms. J. Bus. Ethics 2009, 88, 351–366. [Google Scholar] [CrossRef]
- Dyduch, J.; Krasodomska, J. Determinants of Corporate Social Responsibility Disclosure: An Empirical Study of Polish Listed Companies. Sustainability 2017, 9, 1934. [Google Scholar] [CrossRef]
- Patten, D.M. Media exposure, public policy pressure, and environmental disclosure: An examination of the impact of tri data availability. Account. Forum 2002, 26, 152–171. [Google Scholar] [CrossRef]
- Gavana, G.; Gottardo, P.; Moisello, A. Sustainability Reporting in Family Firms: A Panel Data Analysis. Sustainability 2016, 9, 38. [Google Scholar] [CrossRef]
- Brammer, S.; Pavelin, S. Factors influencing the quality of corporate environmental disclosure. Bus. Strateg. Environ. 2008, 17, 120–136. [Google Scholar] [CrossRef]
- Ciegis, R.; Ramanauskiene, J.; Startiene, G. Theoretical reasoning of the use of indicators and indices for sustainable development assessment. Eng. Econ. 2009, 3, 33–40. [Google Scholar] [CrossRef]
- Parris, T.M.; Kates, R.W. Characterizing and Measuring Sustainable Development. Annu. Rev. Environ. Resour. 2003, 28, 559–586. [Google Scholar] [CrossRef]
- Singh, R.K.; Murty, H.R.; Gupta, S.K.; Dikshit, A.K. An overview of sustainability assessment methodologies. Ecol. Indic. 2009, 9, 189–212. [Google Scholar] [CrossRef]
- Waas, T.; Hugé, J.; Block, T.; Wright, T.; Benitez-Capistros, F.; Verbruggen, A. Sustainability Assessment and Indicators: Tools in a Decision-Making Strategy for Sustainable Development. Sustainability 2014, 6, 5512–5534. [Google Scholar] [CrossRef] [Green Version]
- Sikdar, S.K. On aggregating multiple indicators into a single metric for sustainability. Clean Technol. Environ. Policy 2009, 11, 157–161. [Google Scholar] [CrossRef]
- Brandi, H.S.; Daroda, R.J.; Olinto, A.C. The use of the Canberra metrics to aggregate metrics to sustainability. Clean Technol. Environ. Policy 2014, 16, 911–920. [Google Scholar] [CrossRef]
- Krajnc, D.; Glavič, P.A. Model for integrated assessment of sustainable development. Resour. Conserv. Recycl. 2005, 43, 189–208. [Google Scholar] [CrossRef]
- Sikdar, S.K.; Sengupta, D.; Harten, P. More on aggregating multiple indicators into a single index for sustainability analyses. Clean Technol. Environ. Policy 2012, 14, 765–773. [Google Scholar] [CrossRef]
- Zhou, L.; Tokos, H.; Krajnc, D.; Yang, Y. Sustainability performance evaluation in industry by composite sustainability index. Clean Technol. Environ. Policy 2012, 14, 789–803. [Google Scholar] [CrossRef]
- Azapagic, A.; Perdan, S. Indicators of sustainable development for industry: A general framework. Process Saf. Environ. Prot. 2000, 78, 243–261. [Google Scholar] [CrossRef]
- OECD, European Commission. Handbook on Constructing Composite Indicators: Methodoloy and User Guide; OECD Publishing: Paris, France, 2008. [Google Scholar]
- Chen, D.; Schudeleit, T.; Posselt, G.; Thiede, S. A state-of-the-art review and evaluation of tools for factory sustainability assessment. Procedia CIRP 2013, 9, 85–90. [Google Scholar] [CrossRef]
- Grunda, R.; Bartkus, E.V.; Raipa, A. Assessment of Models and Indicators of Private and Public Organization Sustainability. Public Policy Adm. 2011, 10, 565–576. [Google Scholar]
- Gonzalez, E.D.R.S.; Sarkis, J.; Huisingh, D.; Huatuco, L.H.; Maculan, N.; Montoya-Torres, J.R.; de Almeida, C.M.V.B. Making real progress toward more sustainable societies using decision support models and tools: Introduction to the special volume. J. Clean. Prod. 2015, 105, 1–13. [Google Scholar] [CrossRef]
- Madan, J.; Mani, M.; Lee, J.H.; Lyons, K.W. Energy performance evaluation and improvement of unit-manufacturing processes: Injection molding case study. J. Clean. Prod. 2015, 105, 157–170. [Google Scholar] [CrossRef]
- Zhu, Q.; Lujia, F.; Mayyas, A.; Omar, M.A.; Al-Hammadi, Y.; Al Saleh, S. Production energy optimization using low dynamic programming, a decision support tool for sustainable manufacturing. J. Clean. Prod. 2015, 105, 178–183. [Google Scholar] [CrossRef]
- Luo, J.; Huang, W.; Zhang, S. Energy cost optimal operation of belt conveyors using model predictive control methodology. J. Clean. Prod. 2015, 105, 196–205. [Google Scholar] [CrossRef]
- Yilmaz, O.; Anctil, A.; Karanfil, T. LCA as a decision support tool for evaluation of best available techniques (BATs) for cleaner production of iron casting. J. Clean. Prod. 2015, 105, 337–347. [Google Scholar] [CrossRef]
- Paraskevas, D.; Kellens, K.; Dewulf, W.; Duflou, J.R. Environmental modelling of aluminium recycling: A life cycle assessment tool for sustainable metal management. J. Clean. Prod. 2015, 105, 357–370. [Google Scholar] [CrossRef]
- Seddighi, A.H.; Ahmadi-Javid, A. A sustainable risk-averse approach to power generation planning with disruption risk and social responsibility considerations. J. Clean. Prod. 2015, 105, 116–133. [Google Scholar] [CrossRef]
- Jawad, H.; Jaber, M.Y.; Bonney, M. The economic order quantity model revisited: An extended exergy accounting approach. J. Clean. Prod. 2015, 105, 64–73. [Google Scholar] [CrossRef]
- Golinska, P.; Kosacka, M.; Mierzwiak, R.; Werner-Lewandowska, K. Grey decision making as a tool for the classification of the sustainability level of remanufacturing companies. J. Clean. Prod. 2015, 105, 28–40. [Google Scholar] [CrossRef]
- Moreira, N.; de Santa-Eulalia, L.A.; Aït-Kadi, D.; WoodeHarper, T.; Wang, Y. A conceptual framework to develop green textiles in the aeronautic completion industry: A case study in a large manufacturing company. J. Clean. Prod. 2015, 105, 371–388. [Google Scholar] [CrossRef]
- Fitzgerald, B.G.; O’Doherty, T.; Moles, R.; O’Regan, B. A quantitative method for the evaluation of policies to enhance urban sustainability. Ecol. Indic. 2012, 18, 371–378. [Google Scholar] [CrossRef]
- Greening, L.A.; Bernow, S. Design of coordinated energy and environmental policies: Use of multi-criteria decision-making. Energy Policy 2004, 32, 721–735. [Google Scholar] [CrossRef]
- Kouloumpis, V.; Kouikoglou, V.; Phillis, Y. Sustainability Assessment of Nations and Related Decision Making Using Fuzzy Logic. IEEE Syst. J. 2008, 2, 224–236. [Google Scholar] [CrossRef]
- United Nations Commission on Sustainable Development. Indicators of Sustainable Development: Guidelines & Methodologies, 3rd ed.; United Nations Commission on Sustainable Development: Geneva, Switzerland, 2007; Available online: https://sustainabledevelopment.un.org/content/documents/guidelines.pdf (accessed on 10 August 2016).
- Singh, R.K.; Murty, H.R.; Gupta, S.K.; Dikshit, A.K. Development of composite sustainability performance index for steel industry. Ecol. Indic. 2007, 7, 565–588. [Google Scholar] [CrossRef]
- Niemeijer, D. Developing indicators for environmental policy: Data-Driven and theory-driven approaches examined by example. Environ. Sci. Policy 2002, 5, 91–103. [Google Scholar] [CrossRef]
- Condamin, L.; Louisot, J.-P.; Naïm, P. Risk Quantification: Management, Diagnosis and Hedging; John Wiley & Sons: Chichester, UK, 2006. [Google Scholar]
- Mahamid, I. Risk matrix for factors affecting time delay in road construction projects: Owners’ perspective. Eng. Constr. Archit. Manag. 2011, 18, 609–617. [Google Scholar] [CrossRef]
- Ruge, B. Risk matrix as tool for risk assessment in the chemical process industries. In Probabilistic Safety Assessment and Management; Spitzer, C., Schmocker, U., Dang, V.N., Eds.; Springer: London, UK, 2004. [Google Scholar]
- Lozano, R. Envisioning sustainability three-dimensionally. J. Clean. Prod. 2008, 16, 1838–1846. [Google Scholar] [CrossRef]
- Munda, G.; Nardo, M. Noncompensatory/nonlinear composite indicators for ranking countries: A defensible settin. Appl. Econ. 2009, 14, 1513–1523. [Google Scholar] [CrossRef]
- Humphreys, D. New mercantilism: A perspective on how politics is shaping world metal supply. Resour. Policy 2013, 38, 341–349. [Google Scholar] [CrossRef]
- Bam, W.; De Bruyne, K. Location policy and downstream mineral processing: A research agenda. Extr. Ind. Soc. 2017, 4, 443–447. [Google Scholar] [CrossRef]
- Johnson Matthey. Market Data Tables: Platinum Supply and Demand; Johnson Matthey: London, UK, 2014. [Google Scholar]
- South African Chamber of Mines. Facts & Figures 2013/2014; South African Chamber of Mines: Johannesburg, South Africa, 2015. [Google Scholar]
- South African Department of Mineral Resources. A Beneficiation Strategy for the Minerals Industry of South Africa June 2011; South African Department of Mineral Resources: Pretoria, South Africa, 2011. [Google Scholar]
- Chapman and Hall/CRC. Handbook of Missing Data Methodology; CRC Press: Boca Raton, FL, USA, 2014; ISBN 9781439854617. [Google Scholar]
- Little, R.J.A.; Rubin, D.B. Statistical Analysis with Missing Data, 2nd ed.; John Wiley & Sons Inc.: Hoboken, NJ, USA, 2002; ISBN 0471183865. [Google Scholar]
- The European Parliament and the Council of the European Union. Directive 2014/95/EU of the European Parliament and of the Council of 22 October 2014 Amending Directive 2013/34/EU as Regards Disclosure of Non-Financial and Diversity Information by Certain Large Undertakings and Groups. Off. J. Eur. Union 2014, 57, 1–9. Available online: http://eur-lex.europa.eu/legal-content/EN/ALL/?uri=OJ:L:2014:330:TOC (accessed on 17 February 2018).
- South African Automotive Industry Export Council. Automotive Export Manual 2015; South African Automotive Industry Export Council: Pretoria, South Africa, 2015. [Google Scholar]
- Belcastro, E.L. Life Cycle Analysis of a Ceramic Three-Way Catalytic Converter. Ph.D. Thesis, Department of Materials Science and Engineering, Virginia Polytechnic Institute and State University, Blacksburg, VA, USA, 2012. [Google Scholar]
- Bedford, R.E.; Bonnier, G.; Maas, H.; Pavese, F. Techniques for Approximating the International Temperature Scale of 1990; Suppl. Inf. ITS-90; Bureau international des Poids et Mesures: Saint-Cloud, France, 1997; p. 205. [Google Scholar]
- Johnson Matthey. Platinum 2006 Special Feature: Other Applications for Platinum; Johnson Matthey: London, UK, 2006. [Google Scholar]
- Johnson Matthey. Platinum 2011 Special Feature: PGM in Glass Manufacturing; Johnson Matthey: London, UK, 2011. [Google Scholar]
- Johnson Matthey about PGM: Applications. Available online: http://www.platinum.matthey.com/about-pgm/applications (accessed on 2 June 2015).
- Stokes, J. Platinum in the glass industry. Platin. Met. Rev. 1987, 31, 54–62. [Google Scholar]
- United States Geological Survey. Platinum-Group Metals—World Supply and Demand; United States Geological Survey: Reston, VA, USA, 2004. [Google Scholar]
- Crundwell, F.K.; Moats, M.; Ramachandran, V.; Robinson, T.; Davenport, W.G. Extractive Metallurgy of Nickel, Cobalt and Platinum-Group Materials, 1st ed.; Elsevier: Oxford, UK, 2011; ISBN 9780080968094. [Google Scholar]
- Dorfling, C. Characterisation and dynamic modelling of the behaviour of platinum group metals in high pressure sulphuric acid/oxygen leaching systems. Ph.D. Thesis, Department of Extractive Metallurgical Engineering, Stellenbosch University, Stellenbosch, South Africa, 2012. [Google Scholar]
- Jones, R.T. An overview of Southern African PGM smelting. In Nickel and Cobalt 2005: Challenges in Extraction and Production, Proceedings of the 44th Annual Conference of Metallurgists, Calgary, AB, Canada, 21–24 August 2005; Canadian Institute of Mining, Metallurgy and Petroleum: Montreal, QC, Canada, 2005; pp. 147–178. [Google Scholar]
- Labuschagne, C.; Brent, A.C.; Van Erck, R.P.G. Assessing the sustainability performances of industries. J. Clean. Prod. 2005, 13, 373–385. [Google Scholar] [CrossRef]
- Chee Tahir, A.; Darton, R.C. The Process Analysis Method of selecting indicators to quantify the sustainability performance of a business operation. J. Clean. Prod. 2010, 18, 1598–1607. [Google Scholar] [CrossRef]
- Krajnc, D.; Glavic, P. Indicators of sustainable production. Clean Technol. Environ. Policy 2003, 5, 279–288. [Google Scholar] [CrossRef]
- Liberatore, M.J.; Nydick, R.L.; Sanchez, P.M. The Evaluation of Research Papers (Or How to Get an Academic Committee to Agree on Something). Interfaces 1992, 22, 92–100. [Google Scholar] [CrossRef]
- Long, Y.; Pan, J.; Farooq, S.; Boer, H. A sustainability assessment system for Chinese iron and steel firms. J. Clean. Prod. 2016, 125, 133–144. [Google Scholar] [CrossRef]
- Salvado, M.; Azevedo, S.; Matias, J.; Ferreira, L. Proposal of a Sustainability Index for the Automotive Industry. Sustainability 2015, 7, 2113–2144. [Google Scholar] [CrossRef]
- Ghadimi, P.; Azadnia, A.H.; Yusof, N.M.; Saman, M.Z.M. A weighted fuzzy approach for product sustainability assessment: A case study in automotive industry. J. Clean. Prod. 2012, 33, 10–21. [Google Scholar] [CrossRef]
- Winroth, M.; Alstrom, P.; Andersson, C. Sustainable production indicators at factory level. J. Manuf. Technol. Manag. 2016, 27, 842–873. [Google Scholar] [CrossRef]
- Garbie, I.H. An analytical technique to model and assess sustainable development index in manufacturing enterprises. Int. J. Prod. Res. 2014, 52, 4876–4915. [Google Scholar] [CrossRef]
- Vinodh, S.; Jayakrishna, K.; Kumar, V.; Dutta, R. Development of decision support system for sustainability evaluation: A case study. Clean Technol. Environ. Policy 2014, 16, 163–174. [Google Scholar] [CrossRef]
- Lodhia, S.; Martin, N. Corporate Sustainability Indicators: An Australian Mining Case Study. J. Clean. Prod. 2014, 84, 107–115. [Google Scholar] [CrossRef]
- Geist, M.R. Using the Delphi method to engage stakeholders: A comparison of two studies. Eval. Program Plan. 2010, 33, 147–154. [Google Scholar] [CrossRef] [PubMed]
- Flick, U. Introduction to Qualitative Research, 4th ed.; SAGE Publications: London, UK, 2009. [Google Scholar]


© 2018 by the authors. Licensee MDPI, Basel, Switzerland. This article is an open access article distributed under the terms and conditions of the Creative Commons Attribution (CC BY) license (http://creativecommons.org/licenses/by/4.0/).
Share and Cite
Du Plessis, J.; Bam, W. Comparing the Sustainable Development Potential of Industries: A Role for Sustainability Disclosures? Sustainability 2018, 10, 878. https://doi.org/10.3390/su10030878
Du Plessis J, Bam W. Comparing the Sustainable Development Potential of Industries: A Role for Sustainability Disclosures? Sustainability. 2018; 10(3):878. https://doi.org/10.3390/su10030878
Chicago/Turabian StyleDu Plessis, Johan, and Wouter Bam. 2018. "Comparing the Sustainable Development Potential of Industries: A Role for Sustainability Disclosures?" Sustainability 10, no. 3: 878. https://doi.org/10.3390/su10030878