Article

The Structure and Diversity of Bacterial Communities in Differently Managed Soils Studied by Molecular Fingerprinting Methods

1
National Agricultural and Food Centre—Research Institute of Plant Production, Bratislavská cesta 122, 921 68 Piešťany, Slovakia
2
Faculty of Natural Sciences, University of Ss. Cyril and Methodius, Námestie J. Herdu 2, 917 01 Trnava, Slovakia
3
Department of Analytical Chemistry, Faculty of Natural Sciences, Comenius University in Bratislava, Mlynská dolina, Ilkovičova 6, 842 15 Bratislava 4, Slovakia
4
Hermes LabSystems, s. r. o., Púchovská 12, 831 06 Bratislava, Slovakia
*
Author to whom correspondence should be addressed.
Sustainability 2018, 10(4), 1095; https://doi.org/10.3390/su10041095
Submission received: 27 February 2018 / Revised: 29 March 2018 / Accepted: 3 April 2018 / Published: 5 April 2018
(This article belongs to the Section Environmental Sustainability and Applications)

Abstract

:
The soil bacterial community structure is sensitive to different agricultural management practices and changes in the soil community composition can affect ecosystem sustainability and ecosystem stability. The basic idea of reduced and conservation soil tillage technologies is to preserve favorable soil parameters and also to enhance soil fertility and to reduce the negative impacts on the soil. Four soil tillage treatments—conventional, reduced, mulch-till, and no-till—were studied for their bacterial communities at a soil depth of 10 cm in September 2013 and April 2014 using the automated ribosomal intergenic spacer analysis (ARISA) and the terminal restriction fragment length polymorphism (T-RFLP) methods. The total microbial biomass was statistically higher in April 2014 than in September 2013 in all tillage treatments. On the other hand, no statistical differences were detected in the bacterial richness between the sampling dates in all tillage treatments. Only one statistical difference regarding the bacterial richness was detected between the conventional and reduced tillage in September 2013 by using ARISA. Bacterial genetic diversity measured by the Gini–Simpson, Shannon, and Pielou indices did not indicate differences among the four types of soil management systems. Additionally, no substantial variation in the composition of bacterial communities under different treatments was observed based on the principal component analysis and cluster analysis. Additionally, the changes in bacterial community composition between both sampling dates have not occurred overall or within the individual agricultural management systems.

1. Introduction

The soil microorganisms play a key role in various biogeochemical cycles, the formation of soil structure, the decomposition of soil organic matter, and the recycling of nutrients [1,2] and thus, they contribute to the functioning of the ecosystem. Another function of soil microorganisms is to suppress soil-borne plant diseases and promote plant growth [2,3]. However, they are also sensitive to environmental variation and changes, therefore, it can be used as indicators for soil health [4]. Generally, the composition and dynamics of soil microbial populations vary due to changes in the composition and properties of soil, influenced by environmental factors such as soil temperature, water availability, aeration, nutrient supply, and others [5]. Additionally, soil tillage practices influence the physical, chemical, and biological properties of soil and affect the composition of the soil microbial community [6,7]. Tillage management affects the soil water content, aeration, as well as the microclimate near the soil surface, and therefore, regulates the soil biota and biological processes [8]. Conventional tillage is characterized by loosening and deep plowing (0.2–0.35 m) performed annually [9]. The top layer of soil is disturbed and turned by moldboard plow and between the plowing and the seedbed creation is a time-lag. The main goal is to control weeds and the additional soil compaction during winter. Plant residues cover 0–30% of the soil surface [9,10]. The reduced tillage is based on the reduction of tillage intensity [11]. Tillage operations are combined into a few actions, for example, the preparation of the seedbed by drilling while fertilizers or pesticides are usually applied by the multifunctional machinery during drilling. The soil disturbance is shallow to a depth of 0.15 m and the plant residues cover about 15–30% of the soil surface. The mulch-tillage undercuts the topsoil layer with stubble and it is lifted before sowing [12]. The depth of this tillage is about 0.15 m. Plant residues and stubbles remain on the soil surface, 30–50% of the soil surface is covered by plant residues [13]. No-tillage does not manipulate with soil before the sowing time and during the vegetation period [12]. Seeds are sown by special seeders able to sow into the undisturbed soil. If possible, plant litter is incorporated into the soil. Weeds are destroyed chemically. More than 30% of the soil surface is covered by plant residues [10].
The soil conservation tillage system leaves a high amount of plant residues on the soil surface (more than 30%), therefore, it maintains moisture and improves the structure and aggregation of the soil in comparison to conventional tillage systems [14,15]. The type of plant residues affect microbial biomass; micro-, meso- and macro-fauna; and regulate the microbial mineralization and immobilization rates controlling the loss of carbon and nitrogen from soil [16,17]. Similarly, plant residues on the soil surface or incorporated plant residues into the soil differentially stimulate microbial activity and microbial biomass [18]. On the contrary, an intensive plowing typical for conventional systems simplify the structure of the microbial community [8]. Additionally, intensive mechanization applied to soils that are subject to frequent rain or irrigation causes soil compaction which subsequently affects specific microbial activities [8]. Moreover, the pore sizes and their shift in relative abundance induced by the soil compaction affects the abundance and the survival of bacterial communities [19].
The aim of the present study was to examine the effect of different agricultural practices on the soil bacterial community structure in a moderate, continental region. The study was conducted in southwestern Slovakia, an important growing region for corn and barley. A temporal sampling (autumn 2013 and spring 2014) and two molecular fingerprinting methods (automated ribosomal intergenic spacer analysis and terminal-restriction fragment length polymorphism) were used to monitor changes in the soil bacterial community in relation to conventional, reduced, mulch-till, and no-tillage treatments. We hypothesized that the soil bacterial characteristics would be sensitive to (i) differences in these agricultural practices and (ii) different sampling dates.

2. Materials and Methods

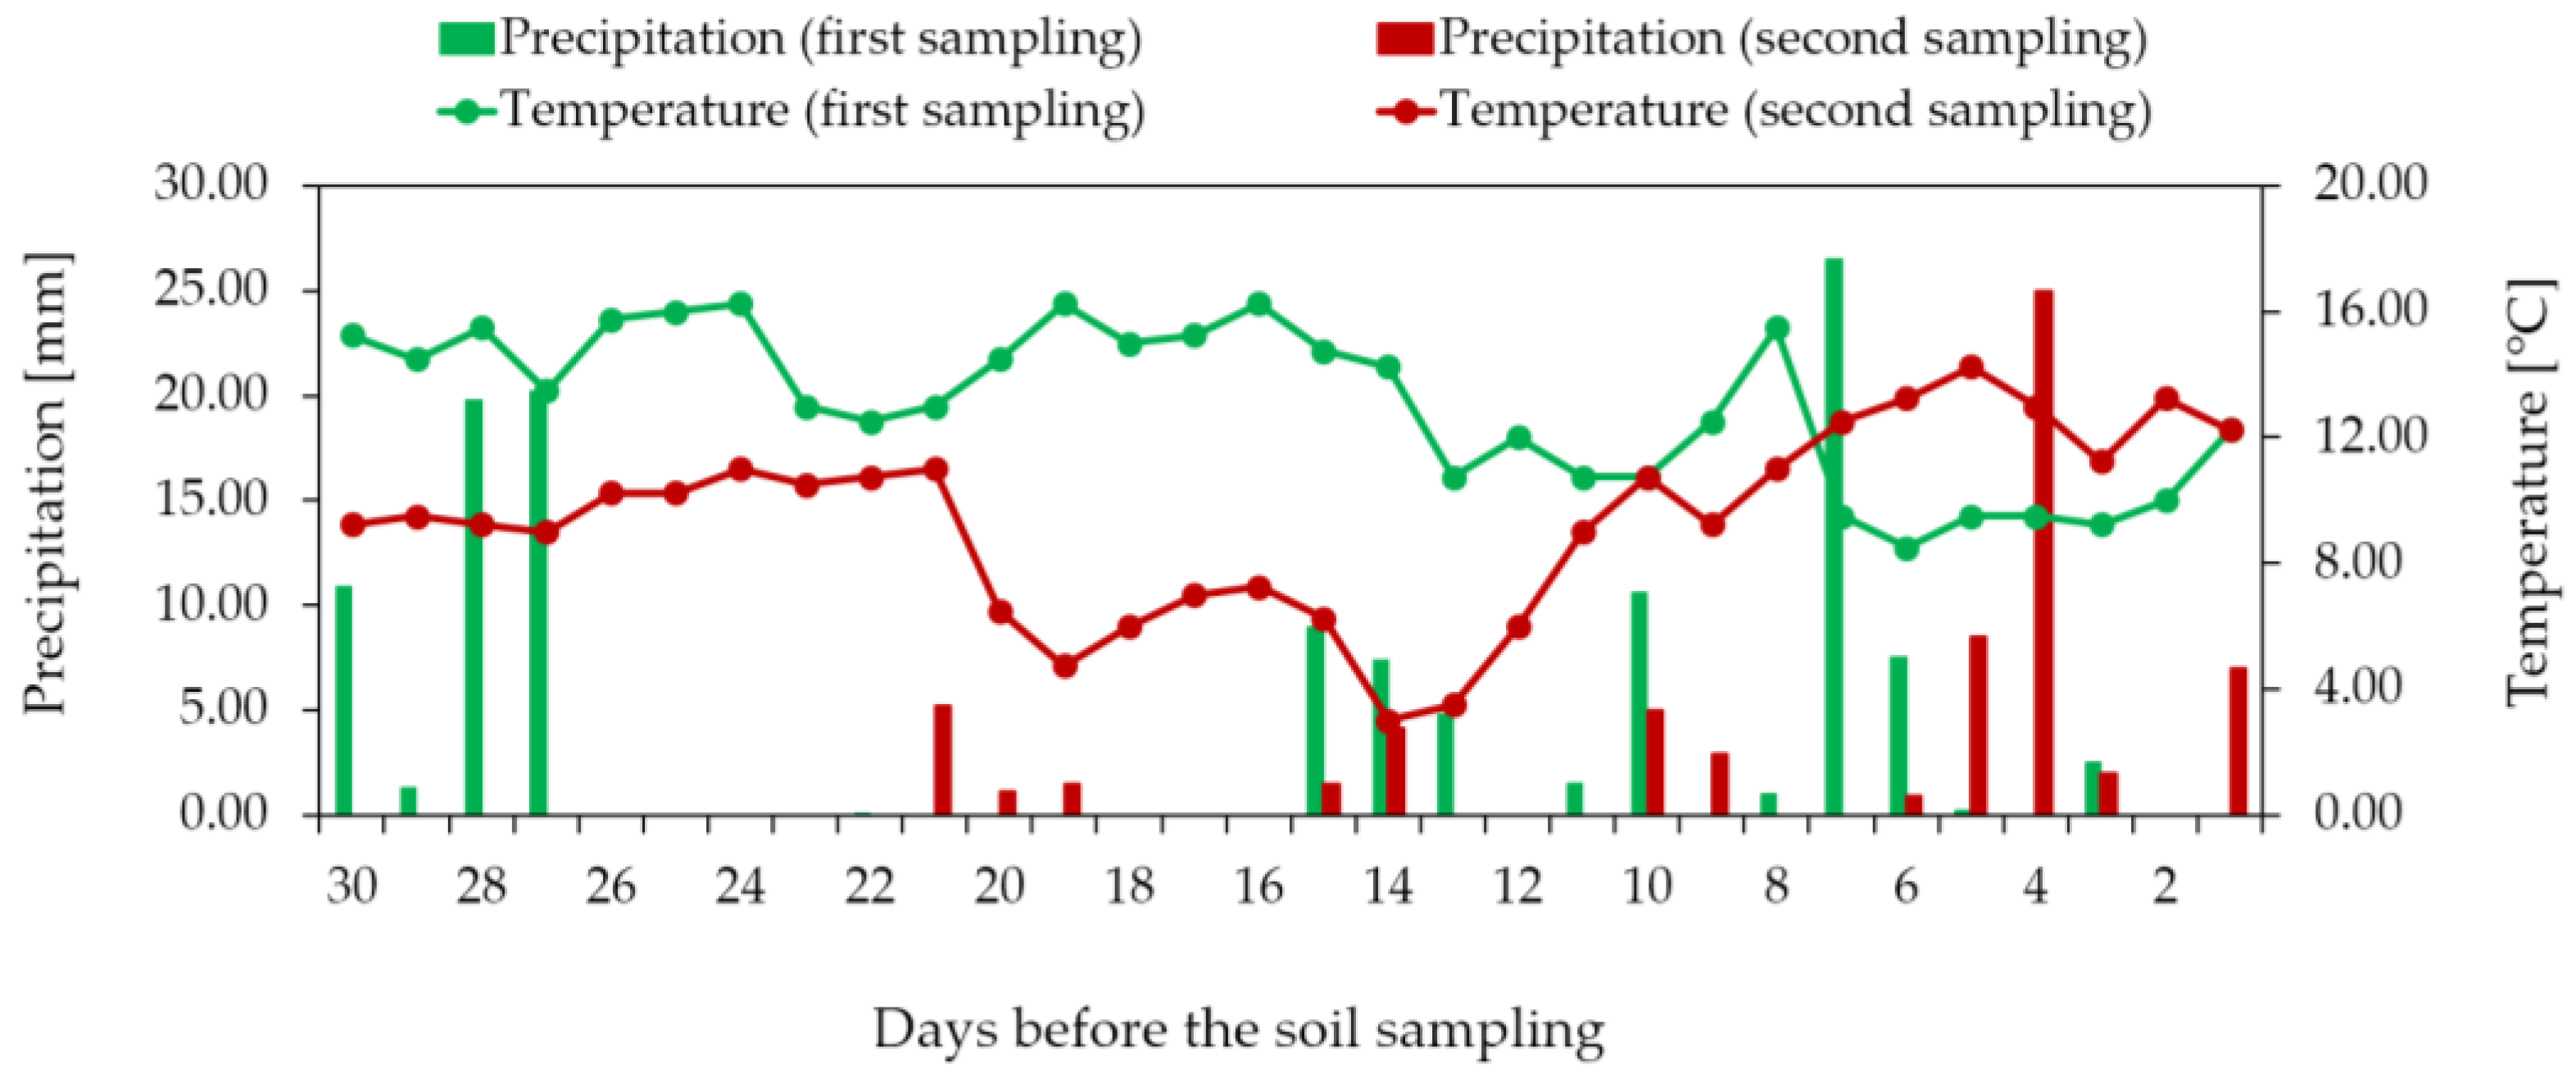
2.1. Experimental Site and Study Design

Field experiments established in 2001 were performed in the Borovce Experimental station of the Research Institute of Plant Production, Slovakia. Field plots were located at an altitude of 167 m above sea level with a continental climate. The average annual precipitation was 625 mm (358 mm during the vegetation season) and the long-term average annual temperature of 9.2 °C (15.5 °C during the vegetation season). The soil was a Luvic Haplic Chernozem on loess with a humus horizon depth of 0.4–0.5 m with an average supply of phosphorus and potassium, a neutral to slightly acidic soil reaction, a medium content of humus in the mold profile, and low contents under the mold horizons. The mean agrochemical soil properties in the experimental locality: soil pH/KCl 6.67; soil content of C 1.2539%, N 0.112%, P 80.16 mg kg−1, K 194.82 mg kg−1, Mg 260.29 mg kg−1, Ca 4547.17 mg kg−1, humus 2.178% [20]. Four tillage managements were compared: conventional, reduced, mulch-till, and no-till. The tillage depth in the conventional tillage was 0.24 m, it was 0.15 m in the reduced and mulch tills. The crop rotation reflected the current proportions of crops in Slovakia (more than 50% of cereals) and consists of Triticum aestivum L. (winter wheat; cultivar Viglanka), Zea mays L. (corn; hybrid DKC-4590), Hordeum vulgare L. (spring barley; cultivar Karmel), and Glycine max (L.) Merr. (soybean; cultivar Bohemians). The crops were fertilized as follows: (i) 163 kg ha−1 N, 34 kg ha−1 P, and 105 kg ha−1 K for winter wheat; (ii) 189 kg ha−1 N, 44 kg ha−1 P, and 146 kg ha−1 K for corn; (iii) 120 kg ha−1 N, 30 kg ha−1 P, and 80 kg ha−1 K for spring barley; (iv) 50 kg ha−1 N, 27 kg ha−1 P, and 67 kg ha−1 K for soybean. The fertilizers used for nitrogen fertilization were Spring-LAV (27.5% N content), DAM-390; Hyperkorn (26% P2O5 content) for phosphorus; and Potassium salt (60% K2O content) for potassium. The crop yield for winter wheat was 6 t ha−1, 7 t ha−1 for corn, 5 t ha−1 for spring barley, and 2 t ha−1 for soybean.
Soil samples at a 10-cm depth were collected on two dates: in autumn (23 September 2013) and in spring (28 April 2014). The weather conditions 30 days before both sampling dates were similar (Figure 1). The samples were collected from plots with spring barley but with different soil tillage managements: conventional (Conv), reduced (Red), mulch-till (Mulch), and no-till (No-till). The harvested area of an experimental plot for one crop and one tillage was 9 m × 35 m. The lawn was sown among these plots (Figure 2). The mean physicochemical parameters of soil at these sampling dates in conventional, reduced, mulch till and no-till are listed in Table 1 [20].
Each type of tillage was arranged in 3 replications with 9 m × 35 m plots. The soil samples were collected from two sites within one plot of spring barley and each pair of samples were pooled in 50 mL sterile centrifuge tubes (Figure 2). Subsequently, the samples were transported to a laboratory and DNA isolation was immediately performed (approximately 2 h after sampling in the field).

2.2. Total DNA Extraction

The community DNA was extracted from 0.25 g of soil samples using the PowerSoilTM DNA Isolation kit (MoBio Laboratories Inc., Carlsbad, CA, USA) according to the manufacturer’s protocol with one exception: 50 µL of nuclease-free water (instead of 100 µL) was used for DNA elution from the silica membrane. The quantity and purity of DNA were measured spectrophotometrically (NanoDrop-1000 Spectrophotometer, Thermo Scientific Inc., Wilmington, DE, USA) and the samples were diluted to the same final concentration (25 ng µL−1) and stored at −20 °C. All DNAs were isolated after sampling but the subsequent ARISA and T-RFLP analyses were conducted with all samples at once.

2.3. Automated Ribosomal Intergenic Spacer Analysis (ARISA)

The ITSF/ITSReub primer set [21] with 6-FAM fluorescent dye on the 5′-end of the reverse primer was used for the amplification of the 16S–23S rRNA intergenic transcribed spacer region from the bacterial rRNA operon. DNA amplification was carried out in a 50 µL reaction mixture containing the FailSafeTM PCR PreMix Selection kit (Epicentre Technologies Corp., Madison, WI, USA), 0.10 µM of both primers, 1.25 U of the FailSafe PCR Enzyme, and 1 µL (25 ng) of DNA extracted from soil using the GeneAmp PCR System 9700 (Applied Biosystems, Thermo Fisher Scientific Inc., Wilmington, DE, USA). The PCR conditions were: an initial denaturation at 94 °C for 3 min, followed by 35 cycles each consisting of the denaturation step at 94 °C for 45 s, annealing at 60 °C for 1 min with an extension at 72 °C for 2 min, and a final extension step at 72 °C for 7 min. PCR amplification was controlled electrophoretically in 1% (w/v) agarose in 1 × TBE buffer (1.1% (w/v) Tris-HCl; 0.1% (w/v) Na2EDTA 2H2O; 0.55% (w/v) boric acid) pre-stained with 0.10 µL mL−1 of ethidium bromide. The PCR products were purified by the PCR Purification and Agarose Gel Extraction Combo kit (Thermo Fisher Scientific Inc., Wilmington, DE, USA) and dissolved in sterile water. One microliter of purified products was mixed with 9 µL of formamide containing LIZ 1200 size standard (Applied Biosystems, Thermo Fisher Scientific Inc., Wilmington, DE, USA), denatured at 95 °C for 3 min and separated by capillary electrophoresis using the ABI 3100 Prism Avant (Applied Biosystems, Thermo Fisher Scientific Inc., Wilmington, DE, USA). Electropherograms were analyzed by the Peak Scanner 2 (Applied Biosystems, Thermo Fisher Scientific Inc., Wilmington, DE, USA) and the only operational taxonomic units (OTUs) were fragments in the range 200–930 bp with a minimum peak height threshold of 50 fluorescence units used for evaluation.

2.4. Terminal-Restriction Fragment Length Polymorphism (T-RFLP)

The partial 16S rRNA gene sequences were amplified using the eubacterial universal primers 8F [22] and 926R [23]. The forward primer 8F was labeled at the 5′-end with 6-FAM fluorescent dye. The final volume and composition of the PCR mixtures were identical to the ARISA method mentioned above. The PCR conditions were as follows: an initial denaturation at 95 °C for 2 min, 35 cycles of denaturation at 94 °C for 30 s, annealing at 47 °C for 30 s, elongation at 72 °C for 1 min, and a final elongation at 72 °C for 10 min (GeneAmp PCR System 9700, Applied Biosystems, Thermo Fisher Scientific Inc., Wilmington, DE, USA). The PCR products were purified by commercial purification kit mentioned above and dissolved in sterile water. The purified PCR products were digested with a MspI restriction enzyme (Promega Corp, Madison, WI, USA) in 20 μL of digestion mixture contained 10 U of the restriction enzyme, 1 × buffer B, 0.1 mg mL−1 of Bovine serum albumin, and 10 μL of purified PCR products. The mixture was incubated for 3 h at 37 °C and then purified using a purification kit and dissolved in sterile water. The mixture composition for capillary electrophoresis was the same as for the ARISA method with LIZ 1200 internal standard (Applied Biosystems, Thermo Fisher Scientific Inc., Wilmington, DE, USA). Terminal-restriction fragments (T-RFs) were separated in the ABI 3100 Prism Avant Apparatus (Applied Biosystems, Thermo Fisher Scientific Inc., Wilmington, DE, USA). The resulted electropherograms were analyzed by the Peak Scanner 2 (Applied Biosystems, Thermo Fisher Scientific Inc., Wilmington, DE, USA) and terminal restriction fragments (T-RFs) in a range of 60–930 bp were used for evaluation. Only peaks above the threshold of 50 fluorescence units were considered.

2.5. Statistical Analyses

Statistical significant differences among samples were tested using the Analysis of Variance (ANOVA) and subsequently by using the “post-hoc” pairwise comparisons based on the Fisher’s least significant difference (LSD) procedure at the 95.0% confidence level. The bacterial community similarity from the four tillage managements was compared between the ARISA and T-RFLP profiles using the height of fluorescence in individual OTUs/T-RFs. These data were subsequently used for the principal component analysis (PCA) using the scores of the first two principal components and for the cluster analysis to create dendrograms using Ward’s clustering and Euclidean distance measurements. The PCA, cluster analysis, ANOVA, and LSD were performed using the software Statgraphics x64 (Statpoint Technologies, Inc., Warrenton, VA, USA). The Venn diagrams were constructed using the Venny 2.1 online program [24]. Permutational multivariate analysis of variance (PERMANOVA) was used to determine if significant effects occurred among the four tillage treatments (One-way PERMANOVA) and between the tillage treatments and time (Two-way PERMANOVA) and to determine if there was an interaction between the treatment and time with Euclidean distance measurements using the PAST (PAleontological STatistics) software version 3.19 [25]. Diversity indices were calculated from standardized profiles of individual soil samples using the number and height of peaks in each profile as representations of the number and relative abundance of the phylotypes. The Gini–Simpson index [26] was calculated as follows:
1   λ   =   (   p i 2 )
where λ is the Simpson diversity index and p is the proportion of an individual peak height relative to the sum of all peak heights. The Shannon’s diversity index [27] was calculated as follows:
H =     ( p i ) ( ln p i )
and this index is commonly used to characterize species diversity in a community. The Pielou evenness index [28] was derived from Shannon’s diversity index and was calculated as follows:
J = H / H m a x
where H m a x = ln ( S ) and S represents the total number of species.

3. Results

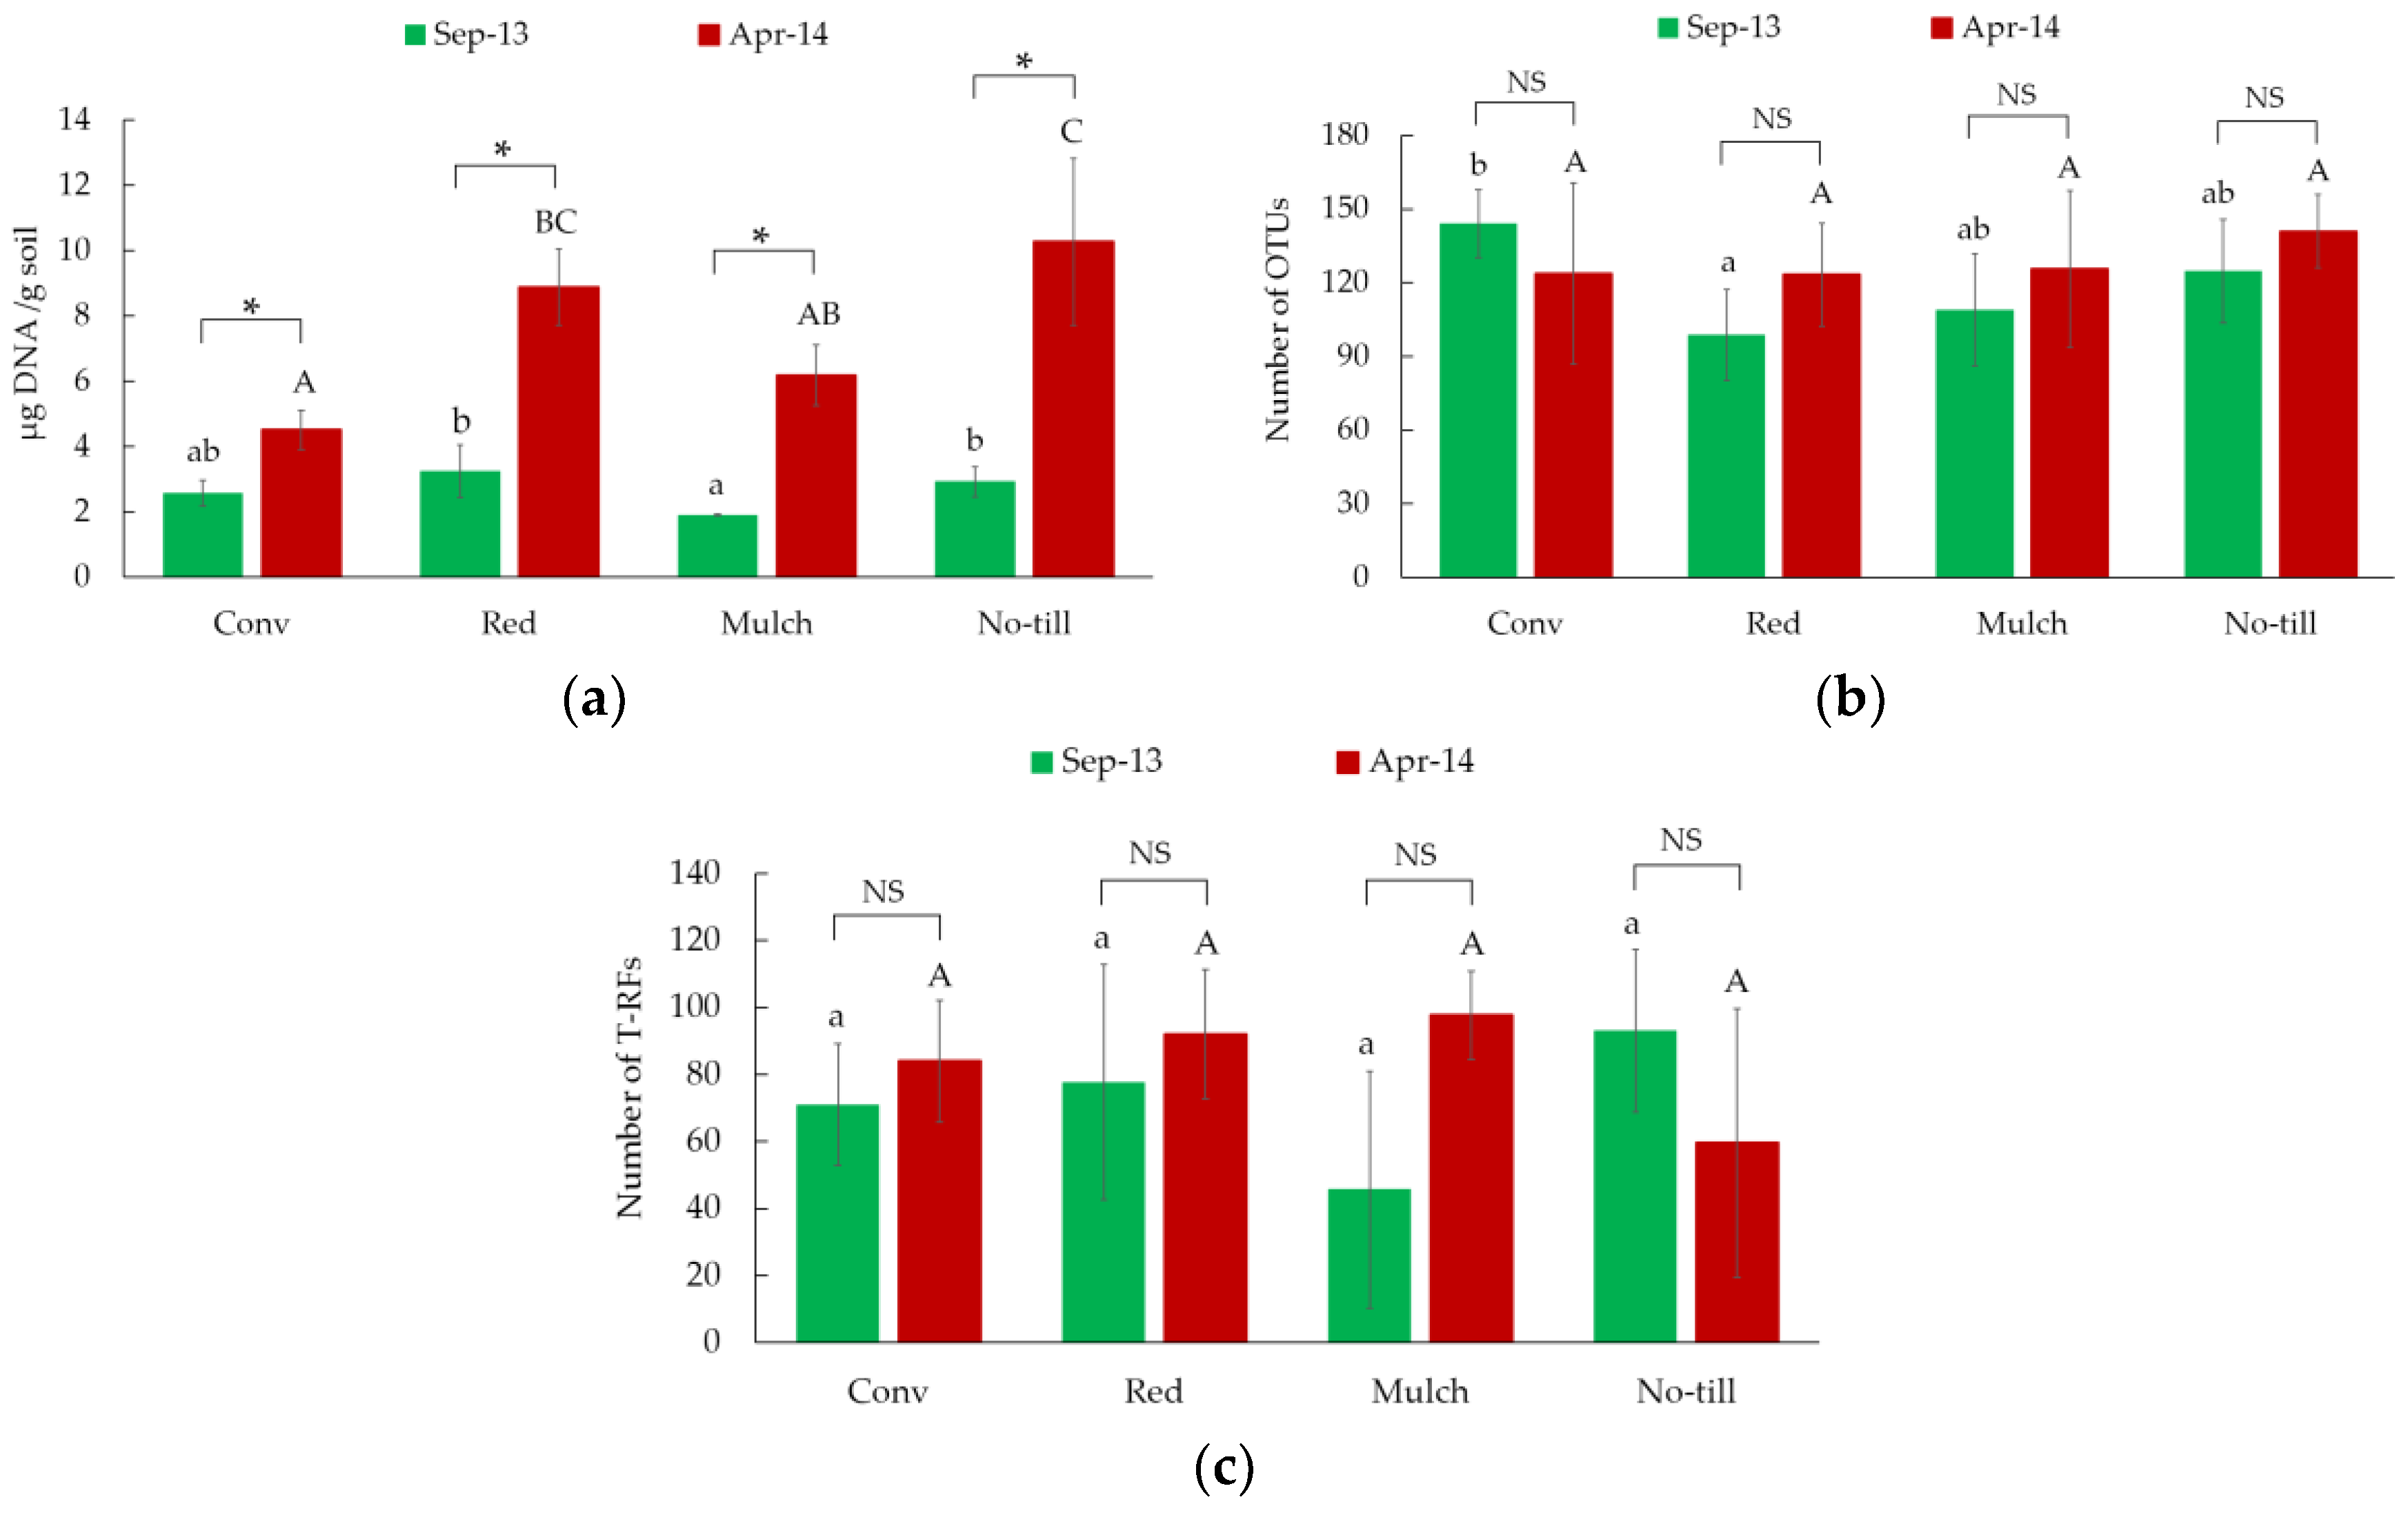
3.1. Total Microbial Biomass and Bacterial Richness

The differences between the soil microbial communities from the four tillage management systems (conventional, reduced, mulch-till, no-till) were evaluated first as the total soil microbial biomass represented by the quantity of extracted metagenomic DNA from soil samples. This parameter was statistically significantly higher in all soil samples collected in spring (April) than in autumn (September). There were also significant differences in the quantity of soil metagenomic DNA among the individual tillage management systems. The highest quantity was in soil collected in the no-till system in April (Figure 3a).
Other parameters for the assessment of soil bacterial diversity were the total number of different operational taxonomic units (OTUs) and the terminal restriction fragments (T-RFs), respectively. Altogether, 494 OTUs were detected, 400 of them in September and 421 in April, respectively. More OTUs in September than in April were detected only in samples from conventional tillage. On the contrary, the number of OTUs was higher in April in the other three tillage management systems (Figure 3b). Nevertheless, the statistical differences (LSD, α = 0.05) either between the sampling time or between the tillage management systems in April were not confirmed. The T-RFLP analysis generated from 7 to 115 T-RFs in the individual bacterial community profiles. Totally, 280 different T-RFs were obtained using the MspI restriction enzyme, 206 of them were detected in September and 250 in April. The most T-RFs were identified in the soil sampled in April in the mulch-till management system, but at the same time, the minimal number of samples collected in September was also from this management system. Statistically significant differences (LSD, α = 0.05) neither between the sampling time nor between the soil management systems were detected (Figure 3c).
The Venn diagrams show that the OTUs/T-RFs that occurred in all four tillage treatments were represented in 33.2% of both methods. No-till in ARISA and reduced tillage treatment in T-RFLP had the most unique OTUs/T-RFs (Figure 4).

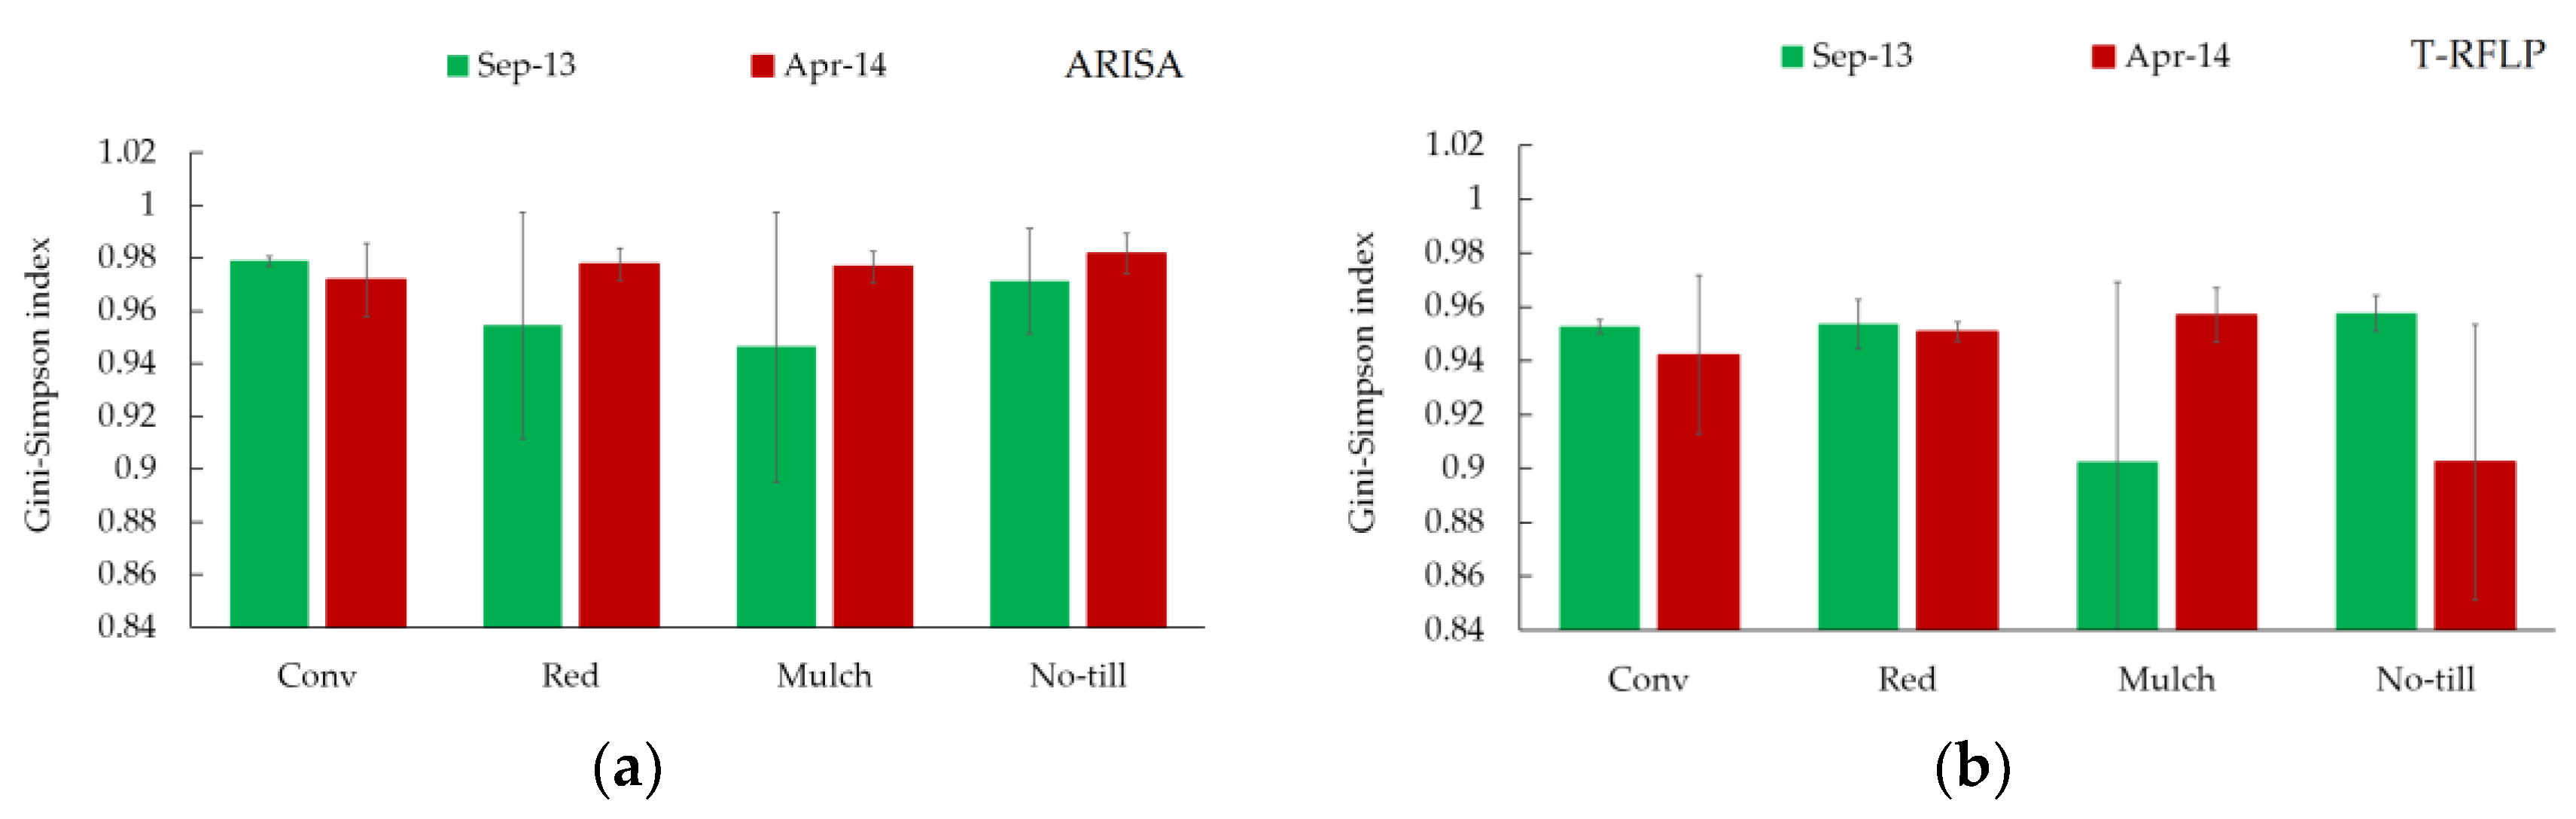
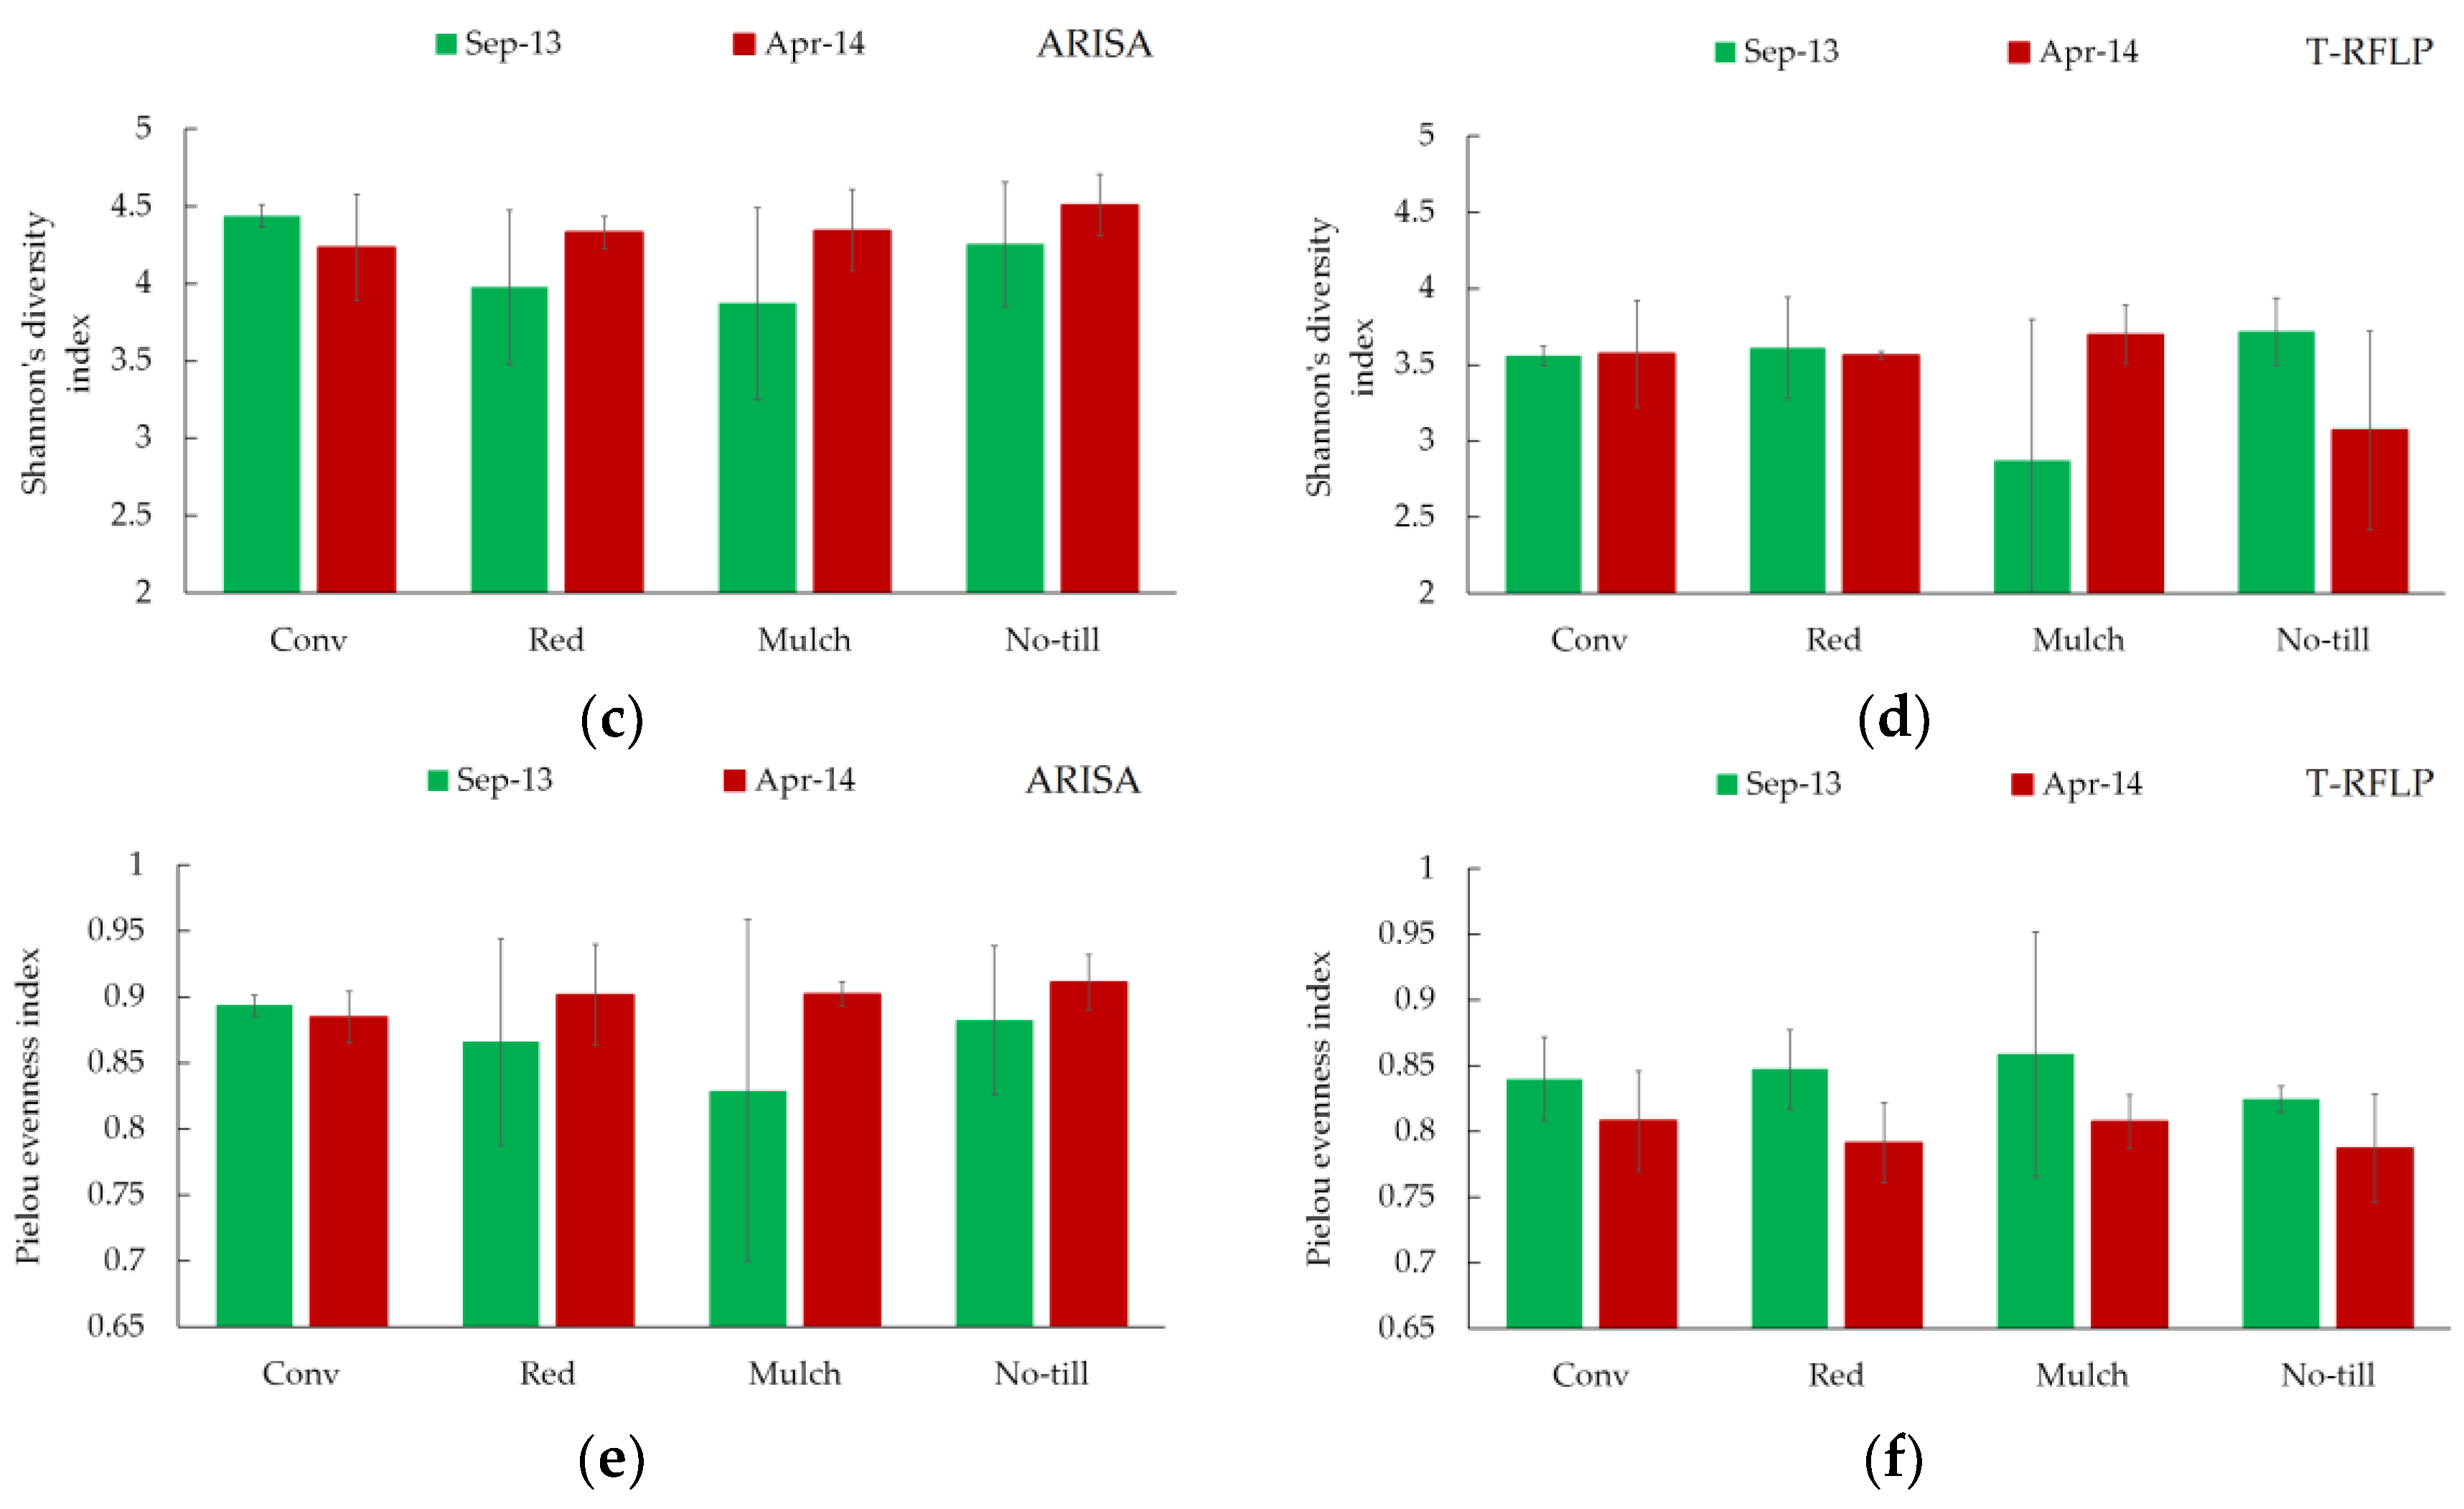
3.2. Bacterial Genetic Diversity

The Gini-Simpson index and Shannon’s diversity index generated by the ARISA analysis revealed the lower differences between the tillage management systems in April than in September. Genetic diversity of bacterial communities collected in April from all four tillage management systems was more or less similar, however, the highest was in a sample from the no-till system. Higher differences were within the tillage systems in September where the highest genetic diversity was in samples from conventional tillage system and the lowest in the mulch-till system (Figure 5a,c). The same trends in April and September were also detected for evenness of bacterial populations between all four management systems (Figure 5e). However, ANOVA calculated from the diversity and evenness indices, separately for both sampling times, have not shown statistically significant differences (α = 0.05) among the different soil tillage management systems.
Both diversity indices (Gini–Simpson and Shannon’s) and the Pielou evenness index calculated from the T-RFLP data had a slightly different course. The highest genetic diversity and evenness in April were in the bacterial communities from the mulch-till system, and from the no-till system (both genetic diversity indices) and the mulch-till system (evenness) in September (Figure 5b,d,f). However, even here the ANOVA did not show statistically significant differences (α = 0.05) among the different soil tillage managements and between the sampling times.

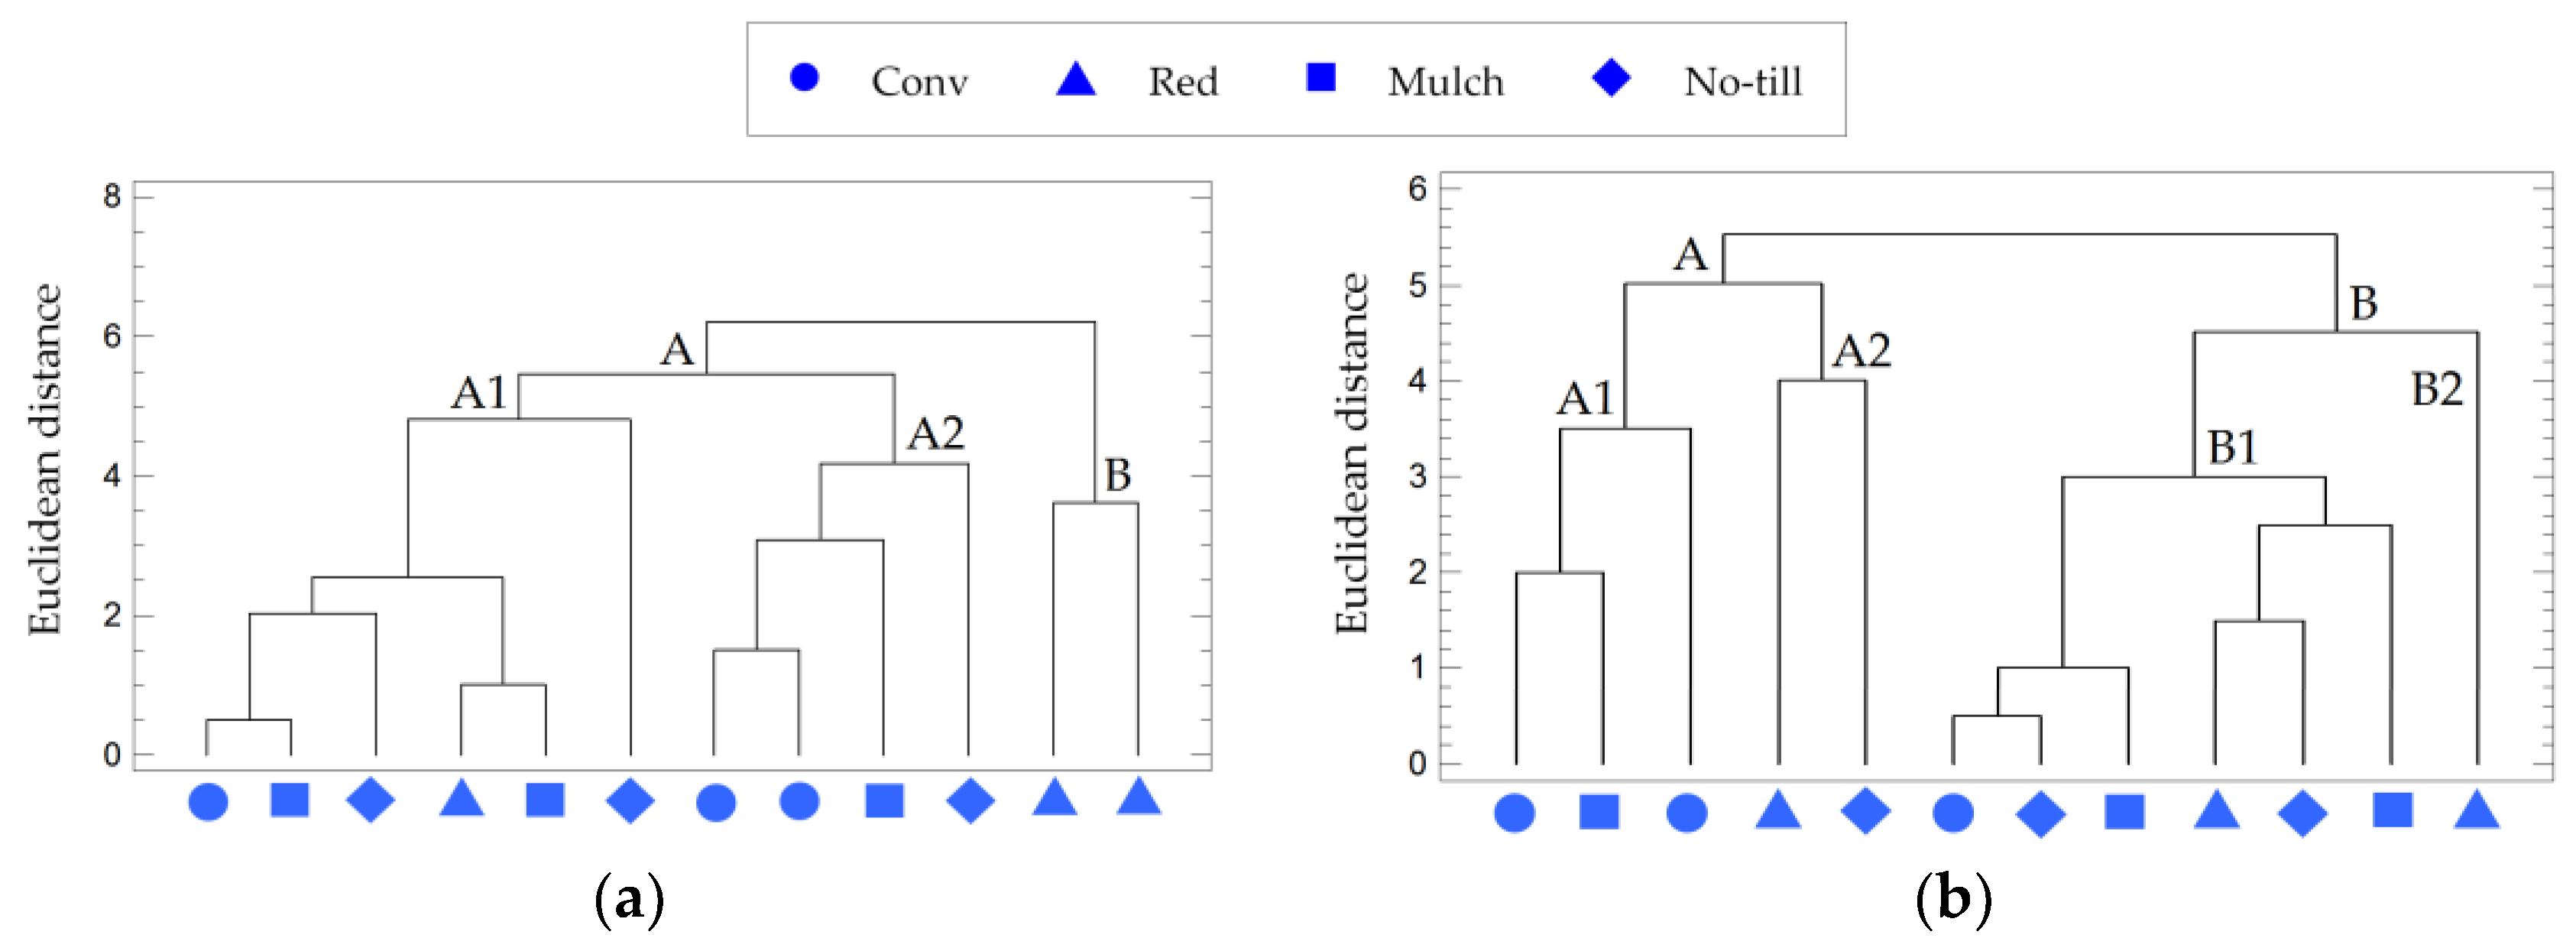
3.3. The Impact of Tillage on Soil Bacterial Communities

Generally, the PCA analysis did not differentiate soil bacterial communities into separate groups according to the soil tillage management systems either analyzed by ARISA, or by T-RFLP. The ARISA method revealed higher variation among the soil bacterial communities than T-RFLP (Figure 6). Additionally, using One-way PERMANOVA, significant differences between the tillage treatments were not detected (p = 0.1928 for ARISA and p = 0.8182 for T-RFLP).
Cluster analysis divided the samples into two main clusters A and B (Figure 7). In the dendrogram, which was created from ARISA data, the B cluster is composed of only 2 samples from reduced tillage (Figure 7a). On the other hand, the structure of the A1 cluster from ARISA and the B1 cluster from T-RFLP were formed with the same samples with an approximately identical position. Overall, the composition of soil bacterial communities was not grouped according to the type of soil cultivation in both dendrograms.

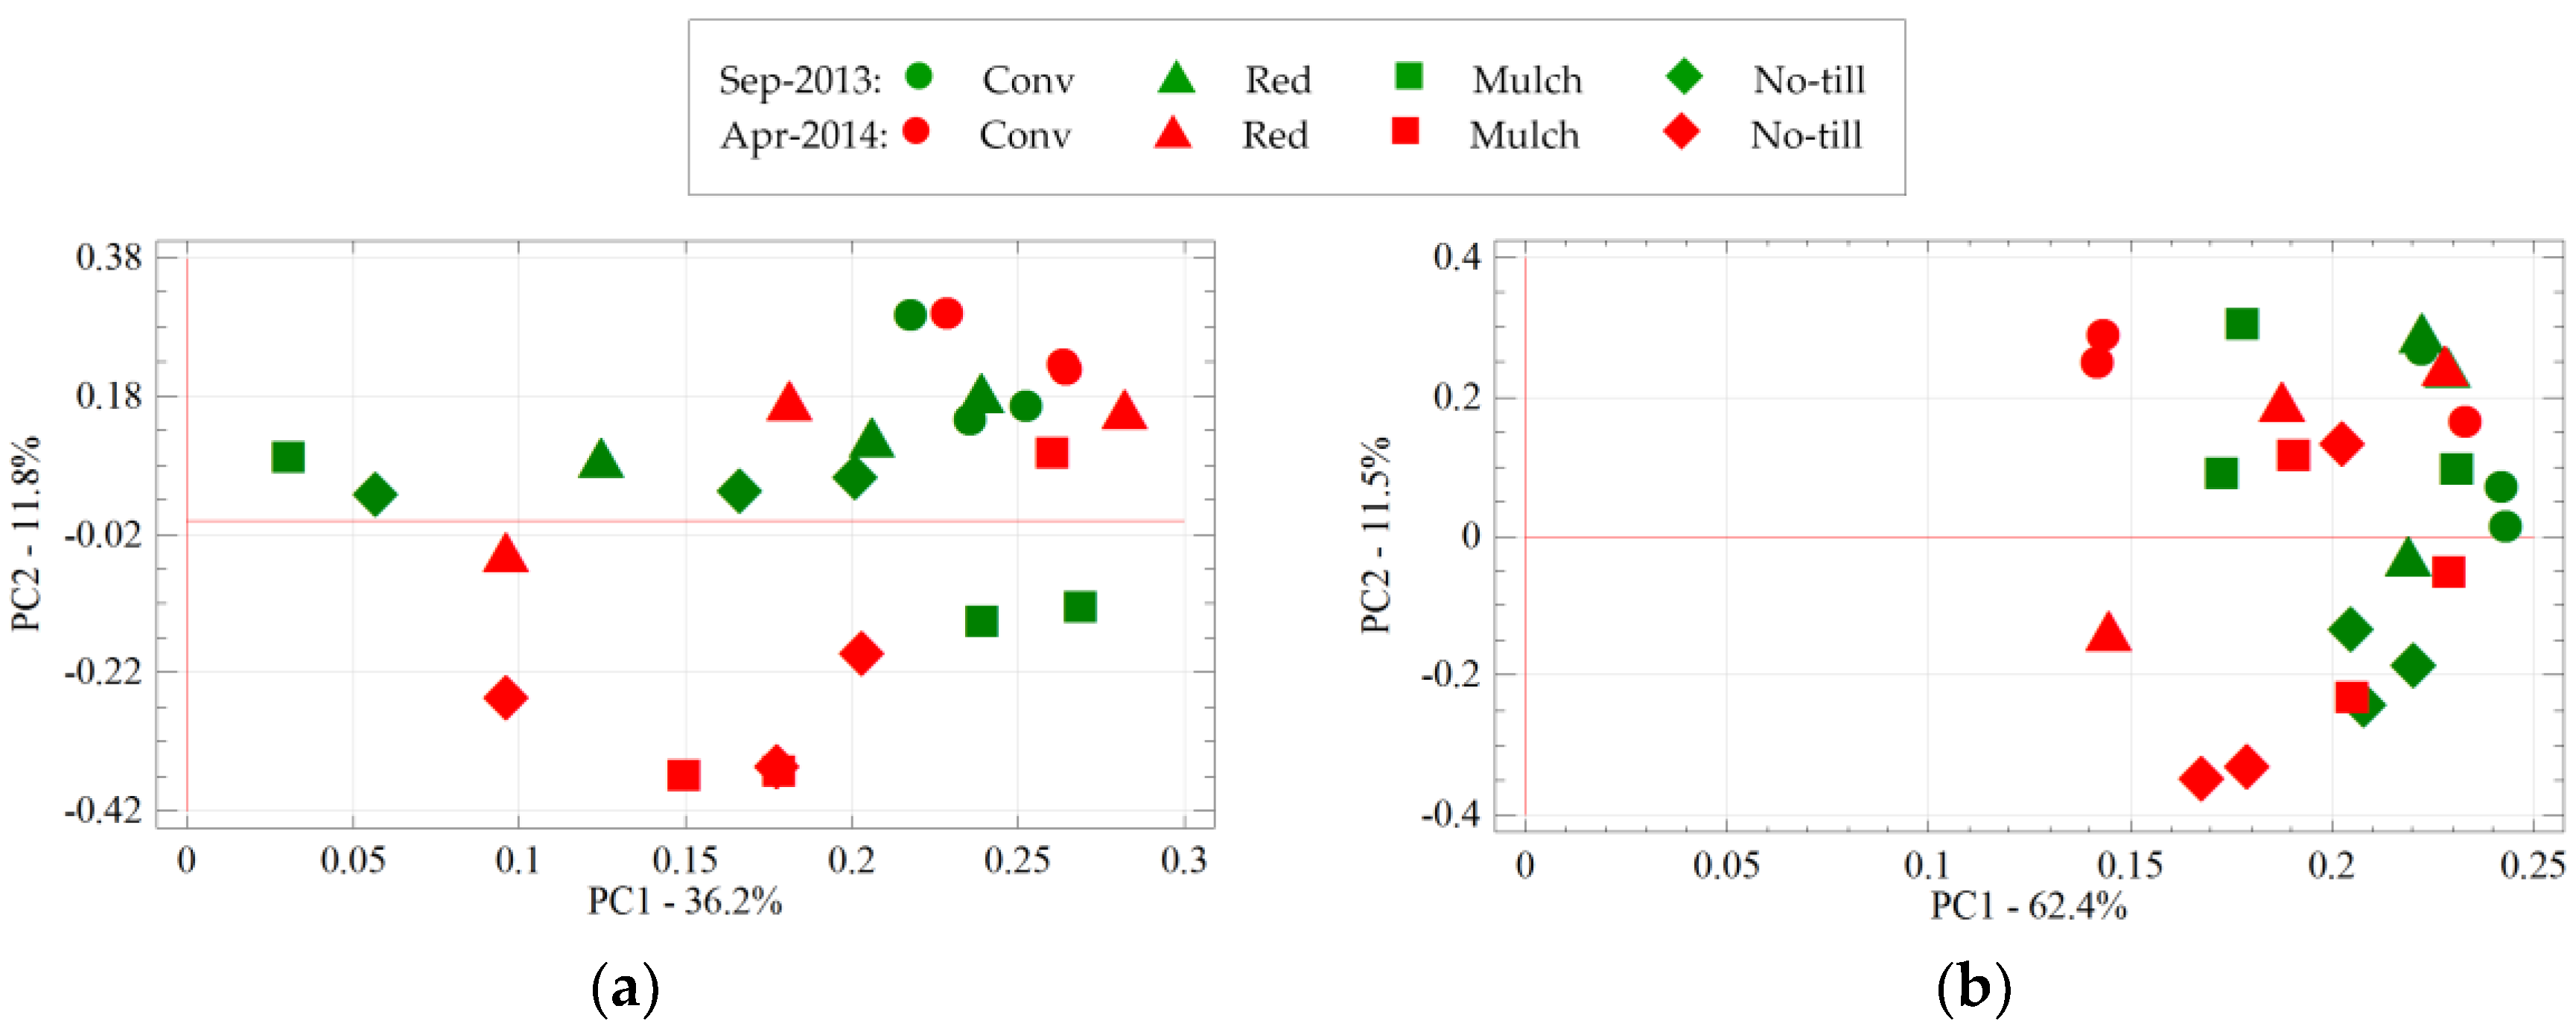
3.4. The Impact of Sampling Time and Tillage on Soil Bacterial Communities

Similarly, the PCA presenting both the sampling time and tillage management systems showed that the composition of soil bacterial communities reflected neither the sampling time nor the soil tillage management (Figure 8). The results from the PERMANOVA analysis revealed that the statistically significant differences between tillage treatments and between the sampling times were not detected. Additionally, significant interactions between the tillage treatments and time were not observed in both fingerprinting methods (Table 2).
Cluster analysis divided the soil samples in dendrograms into two uneven clusters A and B. While the B cluster was composed of one or five samples (Figure 9a,b; respectively). According to the used ARISA method (Figure 9a), only one no-till sample collected in September had the most different bacterial composition from the others and it simultaneously formed a separate B cluster. The bacterial communities were not strictly divided according to the type of tillage or by the collection date. Some indication of the bacterial communities’ similarity was observed in reduced tillage, regardless of the collection date wherein each sample was located in the left half of the T-RFLP dendrogram (Figure 9b).

4. Discussion

Soil microorganisms can be used as indicators of soil quality and condition in different agronomical systems and can also reflect the ecological impacts of human activities. The genetic diversity and dynamics of soil bacterial communities in four frequently used soil tillage managements in a long-term field experiment were analyzed in this study. The obtained results expressed that the extracted soil microbial biomass was statistically significantly different among the various tillage systems in both sampling times (spring, autumn), although higher in spring. The ratio of OTUs/T-RFs to the microbial biomass in the individual tillage systems was not constant. This may have been due to the different ratios of bacteria to other groups of microorganisms such as archaea, fungi, protozoa, and viruses present in the soil [29]. However, the bacteria are present in the greatest ratio and the archaea were ten-fold less in the soil [30]. On the other hand, the bacterial richness was not significantly different between the sampling times or between the used tillage management systems in our study (Figure 3). This indicates that more eukaryotes in the microbial biomass were detected at the expense of bacteria in April. The same discrepancy between bacterial richness and microbial biomass was detected by Constancias et al. (2015) [31]. They explained it as the influence of different drivers affecting the amount of bacterial (prokaryotic) and fungal (eukaryotic) biomass, respectively. Additionally, Fierer and Jackson (2006) [32] and Dequiedt et al. (2009, 2011) [33,34] confirmed that the microbial biomass and diversity can be influenced by different drivers and the bacterial abundance is usually poorly affected by land management systems [35,36]. The huge microbial diversity is closely related to the variation in the soil parameters and the complexities of its chemical and biological properties [37]. In contrast to our results, Wickings et al. (2016) [38] presented that the microbial biomass was not affected by management practices but significantly varied according to the altitude, with higher microbial biomass in depressions than on the slopes and summits. They also observed that the microbial biomass significantly changed over time in all cases. This is consistent with our results where microbial biomass was statistically different depending on the sampling time in all four tillage management systems with higher biomass in the spring season (Figure 3a). Moreover, higher microbial biomass has been detected in forest soil in comparison to pasture and cultivated soil, respectively [31,39]. On the other hand, in agricultural soil, the higher amount of microbial biomass carbon has been detected in fertilized soils rather than in unfertilized soils [40,41]. Generally, the soil tillage is considered as an important factor that reduces the amount of microbial biomass [42,43,44] and microbial diversity [45,46], having fundamental and long-lasting impacts on the soil microbial communities [47,48].
The diversity indices (Gini–Simpson, Shannon’s, and Pielou evenness) in the soil bacterial communities in our study indicated that the statistical differences were not detected among the four used soil tillage systems. These diversity indices are widely used in microbial ecology and species richness (number of OTUs/T-RFs). Furthermore, a relative abundance of phylotypes (fluorescence intensity) was used for its calculation. Differences in the Gini–Simpson and Shannon’s indices have been visible, especially for samples from mulch-till sampled in September (ARISA and T-RFLP) and no-till in April (T-RFLP) (Figure 5). However, these differences were not statistically confirmed due to the high variability of the index values measured within the three replications of a specific type of soil management. This statistical uniformity among the types of soil management is probably due to the same soil type in the field trial area. In contrast to our results, Dong et al. (2017) [49] used Illumina MiSeq sequencing to detect that no-till caused a significant increase in the bacterial alpha-diversity compared to conventional tillage. Additionally, Wang et al. (2014) [50] detected significant differences in bacterial diversity between conventional and no-tillage using Shannon’s index with a higher average index in the no-till system. On the other hand, they did not detect statistical differences using the evenness index between both mentioned soil cultivations. Hartmann et al. (2015) [51] found that the farming system (two conventional and three organics) and crop type were significant drivers of bacterial β-diversity and bacterial communities in different farming systems were approximately 10% dissimilar. Furthermore, they detected significant differences among five tested soil managements in bacterial richness and evenness (α-diversity). Constancias et al. (2015) [31] observed the different determinisms of microbial biomass, bacterial richness, evenness, and Shannon’s index using variance partitioning. They confirmed that the soil characteristics were the best predictors of microbial biomass, bacterial richness, and Shannon’s index, while the land management was the best predictor of the bacterial evenness. On the other hand, surprising results were published by Degrune et al. (2016) [52], who observed significantly lower richness and Shannon diversity indexes in the reduced tillage than in the conventional tillage. The measured values for the Shannon index are well comparable because their values, unlike other indices, are not in the range of 0 to 1. Our Shannon index values are above 2.87 for T-RFLP and 3.87 for ARISA. Lower index values have been recorded by Castañeda et al. (2015) [53] in the study of soil bacterial communities in Chile by T-RFLP. Their maximum value for Shannon’s index was 1.32 for forest soil and 1.59 for vineyards. Conversely, their values for Evenness were higher (minimum value of 0.89 for forest soil and vineyards) than ours ranging from 0.83–0.91 for ARISA and 0.79–0.86 for T-RFLP. In another already mentioned study from Constancias et al. (2015) [31], the values of the Shannon index were much higher in their tested forest and crop soils (5.16 for forest and 5.58 for crop soils). Additionally, Jangid et al. (2008) [54] detected a higher Shannon diversity index (4.97 and 5.44) in croplands in the USA using 16S rRNA gene libraries than we detected in our study.
The soil management had no significant effect on the diversity of bacterial communities in our study based on PERMANOVA. The differences were detected neither by ARISA nor by T-RFLP approaches. The results from the T-RFLP analysis were more consistent and the bacterial communities were mutually more similar (Figure 6 and Figure 7). This is consistent with the study of Girvan et al. (2003) [55]. They used the Biolog system, DGGE, and T-RFLP methods and observed that the composition of the bacterial community was determined mainly by soil characteristics, followed by crop planting, especially by legumes, rather than by the different soil management practices. Furthermore, Bossio et al. (2005) [56], using the 16S rRNA analysis (DGGE method) detected soil type as the primary determinant of the total bacterial community in tropical soils. Other studies showed that different soil managements caused long-lasting effects on the physical and chemical properties of soil, influencing the microbial communities and abundances [57,58]). For example, Banerjee et al. (2015) [59] concluded that the agricultural management practices exert stronger effects on soil bacterial communities than soil zones across the selected geographical gradient in Canada. Navarro-Noya et al. (2013) [60] found that the tillage and residue management affected the bacterial community composition but not bacterial richness, diversity, and total abundance. Similarly, Anderson et al. (2017) [61] confirmed that tillage affected the composition, but not the richness, of soil microbial communities and that the bacterial community composition was more responsive to tillage treatment differences than fungi. Moreover, Mbuthia et al. (2015) [62], by comparing till and no-till, observed that the tillage significantly influenced the microbial community structure composition by using Fatty acid methyl ester (FAME) analysis, but not the total soil microbial biomass expressed as the total FAME. On the other hand, Rincon-Florez et al. (2016) [63] detected that the occasional strategic tillage did not significantly affect the bacterial community structure in conventional and no-till management by using the T-RFLP method.
The seasonal effect (September 2013 versus April 2014, in our study) was not confirmed as the factor changing the soil bacterial community composition in the four agricultural management systems. This was confirmed by the PERMANOVA, PCA, and cluster analyses, where the separation of samples according to the sampling dates was not observed (Table 2; Figure 8 and Figure 9). On the contrary to our results, Vink et al. (2014) [64] presented a significantly different composition of the bacterial community in summer than in spring and autumn. This temporal effect was highly significant between and within years. Habekost et al. (2008) [65] found seasonal variations in the microbial community structure and amount of phospholipid fatty acids was higher at the end of the vegetation period than in spring. In the study by Kennedy et al. (2005) [66], the season was found as a factor influencing soil bacterial community composition and samples from colder months showed a greater correlation with change in the bacterial community structure than those from warmer months. Strong seasonal effect on the composition of microbial communities was also published in the other studies [67,68,69].
Consistent results about the bacterial community composition and diversity in four soil management practices in our study could be affected mainly by the short time period, the same soil type, and similar soil characteristics. The selected physicochemical parameters characterizing the studied site, which are mentioned in the Materials and Methods in Section 2.1, did not show statistical differences among the monitored tillage practices [20]. Additionally, Žák et al. (2011) [70] did not observe statistical differences in the agrochemical soil properties at the same experimental locality. In the monitoring period (1998–2005), they detected slightly higher values for pH and the C, Ca, and Mg contents in conventional tillage while the N, P, and K contents were slightly higher in the no-till. Partial differences we also detected between both the used molecular methods due to the fact that each method uses a different DNA region to determine the community fingerprint.
Different soil management methods affect the soil structure, final production of plants, as well as microbial communities that inhabit the soil. Beneficial plant-microbial associations are disturbed by tillage techniques, especially by conventional deep operation with soil. Such stresses may be minimized by modern arable farming systems with reduced soil tillage or without tillage. Species diversity, especially functional diversity of soil microorganisms is linked with processes in the soil that are also influenced significantly by the soil management. Understanding the interactions between the plant-soil, the plant-microbial ecosystems, as well as the soil-microorganisms, can lead to the development of “smart” field technologies, where the monitoring of microbial rhizosphere communities can positively affect the plant health and nutrition and optimize the necessary interventions. A few positive consequences could be the lesser impact of the agricultural production on the environment and the sustainability of the agricultural production, in general [71]. Microbial populations in the soil are instrumental to the fundamental processes that drive stability and productivity of agro-ecosystems [72].

5. Conclusions

The results from the ARISA and T-RFLP methods showed that the genetic diversity and composition of bacterial communities have not been affected by different soil management systems. This result is probably caused by the similar soil type. Additionally, the short time period could also be a potential reason for the non-significant changes in soil microbial parameters. Statistically significant differences were detected only in the total microbial biomass among various soil tillage systems and also between the sampling dates. Bacterial richness, however, did not reflect the microbial biomass in different agricultural managements and no statistical differences were detected in the bacterial richness between sampling dates in all tillage treatments. The temporal changes in the bacterial community composition have not been confirmed overall or within the individual agricultural management system. Other similar studies need to be conducted to understand the interactions and feedback between agricultural practices, agricultural soil, and the structure and function of microbial communities in order to develop optimal agricultural practices that improve the sustainability of agriculture. A major problem in the analysis of soil microbial communities, that is, the limitation of classical microbiological cultivation techniques [73], is solvable by cultivation-independent techniques based on the analysis of metagenomic DNA from the soil, as our study presents.

Acknowledgments

This work was supported by the Operational Programme Research and Development: “Development and installation of lysimeters equipment for the rational farming on land in sustainable crop production” (ITMS 26220220191) and “Systems biology for protection, reproduction and use of plant resources of Slovakia” (ITMS 26210120039) from European Regional Development Fund (ERDF).

Author Contributions

Katarína Ondreičková, Rastislav Bušo, Roman Hašana and Ján Kraic conceived and designed the experiments; Katarína Ondreičková, Rastislav Bušo and Jozef Gubiš performed the experiments; Katarína Ondreičková and Michaela Piliarová analyzed the data; Ľudovít Schreiber and Ján Kraic contributed reagents/materials/analysis tools; Katarína Ondreičková and Ján Kraic wrote the paper.

Conflicts of Interest

The authors declare no conflict of interest.

References

  1. Wall, D.H.; Virginia, R.A. Controls on soil biodiversity: Insights from extreme environments. Appl. Soil Ecol. 1999, 13, 137–150. [Google Scholar] [CrossRef]
  2. Garbeva, P.; van Veen, J.A.; van Elsas, J.D. Microbial diversity in soil: Selection microbial populations by plant and soil type and implications for disease suppressiveness. Annu. Rev. Phytopathol. 2004, 42, 243–270. [Google Scholar] [CrossRef] [PubMed]
  3. George, E.; Marschner, H.; Jakobsen, I. Role of arbuscular mycorrhizal fungi in uptake of phosphorous and nitrogen from soil. Crit. Rev. Biotechnol. 1995, 15, 257–270. [Google Scholar] [CrossRef]
  4. Hartmann, M.; Widmer, F. Community structure analysis are more sensitive to differences in soil bacterial communities than anonymous diversity indices. Appl. Environ. Microbiol. 2006, 72, 7804–7812. [Google Scholar] [CrossRef] [PubMed]
  5. Giacometti, C.; Demyan, M.S.; Cavani, L.; Marzadori, C.; Ciavatta, C.; Kandeler, E. Chemical and microbiological soil quality indicators and their potential to differentiate fertilization in temperate agroecosystems. Appl. Soil Ecol. 2013, 64, 32–48. [Google Scholar] [CrossRef]
  6. Joergensen, R.G.; Emmerling, C. Methods for evaluating human impact on soil microorganisms based on their activity, biomass, and diversity in agricultural soils. J. Plant Nutr. Soil Sci. 2006, 169, 295–309. [Google Scholar] [CrossRef]
  7. Drenovsky, R.E.; Steenwerth, K.L.; Jackson, L.E.; Scow, K.M. Land use and climatic factors structure regional patterns in soil microbial communities. Glob. Ecol. Biogeogr. 2010, 19, 27–39. [Google Scholar] [CrossRef] [PubMed]
  8. Smith, J.L.; Collins, H.P. Management of organisms and their processes in soils. In Soil Microbiology, Ecology, and Biochemistry, 3rd ed.; Paul, E.A., Ed.; Academic Press: Oxford, UK, 2007; pp. 471–502. ISBN 9780080475141. [Google Scholar]
  9. Peigné, J.; Ball, B.C.; Roger-Estrade, J.; David, C. Is conservation tillage suitable for organic farming? A review. Soil Use Manag. 2007, 23, 129–144. [Google Scholar] [CrossRef]
  10. Gebhardt, M.R.; Daniel, T.C.; Schweizer, E.E.; Allmaras, R.R. Conservation tillage. Science 1985, 230, 625–629. [Google Scholar] [CrossRef] [PubMed]
  11. Cunningham, H.M.; Chaney, K.; Bradbury, R.B.; Wilcox, A. Non-inversion tillage and farmland birds: A review with special reference to the UK and Europe. IBIS 2004, 146, 192–202. [Google Scholar] [CrossRef]
  12. Jones, C.; Basch, G.; Bayliss, A.; Bazzoni, D.; Biggs, J.; Bradbury, R.; Chaney, K.; Deeks, L.; Field, R.; Gómez, J.; et al. Conservation Agriculture in Europe: An Approach to Sustainable Crop Production by Protecting Soil and Water? SOWAP: Bracknell, UK, 2006; p. 110. ISBN 9780955656507. [Google Scholar]
  13. Alletto, L.; Coquet, Y.; Benoit, P.; Heddadj, D.; Barriuso, E. Tillage management effects on pesticide fate in soil. A review. Agron. Sustain. Dev. 2010, 30, 367–400. [Google Scholar] [CrossRef]
  14. Reeves, D.W. The role of soil organic matter in maintaining soil quality in continuous cropping systems. Soil Tillage Res. 1997, 43, 131–167. [Google Scholar] [CrossRef]
  15. Locke, M.A.; Zablotowicz, R.M.; Weaver, M.A. Herbicide fate under conservation tillage, cover crop and edge of field management practices. In Handbook of Sustainable Weed Management; Singh, H.P., Batish, D.R., Kohli, R.K., Eds.; Haworth: Binghampton, NY, USA, 2006; pp. 373–392. ISBN 9781560229575. [Google Scholar]
  16. Curci, M.; Pizzigallo, M.D.R.; Crecchio, C.; Mininni, R. Effects of conventional tillage on biochemical properties of soils. Biol. Fertil. Soils 1997, 25, 1–6. [Google Scholar] [CrossRef]
  17. Calderon, F.J.; Jackson, L.E.; Scow, K.M.; Rolston, D.E. Microbial responses to simulated tillage in cultivated and uncultivated soils. Soil Biol. Biochem. 2000, 32, 1547–1559. [Google Scholar] [CrossRef]
  18. Govaerts, B.; Mezzalama, M.; Unno, Y.; Sayre, K.D.; Luna-Guido, M.; Vanherck, K.; Dendooven, L.; Deckers, J. Influence of tillage, residue management, and crop rotation on soil microbial biomass and catabolic diversity. Appl. Soil Ecol. 2007, 37, 18–30. [Google Scholar] [CrossRef]
  19. Postma, J.; Veen, J.A. Habitable pore space and survival of Rhizobium leguminasorum biovar trifolii introduced into soil. Microb. Ecol. 1990, 19, 149–161. [Google Scholar] [CrossRef] [PubMed]
  20. Kováč, K.; Kucharovic, A.; Žák, Š.; Hašana, R.; Bušo, R. Bilancia Energo-Materiálových Tokov v Poľnom Ekologicky Citlivom Agroekosystéme (Eng. Balance of Energy-Material Flows in the Ecologically Sensitive Agroecosystems); National Agricultural and Food Centre: Lužianky, Slovakia, 2014; p. 146. ISBN 9788089417537. [Google Scholar]
  21. Cardinale, M.; Brusetti, L.; Quatrini, P.; Borin, S.; Puglia, A.M.; Rizzi, A.; Zanardini, E.; Sorlini, C.; Corselli, C.; Daffonchio, D. Comparison of different primer sets for use in automated ribosomal intergenic spacer analysis of complex bacterial communities. Appl. Environ. Microbiol. 2004, 70, 6147–6156. [Google Scholar] [CrossRef] [PubMed]
  22. Edwards, U.; Rogall, T.; Blöcker, H.; Emde, M.; Böttger, E.C. Isolation and direct complete nucleotide determination of entire genes: Characterization of a gene coding for 16S ribosomal RNA. Nucleic Acids Res. 1989, 17, 7843–7853. [Google Scholar] [CrossRef] [PubMed]
  23. Muyzer, G.; Teske, A.; Wirsen, C.O. Phylogenetic relationships of Thiomicrospira species and their identification in deep-sea hydrothermal vent samples by denaturing gradient gel electrophoresis of 16S rDNA fragments. Arch. Microbiol. 1995, 164, 165–172. [Google Scholar] [CrossRef] [PubMed]
  24. Oliveros, J.C. Venny. An Interactive Tool for Comparing Lists with Venn’s Diagrams. 2007–2015. Available online: http://bioinfogp.cnb.csic.es/tools/venny/index.html (accessed on 10 August 2017).
  25. Hammer, Ø.; Harper, D. Paleontological Data Analysis; Blackwell Publishing: Oxford, UK, 2006; p. 351. ISBN 1405115440. [Google Scholar]
  26. Jost, L. Entropy and diversity. Oikos 2006, 113, 363–375. [Google Scholar] [CrossRef]
  27. Shannon, C.E.; Weaver, W. A mathematical theory of communication. Bell Syst. Tech. J. 1948, 27, 379–423, 623–656. [Google Scholar] [CrossRef]
  28. Pielou, E.C. The measurement of diversity in different types of biological collections. J. Theor. Biol. 1966, 13, 131–144. [Google Scholar] [CrossRef]
  29. Tate, R.L. Soil Microbiology, 2nd ed.; John Wiley & Sons: New York, NY, USA, 2000; p. 536. ISBN 9780471317913. [Google Scholar]
  30. Aislabie, J.; Deslippe, J.R. Soil microbes and their contribution to soil services. In Ecosystem Services in New Zealand–Conditions and Trends; Dymond, J.R., Ed.; Manaaki Whenua Press: Lincoln, New Zealand, 2013; pp. 143–161. ISBN 9780478347364. [Google Scholar]
  31. Constancias, F.; Terrat, S.; Saby, N.P.A.; Horrigue, W.; Villerd, J.; Guillemin, J.P.; Biju-Duval, L.; Nowak, V.; Dequiedt, S.; Ranjard, L.; et al. Mapping and determinism of soil microbial community distribution across an agricultural landscape. Microbiol. Open 2015, 4, 505–517. [Google Scholar] [CrossRef] [PubMed]
  32. Fierer, N.; Jackson, R.B. The diversity and biogeography of soil bacterial communities. Proc. Natl. Acad. Sci. USA 2006, 103, 626–631. [Google Scholar] [CrossRef] [PubMed]
  33. Dequiedt, S.; Thioulouse, J.; Jolivet, C.; Saby, N.P.A.; Lelievre, M.; Maron, P.A.; Martin, M.P.; Prévost-Bouré, N.C.; Toutain, B.; Arrouays, D.; et al. Biogeographical patterns of soil bacterial communities. Environ. Microbiol. Rep. 2009, 1, 251–255. [Google Scholar] [CrossRef] [PubMed]
  34. Dequiedt, S.; Saby, N.P.A.; Lelievre, M.; Jolivet, C.; Thioulouse, J.; Toutain, B.; Arrouays, D.; Bispo, A.; Lemanceau, P.; Ranjard, L. Biogeographical patterns of soil molecular microbial biomass as influenced by soil characteristics and management. Glob. Ecol. Biogeogr. 2011, 20, 641–652. [Google Scholar] [CrossRef]
  35. Enwall, K.; Throbäck, I.N.; Stenberg, M.; Söderström, M.; Hallin, S. Soil resources influence spatial patterns of denitrifying communities at scales compatible with land management. Appl. Environ. Microbiol. 2010, 76, 2243–2250. [Google Scholar] [CrossRef] [PubMed]
  36. Kuramae, E.E.; Yergeau, E.; Wong, L.C.; Pijl, A.S.; Veen, J.A.; Kowalchuk, G.A. Soil characteristics more strongly influence soil bacterial communities than land-use type. FEMS Microbiol. Ecol. 2012, 79, 12–24. [Google Scholar] [CrossRef] [PubMed]
  37. Daniel, R. The metagenomics of soil. Nat. Rev. Microbiol. 2005, 3, 470–478. [Google Scholar] [CrossRef] [PubMed]
  38. Wickings, K.; Grandy, A.S.; Kravchenko, A.N. Going with the flow: Landscape position drives differences in microbial biomass and activity in conventional, low input, and organic agricultural systems in the Midwestern U.S. Agric. Ecosyst. Environ. 2016, 218, 1–10. [Google Scholar] [CrossRef]
  39. Kara, Ö.; Bolat, I. The effect of different land uses on soil microbial biomass carbon and nitrogen in Bartin Province. Turk. J. Agric. For. 2008, 32, 281–288. [Google Scholar]
  40. Kallenbach, C.; Grandy, A.S. Controls over soil microbial biomass responses to carbon amendments in agricultural systems: A meta-analysis. Agric. Ecosyst. Environ. 2011, 144, 241–252. [Google Scholar] [CrossRef]
  41. Geisseler, D.; Scow, K.M. Long-term effects of mineral fertilizers on soil microorganisms—A review. Soil Biol. Biochem. 2014, 75, 54–63. [Google Scholar] [CrossRef]
  42. Frey, S.D.; Elliott, E.T.; Paustian, K. Bacterial and fungal abundance biomass in conventional and no-tillage agroecosystems along two climatic gradients. Soil Biol. Biochem. 1999, 31, 573–585. [Google Scholar] [CrossRef]
  43. Drijber, R.A.; Doran, J.W.; Parkhurst, A.M.; Lyon, D.J. Changes in soil microbial community structure with tillage under long-term wheat-fallow management. Soil Biol. Biochem. 2000, 32, 1419–1430. [Google Scholar] [CrossRef]
  44. Van Groenigen, K.J.; Bloem, J.; Baath, E.; Boeckx, P.; Rousk, J.; Bodé, S.; Forristal, D.; Jones, M.B. Abundance, production and stabilization of microbial biomass under conventional and reduced tillage. Soil Biol. Biochem. 2010, 42, 48–55. [Google Scholar] [CrossRef]
  45. Acosta-Martinez, V.; Dowd, S.E.; Bell, C.W.; Lascano, R.; Booker, J.D. Microbial community composition as affected by dryland cropping systems and tillage in a semiarid sandy soil. Diversity 2010, 2, 910–931. [Google Scholar] [CrossRef]
  46. Cañizares, R.; Moreno, B.; Benitez, E. Biochemical characterization with detection and expression of bacterial β-glucosidase encoding genes of a Mediterranean soil under different long-term management practices. Biol. Fertil. Soil 2010, 48, 651–663. [Google Scholar] [CrossRef]
  47. Buckley, D.H.; Schmidt, T.M. The structure of microbial communities in soil and the lasting impact of cultivation. Microb. Ecol. 2001, 42, 11–21. [Google Scholar] [CrossRef] [PubMed]
  48. Clegg, C.D.; Lovell, R.D.; Hobbs, P.J. The impact of grassland management regime on the community structure of selected bacterial groups in soils. FEMS Microb. Ecol. 2003, 43, 263–270. [Google Scholar] [CrossRef] [PubMed]
  49. Dong, W.; Liu, E.; Yan, C.; Tian, J.; Zhang, H.; Zhang, Y. Impact of no tillage vs. conventional tillage on the soil bacterial community structure in a winter wheat cropping succession in northern China. Eur. J. Soil Biol. 2017, 80, 35–42. [Google Scholar] [CrossRef]
  50. Wang, J.; Zhang, H.; Li, X.; Su, Z.; Li, X.; Xu, M. Effects of tillage and residue incorporation on composition and abundance of microbial communities of a fluvo-aquic soil. Eur. J. Soil Biol. 2014, 65, 70–78. [Google Scholar] [CrossRef]
  51. Hartmann, N.; Frey, B.; Mayer, J.; Mäder, P.; Widmer, F. Distinct soil microbial diversity under long-term organic and conventional farming. ISME J. 2015, 9, 1177–1194. [Google Scholar] [CrossRef] [PubMed]
  52. Degrune, F.; Theodorakopoulos, N.; Dufrene, M.; Colinet, G.; Bodson, B.; Hiel, M.P.; Taminiau, B.; Nezer, C.; Daube, G.; Vandenbol, M. No favorable effect of reduced tillage on microbial community diversity in a silty loam soil (Belgium). Agric. Ecosyst. Environ. 2016, 224, 12–21. [Google Scholar] [CrossRef]
  53. Castañeda, L.E.; Godoy, K.; Manzano, M.; Marquet, P.A.; Barbosa, O. Comparison of soil microbial communities inhabiting vineyards and native sclerophyllous forests in central Chile. Ecol. Evol. 2015, 5, 3857–3868. [Google Scholar] [CrossRef] [PubMed]
  54. Jangid, K.; Williams, M.A.; Franzluebbers, A.J.; Sanderlin, J.S.; Reeves, J.H.; Jenkins, M.B.; Endale, D.M.; Coleman, D.C.; Whitman, W.B. Relative impacts of land-use, management intensity and fertilization upon soil microbial community structure in agricultural systems. Soil Biol. Biochem. 2008, 40, 2843–2853. [Google Scholar] [CrossRef]
  55. Girvan, M.S.; Bullimore, J.; Pretty, J.N.; Osborn, A.M.; Ball, A.S. Soil type is the primary determinant of the composition of the total and active bacterial communities in arable soils. Appl. Environ. Microb. 2003, 69, 1800–1809. [Google Scholar] [CrossRef]
  56. Bossio, D.A.; Girvan, M.S.; Verchot, L.; Bullimore, J.; Borelli, T.; Albrecht, A.; Scow, K.M.; Ball, A.S.; Pretty, J.N.; Osborn, A.M. Soil microbial community response to land use change in an agricultural landscape of western Kenya. Microb. Ecol. 2005, 49, 50–62. [Google Scholar] [CrossRef] [PubMed]
  57. Lauber, C.L.; Strickland, M.S.; Bradford, M.A.; Fierer, N. The influence of soil properties on the structure of bacterial and fungal communities across land-use types. Soil Biol. Biochem. 2008, 40, 2407–2415. [Google Scholar] [CrossRef]
  58. Bissett, A.; Abell, G.C.J.; Brown, M.; Thrall, P.H.; Bodrossy, L.; Smith, M.C.; Baker, G.H.; Richardsson, A.E. Land-use and management practices affect soil ammonia oxidiser community structure, activity and connectedness. Soil Biol. Biochem. 2014, 78, 138–148. [Google Scholar] [CrossRef]
  59. Banerjee, S.; Baah-Acheamfour, M.; Carlyle, C.N.; Bissett, A.; Richardson, A.E.; Siddique, T.; Bork, E.W.; Chang, S.X. Determinants of bacterial communities in Canadian agroforestry systems. Environ. Microbiol. 2015, 1–12. [Google Scholar] [CrossRef] [PubMed]
  60. Navarro-Noya, Y.E.; Gómez-Acata, S.; Montoya-Ciriaco, N.; Rojas-Valdez, A.; Suárez-Arriaga, M.C.; Valenzuela-Encinas, C.; Jiménez-Bueno, N.; Verhulst, N.; Govaerts, B.; Dendooven, L. Relative impacts of tillage, residue management and crop-rotation on soil bacterial communities in a semi-arid agroecosystem. Soil Biol. Biochem. 2013, 65, 86–95. [Google Scholar] [CrossRef]
  61. Anderson, C.; Beare, M.; Buckley, H.L.; Lear, G. Bacterial and fungal communities respond differently to varying tillage depth in agricultural soils. Peer J 2017, 5, e3930. [Google Scholar] [CrossRef] [PubMed]
  62. Mbuthia, L.W.; Acosta-Martínez, V.; DeBryun, J.; Schaeffer, S.; Tyler, D.; Odoi, E.; Mpheshea, M.; Walker, F. Long term tillage, cover crop, and fertilization effects on microbial community structure, activity: Implications for soil quality. Soil. Biol. Biochem. 2015, 89, 24–34. [Google Scholar] [CrossRef]
  63. Rincon-Florez, V.A.; Ng, C.; Dang, Y.P.; Schenk, P.M.; Carvalhais, L.C. Short-term impact of an occasional tillage on microbial communities in a Vertosol after 43 years of no-tillage or conventional tillage. Eur. J. Soil Biol. 2016, 74, 32–38. [Google Scholar] [CrossRef]
  64. Vink, S.N.; Neilson, R.; Robinson, D.; Daniell, T.J. Temporal and land use effects on soil bacterial community structure of the machair, an EU Habitats Directive Annex I low-input agricultural system. Appl. Soil Ecol. 2014, 73, 116–123. [Google Scholar] [CrossRef]
  65. Habekost, M.; Eisenhauer, N.; Scheu, S.; Steinbeiss, S.; Weigelt, A.; Gleixner, G. Seasonal changes in the soil microbial community in a grassland plant diversity gradient four years after establishment. Soil Biol. Biochem. 2008, 40, 2588–2595. [Google Scholar] [CrossRef]
  66. Kennedy, N.M.; Gleeson, D.E.; Connolly, J.; Clipson, N.J.W. Seasonal and management influences on bacterial community structure in an upland grassland soil. FEMS Microbiol. Ecol. 2005, 53, 329–337. [Google Scholar] [CrossRef] [PubMed]
  67. Lukow, T.; Dunfield, P.F.; Liesack, W. Use of the T-RFLP technique to assess spatial and temporal changes in the bacterial community structure within an agricultural soil planted with transgenic and non-transgenic potato plants. FEMS Microbiol. Ecol. 2000, 32, 241–247. [Google Scholar] [CrossRef]
  68. Smalla, K.; Wieland, G.; Buchner, A.; Zock, A.; Parzy, J.; Kaiser, S.; Roskot, N.; Heuer, H.; Berg, G. Bulk and rhizosphere soil bacterial communities studied by denaturing gradient gel electrophoresis: Plant-dependent enrichment and seasonal shifts revealed. Appl. Environ. Microbiol. 2001, 67, 4742–4751. [Google Scholar] [CrossRef] [PubMed]
  69. Griffiths, R.I.; Whiteley, A.S.; O’Donnell, A.G.; Bailey, M.J. Influence of depth and sampling time on bacterial community structure in an upland grassland soil. FEMS Microbiol. Ecol. 2003, 43, 35–43. [Google Scholar] [CrossRef] [PubMed]
  70. Žák, Š.; Beluský, J.; Bušo, R.; Gavurníková, S.; Hašana, R.; Macák, M.; Kováč, K.; Stanko, P. Pestovanie poľných Plodín s Orbou či Bez Orby? (Eng. Cultivation of Field Crops with or without Plows); Plant Production Research Centre Piešťany: Piešťany, Slovakia, 2011; p. 120. ISBN 9788071391494. [Google Scholar]
  71. Welbaum, G.A.; Sturz, A.V.; Dong, Z.; Nowak, J. Managing soil microorganisms to improve productivity of agro-ecosystems. Crit. Rev. Plant Sci. 2010, 23, 175–193. [Google Scholar] [CrossRef]
  72. Singh, J.S.; Pandey, V.C.; Singh, D.P. Efficient soil microorganisms: A new dimension for sustainable agriculture and environmental development. Agric. Ecosyst. Environ. 2011, 140, 339–353. [Google Scholar] [CrossRef]
  73. Amann, R.I.; Ludwig, W.; Schleifer, K.K. Phylogenetic identification and in situ detection of individual microbial cells without cultivation. Microbiol. Rev. 1995, 59, 143–169. [Google Scholar] [PubMed]
Figure 1. The air temperature and precipitation 30 days before soil sampling. The measured values represent the time periods from 25 August to 23 September 2013 (the first sampling) and 30 March to 28 April 2014 (the second sampling).
Sustainability 10 01095 g001
Figure 2. The field experiment localized in southwestern Slovakia consisting of 48 plots with four different tillage practices and four crops arranged in three replications. The harvested area of one plot was 9 m × 35 m (0.0135 ha) and the soil type was classified as Luvic Haplic Chernozem.
Sustainability 10 01095 g002
Figure 3. (a) The total microbial biomass represented by metagenomic DNA extracted from soil samples; (b) bacterial richness expressed as the number of OTUs (ARISA); (c) the bacterial richness expressed as the number of T-RFs (T-RFLP) detected in the soil samples from four tillage management systems in two sampling times. The bar represents the standard deviation; the different simple and capital letters denote statistically significant differences among each tillage on 13 September and 14 April, respectively (LSD, α = 0.05); * statistically significant difference (LSD, α = 0.05); NS—not significant (ANOVA, α = 0.05).
Sustainability 10 01095 g003
Figure 4. Venn diagrams constructed from (a) ARISA and (b) T-RFLP data representing the number of shared and unique OTUs/T-RFs among bacterial communities characterized at the four different tillage practices.
Sustainability 10 01095 g004
Figure 5. Genetic diversity indices and evenness of soil bacterial communities detected in the four types of soil cultivations in September and April calculated from ARISA (a,c,e) and T-RFLP (b,d,f) profiles. The displayed values represent the average values calculated from the three replicates for each type of soil cultivation. The bar represents the standard deviation.
Sustainability 10 01095 g005aSustainability 10 01095 g005b
Figure 6. Principal component analysis (PCA) based on the (a) ARISA and (b) T-RFLP fluorescent data of bacterial communities from soil samples coming from the four tillage systems. PCA was made by combining data from two sampling dates into a single statistical table.
Sustainability 10 01095 g006
Figure 7. The cluster analysis constructed from (a) ARISA and (b) T-RFLP fluorescent data of bacterial communities from soil samples coming from the four tillage systems. Dendrograms were made by combining data from two sampling dates into a single statistical table.
Sustainability 10 01095 g007
Figure 8. Principal component analysis constructed from (a) ARISA and (b) T-RFLP fluorescent data of bacterial communities from soil samples collected in two sampling times (September 2013 and April 2014) from the four tillage systems.
Sustainability 10 01095 g008
Figure 9. The cluster analysis constructed from (a) ARISA and (b) T-RFLP fluorescent data of bacterial communities from the soil samples collected in the two sampling times (September 2013 and April 2014) from the four tillage systems.
Sustainability 10 01095 g009
Table 1. The mean physicochemical parameters of soil related to the four types of soil tillage managements at 10 cm soil depth [20].
Tillage SystemSoil Temperature (°C)Bulk Density (kg m−3) Soil Porosity (%)Soil Moisture (%)Soil pH/KCl
13 September14 April13 September14 April13 September14 April13 September14 April13 September14 April
Conv12.6011.371450149046.2644.7319.7919.176.466.74
Red14.6011.701330139050.1947.9919.3019.806.506.77
Mulch14.7810.871410140047.1647.4219.9519.806.486.71
No-till13.3910.491450145045.9345.8619.9219.586.936.78
Table 2. The results of the Two-way PERMANOVA derived from values of ARISA and T-RFLP profiles.
ARISAT-RFLP
Similarity indexEuclideanEuclidean
Permutation N99999999
p-value
Tillage0.54550.6643
Season0.73560.5383
Interaction0.46740.7006

