Abstract
This article addresses issues of air pollutant emissions by Polish mining industry leaders in the light of corporate social responsibility policy: Kombinat Górniczo-Hutniczy Miedzi Polska Miedź S.A. (KGHM), Polska Grupa Energetyczna S.A. (PGE). The Corporate Social Responsibility (CSR) initiative regulates business activities at the level of environmental and social responsibility. Given the location of the “emission activities”, the level of pollutants (SOx, NOx, PMx) generated by selected entities in the capital group over the years has been analysed. The aim of the article is to disclose relevant data on the emission reduction of entities as an expression of the actions of taking care of the environment and social protection. Evaluation of the extractive industry in the context of only interventions in the environment without emphasizing the economic and social significance is biased. Therefore, the level of emissivity of the whole economy has been verified against the background of the European Union. The article highlights the importance of coal power in two contexts: the production of electricity based on that fuel in controlled industrial installations and the uncontrolled use of coal in the municipal economy as a problem with a greater nuisance and impact on the quality of inhaled air. Analyses have shown that the widely understood mining industry is still a source of pollution, but power plants and processing plants have significantly reduced the volume of emissions over the years.
1. Introduction
The article is a continuation of the author’s research within the framework of CSR (Corporate Social Responsibility) activity among the mining moguls in Poland [1,2]. There are two groups, KGHM (Kombinat Górniczo-Hutniczy Miedzi Polska Miedź S.A.) and PGE (Polska Grupa Energetyczna S.A.), more specifically, selected entities which form their parts, which are very significant and influential in the Polish economy. The main aim of the article is to show changes in the amount of pollutants emitted to the atmosphere in Poland over two decades; the detailed analysis concerned selected regions of the country where the mining and processing activities of the exploited raw materials are carried out. The participation of enterprises from the mining and energy sector in the total volume of emissions and the impact of the analysed entities on the improvement of the natural environment condition through the reduction of emissions harmful to human life and health was assessed. Care for reducing environmental pollution is in line with the principles of a socially responsible business. The research was based on integrated annual reports of the aforementioned companies, numerous scientific articles, European and national statistical data, and reports on the state of the environment of selected territorial self-government units. The dust and gas emissivity of all sectors of Poland has been presented (including production and distribution of energy, industry, agriculture, and others) against the background of EU member states over the years. The type of pollutant emission was verified in the area of two local government units (Lower Silesian voivodeship—the impact area of the Huta Miedzi (Copper Smelter) Głogów (HM Głogów) owned by KGHM and one of PGE GiEK SA (Polska Grupa Energetyczna S.A.—Górnictwo i Energetyka Konwencjonalna S.A.) power plants in Turów and the Łódzkie voivodeship—the area of operations of the second power station PGE GiEK S.A. Bełchatów)—on the country scale in the years 1996–2016.
The manifestation of taking care of the environment are among others guidelines incorporated within the EU Directive 2014/95/EU, which imposes on a selected group of (large) companies supplementing the contents of financial statements (among others companies for 2017, previously it was optional), nonfinancial information from the range of E-Environment; S-Social; G-Governance (ESG). These issues relate to the broadly understood initiative of corporate social responsibility (CSR), which, in the Polish conditions, is quite a new issue. In particular, this applies to the mining industry and its affiliates. Integrated reporting (financial and nonfinancial data) is a new experience for Polish mining companies and vertically integrated entities operating in the energy value chain [3]. The development of a corporate social responsibility reporting concept is a dynamic process described in, inter alia, the studies of [4,5,6,7,8], based on numerous guidelines and standards. Source material of the Framework Directive is the EU Directive [9] which is also in force in Poland. Interested parties may base themselves on national and EU frameworks, i.e., the Eco-Management and Audit (EMAS) framework, the international framework principles: the UN Global Compact, the United Nations’ guidelines on business and human rights implementing the UN framework, the guidelines of the Organization for Regional Co-operation and Development (OECD) for multinational enterprises, International Organization for Standardization (ISO 26000), Tripartite International Labour Organization (ILO) declarations on multinational enterprises and social policy, Global Reporting Initiative, or other internationally recognized frameworks. There is ample literature available on CSR reporting in general [4,5,6], or on the mining industry [8,10,11,12,13,14]. The environmental and social initiative of the discussed capital groups at local level was discussed more broadly in the study [1], in which emphasis was placed on the importance of mining activity in the budget of territorial self-government units. Moreover, in the work [2] the values of environmental indicators were analysed in accordance with the standards of the International Guidelines for the Global Reporting Initiative [15,16]. Widespread access to nonfinancial data extends stakeholder interest and can alleviate the negative public opinion towards the mining industry. Through reporting ESG initiatives to different stakeholder groups, entrepreneurs raise public confidence and bring new quality into socially and environmentally responsible mining. The rightness of achieving the objective of the article is reflected in the initiatives undertaken by (large) entrepreneurs in the framework of CSR activities. According to research conducted by Poland’s KPMG and the Responsible Business Forum in 2014 (on the advancement of companies operating on the Polish market in CSR activities), respondents—representatives of executive personnel and employees—acknowledged that acting in accordance with CSR principles can bring many benefits to the company. They discovered that it had an impact on the improvement of company image on the market (52%), an increase in acceptance by the environment (36%), an increase in interest from contractors (30%), an increase in sales (26%), an increase in interest among potential employees (24%), a reduction in costs (23%), and an increase in media presence (8%). In consequence, 77% of respondents considered CSR activities to have a favourable impact on financial results of companies [17]. The results of this survey confirm the authors’ thesis that the evaluation of the extractive industry through the prism of purely environmental interference is biased. Additional initiatives undertaken by mining companies within CSR activities have beneficial aspects.
Let us go back to the issue of emissivity. It is natural that the highest emission level is associated with plants that are especially noxious (power plants, electrical power and heating plants) [18,19], but what is worth mentioning here is the point emissivity. It is worth noting that we also distinguish surface and linear emissivity, which also generates pollution, and in the heating season is responsible for, among other things, smog, the appearance of which forces the reduction of outdoor activity of inhabitants (in national conditions, according to the recommendations of local governments and social initiatives, among others, Smog Alarms http://www.polskialarmsmogowy.pl). Surface emissions (low) come from individual heating systems, which include home furnaces, and are linear from the lines of car, rail, or river communication, where the source of the emission is near the surface of the earth. There is one more type of measured emission associated with the cultivation and breeding of animals (omitted in this article). A significant issue in recent times has been the addressing of the problem of low emissions, described, among others, in works devoted to the selected areas of Poland [20,21]. In many parts of Poland, the use of municipal waste in domestic solid fuel ovens is practiced (in 2012 about 49% of households were heating up solid fuel in heating facilities). Co-combustion of coal, solid municipal waste, and urban and railway traffic [22] are social phenomena which are major sources of harmful emissions into the air [23]. About 38% of the particulates emitted directly into the atmosphere come from this particular source. Over 33% of Poles are exposed to average annual PM10 concentrations of 40 μg/m3 or more, and 97% of the Polish population is exposed to dust concentrations above the WHO-recommended level (20 μg/m3), hence such a crushing and alarming image of Poland against the background of EU countries prepared by the European Environment Agency (EEA). It is wrong to attribute the sole emission of dust to power plants and other industrial entities. Home furnaces do not have exhaust gas treatment technology. According to information provided in the EEA database, coal combustion in Polish households is responsible for emissions of 20% SOx, 43% PM10, 51% CO, and 76% benzo(a)pyrene (one of PAH polycyclic aromatic hydrocarbons), respectively. Coal combustion in households is a major factor contributing to the emission of particulate matter during the heating season [24,25]. During the heating season 2016/17, the Polish city of Opoczno, among others, was at the forefront of the most polluted cities in Poland, although there are no power plants, CHP plants, or steelworks located in its vicinity. Pollution in this city, populated by 21,000 inhabitants, was caused by the burning of low-quality fuels and/or waste by households. Incineration of cheap hard coal in a central heating furnace derived from low-quality imports (among others) is a problem not only in this particular city, but also in the majority of domestic households countrywide which avail of this heating system. The quality of the fuel is not verified in any way, and the greatest incentive for its purchase is the low price. The problem is indeed widespread, as more and more nonindustrialized parts of the country are concerned, moreover, with many spa resorts that charge the climate fee for pure air, which in fact is not clean (exceeding the allowable or target airborne levels, mainly in the case of PM2.5 and PM10 and benzo(a)pyrene) [26]. Good practices involve the emerging so-called anti-smog resolutions approved by regional councils. On 27 January 2017, a resolution was passed by Sejmik of the Małopolskie voivodeship on introducing restrictions and prohibitions in the area of the Małopolskie voivodeship in the scope of operation of installations where fuel combustion occurs. It prohibits the burning of fuels in which the mass fraction of hard coal or lignite with a particle size of 0–3 mm is above 15%, and fuels containing biomass with humidity in the working state of more than 20%, as well as one resulting in replacement of installations that do not meet the requirements for seasonal energy efficiency and emission standards. Unfortunately, the document does not specify the value of the permitted quality parameters of solid fuels. This is confirmed by the sectoral emissivity results for EU-28 countries. The group of individual issuers, i.e. commercial, institutional, and households, is largely responsible for dust emissions, i.e. 57% for PM2.5 emissions and 42% for PM10, where the energy sector and distribution are 5% (PM10 and PM2.5). With regards to gases, the SOx proportions are as follows: 59% energy production and distribution, 13% households. For NOx, 19% from energy production and 14% from farms [27]. Therefore, there is a need for legislative changes at a national level with a clear separation of coal use in the power sector and other industrial entities that control emissivity from the use of coal in households.
2. Materials
The analysis of dust and gas emission was based on the details of two capital groups connected with the extractive industry: KGHM and PGE.
KGHM is a company that has been involved in mining activities (underground operation) and processing of copper ores originating from one of the largest deposits in Europe, located in middle-west Poland for years. The formation of the mining and metallurgical complex of copper is an opportunity well used for the economic development of the region. At the same time, the investment was related to the impact on the natural environment in the form of land deformation, mineralization of mined water from mines and metallurgical sewage, waste disposal (including flotation), and emission of gaseous and particulate pollutants [1,28].
PGE has a broad structure of activities in the areas of lignite mining, electricity and heat production, distribution, and sales. PGE GiEK SA based in Bełchatów operates within the segment of Conventional Power Sector of the PGE Capital Group. The company consists of 12 branches, located in 9 of the 16 voivodeships of our country. They include: 2 lignite mines (77% of national production), 4 conventional power plants, including 2 lignite power plants, Bełchatów 5.298 MWe, El. Turów 1.499 MWe, and 8 CHP plants [1,29].
Capital Groups of KGHM and PGE have a wide range of activities and are national leaders. The chain of activity of each of them begins with the extraction of the raw material. In the case of KGHM, among other things, it involves copper, silver, and other metals, while in the case of PGE, it is a fossil fuel such as lignite. They have a lot in common; firstly, they are entities of strategic importance for the state economy, under the supervision of the Minister of the Treasury (31.79% of the share capital of KGHM; 57.39% in the case of PGE). They are the leading employers in Poland (3rd place PGE S.A. with number of employees: 38.5 thousand, sales revenue: 28.1 billion PLN, 4th placeKGHM, number of employees: 33.4 thousand, sales revenue: 19.2 billion PLN). In 2012, among the most profitable companies KGHM was ranked in the first place (gross profit in PLN thousand 6,417,086, net profit in thousand PLN 4,868,249); 2nd place was granted to PGE S.A. with gross profit in thousands of PLN 4,102,537, net 3,232,834 in PLN thousand [30]. In addition, they are the top companies in the rankings of the largest Central European companies (CE TOP 500). CE TOP 500 Ranking—the list of 500 companies includes companies from 18 European countries broken down into 7 sectors of the economy [31]. The countries that take part in it together with Poland include Latvia, Bulgaria, the Czech Republic, Slovenia, Hungary, Slovakia, Croatia, Estonia, Serbia, Romania, Lithuania, Albania, Bosnia and Herzegovina, Kosovo, Macedonia, Montenegro, Moldova, and Ukraine. Among the leading companies in the power sector and natural resources (E & R) sector, PGE is ranked as 5th (PGE GiEK 22) while KGHM is 9th.
The source data used in this work are published on the Eurostat website [32], prepared and provided by the European Environment Agency (EEA). They refer to the emissivity of all sectors (total sectors of emissions for the national territory) in all EU countries (28 countries, 2015—updated July 2017). The remaining figures on the emission of air pollutants from plants that are especially noxious in Poland are published by the central government office of the Central Statistical Office of Poland (CSO). Data are collected at the Local Data Bank (BDL), the largest database in Poland on economy, society, and the environment. The update for the BDL data took place in June 2017. The time horizon of data is 20 years. The especially noxious plants which are referred to above are the so-called point sources of pollutants that are charged for annual emissions of pollutants. The fees for the given calendar year are paid to the account of the competent Marshal’s Office by 31 March of the following year. Charges for the introduction of gases or dust into the air resulting from the operation of equipment are transferred to the account of the Marshal’s Office competent for the place of registration of the user of the environment. Other fees (for injecting sewage into water or land, water intake, and waste disposal) to the account of the Marshal’s Office competent for the place of use of the environment (Article 277 of the Environmental Protection Act [33]). The rates of fees for using the environment are included in the current Announcement of the Minister of the Environment for a given year. The analyses were carried out for selected counties (poviats) of two voivodeships (Lower Silesian and Łódzkie voivodeships), in which there are plants belonging to the aforementioned two large mining companies: PGE and KGHM. They are classified [34,35] into the group of major point issuers in the Lower Silesian Voivodeship (PGE Branch of Turów Power Plant, KGHM: Głogów Branch and HM Legnica) and Łódź (PGE GiEK branch of Bełchatów Power Plant).
3. Results and Discussion
Poland has been making enormous efforts to reduce the pollutants emitted to the atmosphere for many years. The issue of emissivity of gases and dusts in national conditions was discussed in the works of [36,37], and the emissivity of mines in Poland compared to European countries for the period of one year was presented by [38]. This challenge is important and difficult at the same time, because of the production of electricity and heat, mainly on the basis of native fossil fuels. On the one hand, this demonstrates the energy security of Poland and its fuel independence, while on the other it makes it difficult to meet the tightening of emission standards. The perception of Poland with regards to the power sector as a nondeveloping country in the European Union is unjust. Media and public opinion forget or fail to comprehend that according to Eurostat data the largest lignite mining in the world and in Europe occurs in Germany, but because of the increased share of RES in the German electricity grid, the media are silent on this issue. In 2013, Germany extracted 183 million Mg of lignite (China extracted 147 million Mg, Russia 73 million Mg, USA 70 million tons) [39] while Poland extracted about 65 million Mg of this raw material. Lignite is a specific fuel that must be used on-site after extraction, so the amount of extraction in a given country is equivalent to the amount of consumption. As a result, the raw material becomes “safe”, because it is only consumed for the exclusivity of the emission-controlling power plant, and it should thus not be the source of the so-called low emission. Lignite production in Germany in 2016 amounted to 164.1 million Mg (about 100 million Mg more than in Poland). The requirements for Poland to increase the share of renewable energy sources (RES) in the electricity balance should be related to the local conditions that enable it to obtain such energy. In the paper [40] one can read that national RES energy generation can help each country reduce energy dependency. In Poland, energy independence and the reduction of energy poverty with the current energy mix is widely discussed [41]. Development and support of renewable sources is advisable to increase security [42]. When analysing the structure of electricity production in Poland, the dominant role of coal is clearly visible. Nevertheless, the situation slowly begins to change. In 2000, the share of coal in electricity production was 93%. In 2005 it decreased slightly by 1%, but already in 2010, the share of coal was at the level of 87%. This is due to the increasing role of renewable energy (RES), enforced by EU directives. In 2000, the share of RES was only 2%, in 2005 it rose to 3%, and in 2010 it reached 7% [43]. In 2016, the President of the National Energy Regulatory Authority (URE) awarded 150 promissory concessions for the generation of electricity from RES, while on 31 December 2016 there were 393 important promises, including a significant share of wind and solar (225 installations using wind energy, 155 using sun energy), single biomass, biogas, hydropower, thermal conversion of waste and geothermal energy installations [44]. The discussed companies are actively involved in RES promotion; more about these initiatives may be found in the subsequent chapters of this article.
In 2013, the share of sources responsible for exceeding the permissible level of PM10 in Poland was as follows: 88.21%—individual heating of buildings, 5.77%—vehicle traffic (including intensive traffic in city centres), 2.98%—secondary emissions of dust pollution from the surface of open roads and streets, 1.84%—industry, 1.17%—cross-border flow, 0.03%—nonanthropogenic sources [42]. The reduction of the emission of pollutants in the industrial sector is confirmed by emission reductions between the years 1989 and 2013. As a result of the application of technical and technological (BAT technologies) and legal (integrated permits) solutions, the impact of the industrial sector has decreased significantly. At present, among the causes of poor air quality, there is an increase in the share of the utilities sector, with a slight impact on the transport and industry sectors (about 90%, 5%, and 5%, respectively). Data on emissions from 1989 to 2013 indicate a reduction in dust emissions of more than 80%, SO2 reduction by about 70%, and NOx reduction by almost 40%, respectively, with a simultaneous growth of industrial output [45]. The Government document clearly states that the so-called low emission is responsible for the current state of air quality in Poland. Low emission originates primarily from the utilities sector, including individual sources of heat generation and hot water preparation, as well as small district heating stations and transport. Low emission poisons the air from emitters up to 40 m, from: furnaces from individual households (family houses, multifamily buildings), local boiler houses, public buildings, small and medium enterprises (garages, services, bakeries, etc.) communication, disorganized emissions associated with fires, dusting of landfills, etc. [45]. Conventional power plants affect the broadly understood natural environment, atmospheric air, soil, water, but also humans, animals, and plants. For the production of electricity, environmental resources (fuel), air, and water are taken from the environment. For production of electric power, energy fuels, air, and makeup water are subtracted from the environment. As a result of the combustion process, final products and by-products of the combustion process such as electricity, heat, steam, flue gas, sewage, ash and slag, dust, sulphur oxides, nitrogen and carbon, accompanied by noise and dust, are pushed into the environment. The composition of the exhaust depends on the type of fuel, combustion parameters, and type of furnace [46]. A detailed description of the type of pollutants released into the air accompanying coal combustion can be found in the works of [47,48,49]. In the article, emphasis was placed on selected gaseous and particulate emissions; due to the nuisance the most important are SOx, NOx, CO2, and dust [50]. The CO2 analysis was deliberately omitted due to the desired effect of this gas in the photosynthesis process and the ambiguous effect on the greenhouse effect.
3.1. Changes in Dust and Gas Emissivity of All Sectors of Poland Compared to the EU
In order to accurately characterize changes in gas and dust emissions, an analysis of air pollution [51] data of EU countries (source EUROSTAT) was conducted. The purpose of the presentation (Figure 1) was:
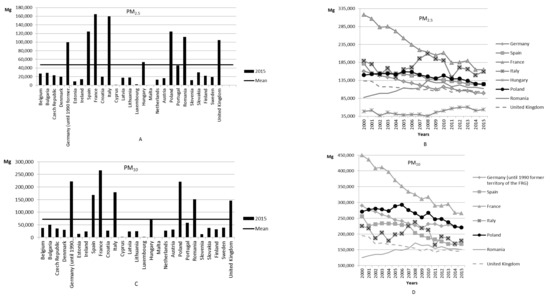

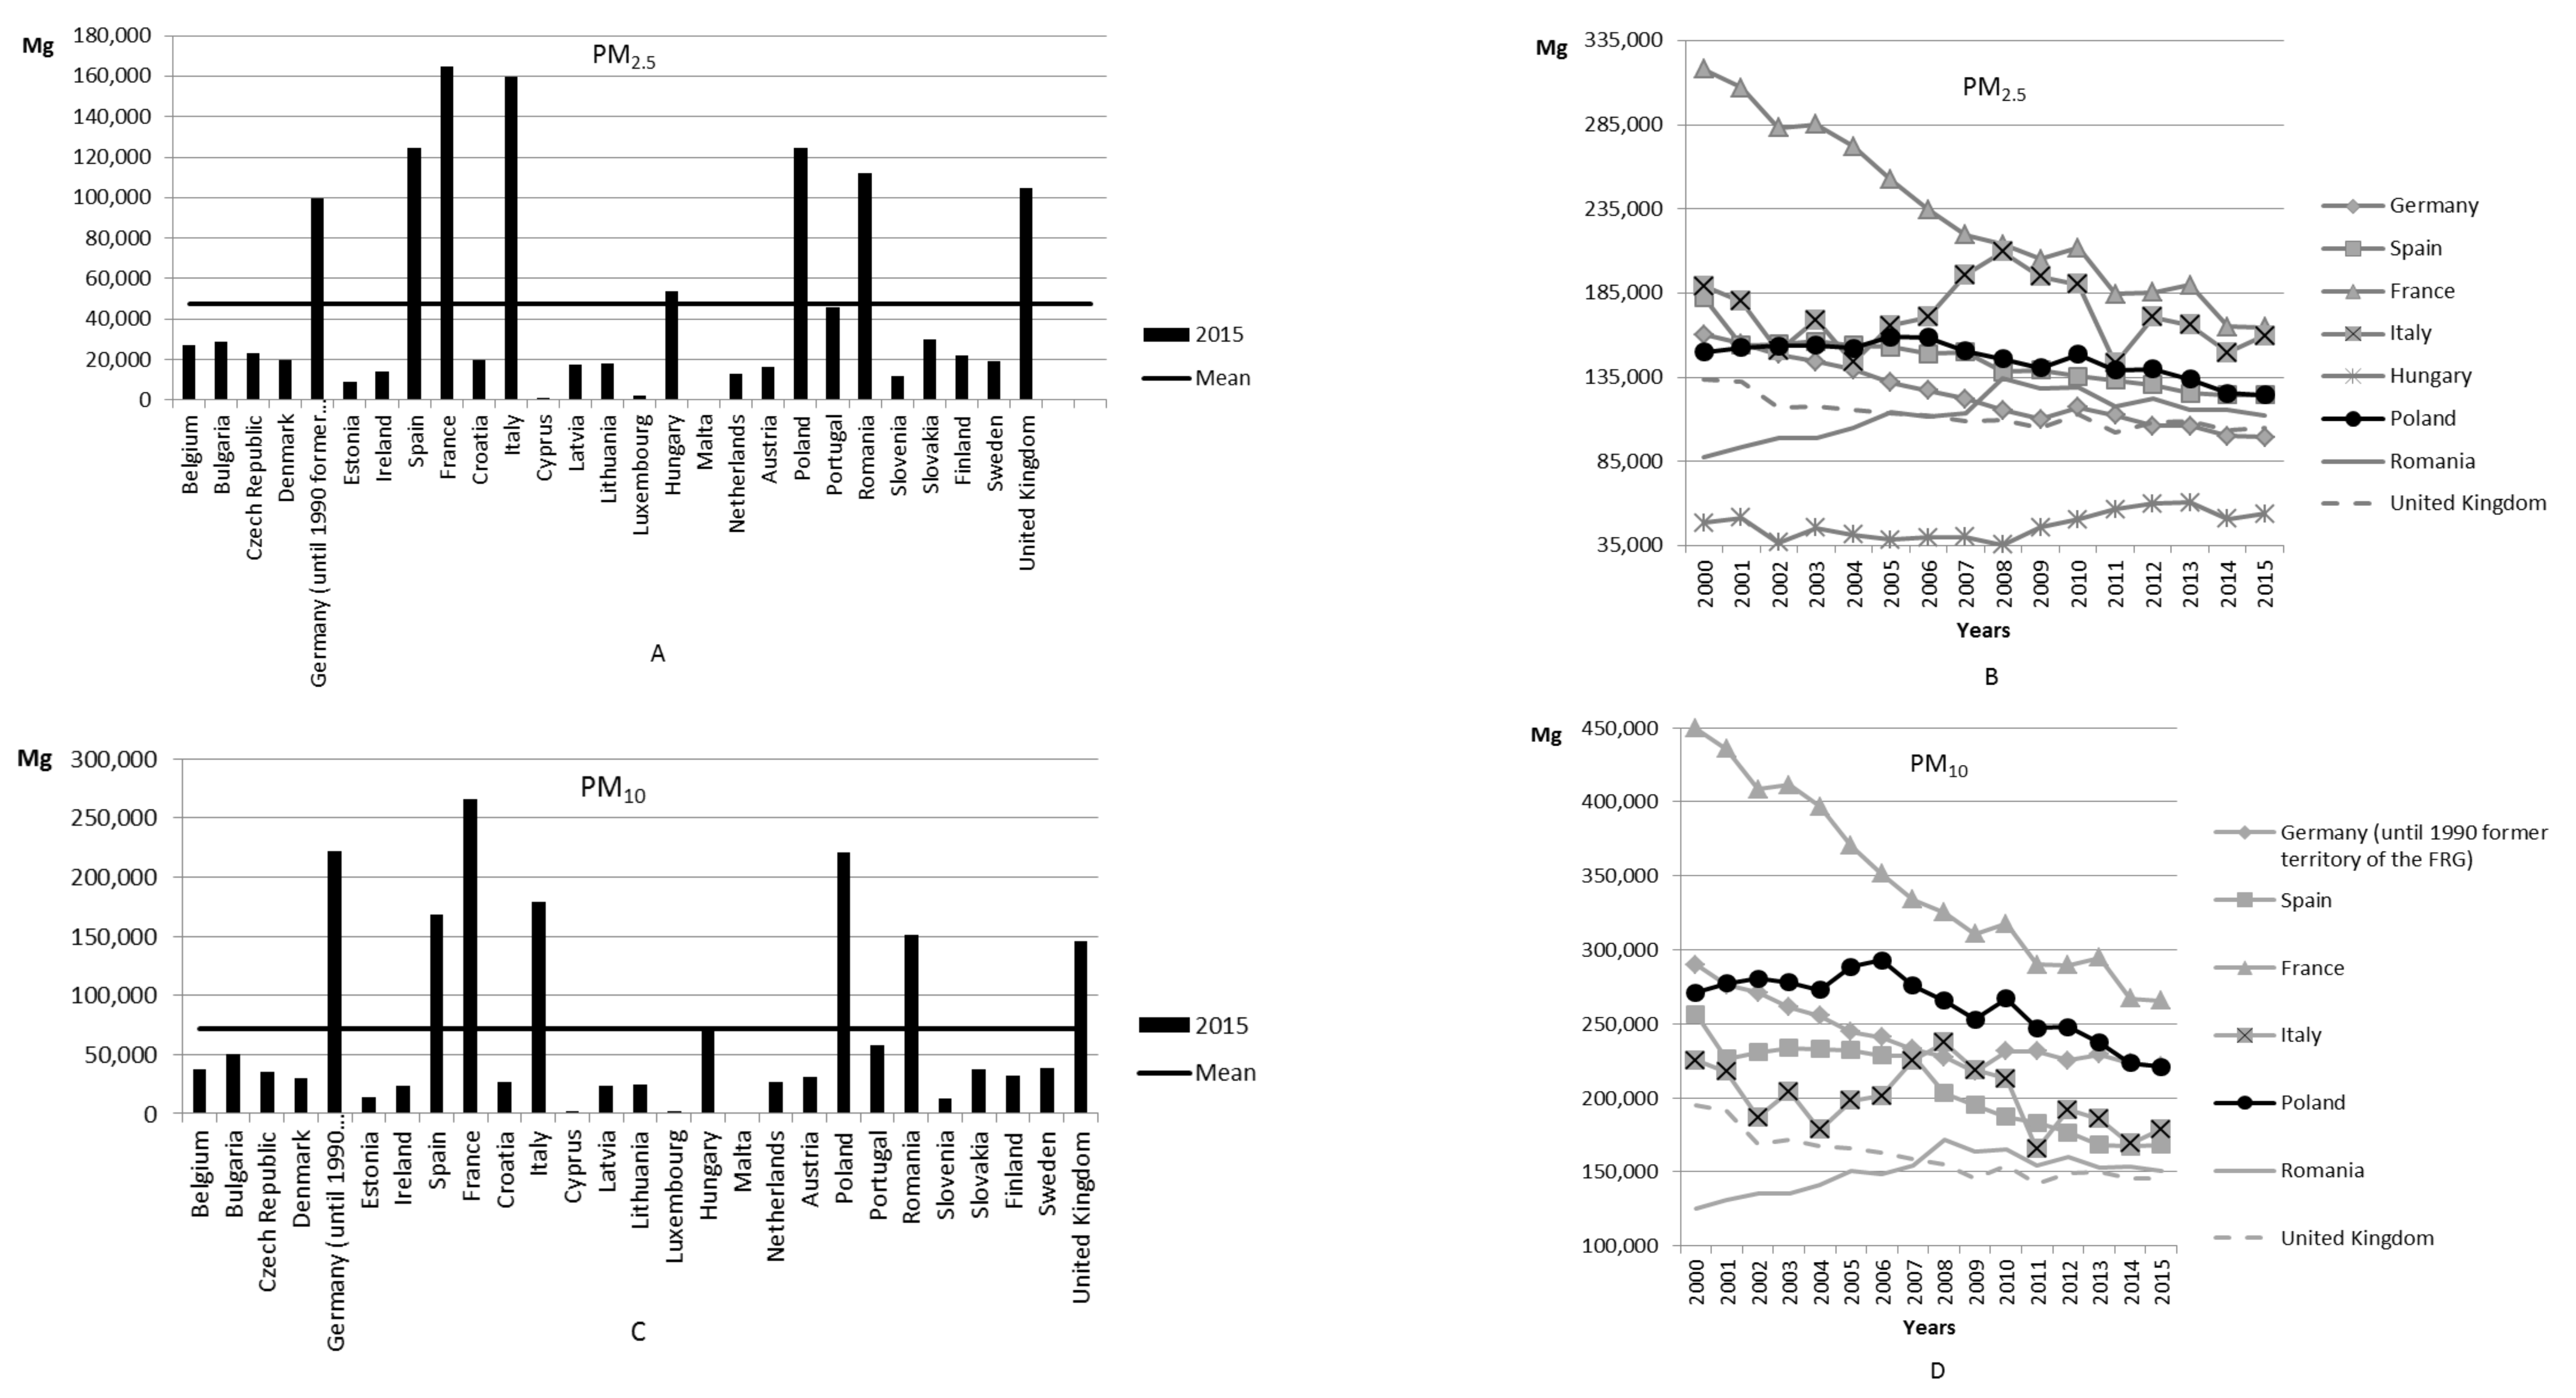
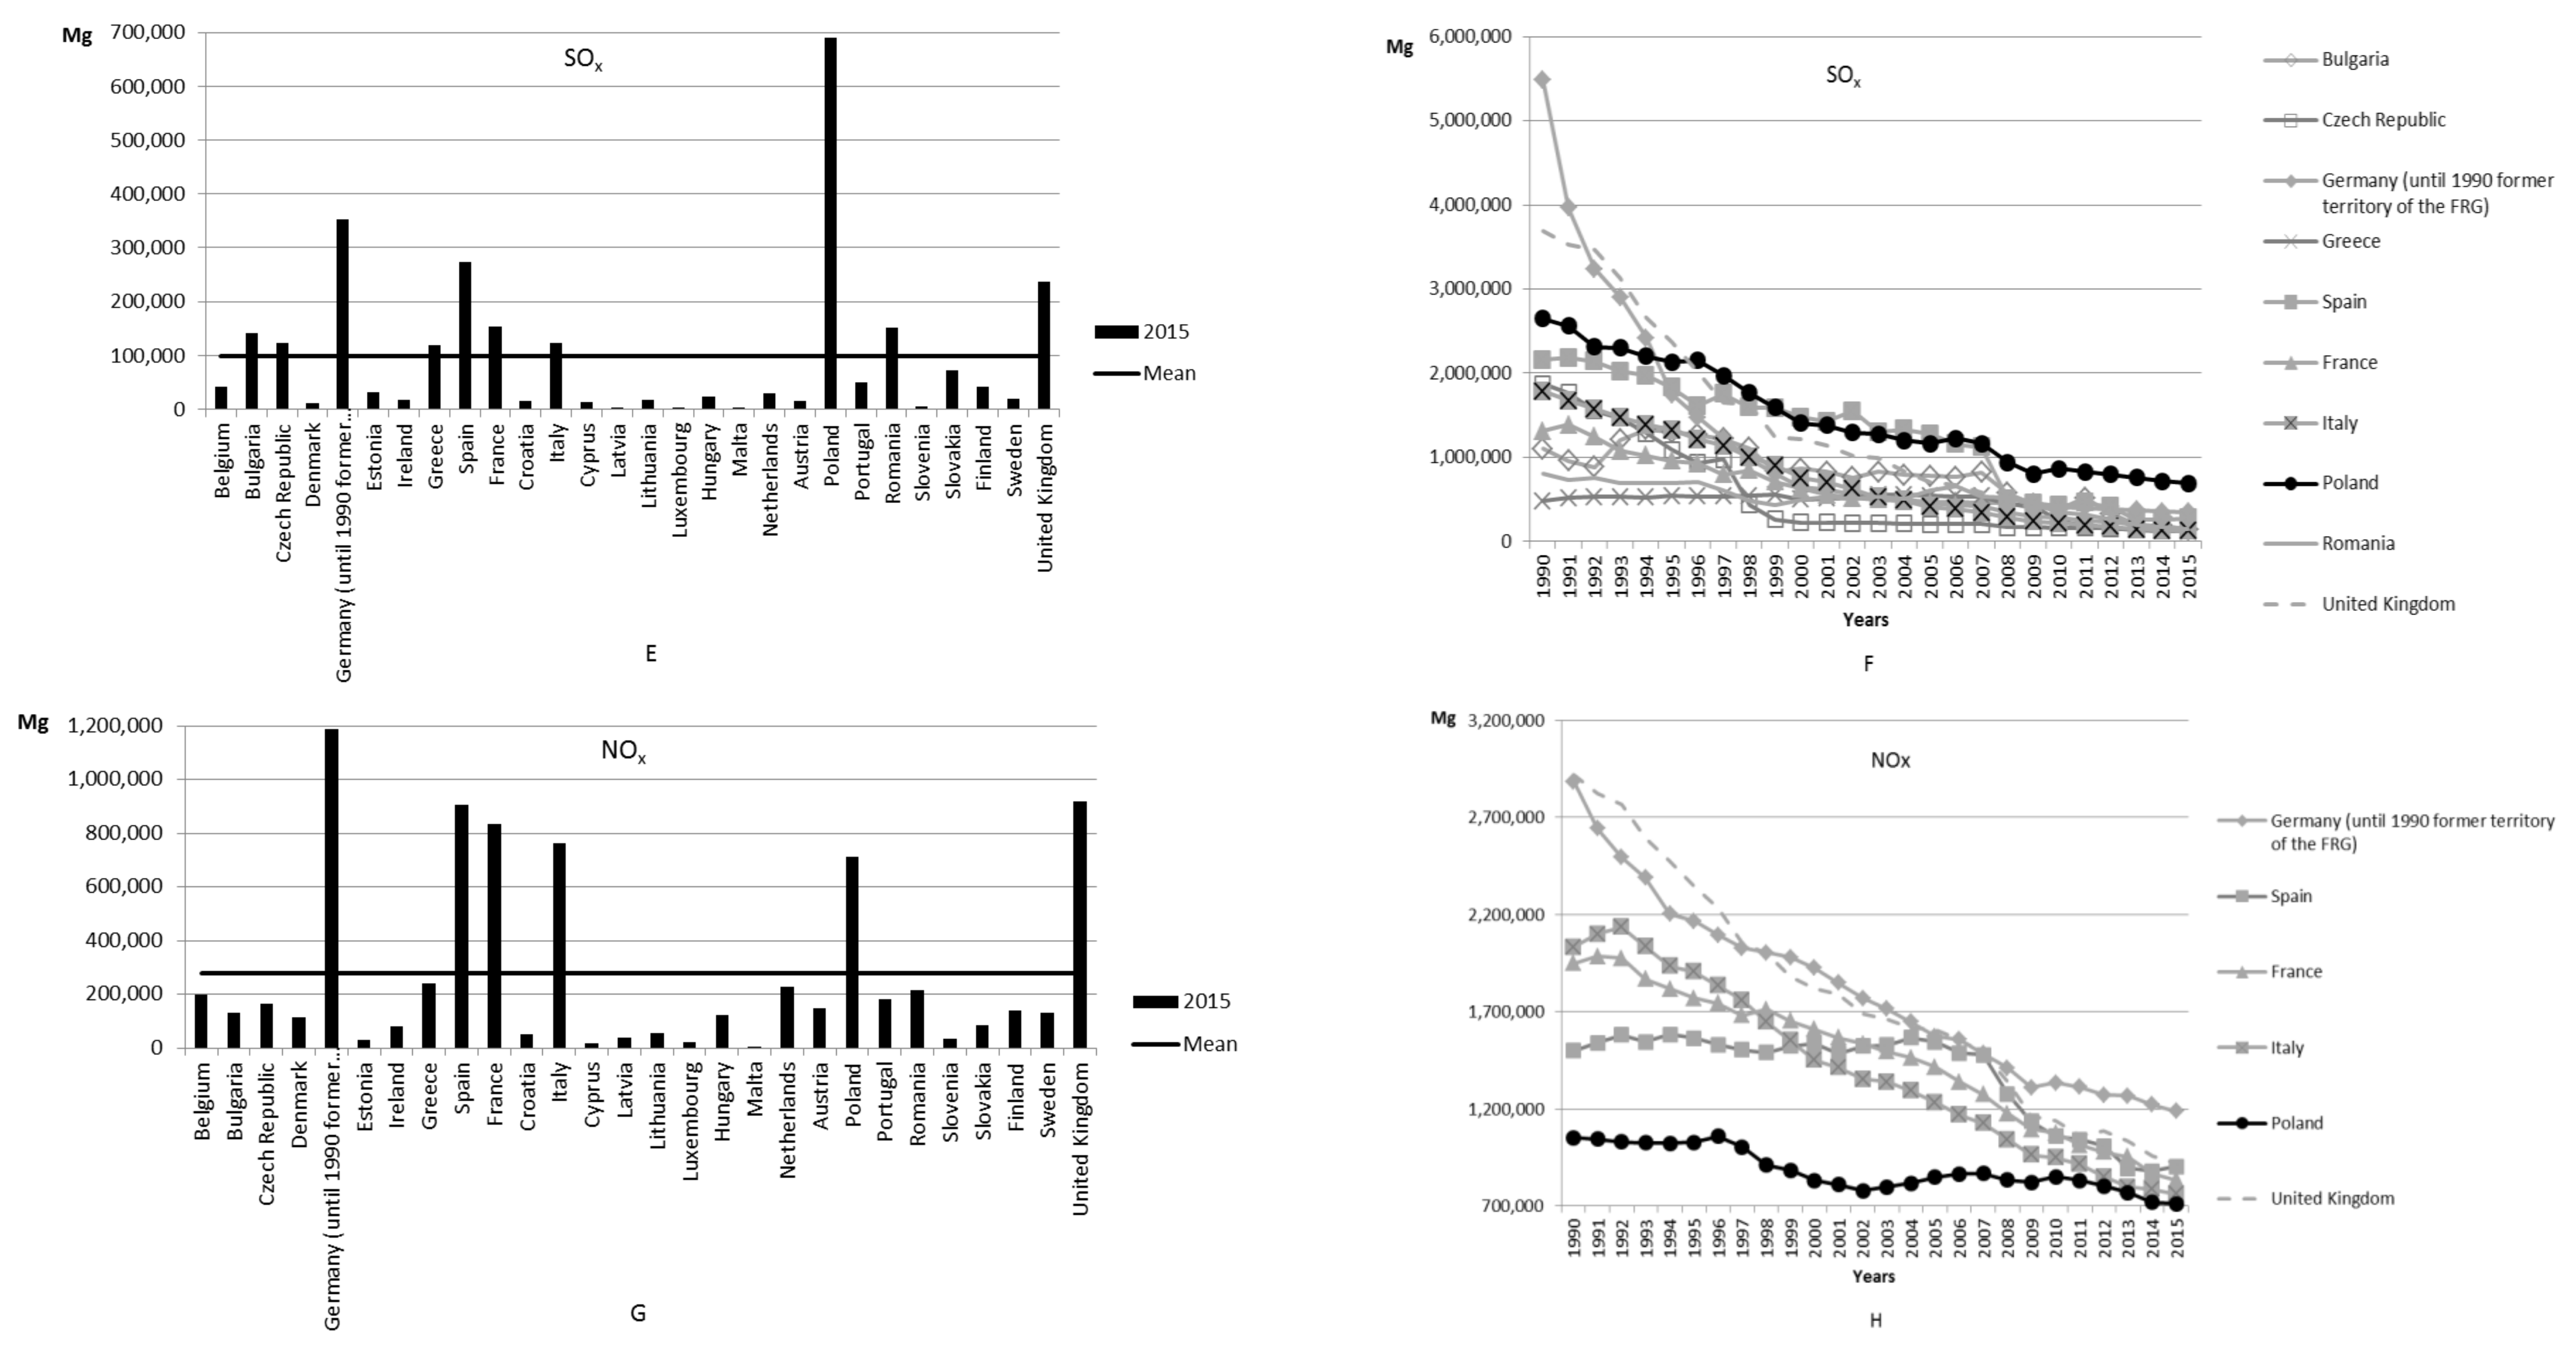
Figure 1.
The level of emission of gas pollutants in the European Union (A,C,E,G) in 2015 (B,D,F,H) for the largest issuers over the years (based on Eurostat data).
- Comparison of emission values of PM2.5 and PM10, sulphur oxides (SOx), and nitrogen oxides (NOx) in EU countries, taking into account all sectors and selecting countries where the emissions were higher than the arithmetic mean of the whole group,
- Analysis of the trend of emission changes among the selected group of countries identified as the largest issuers over the years (analysed time horizon was dependent on data availability). Major issuers were the following:
- Germany, Spain, France, Italy, Hungary, Poland, Romania, United Kingdom—total emissions of PM2.5 of these countries account for about 73% of total EU emissions (except Greece—no data) (Figure 1A)
- Germany, Spain, France, Italy, Poland, Romania, United Kingdom—total PM10 emissions of these countries account for about 70% of total EU emissions (except for Greece—no data) (Figure 1C)
- Bulgaria, Czech Republic, Germany, Greece, Spain, France, Italy, Poland, Romania, United Kingdom—total SOx emissions of the listed countries account for about 85% of total EU Member States emissions (Figure 1E)
- Germany, Spain, France, Italy, Poland, United Kingdom—total NOx emissions of these countries represent over 68% of the total EU Member States emissions (Figure 1G).
Based on charts (B, D, F, G) showing the volatility of individual volatile compounds among the largest issuers of EU Member States over the years, a decline in value has been observed for most countries. In addition, changes in emission values were analysed at five-year intervals. The results have been indicated in the tables below (Table 1, Table 2, Table 3 and Table 4).

Table 1.
Changing the PM2.5 emissions in selected EU countries in three successive five-year intervals, Mg (based on Eurostat data).
Table 2.
Change of PM10 dust emissions value in selected EU countries over three consecutive five-year intervals, Mg (based on Eurostat data).
Table 3.
Change of SOx emission in chosen EU countries in five consecutive 5-year intervals, Mg (based on Eurostat data).
Table 4.
Change of NOx emission in chosen EU countries in five consecutive 5-year intervals, Mg (based on Eurostat data).
In the four EU countries of Germany, Spain, France, and Great Britain, the decrease in PM2.5 and PM10 emitted to the atmosphere was observed in all three periods of analysis. This occurrence is in accordance with a general trend in all EU countries. The situation in Italy presents itself a bit less beneficially, where in 2010 an increase in emission of PM2.5 and PM10 in relation to 2005 was observed. Hungary, Romania, and Poland are the countries where an increase in the emission of dust was stated: in Poland and Romania (PM2.5 and PM10) in 2005 in relation to 2000, in Romania (PM2.5 and PM10) and Hungary (PM2.5) in 2010 in relation to 2005, and in Hungary (PM2.5) in 2015 in relation to 2010. It should thus be considered that those are the countries which joined the EU after 2000 (Hungary and Poland in 2004 and Romania in 2007). Thus they were later than other countries subjected to the regulations existing in the EU. In the case of Poland and Romania, there can be observed the positive influence of accession and compliance with rules (Directive 2008/50/EC [52], among others) on the reduction of dust emissions.
In most of the countries exceeding the EU average emission, reduction of sulphur oxides in the atmosphere in the five following periods can be observed. Only Bulgaria, Greece, and Romania experienced increases in emissions, respectively, in 1995 in comparison to 1990 (Bulgaria) and in 2005 in comparison to 2000 (Greece and Romania). In Poland a decrease of SOx emission could be observed in each of the 5-year periods.
In the case of nitrogen oxides emission, a decrease in emission in five consecutive periods could be observed in most of the EU countries. The exceptions were Spain, where an increase in NOx emission was observed in 1990–1995 and 2000–2005, and Poland, where that situation occurred in two consecutive periods: 2000–2005 and 2005–2010. It does not change the fact that the decreasing tendency in gas emission is apparent (Figure 1). In Poland, in 1990–2015 a decrease in NOx emission by more than 300,000 Mg was noted, which constitutes more than 32% of emission in the base (initial) year.
3.2. Changes in Dust and Gas Emission of Plants Especially Noxious in Chosen Voivodeships in Comparison to the Whole Country
The next stage was an analysis of changes of air pollutant emissions produced by especially noxious plants based on CSO (Central Statistical Office of Poland) data.
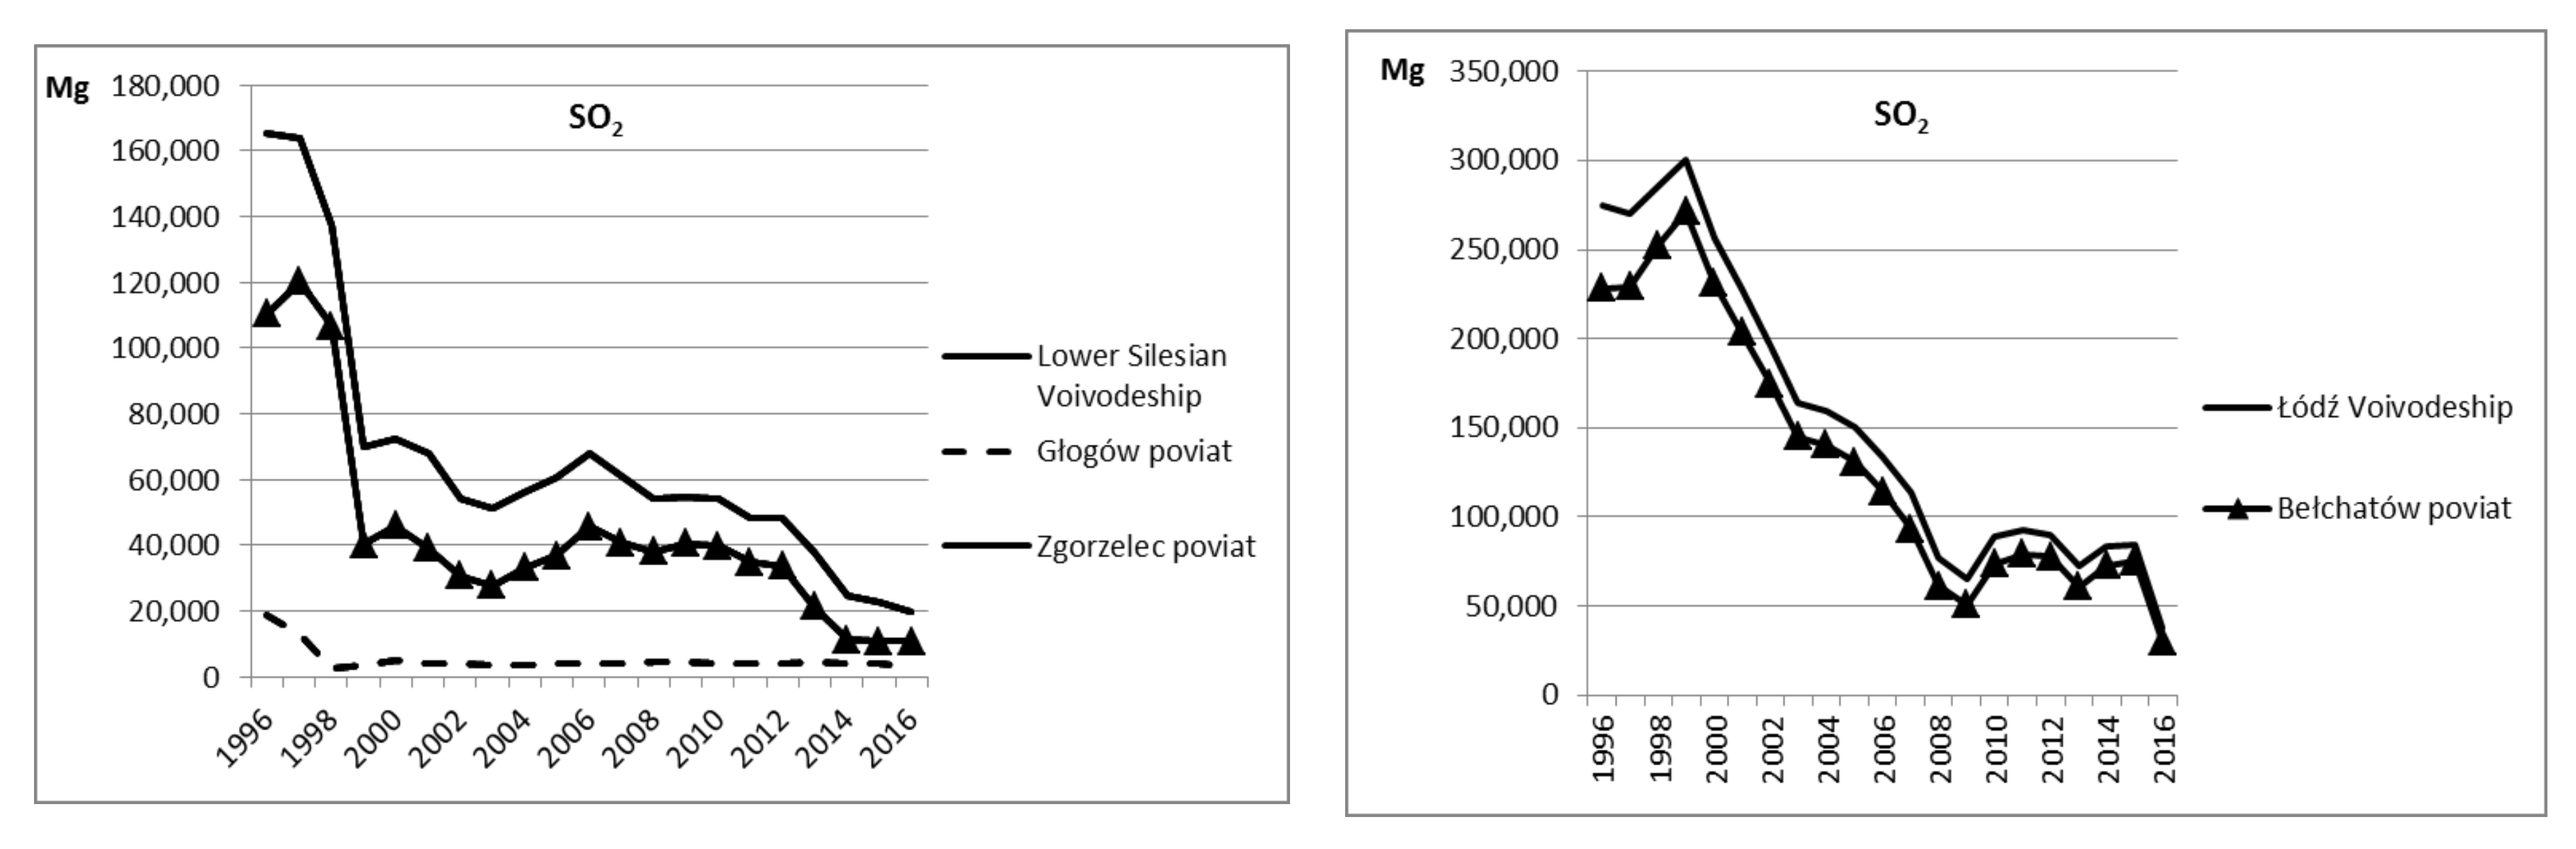
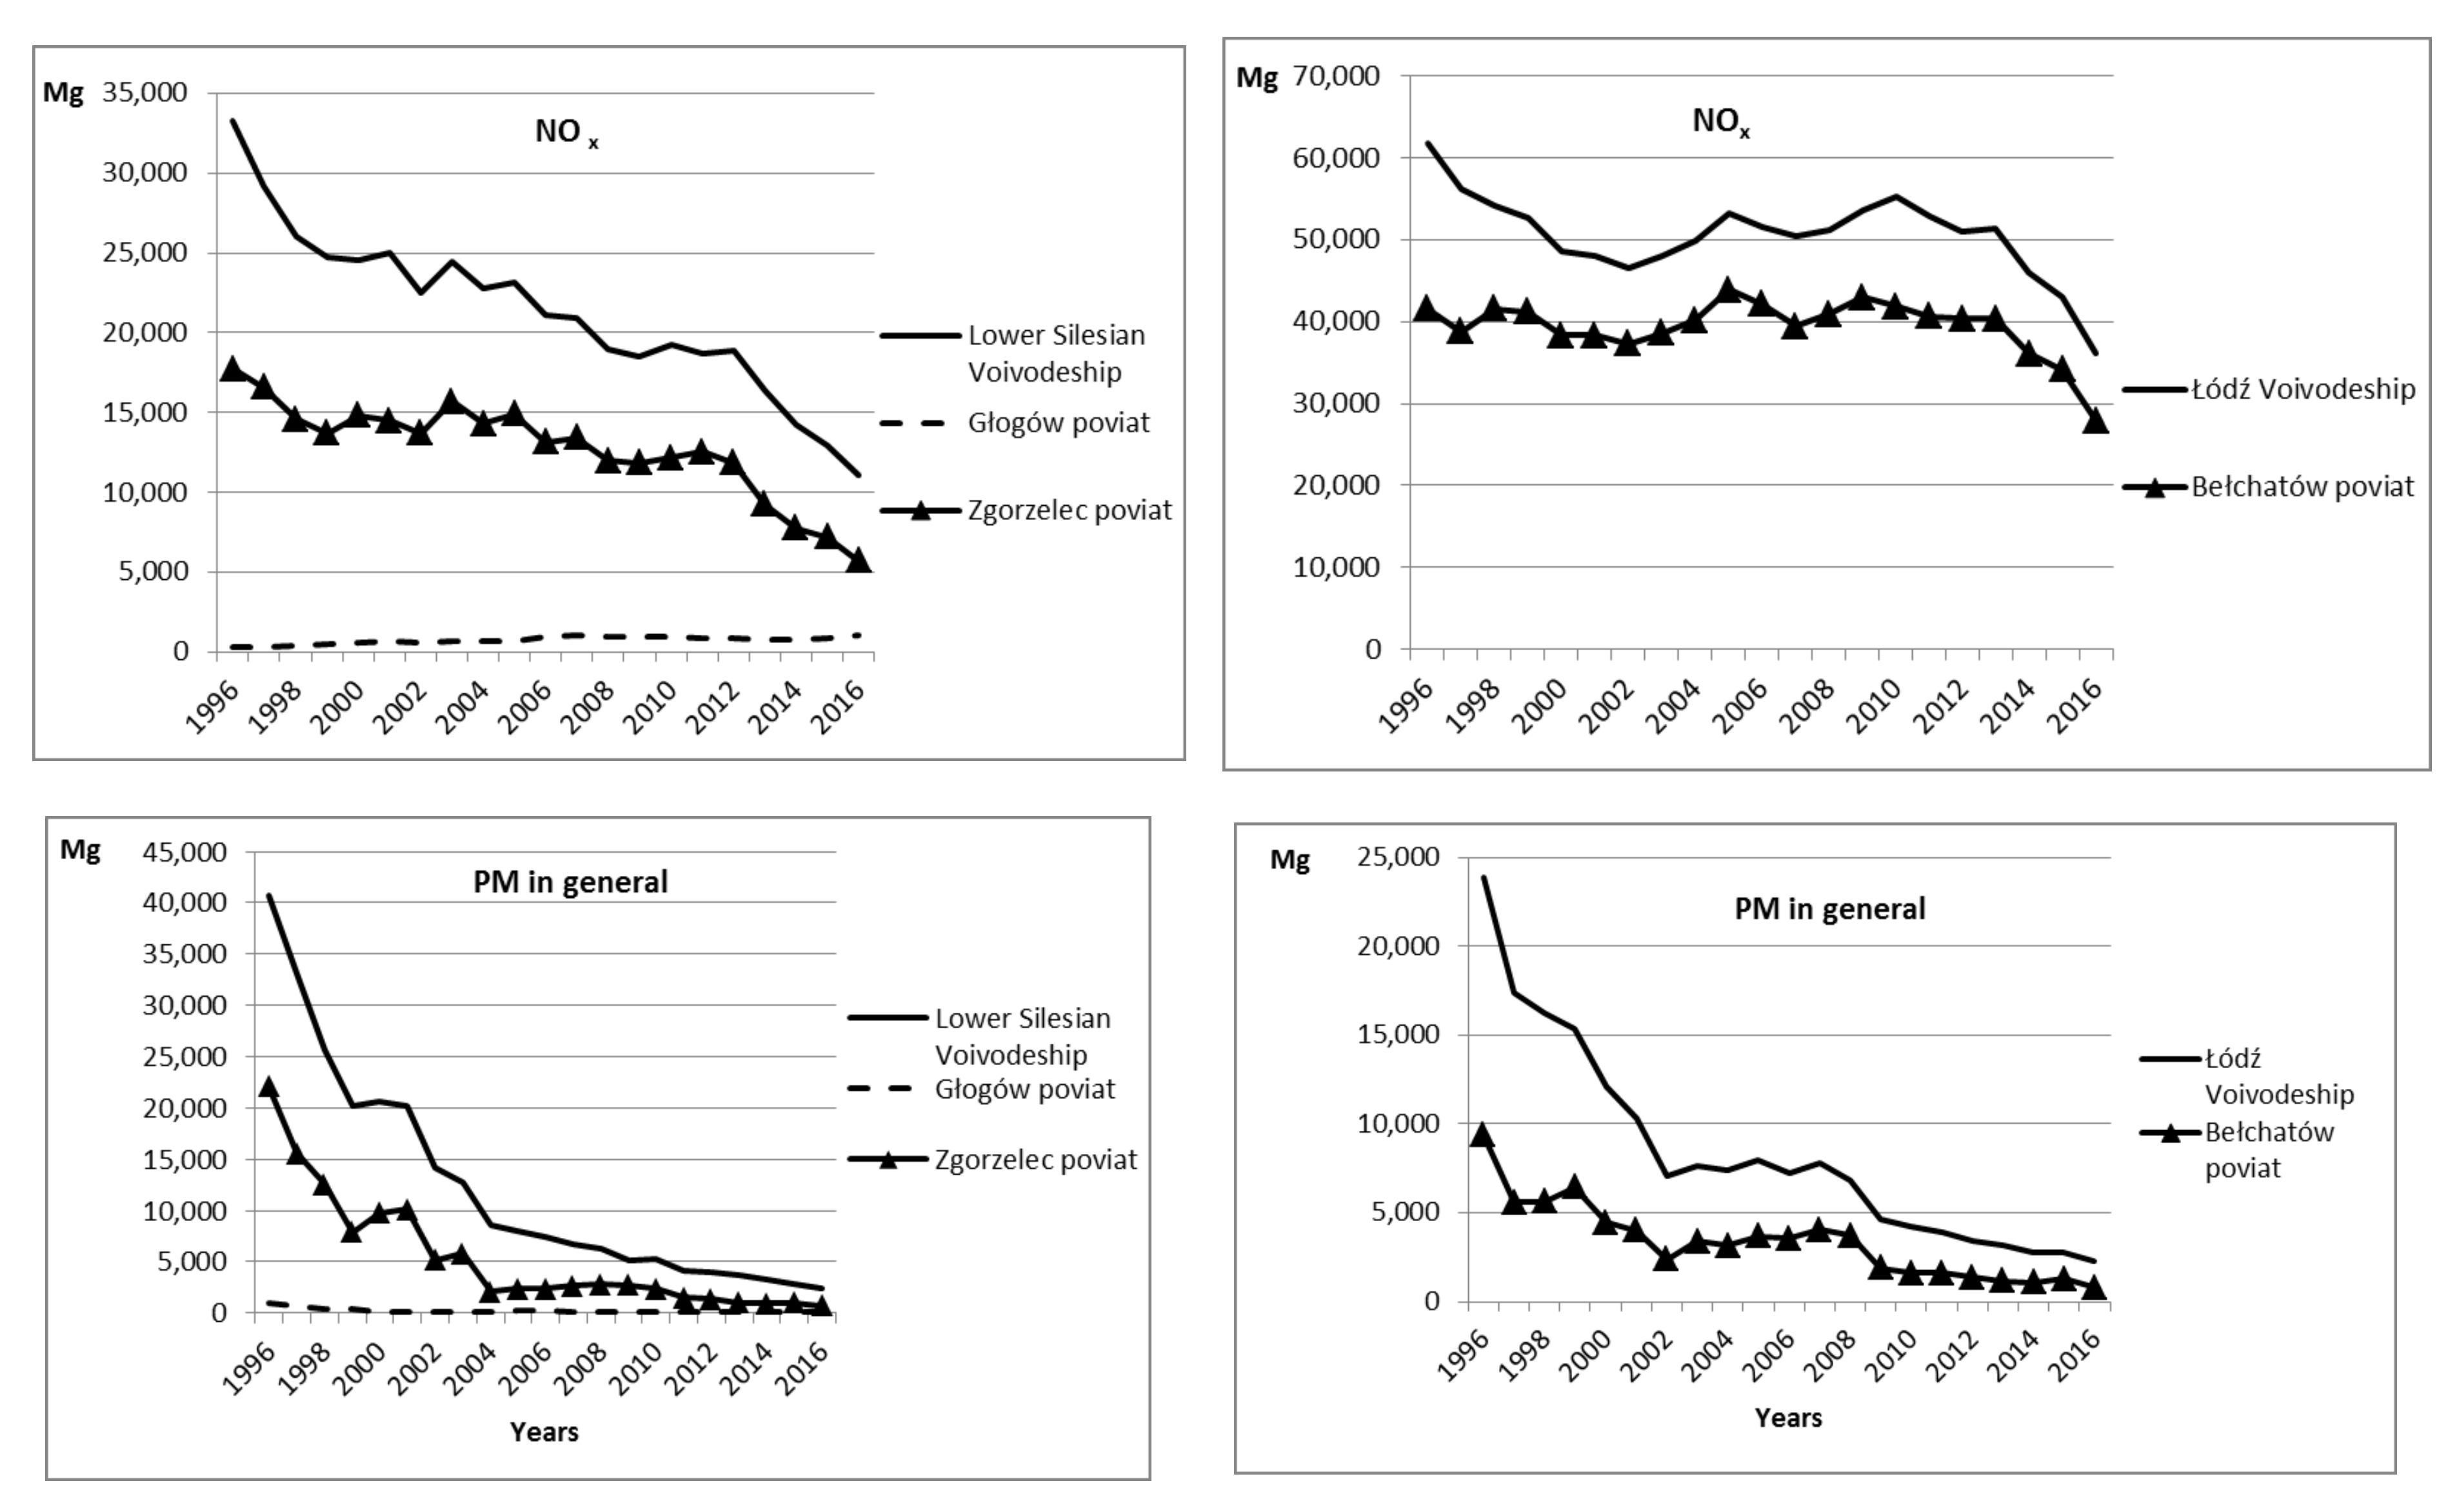
Based on the diagrams (Figure 2) it can be stated that, with an exception of NOx emission in Głogów county (poviat), the volume of harmful gases and dusts in air from plants especially noxious has decreased during the analysed years. In the case of dust in general, their amount in the air in Lower Silesian voivodeship from 1996 to 2016 decreased by 94% in relation to the base year—1996 (in Głogów county (poviat) (KGHM HM Głogów) by over 90%, in Zgorzelec county (poviat) (PGE Turów Power Plant) by almost 97% in relation to the yearly emission for a given territorial entity in 1996). In Łódzkie voivodeship, a decrease in dust emission by 90% in Bełchatów county (poviat) (PGE GiEK Bełchatów Power Plant) by more than 91%) was observed. Sulphur oxides emission decreased in Lower Silesian voivodeship by almost 88% (in Głogów county by about 84%, in Zgorzelec county by 90%) and in Łódzkie voivodeship by 86% (in Bełchatów county by almost 87%). On the other hand, a decrease in nitrogen oxides emission in Lower Silesian voivodeship was by almost 67% (in Zgorzelec county by 68%), in Łódzkie voivodeship by about 41% (in Bełchatów county by 33%). As it was mentioned earlier, NOx emission in Głogów county increased by three times but it is still at the lowest level among the analysed areas. On the basis of the elaborated diagrams (Figure 2) it can be stated that the emission from HM Głogów constitutes a small part in the total emission of both gases and dusts in Lower Silesian voivodeship. At the same time it is clear that the plants especially noxious in both voivodeships are those belonging to Capital Group PGE. Power plants are responsible for the character of curve fluctuation for particular voivodeships. At the same time, their influence on decreasing the emission level in the region is the biggest.


Figure 2.
Changes in emission of plants especially noxious in chosen counties (poviats) of Lower Silesian voivodeship and Łódzkie voivodeship in 1996–2016 (based on CSO data).
How do industrial entities deal with limiting their negative influence on the environment? The processes have many stages starting from improvement of the fuel quality (purification of coal), implementation of modern combustion techniques, and modernisation, and ending with the stage post-combustion using technology of control and reduction of emissions. The detailed information can be found in the work by [47,49]. Through these processes, combustion of coal in industrial installations becomes less harmful to the natural environment. It is even more essential since coal is the most common fossil fuel at quite stable and relatively low prices [53]. PGE installations are currently operating in accordance with the emission standards presented in the Directive 2010/75/EU of the European Parliament and the Council on industrial emissions from 24 November 2010 (Industrial Emissions Directive—IED [54] or using derogation provisions (additional time for technical adjustment to the emission requirements). In response to the directive, the Decree of the Minister of Environment from 4 November 2014 was prepared regarding some of the types of combustion installations, sources of fuel combustion, and waste combustion or co-combustion equipment. To produce electricity, power plants have to adapt to the requirements of legal acts, they take great care about the improvement of coal quality, implement modern combustion technologies, and control and reduce pollution emissions [46]. The actual emissions of SO2, NOx, and dusts by PGE in 2016 were lower than acceptable standards for emission to the atmosphere [29]. This happens due to, e.g., higher efficiency of desulphurisation and denitrogenisation installations in power plants run by fossil fuels which prevent large emissions of gases harmful to humans. Referring to PGE GiEK, over the years1989 and 2016, the company drastically reduced air pollutants’ emissions: SO2 emission by 94%, NOx emission by 60%, dusts emission by 99% (this concerns all the power plants: Bełchatów, Opole, Turów and Dolna Odra), which is included in the report [29]. It complies with the analysis made on the basis of CSO data. The discussed companies are involved in an active policy of support for OZE. In the case of PGE, the company responsible for the sector of renewable energy is PGE Energia Odnawialna S.A. KGHM, on the other hand, due to the extraction of nonenergy raw materials, is involved in works on effective usage of local energy resources in renewable energy sources, having for this purpose joined Zgorzelecki Cluster for Development of Renewable Energy Sources and Energy Efficiency in 2017. The main aim of this initiative is to implement new technologies in the area of energy storage, photovoltaic technologies, or building generation units and development of electromobility. Moreover, Energetyka sp. z o.o. belonging to the Capital Group KGHM PM S.A., one of the biggest heating companies in Lower Silesia, launched an energy willow plantation on the lands owned by KGHM located mostly around smelters as a sign of care about ecology and requirements of the EU on environmental protection [55]. Production of energy for the internal needs of KGHM in the new biogas plant in Głogów county is also planned [56]. PGE is a leader in electricity production from renewable sources in Poland. It uses the power of wind (14 wind farms), water (29 hydropower plants with run-of-river systems and 4 pump storage hydro power stations) and sun (1 photovoltaic plant). Including biomass input, PGE constitutes about 10% of market share. Current electricity capacity of renewable energy of PGE Group amounts almost to 1 GW. More about the initiatives of companies with respect to the environment may be found in the work of [2], where the values of environmental indicators (according to the Global Reporting Initiative) regarding CO2, SOx, NOx, and PMx emissions and produced waste and wastewater were analysed in detail. Moreover, taking into consideration the environmental aspect, the usage of energy by companies with characterization of fuel balance in relation to generation units was presented in the work.
4. Conclusions
The article presents the gist of the emission of dust and gas pollutants (SOx, NOx, PMx) in Poland on a local, national, and international (at the background of EU countries) scale. Local emissivity is represented by the two selected mining industry potentates: KGHM and PGE, the activities and initiatives of which reveal an effective fight against emissivity targeted at purer production (over the years). The social role of these enterprises and their efforts to reduce the emission of dusts and gases were highlighted. Dedusting and desulphurisation of the exhaust gases are used in the industrial installations. The process of combustion itself is so effective that not coal smoke, as it is wrongly recognised, but water vapour comes out of the chimneys of coal power plants. The national race with the emissions of Polish industry on the international scene was presented. Although Poland achieved significant successes in reducing the emission of gas and dust substances, it still is, and according to the prognosis, will continue to be among the EU countries with the highest emission rate. The article does not consider in detail the technological aspects to reduce the emissions of pollutants. The work is also intended to show the effectiveness of the actions aimed at the reduction of dust and gas emissions, the source of which is the industry. Because of the domestic fuel mix based on domestic and imported coal as well as due to the article’s results, this trend is characterized as decreasing. This is confirmed by detailed emission analyses based on data published in the integrated report of companies [2]. The domestic emission rate is clearly decreasing, being a reflection of the multistage efforts undertaken by our country to catch up with the EU standards regarding care for the environment. Although coal fuels are used in the domestic electricity balance (point emissivity), the ultimate aim is to reduce the emission of harmful dusts and gases to the atmosphere. To this end, we emphasize the significance of low emission (surface emissivity) from households which pollute the local environment the most (significant dust emission) by uncontrolled combustion of fuel (mainly imported fuel) of low quality and with addition of waste (illegal activity). At present, there are no legal central solutions regarding quality of incinerated fuels, which, according to the authors, should be the activity carried out at a national level (legislation). Permanent emissions (of the biggest issuers) were not as severe as seasonal emissions caused by smog in the recent heating seasons in Poland when there were announcements to avoid coming out of one’s house due to significant air pollution. In summary, the mining industry has a constantly high impact on pollution, but also indirectly on the inhabitants and on the monuments [57]. Power plants and processing plants reduce emissions, but low-quality fossil fuel burned in noncompliant household furnaces supports the growth of dust pollution.
Acknowledgments
This scientific work was financed within Statute Research Studies (order 0402/0010/17 and 0401/0124/17).
Author Contributions
The paper is a result of joint cooperation.
Conflicts of Interest
The authors declare no conflict of interest.
References
- Pactwa, K.; Woźniak, J. Environmental reporting policy of the mining industry leaders in Poland. Resour. Policy 2017, 53, 201–207. [Google Scholar] [CrossRef]
- Woźniak, J.; Pactwa, K. Environmental activity of mining industry leaders in Poland in Line with the principles of sustainable development. Sustainability 2017, 9, 1903. [Google Scholar] [CrossRef]
- Woźniak, J. Level of use of guidelines for integrated reporting ES (G) data in the mining industry and vertically integrated operators in the energy value chain in Poland. Zeszyty Naukowe Instytutu Gospodarki Surowcami Mineralnymi I Energią Polskiej Akademii Nauk 2017, 97, 189–200. (In Polish) [Google Scholar]
- Carroll, A.B. Corporate social responsibility: Evolution of a definitional construct. Bus. Soc. 1999, 38, 268–295. [Google Scholar] [CrossRef]
- Eccles, R.G.; Krzus, M.P. One Report: Integrated Reporting for a Sustainable Strategy; John Wiley & Sons: Hoboken, NJ, USA, 2010. [Google Scholar]
- Jaworska, E. Change in the approach to reporting in the context of corporate social responsibility. Zeszyty Naukowe Uniwersytetu Szczecińskiego Finanse, Rynki Finansowe, Ubezpieczenia 2011, 41, 574–583. [Google Scholar]
- Szczepankiewicz, E.I. Evolution of reporting enterprises—Problems comparability in integrated report on sustainability and socially responsible companies. Zeszyty Naukowe Uniwersytetu Szczecińskiego Finanse, Rynki Finansowe, Ubezpieczenia 2014, 71, 135–148. [Google Scholar]
- Szczepankiewicz, E.; Mućko, P. CSR reporting practices of Polish energy and mining companies. Sustainability 2016, 8, 126. [Google Scholar] [CrossRef]
- The European Parliament; The Council of the European Union. Directive 2014/95/EU of the European Parlament and of the Council of 22 October 2014 amending Directive 2013/34/EU as Regards Disclosure of Non-financial and Diversity Information by Certain Large Undertakings and Groups. Available online: http://eur-lex.europa.eu/legal-content/EN/TXT/PDF/?uri=OJ:JOL_2014_330_R_0001&from=EN (accessed on 10 September 2017).
- Jenkins, H.; Yakovleva, N. Corporate social responsibility in the mining industry: Exploring trends in social and environmental disclosure. J. Clean. Product. 2006, 14, 271–284. [Google Scholar] [CrossRef]
- Kemp, D.; Owen, J.R.; van de Graaff, S. Corporate social responsibility, mining and “audit culture”. J. Clean. Product. 2012, 24, 1–10. [Google Scholar] [CrossRef]
- Owen, J.R.; Kemp, D. Corporate character formation and CSR: The function of habit and practice in the mining industry. Am. J. Ind. Bus. Manag. 2014, 4, 223–233. [Google Scholar] [CrossRef]
- Hilson, G. Corporate social responsibility in the extractive industries: Experiences from developing countries. Resour. Policy 2012, 37, 131–137. [Google Scholar] [CrossRef]
- Dilling, P. Reporting on long-term value creation—The example of public Canadian energy and mining companies. Sustainability 2016, 8, 938. [Google Scholar] [CrossRef]
- GRI G4, Sustainability Reporting Guidelines, Reporting Principles and Standard Disclosures, 2013a. Available online: https://www.globalreporting.org/resourcelibrary/GRIG4-Part1-Reporting-Principles-and-Standard-Disclosures.pdf (accessed on 31 October 2016).
- GRI G4, Sector Disclosures, Mining and Metals, 2013b. Available online: https://www.globalreporting. org/resourcelibrary/GRI-G4-Mining-and-Metals-Sector-Disclosures.pdf (accessed on 5 December 2016).
- Report KPMG I FOB, Corporate Social Responsibility: Facts and Opinions. CSR by the Eyes of Large and Medium Companies in Poland. 2014. Available online: https://home.kpmg.com/pl/ [In Polish] (accessed on 5 October 2017).
- Cannistraro, A.; Cannistraro, G.; Cannistraro, M.; Galvagno, A.; Trovato, G. Evaluation on the convenience of a citizen service distric heating for residential use. A new scenario introduced by high efficiency energy systems. Int. J. Heat Technol. 2015, 33, 167–172. [Google Scholar] [CrossRef]
- Cannistraro, G.; Cannistraro, M.; Galvagno, A.; Trovato, G. Technical and economic evaluation the integrations of co-trigeneration system in the dairy industry. Int. J. Heat Technol. 2016, 34, s332–s336. [Google Scholar] [CrossRef]
- Dzikuć, M. Problems associated with the low emission limitation in Zielona Góra (Poland): Prospects and challenges. J. Clean. Product. 2017, 166, 81–87. [Google Scholar] [CrossRef]
- Sówka, I.; Pachurka, Ł.; Przepiórka, M.; Rogula-Kozłowska, W.; Zwoździak, A. Assessment of the Short-term Influence of Particulate Matter Concentrations on the Health of the Inhabitants of Wroclaw. Annual Set The Environment Protection Rocznik Ochrona Środowiska 2016, 18, 603–615. [Google Scholar]
- Cannistraro, G.; Cannistraro, M.; Cannistraro, A. Evaluation of the sound emissions and climate acoustic in proximity of one railway station. Int. J. Heat Technol. 2016, 34. [Google Scholar] [CrossRef]
- Cieślik, E.M.; Konieczny, T. Emissions from co-combustion of coal and municipal solid waste in domestic central heating boiler. Inżynieria Ekol. Ecol. Eng. 2017, 18, 9–13. [Google Scholar] [CrossRef]
- HEAL Health and Environment Alliance, Coal Incierate at Home Furnaces Health Hazards. 2014. Available online: http://www.env-health.org/IMG/pdf/spalanie_wegla_w_domowych_piecach_-_zagrozenia_zdrowotne__health_and_environment_alliance_2014.pdf [In Polish] (accessed on 10 October 2017).
- Chlebowska, S.; Sówka, I.; Kobus, D.; Pachurka, Ł. Analysis of concentrations trends and origins of PM10 in selected European cities. E3S Web Conf. 2017, 17. [Google Scholar] [CrossRef]
- Report ClientEarth, 2014. Air Assessment in Poland—Report on Selected Issues Related to Air Quality in Poland and Collection of Local Fees and Spa Fees, and on Subsidies Granted to Health Resorts Commune. Available online: https://www.pl.clientearth.org/cena-zlego-powietrza/ [In Polish] (accessed on 5 October 2017).
- EEA Report. Air Quality in Europe—Report No 13/2017; European Environment Agency: Copenhagen, Denmark, 2017; Available online: https://www.eea.europa.eu/publications/air-quality-in-europe-2017 (accessed on 17 October 2017).
- Report by KGHM, 2016. Available online: http://kghm.com/pl/zrownowazony-rozwoj/raporty-i-zasoby, [In Polish] (accessed on 22 October 2017).
- Report by PGE, 2017. Available online: http://raportzintegrowany2016.gkpge.pl/ [In Polish] (accessed on 2 October 2017).
- Polityka Ranking, List of 500. 50 Most Profitable Companies in 2012. Available online: http://www.lista500.polityka.pl (accessed on 5 October 2017).
- Report: CE TOP 500, 2016. Available online: https://www2.deloitte.com/pl/pl/pages/finance/articles/ce-top-500-2016.html (accessed on 5 October 2017).
- Eurostat. Available online: http://ec.europa.eu/eurostat (accessed on 2 October 2017).
- The Act of 27 April 2001. Environmental Protection Law J. Laws 2001 No 62 item 627 (as amended) [in Polish]. Available online: http://prawo.sejm.gov.pl/isap.nsf/DocDetails.xsp?id=WDU20010620627 (accessed on 12 April 2018).
- Report on the State of the Environment in the Lower Silesian Voivodeship in 2015. Available online: http://www.wroclaw.pios.gov.pl [In Polish] (accessed on 12 October 2017).
- Report on the State of the Environment in the Lodz Voivodeship in 2015. Available online: http://www.wios.lodz.pl [In Polish] (accessed on 12 October 2017).
- Konieczyński, J. Properties of Respirable Dust Emitted from Selected Installations. Institute of Environmental Engineering of the Polish Academy of Sciences. Works & Studies/Prace i Studia. No. 79 Editor-in-Chief Czesława Rosik-Dulewska. 2010. Available online: http://ipis.pan.pl/dokumenty/pis/m79.pdf (accessed on 10 October 2017).
- Badyda, K.; Niewiński, G.; Patrycy, A.; Orzeszek, W. Attempt to estimate the costs of implementing BAT conclusions for large combustion plants. Nierówności Społecz. Wzrost Gospod. 2016. [Google Scholar] [CrossRef]
- Fugiel, A.; Burchart-Korol, D.; Czaplicka-Kolarz, K.; Smoliński, A. Environmental impact and damage categories caused by air pollution emissions from mining and quarrying sectors of European countries. J. Clean. Product. 2017, 143, 159–168. [Google Scholar] [CrossRef]
- Weber, G.; Cabras, I. The transition of Germany’s energy production, green economy, low-carbon economy, socio-environmental conflicts, and equitable society. J. Clean. Product. 2017, 167, 1222–1231. [Google Scholar] [CrossRef]
- Pacesila, M.; Burcea, S.G.; Colesca, S.E. Analysis of renewable energies in European Union. Renew. Sustain. Energy Rev. 2016, 56, 156–170. [Google Scholar] [CrossRef]
- Jurdziak, L. Are we threatened by fuel poverty? Energy purchase costs and income per capita of the EU citizen. Polit. Energ. 2012, 15, 23–50. [Google Scholar]
- Ma, D.; He, F.; Li, G.; Chen, L. Estimation and comparative analysis of environmental efficiency in China, with and without consideration of haze. Pol. J. Environ. Stud. 2018, 27, 201–211. [Google Scholar] [CrossRef]
- Olkuski, T. Analysis of electricity production in France and Poland. Polit. Energ. 2013, 16, 143–154. [Google Scholar]
- Report on the activity of the President of URE in 2016. Biuletyn Urzędu Regulacji Energetyki. Available online: https://www.ure.gov.pl/pl/urzad/informacje-ogolne/aktualnosci/7032,Sprawozdanie-z-dzialalnosci-Prezesa-URE-w-2016-r-juz-dostepne-w-internecie.html (accessed on 16 October 2017).
- KPOP, National Air Protection Program until 2020 (with Perspective to 2030). Ministerstwo Środowiska 2015. Available online: https://www.mos.gov.pl/srodowisko/ochrona-powietrza/krajowy-program-ochrony-powietrza/ [In Polish] (accessed on 16 October 2017).
- Michalak, J. Selected aspects of the influence of power plant on environment. Prz. Elektrotech. 2014. [Google Scholar] [CrossRef]
- Czachor, K.; Chudy, P. Methodological Guide in Terms of PRTR for Fuel Combustion Plants; pp. 1–130. Available online: http://www.gios.gov.pl/images/dokumenty/prtr/Poradnik_metodyczny_w_zakresie_PRTR_dla_Instalacji_spalania_paliw.pdf [In Polish] (accessed on 10 October 2017).
- Mokrzycki, E.; Uliasz-Bocheńczyk, A. Emission free power plant? Polit. Energ. 2006, 9, 611–619. [Google Scholar]
- Boba, J.; Jurka, T.; Passia, H. Emissions of gas and dust pollutants in the national power industry from 2005–2011—Results of questionnaire survey. Polit. Energ. 2014, 17, 93–112. [Google Scholar]
- Wojdyga, K.; Chorzelski, M.; Rozycka-Wronska, E. Emission of pollutants in flue gases from Polish district heating sources. J. Clean. Product. 2014, 75, 157–165. [Google Scholar] [CrossRef]
- Cannistraro, G.; Cannistraro, A.; Cannistraro, M.; Galvagno, A.; Trovato, G. Analysis of the air pollution in the urban center of four cities Sicilian. Int. J. Heat Technol. 2016, 34. [Google Scholar] [CrossRef]
- Directive 2008/50/EC of the European Parliament and of the Council of 21 May 2008 on ambient air quality and cleaner air for Europe. Available online: https://eur-lex.europa.eu/legal-content/EN/TXT/?uri=CELEX:32008L0050 (accessed on 9 April 2018).
- Lorenz, U. Consequences of Hard Coal Combustion for the Environment and Methods of their Reduction; Mat. Szkoły Eksploatacji Podziemnej. Sympozja i Konferencje nr 64. Wyd. Instytut GSMiE PAN: Kraków, Poland, 2005; pp. 97–112. Available online: https://se.min-pan.krakow.pl/publikacje/05_02ul_sep.pdf [in Polish] (accessed on 9 April 2018).
- Directive 2010/75/EU of the European Parliament and the Council of 24 November 2010 on industrial emission.(integrated pollution prevention and control). Available online: https://www.google.com.hk/url?sa=t&rct=j&q=&esrc=s&source=web&cd=3&ved=0ahUKEwjrrtbvv7TaAhVHV7wKHUwwCX0QFggyMAI&url=https%3A%2F%2Fwww.energy-community.org%2Fdam%2Fjcr%3A32f06165-f591-442f-9a38-4f4a5e975136%2FDirective_2010_75_ENV.pdf&usg=AOvVaw0Io_bmMyGV60Wovl7wLH4K (accessed on 9 April 2018).
- Report by KGHM, 2012. Available online: http://kghm.com/pl/zrownowazony-rozwoj/raporty-i-zasoby, [in Polish] (accessed on 22 October 2017).
- Podgórska, B.; Synowiec, P.; Górniak, J.; Podgórska, S. Environmental Program for the Głogów Poviat for the Years 2017–2020 with a Perspective until 2024, 2017. Available online: http://bip.powiat.glogow.pl [in Polish] (accessed on 24 October 2017).
- Cannistraro, M.; Cannistraro, G.; Piccolo, A.; Restivo, R. Potentials and limits of oxidative photocatalysis and possible applications in the field of cultural heritage. Adv. Mater. Res. 2013, 787, 111–117. [Google Scholar] [CrossRef]
© 2018 by the authors. Licensee MDPI, Basel, Switzerland. This article is an open access article distributed under the terms and conditions of the Creative Commons Attribution (CC BY) license (http://creativecommons.org/licenses/by/4.0/).