Is the Development of China’s Financial Inclusion Sustainable? Evidence from a Perspective of Balance


Abstract
:1. Introduction
2. Literature Review
3. Development Balance of Financial Inclusion in China’s Regions
3.1. Constructing the Financial Inclusion Index (FII)
3.2. Method of Measurement
3.3. FII: A Weight Analysis
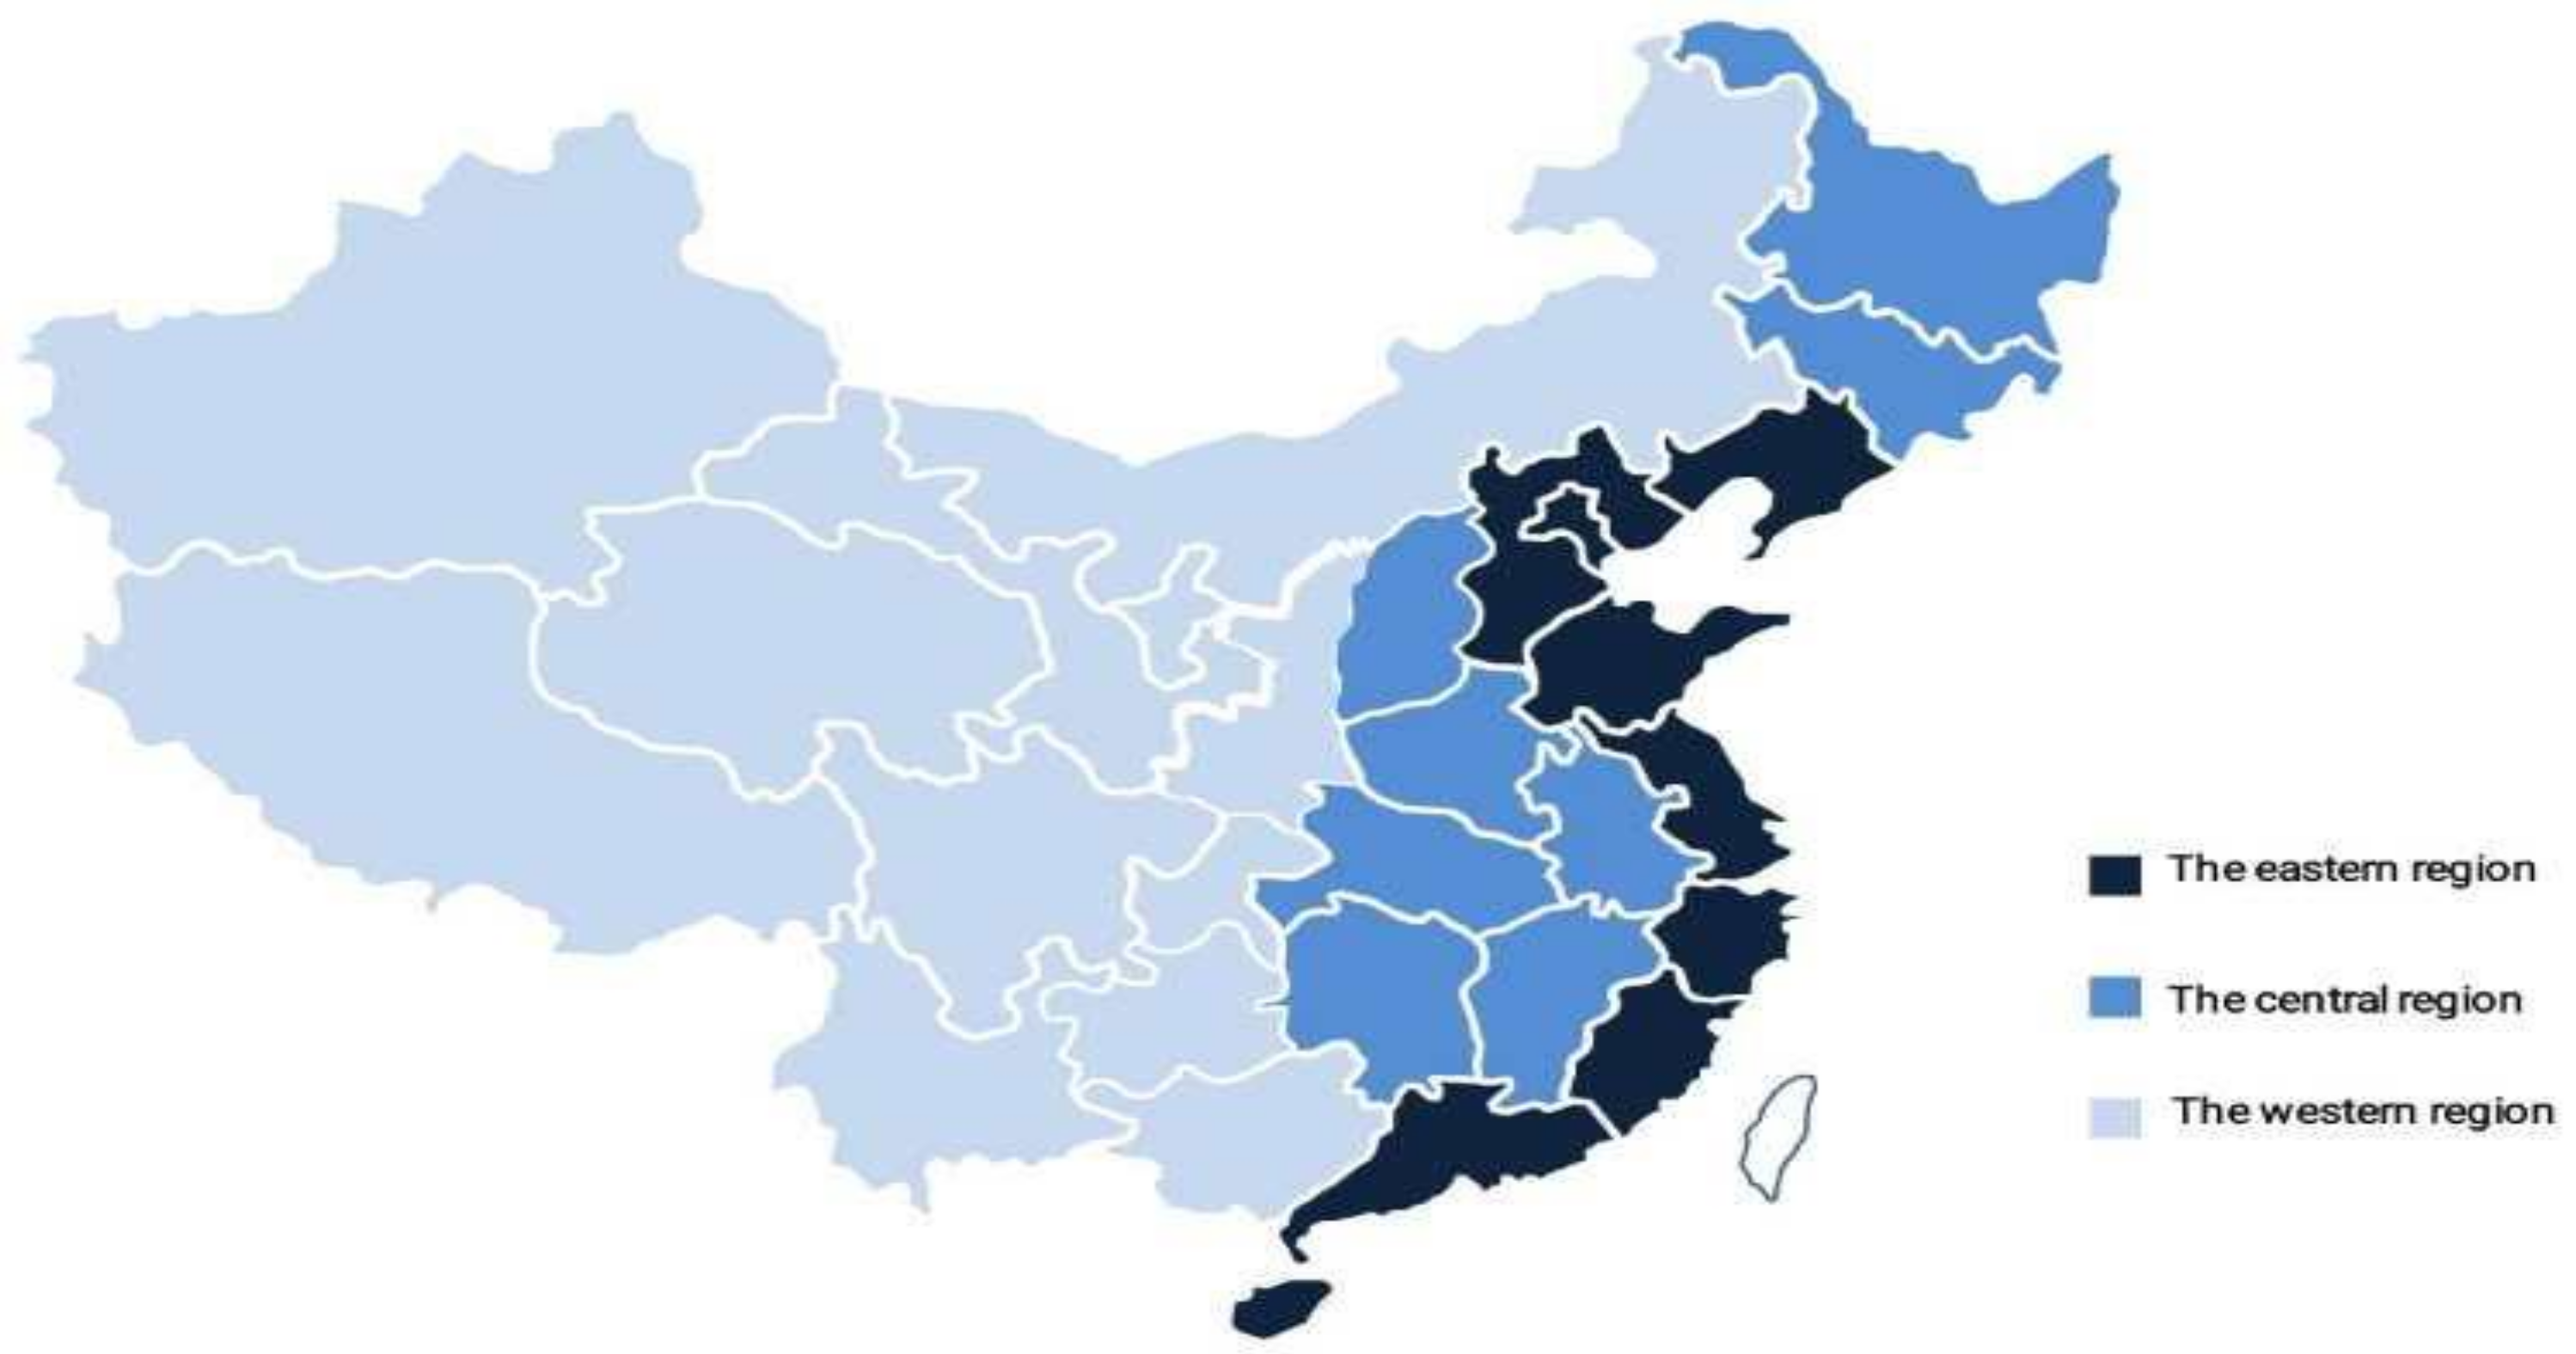
3.4. Comparative Analysis of the FII Dimensions between the Three Regions
3.5. Comparative Analysis of the Financial Inclusion of the Three Regions
4. Structural Balance of China’s Financial Inclusion
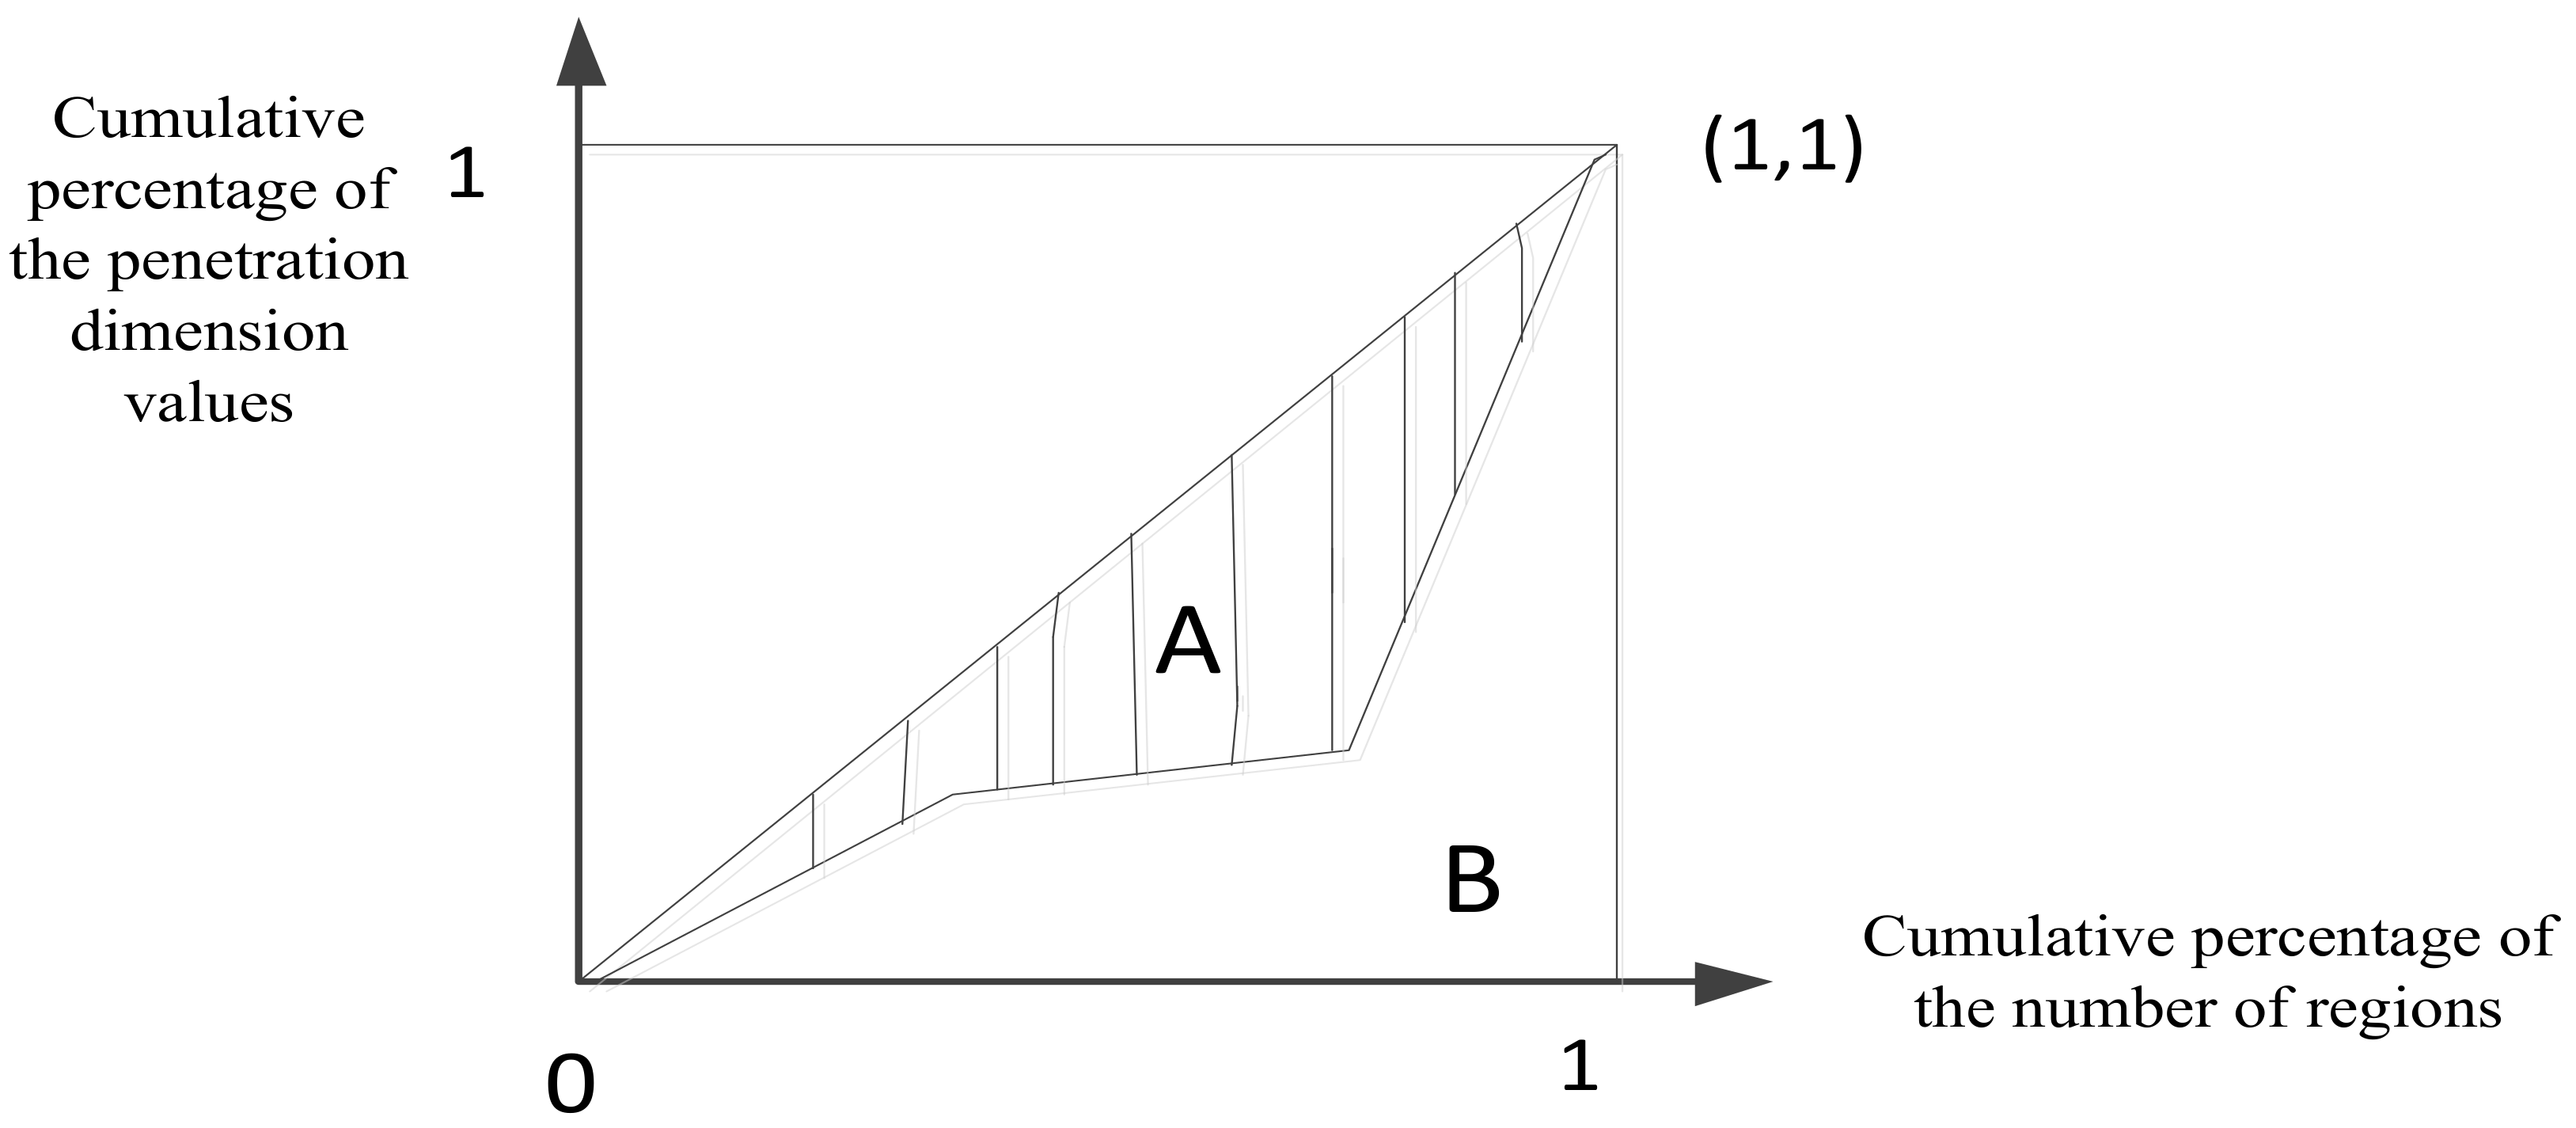
4.1. Method
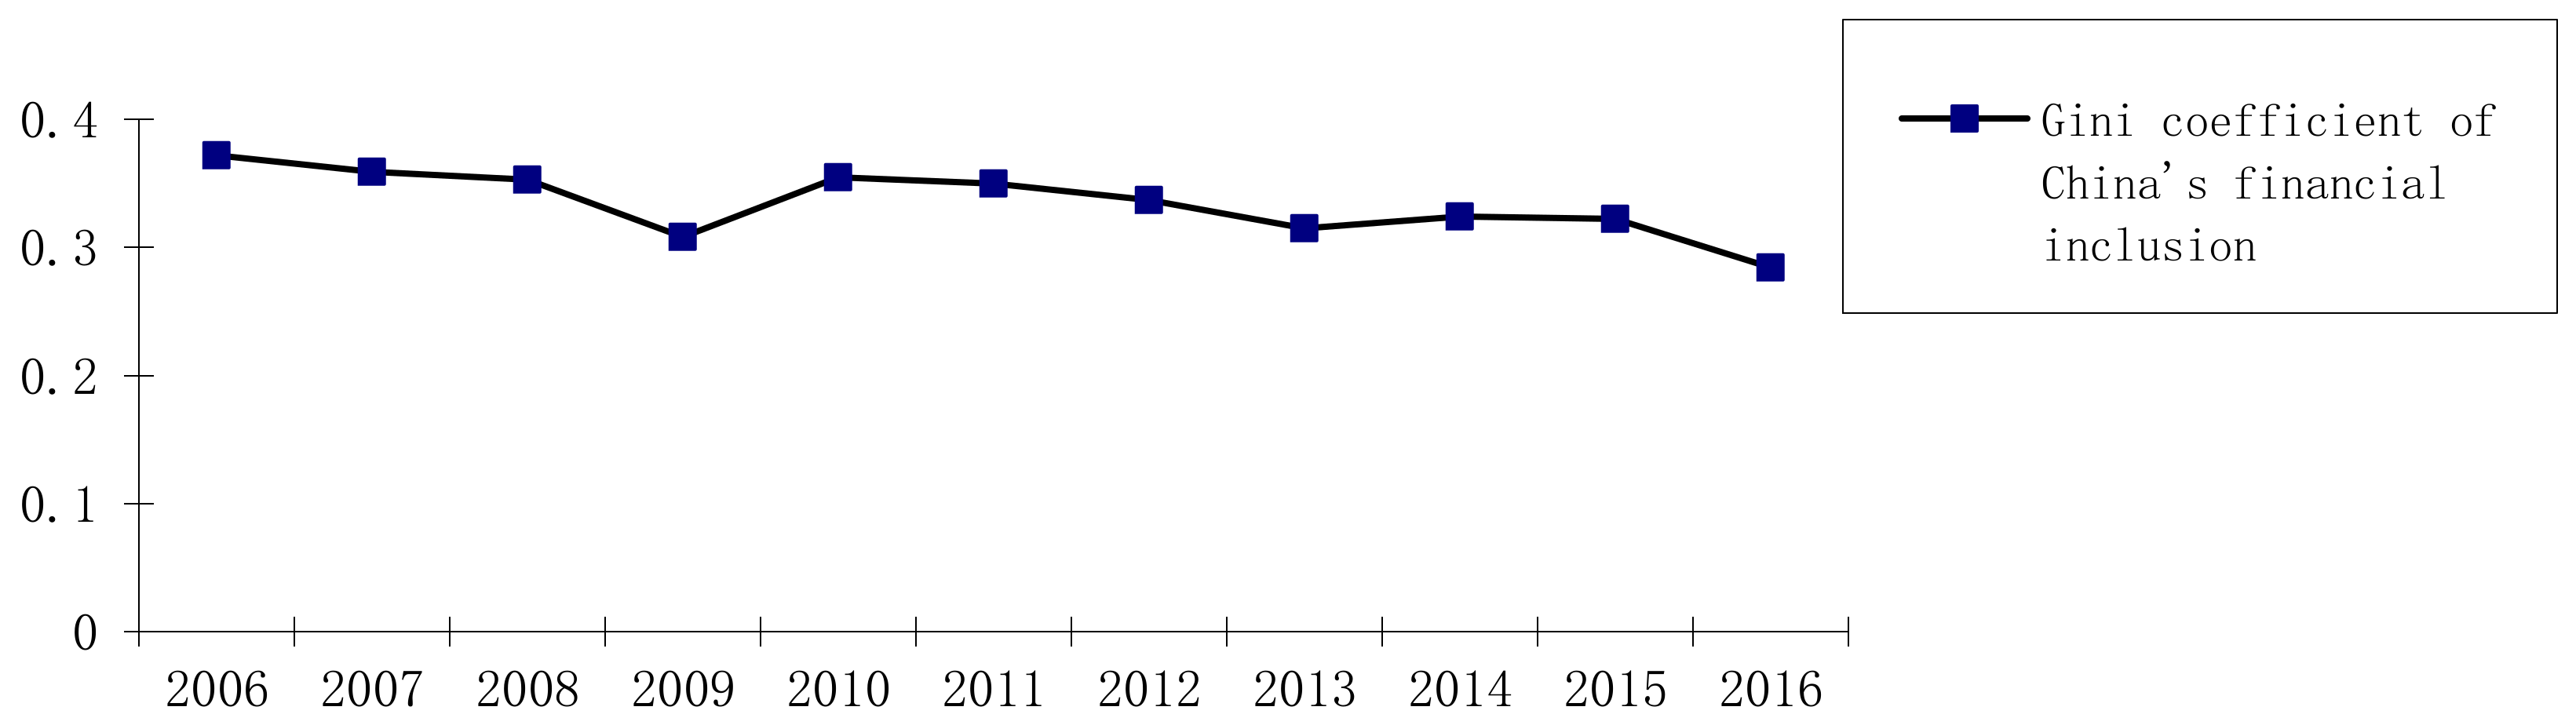
4.2. Calculation Results
5. Empirical Analysis
5.1. Dynamic Shift-Share Model
5.2. Empirical Results
5.3. Results
5.4. Robustness Test
6. Conclusions and Policy Implications
Acknowledgments
Authors’ Contributions
Conflicts of Interest
References
- Jeanneney, S.G.; Kpodar, K. Financial development and poverty reduction: Can there be a benefit without a cost? J. Dev. Stud. 2011, 47, 143–163. [Google Scholar] [CrossRef]
- Beck, T.; Demirguc-Kunt, A.; Martinez Peria, M.S. Reaching out: Access to and use of banking services across countries. J. Financ. Econ. 2007, 85, 234–266. [Google Scholar] [CrossRef]
- Beck, T.; Demirguc-Kunt, A.; Levine, R. Finance, Inequality, and the Poor. J. Econ. Growth 2007, 12, 27–49. [Google Scholar] [CrossRef]
- Sarma, M. Index of Financial Inclusion; ICRIER Working Paper, No. 215; ICRIER: New Delhi, India, 2008. [Google Scholar]
- Beck, T.; Senbet, L.; Simbanegavi, W. Financial Inclusion and Innovation in Africa: An Overview. J. Afr. Econ. 2015, 24, i3–i11. [Google Scholar] [CrossRef]
- Cnaan, R.A.; Moodithaya, M.S.; Handy, F. Financial Inclusion: Lessons from Rural South India. J. Soc. Policy 2012, 41, 183–205. [Google Scholar] [CrossRef]
- Peachey, S.; Roe, A. Access to Finance: What Does it Mean and How Do Savings Banks Foster Access? No. 49; World Savings Banks Institute: Amsterdam, The Netherlands, 2006. [Google Scholar]
- Gabor, D.; Brooks, S. The digital revolution in financial inclusion: international development in the fintech era. New Political Econ. 2017, 22, 423–436. [Google Scholar] [CrossRef]
- Peng, J.G.; Zhu, B. Strategic Thinking of Exploitation-oriented Inclusive Finance under the vision of Developed Economics. Theory Pract. Financ. Econ. 2017, 38, 2–7. [Google Scholar]
- Figart, D.M. Institutionalist Policies for Financial Inclusion. J. Econ. Issues 2013, 47, 873–894. [Google Scholar] [CrossRef]
- Ghosh, J. Microfinance and the challenge of financial inclusion for development. Camb. J. Econ. 2013, 37, 1203–1219. [Google Scholar] [CrossRef]
- Wang, X.H.; Guan, J. Financial inclusion: Measurement, spatial effects and influencing factors. Appl. Econ. 2017, 49, 1–12. [Google Scholar] [CrossRef]
- Chakravarty, S.R.; Pal, R. Financial inclusion in India: An axiomatic approach. J. Policy Model. 2013, 35, 813–837. [Google Scholar] [CrossRef]
- Kapoor, A. Financial inclusion and the future of the Indian economy. Futures 2014, 56, 35–42. [Google Scholar] [CrossRef]
- Rosengard, J.K.; Prasetyantoko, A. If the Banks are Doing So Well, Why Can’t I Get a Loan? Regulatory Constraints to Financial Inclusion in Indonesia. Asian Econ. Policy Rev. 2011, 6, 273–296. [Google Scholar] [CrossRef] [Green Version]
- Demirgüç-Kunt, A.; Klapper, L. Measuring Financial Inclusion: Explaining Variation in Use of Financial Services across and within Countries. Brook. Pap. Econ. Act. 2013, 44, 279–321. [Google Scholar] [CrossRef]
- Lopez, T.; Winkler, A. The challenge of rural financial inclusion—Evidence from microfinance. Appl. Econ. 2018, 50, 1555–1577. [Google Scholar] [CrossRef]
- Allen, F.; Demirguc-Kunt, A.; Klapper, L.; Peria, M.S.M. The foundations of financial inclusion: Understanding ownership and use of formal accounts. J. Financ. Intermed. 2016, 27, 1–30. [Google Scholar] [CrossRef]
- Anzoategui, D.; Demirgüç-Kunt, A.; Pería, M.S.M. Remittances and Financial Inclusion: Evidence from El Salvador. World Dev. 2014, 54, 338–349. [Google Scholar] [CrossRef]
- Zins, A.; Weill, L. The determinants of financial inclusion in Africa. Rev. Dev. Finance 2016, 6, 46–57. [Google Scholar] [CrossRef]
- Fungáčová, Z.; Weill, L. Understanding financial inclusion in China. China Econ. Rev. 2015, 34, 196–206. [Google Scholar] [CrossRef]
- Ghosh, S.; Vinod, D. What Constrains Financial Inclusion for Women? Evidence from Indian Micro data. World Dev. 2017, 92, 60–81. [Google Scholar] [CrossRef]
- Kairiza, T.; Kiprono, P.; Magadzire, V. Gender differences in financial inclusion amongst entrepreneurs in Zimbabwe. Small Bus. Econ. 2017, 48, 259–272. [Google Scholar] [CrossRef]
- Sarma, M.; Pais, J. Financial Inclusion and Development. J. Int. Dev. 2011, 23, 613–628. [Google Scholar] [CrossRef]
- Appleyard, L. Community Development Finance Institutions (CDFIs): Geographies of financial inclusion in the US and UK. Geoforum 2011, 42, 250–258. [Google Scholar] [CrossRef]
- Fan, Z.; Zhang, R. Financial Inclusion, Entry Barriers, and Entrepreneurship: Evidence from China. Sustainability 2007, 9, 203. [Google Scholar] [CrossRef]
- Sharma, D. Nexus between financial inclusion and economic growth: Evidence from the emerging Indian economy. J. Financ. Econ. Policy 2016, 8, 13–36. [Google Scholar] [CrossRef]
- Chibba, M. Financial Inclusion, Poverty Reduction and the Millennium Development Goals. Eur. J. Dev. Res. 2009, 21, 213–230. [Google Scholar] [CrossRef]
- Neaime, S.; Gaysset, I. Financial Inclusion and Stability in MENA: Evidence from Poverty and Inequality. Financ. Res. Lett. 2018, 24, 230–237. [Google Scholar] [CrossRef]
- Chiapa, C.; Prina, S.; Parker, A. The Effects of Financial Inclusion on Children’s Schooling, and Parental Aspirations and Expectations. J. Int. Dev. 2015, 28, 683–696. [Google Scholar] [CrossRef]
- Wang, X.H.; Qiu, Z.X. The influence mechanism of rural finance development on urban-rural income gap. Econ. Perspect. 2011, 52, 71–75. [Google Scholar]
- Honohan, P. Cross-country variation in household access to financial services. J. Bank. Finance 2008, 32, 2493–2500. [Google Scholar] [CrossRef]
- Honohan, P. Measuring Microfinance Access: Building on Existing Cross-Country Data; World Bank Policy Research Working Paper, No. 3606; World Bank: Washington, DC, USA, 2005. [Google Scholar]
- Angus, D. The Analysis of Household Surveys: A Microeconomic Approach to Development Policy; Johns Hopkins University Press: Baltimore, MD, USA; London, UK, 1997. [Google Scholar]
- Vinod, T.; Wang, Y.; Fan, X.B. Measuring Education Inequality: Gini Coefficients of Education; World Bank Policy Research Working Paper, No. WPS2525; World Bank Group: Washington, DC, USA, 2000. [Google Scholar]
- Yang, X.K. The Basis of Mathematical Economics; National Defence Industry Press: Beijing, China, 1985. [Google Scholar]
- Dunn, E.S. A Statistical and Analytical Technique for Regional Analysis. Pap. Reg. Sci. Assoc. 1960, 6, 97–112. [Google Scholar] [CrossRef]


| Dimensions | Indicators | Calculation Method |
|---|---|---|
| Penetration | Number of banking institutions per 10,000 people | Total number of banking institutions/population |
| Number of bank employees per 10,000 people | Total number of bank employees/population | |
| Number of securities per 10,000 people | Total number of securities/population | |
| Number of insurance institutions per 10,000 people | Total number of insurance institutions/population | |
| Number of banking institutions per 10,000 square km | Total number of banking institutions/area | |
| Number of bank employees per 10,000 square km | Total number of bank employees/area | |
| Number of securities per 10,000 square km | Total number of securities/area | |
| Number of insurance institutions per 10,000 square km | Total number of insurance institutions/area | |
| Availability | Savings deposit per capita | Savings deposit/population |
| Loans per capitaSecurities trading per capita | Loan/populationSecurities trading/population | |
| Insurance density | Premium income/population | |
| Usage | Deposit ratio | Deposit/GDP |
| Loan ratio proportion of securities trading amount to GDP | Loan/GDPSecurities trading/GDP | |
| Insurance depth | Premium income/GDP |
| Dimensions | 2006 | 2007 | 2008 | 2009 | 2010 | 2011 |
|---|---|---|---|---|---|---|
| Penetration | 0.402 | 0.583 | 0.657 | 0.676 | 0.729 | 0.655 |
| Availability | 0.379 | 0.266 | 0.186 | 0.231 | 0.171 | 0.178 |
| Usage | 0.219 | 0.152 | 0.157 | 0.093 | 0.099 | 0.167 |
| Dimensions | 2012 | 2013 | 2014 | 2015 | 2016 | Mean |
| Penetration | 0.642 | 0.663 | 0.691 | 0.737 | 0.645 | 0.644 |
| Availability | 0.178 | 0.182 | 0.183 | 0.167 | 0.225 | 0.213 |
| Usage | 0.181 | 0.155 | 0.126 | 0.095 | 0.129 | 0.143 |
| Penetration | 2006 | 2009 | 2012 | 2014 | 2016 | Mean |
|---|---|---|---|---|---|---|
| Eastern | 0.380 | 0.411 | 0.365 | 0.496 | 0.548 | 0.426 |
| Central | 0.158 | 0.180 | 0.108 | 0.181 | 0.219 | 0.153 |
| Western | 0.045 | 0.075 | 0.056 | 0.075 | 0.121 | 0.067 |
| Availability | 2006 | 2009 | 2012 | 2014 | 2016 | Mean |
| Eastern | 0.021 | 0.054 | 0.077 | 0.120 | 0.207 | 0.088 |
| Central | 0.001 | 0.013 | 0.025 | 0.040 | 0.066 | 0.027 |
| Western | 0.001 | 0.013 | 0.028 | 0.040 | 0.065 | 0.027 |
| Usage | 2006 | 2009 | 2012 | 2014 | 2016 | Mean |
| Eastern | 0.037 | 0.067 | 0.059 | 0.081 | 0.136 | 0.072 |
| Central | 0.006 | 0.022 | 0.013 | 0.026 | 0.052 | 0.022 |
| Western | 0.019 | 0.039 | 0.032 | 0.045 | 0.072 | 0.039 |
| 2006 | 2007 | 2008 | 2009 | 2010 | 2011 | |
|---|---|---|---|---|---|---|
| Eastern | 0.438 | 0.504 | 0.479 | 0.532 | 0.483 | 0.471 |
| Central | 0.165 | 0.167 | 0.176 | 0.215 | 0.129 | 0.136 |
| Western | 0.065 | 0.092 | 0.086 | 0.128 | 0.102 | 0.100 |
| 2012 | 2013 | 2014 | 2015 | 2016 | Mean | |
| Eastern | 0.501 | 0.564 | 0.697 | 0.893 | 0.891 | 0.587 |
| Central | 0.146 | 0.175 | 0.247 | 0.313 | 0.338 | 0.201 |
| Western | 0.115 | 0.146 | 0.160 | 0.208 | 0.259 | 0.133 |
| Dimension | 2006 | 2007 | 2008 | 2009 | 2010 | 2011 | 2012 | 2013 |
|---|---|---|---|---|---|---|---|---|
| Penetration | 0.383 | 0.372 | 0.371 | 0.336 | 0.426 | 0.402 | 0.390 | 0.365 |
| Availability | 0.597 | 0.460 | 0.383 | 0.340 | 0.297 | 0.278 | 0.265 | 0.265 |
| Usage | 0.334 | 0.326 | 0.324 | 0.233 | 0.238 | 0.303 | 0.295 | 0.266 |
| Dimension | 2014 | 2015 | 2016 | Max | Min | Median | Mean | Standard Deviation |
| Penetration | 0.373 | 0.381 | 0.321 | 0.426 | 0.321 | 0.373 | 0.374 | 0.029 |
| Availability | 0.267 | 0.281 | 0.279 | 0.597 | 0.265 | 0.281 | 0.337 | 0.106 |
| Usage | 0.239 | 0.219 | 0.215 | 0.334 | 0.215 | 0.266 | 0.272 | 0.046 |
| 2006 | 2007 | 2008 | 2009 | 2010 | 2011 | |
|---|---|---|---|---|---|---|
| Structural balance | 0.406 | 0.378 | 0.366 | 0.322 | 0.382 | 0.371 |
| 2012 | 2013 | 2014 | 2015 | 2016 | Mean | |
| Structural balance | 0.359 | 0.337 | 0.340 | 0.344 | 0.300 | 0.355 |
| Dimensions | Component | 2008 | 2010 | 2012 | 2014 | 2015 | 2016 |
|---|---|---|---|---|---|---|---|
| Penetration | Actual growth | −1.876 | −5.877 | 1.736 | 9.849 | 7.816 | −2.569 |
| Total shift | 3.912 | −1.202 | −5.138 | −4.491 | −10.904 | −8.707 | |
| Reference | −5.788 | −4.675 | 6.874 | 14.340 | 18.720 | 6.138 | |
| Structure | 0.273 | −4.647 | 0.189 | 1.439 | −8.394 | 0.916 | |
| Competitiveness | 3.639 | 3.445 | −5.327 | −5.930 | −2.510 | −9.623 | |
| Availability | Actual growth | 0.269 | 0.994 | 0.906 | 2.274 | 6.793 | 1.965 |
| Total shift | 0.776 | 1.607 | −0.438 | −1.224 | 2.275 | −0.041 | |
| Reference | −0.507 | −0.613 | 1.344 | 3.498 | 4.518 | 2.006 | |
| Structure | 1.361 | 2.501 | −0.012 | −0.794 | 3.562 | −0.133 | |
| Competitiveness | −0.585 | −0.894 | −0.426 | −0.430 | −1.287 | 0.092 | |
| Usage | Actual growth | −0.836 | 0.013 | 0.342 | 1.109 | 4.993 | 0.498 |
| Total shift | −0.119 | 0.772 | −0.76 | −1.411 | 1.937 | −0.901 | |
| Reference | −0.717 | −0.759 | 1.102 | 2.520 | 3.056 | 1.399 | |
| Structure | −1.568 | 0.657 | −0.168 | −0.508 | 4.662 | −0.693 | |
| Competitiveness | 1.449 | 0.115 | −0.592 | −0.903 | −2.725 | −0.208 |
| Dimensions | Component | 2008 | 2010 | 2012 | 2014 | 2015 | 2016 |
|---|---|---|---|---|---|---|---|
| Penetration | Actual growth | 0.823 | −9.066 | 0.424 | 5.607 | 2.363 | 1.530 |
| Total shift | 2.940 | −7.016 | −1.627 | 1.115 | −4.453 | −0.653 | |
| Reference | −2.117 | −2.050 | 2.052 | 4.492 | 6.816 | 2.183 | |
| Structure | 0.100 | −2.037 | 0.057 | 0.451 | −3.056 | 0.326 | |
| Competitiveness | 2.840 | −4.979 | −1.684 | 0.664 | −1.397 | −0.979 | |
| Availability | Actual growth | 0.298 | 0.528 | 0.409 | 0.844 | 1.946 | 0.667 |
| Total shift | 0.373 | 0.679 | −0.013 | −0.306 | 0.424 | 0.028 | |
| Reference | −0.075 | −0.151 | 0.422 | 1.150 | 1.522 | 0.639 | |
| Structure | 0.202 | 0.615 | −0.004 | −0.261 | 1.200 | −0.042 | |
| Competitiveness | 0.171 | 0.064 | −0.009 | −0.045 | −0.776 | 0.070 | |
| Usage | Actual growth | −0.229 | −0.083 | 0.151 | 0.747 | 2.317 | 0.259 |
| Total shift | −0.094 | 0.167 | −0.002 | 0.066 | 1.323 | −0.271 | |
| Reference | −0.135 | −0.250 | 0.227 | 0.681 | 0.994 | 0.530 | |
| Structure | −0.295 | 0.217 | −0.035 | −0.137 | 1.517 | −0.262 | |
| Competitiveness | 0.201 | −0.050 | −0.041 | 0.203 | −0.194 | −0.009 |
| Dimensions | Component | 2008 | 2010 | 2012 | 2014 | 2015 | 2016 |
|---|---|---|---|---|---|---|---|
| Penetration | Actual growth | −0.770 | −3.270 | 0.850 | 0.303 | 0.690 | 3.904 |
| Total shift | 0.115 | −2.412 | −0.081 | −2.297 | −2.145 | 3.027 | |
| Reference | −0.885 | −0.858 | 0.931 | 2.600 | 2.835 | 0.877 | |
| Structure | 0.042 | −0.853 | 0.026 | 0.261 | −1.271 | 0.131 | |
| Competitiveness | 0.073 | −1.559 | −0.107 | −2.558 | −0.874 | 2.896 | |
| Availability | Actual growth | 0.305 | 0.619 | 0.480 | 0.457 | 1.911 | 0.657 |
| Total shift | 0.367 | 0.767 | 0.030 | −0.808 | 0.415 | 0.029 | |
| Reference | −0.062 | −0.148 | 0.450 | 1.265 | 1.496 | 0.628 | |
| Structure | 0.167 | 0.604 | −0.004 | −0.287 | 1.180 | −0.042 | |
| Competitiveness | 0.200 | 0.163 | 0.034 | −0.521 | −0.765 | 0.071 | |
| Usage | Actual growth | −0.124 | 0.099 | 0.167 | 0.621 | 2.235 | 0.448 |
| Total shift | 0.214 | 0.545 | −0.431 | −0.791 | 0.524 | −0.276 | |
| Reference | −0.338 | −0.446 | 0.598 | 1.412 | 1.711 | 0.724 | |
| Structure | −0.739 | 0.386 | −0.091 | −0.284 | 2.610 | −0.358 | |
| Competitiveness | 0.953 | 0.159 | −0.340 | −0.507 | −2.086 | 0.082 |
| Actual Growth | Chi-Square | Asymp.sig |
|---|---|---|
| Penetration | 26.324 | 0.05 |
| Availability | 4.717 | 0.999 |
| Usage | 1.784 | 1.000 |
| Reference component | Chi-Square | Asymp.sig |
| Penetration | 1.828 | 1.000 |
| Availability | 3.529 | 1.000 |
| Usage | 5.091 | 0.985 |
| Structural component | Chi-Square | Asymp.sig |
| Penetration | 0.735 | 0.999 |
| Availability | 2.489 | 0.991 |
| Usage | 1.286 | 0.996 |
| Competitive component | Chi-Square | Asymp.sig |
| Penetration | 19.898 | 0.03 |
| Availability | 0.000 | 1.000 |
| Usage | 0.75 | 1.000 |
| Eastern Region | Chi-Square | Asymp.sig |
|---|---|---|
| Actual growth | 15.533 | 0.625 |
| Reference component | 4.412 | 0.992 |
| Structural component | 49.848 | 0.000 |
| Competitive component | 4.371 | 0.627 |
| Central region | Chi-Square | Asymp.sig |
| Actual growth | 9.394 | 0.95 |
| Reference component | 10.128 | 0.753 |
| Structural component | 12.267 | 0.833 |
| Competitive component | 0.000 | 1.000 |
| Western region | Chi-Square | Asymp.sig |
| Actual growth | 12.272 | 0.833 |
| Reference component | 3.653 | 0.997 |
| Structural component | 21.795 | 0.241 |
| Competitive component | 5.000 | 0.958 |
| Penetration | |||||
| Moran’I | I | E(I) | Sd(I) | z | p-value |
| Actual growth | −0.007 | −0.034 | 0.045 | 0.620 | 0.535 |
| Reference component | −0.020 | −0.034 | 0.046 | 0.308 | 0.758 |
| Structural component | −0.002 | −0.034 | 0.045 | 0.717 | 0.474 |
| Competitive component | −0.018 | −0.034 | 0.046 | 0.359 | 0.720 |
| Availability | |||||
| Moran’I | I | E(I) | Sd(I) | z | p-value |
| Actual growth | −0.053 | −0.034 | 0.036 | −0.519 | 0.604 |
| Reference component | −0.060 | −0.034 | 0.045 | −0.565 | 0.572 |
| Structural component | −0.04 | −0.034 | 0.044 | −0.126 | 0.900 |
| Competitive component | −0.090 | −0.034 | 0.043 | −1.296 | 0.195 |
| Usage | |||||
| Moran’I | I | E(I) | Sd(I) | z | p-value |
| Actual growth | −0.013 | −0.034 | 0.044 | 0.479 | 0.632 |
| Reference component | −0.126 | −0.034 | 0.046 | −1.967 | 0.049 |
| Structural component | −0.025 | −0.034 | 0.044 | 0.217 | 0.829 |
| Competitive component | −0.069 | −0.034 | 0.042 | 0.835 | 0.404 |
© 2018 by the authors. Licensee MDPI, Basel, Switzerland. This article is an open access article distributed under the terms and conditions of the Creative Commons Attribution (CC BY) license (http://creativecommons.org/licenses/by/4.0/).
Share and Cite
Zhu, B.; Zhai, S.; He, J. Is the Development of China’s Financial Inclusion Sustainable? Evidence from a Perspective of Balance. Sustainability 2018, 10, 1200. https://doi.org/10.3390/su10041200
Zhu B, Zhai S, He J. Is the Development of China’s Financial Inclusion Sustainable? Evidence from a Perspective of Balance. Sustainability. 2018; 10(4):1200. https://doi.org/10.3390/su10041200
Chicago/Turabian StyleZhu, Bao, Shiting Zhai, and Jing He. 2018. "Is the Development of China’s Financial Inclusion Sustainable? Evidence from a Perspective of Balance" Sustainability 10, no. 4: 1200. https://doi.org/10.3390/su10041200