Understanding the Dynamics of the Pick-Up and Drop-Off Locations of Taxicabs in the Context of a Subsidy War among E-Hailing Apps


Abstract
:1. Introduction
- (1)
- Was the spatial pattern of pick-up and drop-off locations significantly influenced by the subsidy war? For example, increases or decreases in the number of pick-up and drop-off locations during different periods of the subsidy war. The answer to this question can help us understand the change dynamics of taxi trip demand for each divided cells and sub-district.
- (2)
- Was the spatial distribution of the pick-up and drop-off locations within the different sub-districts stable or unstable during the subsidy war? The answer to this question can help us estimate the stability of taxi trip demand dynamics by subsidy policies.
- (3)
- To what extent do the pick-up and drop-off locations become disperse or clustered at the sub-district and city scales during the subsidy war? The answer to this question can help us investigate the local effectiveness dynamics of subsidy policies.
2. Related Work
2.1. Taxi Trajectory Mining
2.2. Investigations of Taxicab Policies
2.3. Investigations of the Subsidy War among E-Hailing Services
3. Methodology
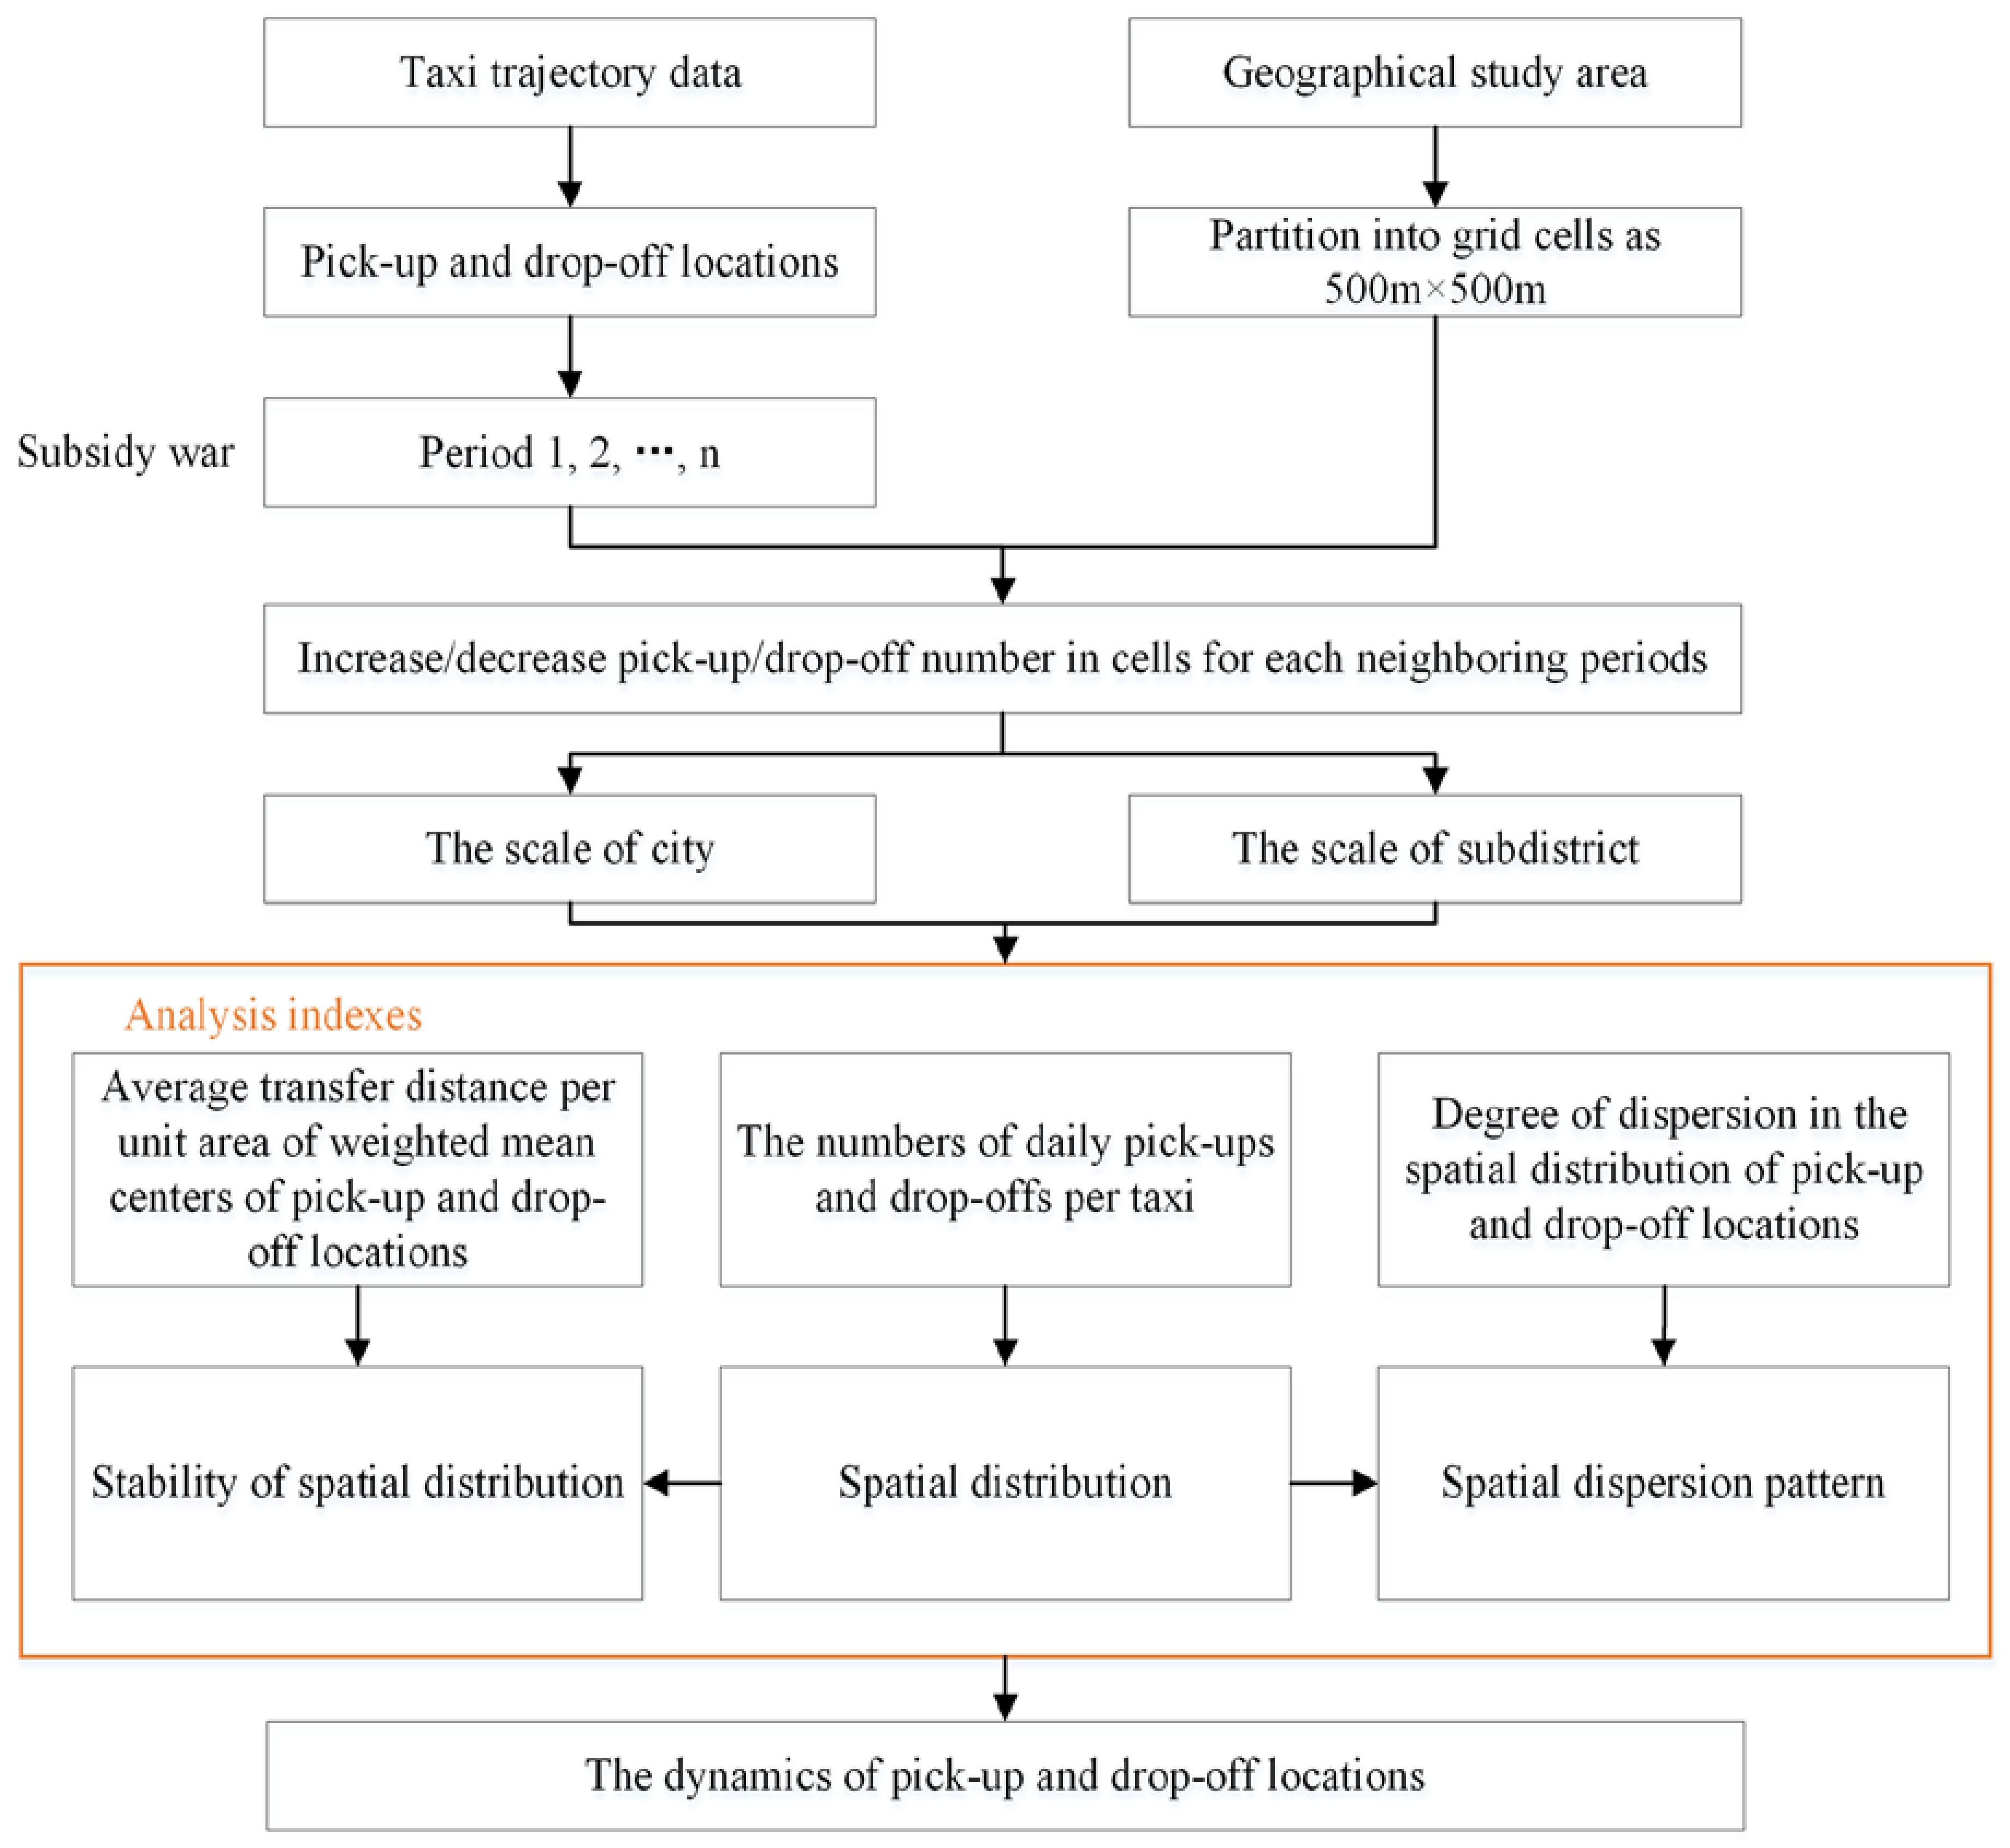
3.1. Framework of the Method
3.2. Spatial Measurements of Taxi Pick-Up and Drop-Off Locations
3.2.1. The Number of Daily Pick-Ups and Drop-Offs per Taxi
3.2.2. Average Transfer Distance per Unit Area of Weighted Mean Centers of Pick-Up and Drop-Off Locations
3.2.3. Degree of Dispersion in the Spatial Distribution of Pick-Up and Drop-Off Locations
3.2.4. Visualization Methods of Pick-Up and Drop-Off Dynamics
4. Results
4.1. Subsidy War and Experimental Data
4.2. Spatial Distribution of Pick-Up and Drop-Off Locations
- (1)
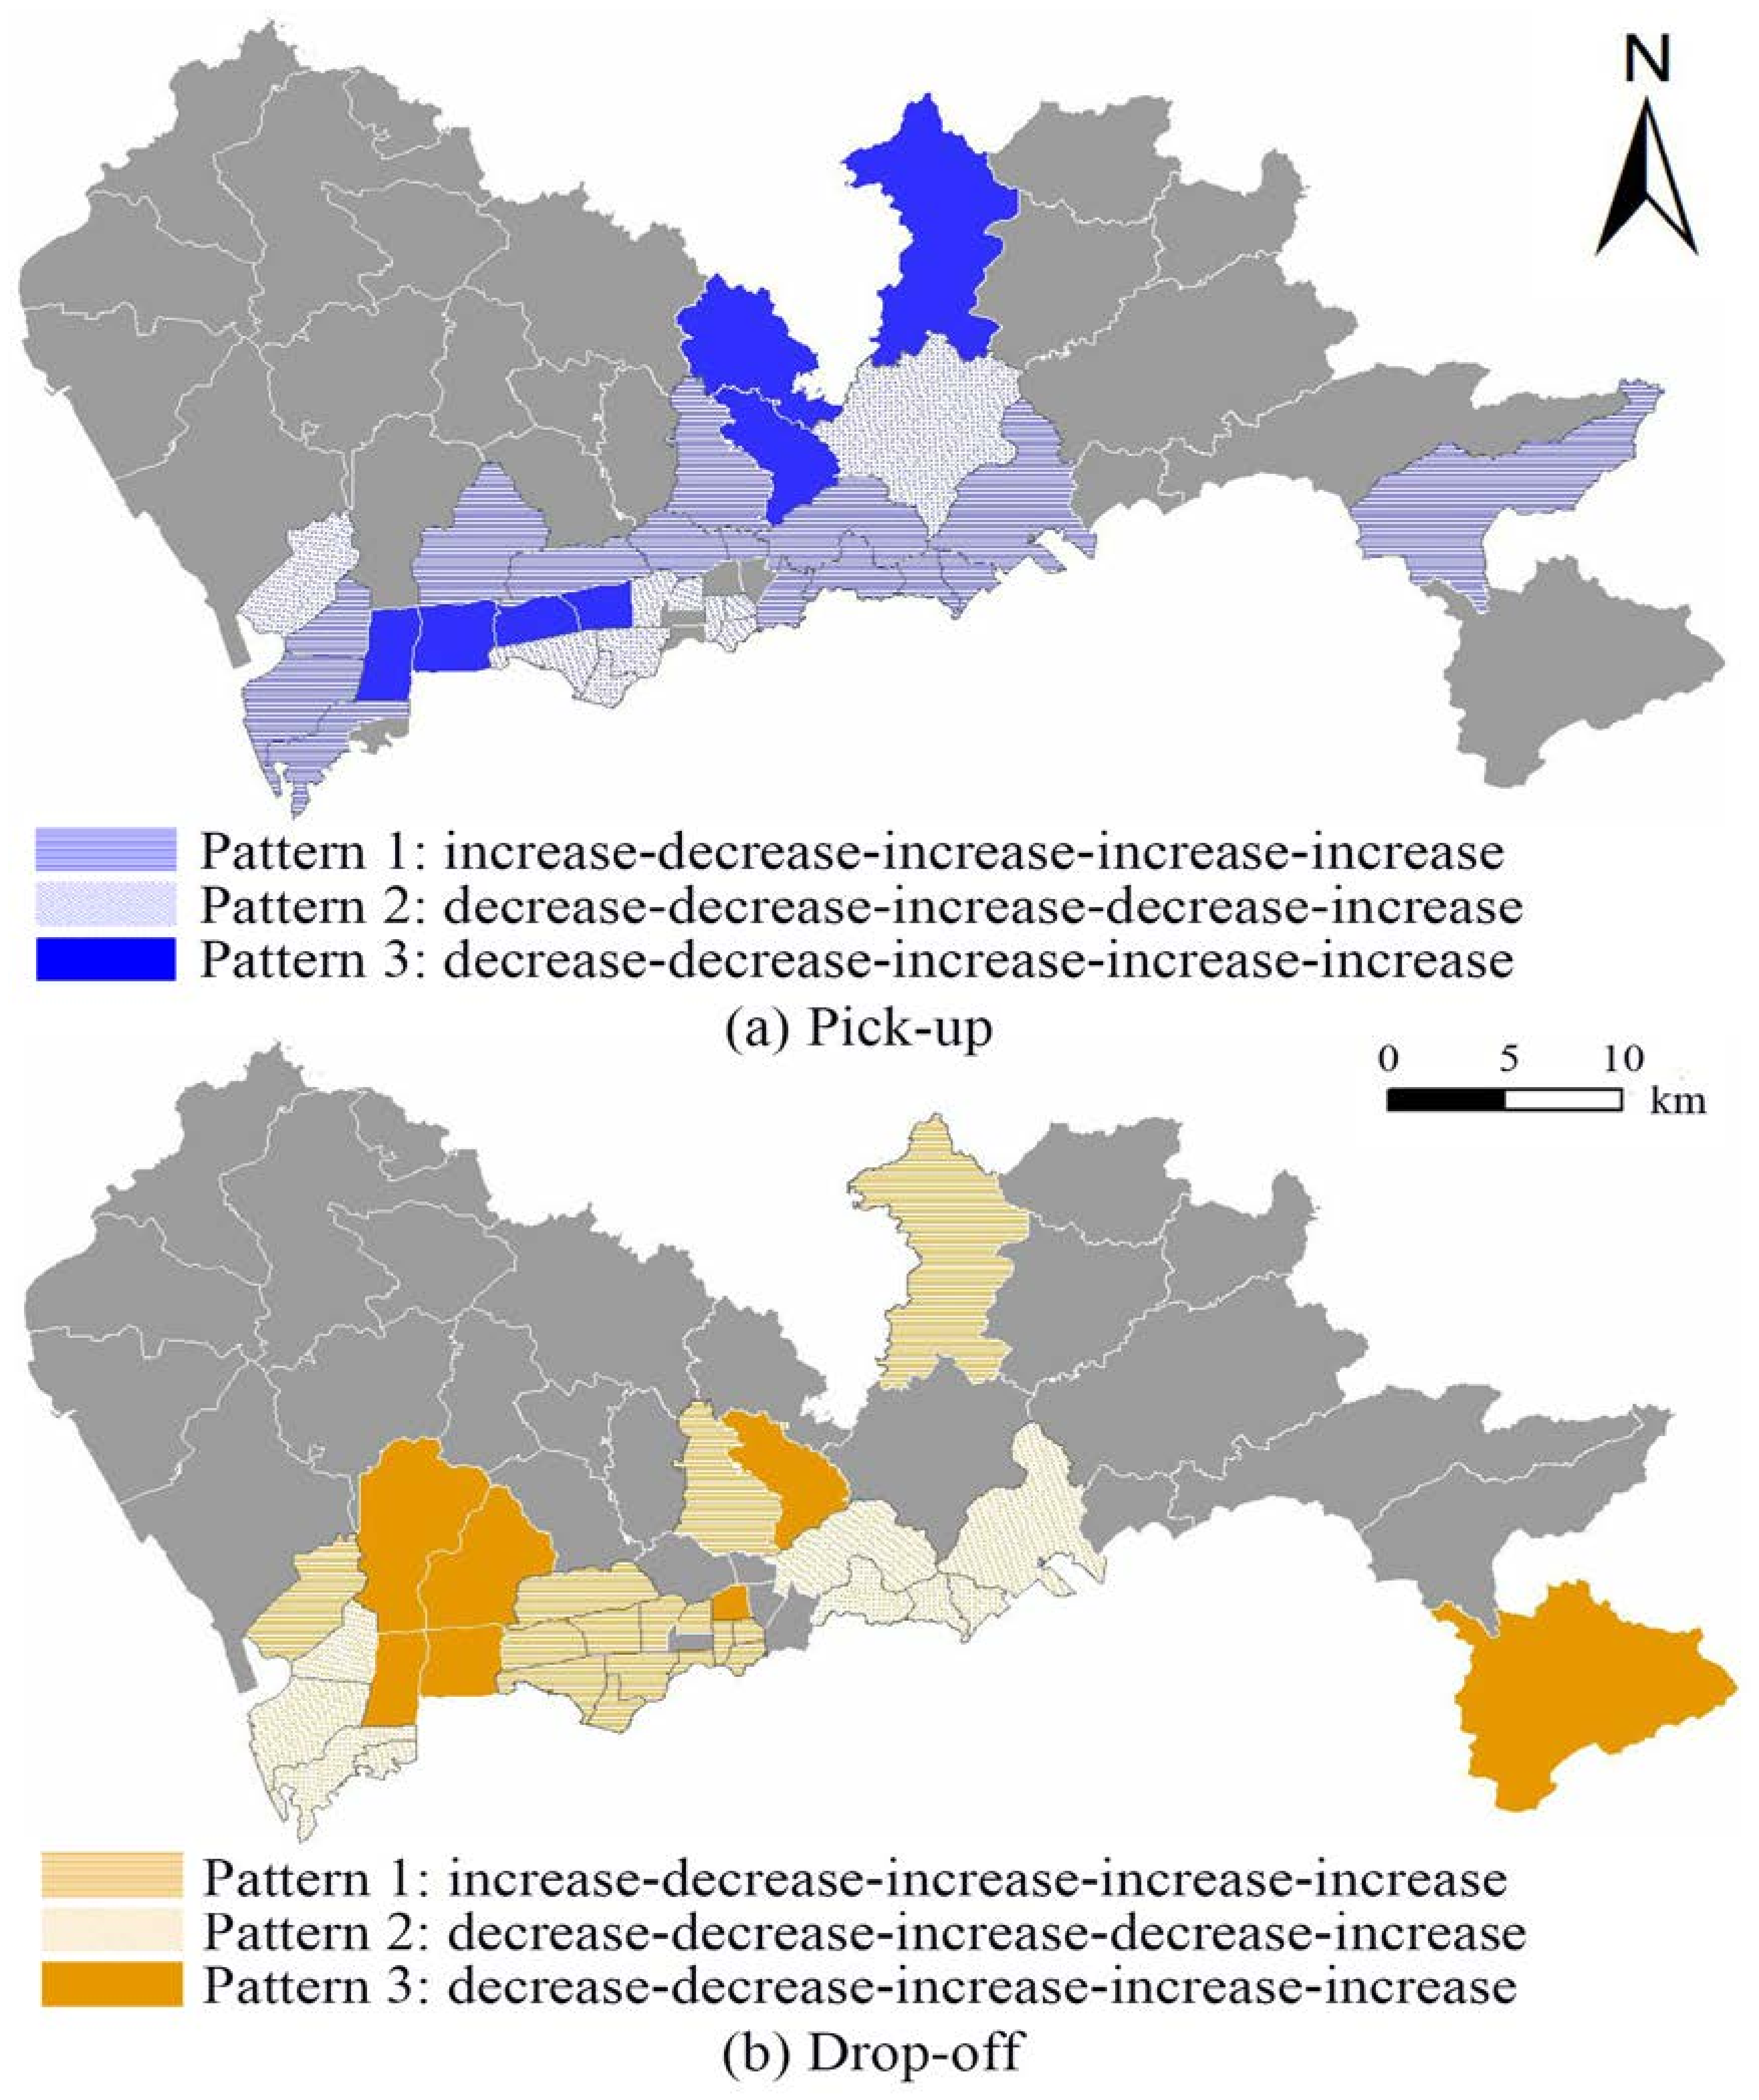
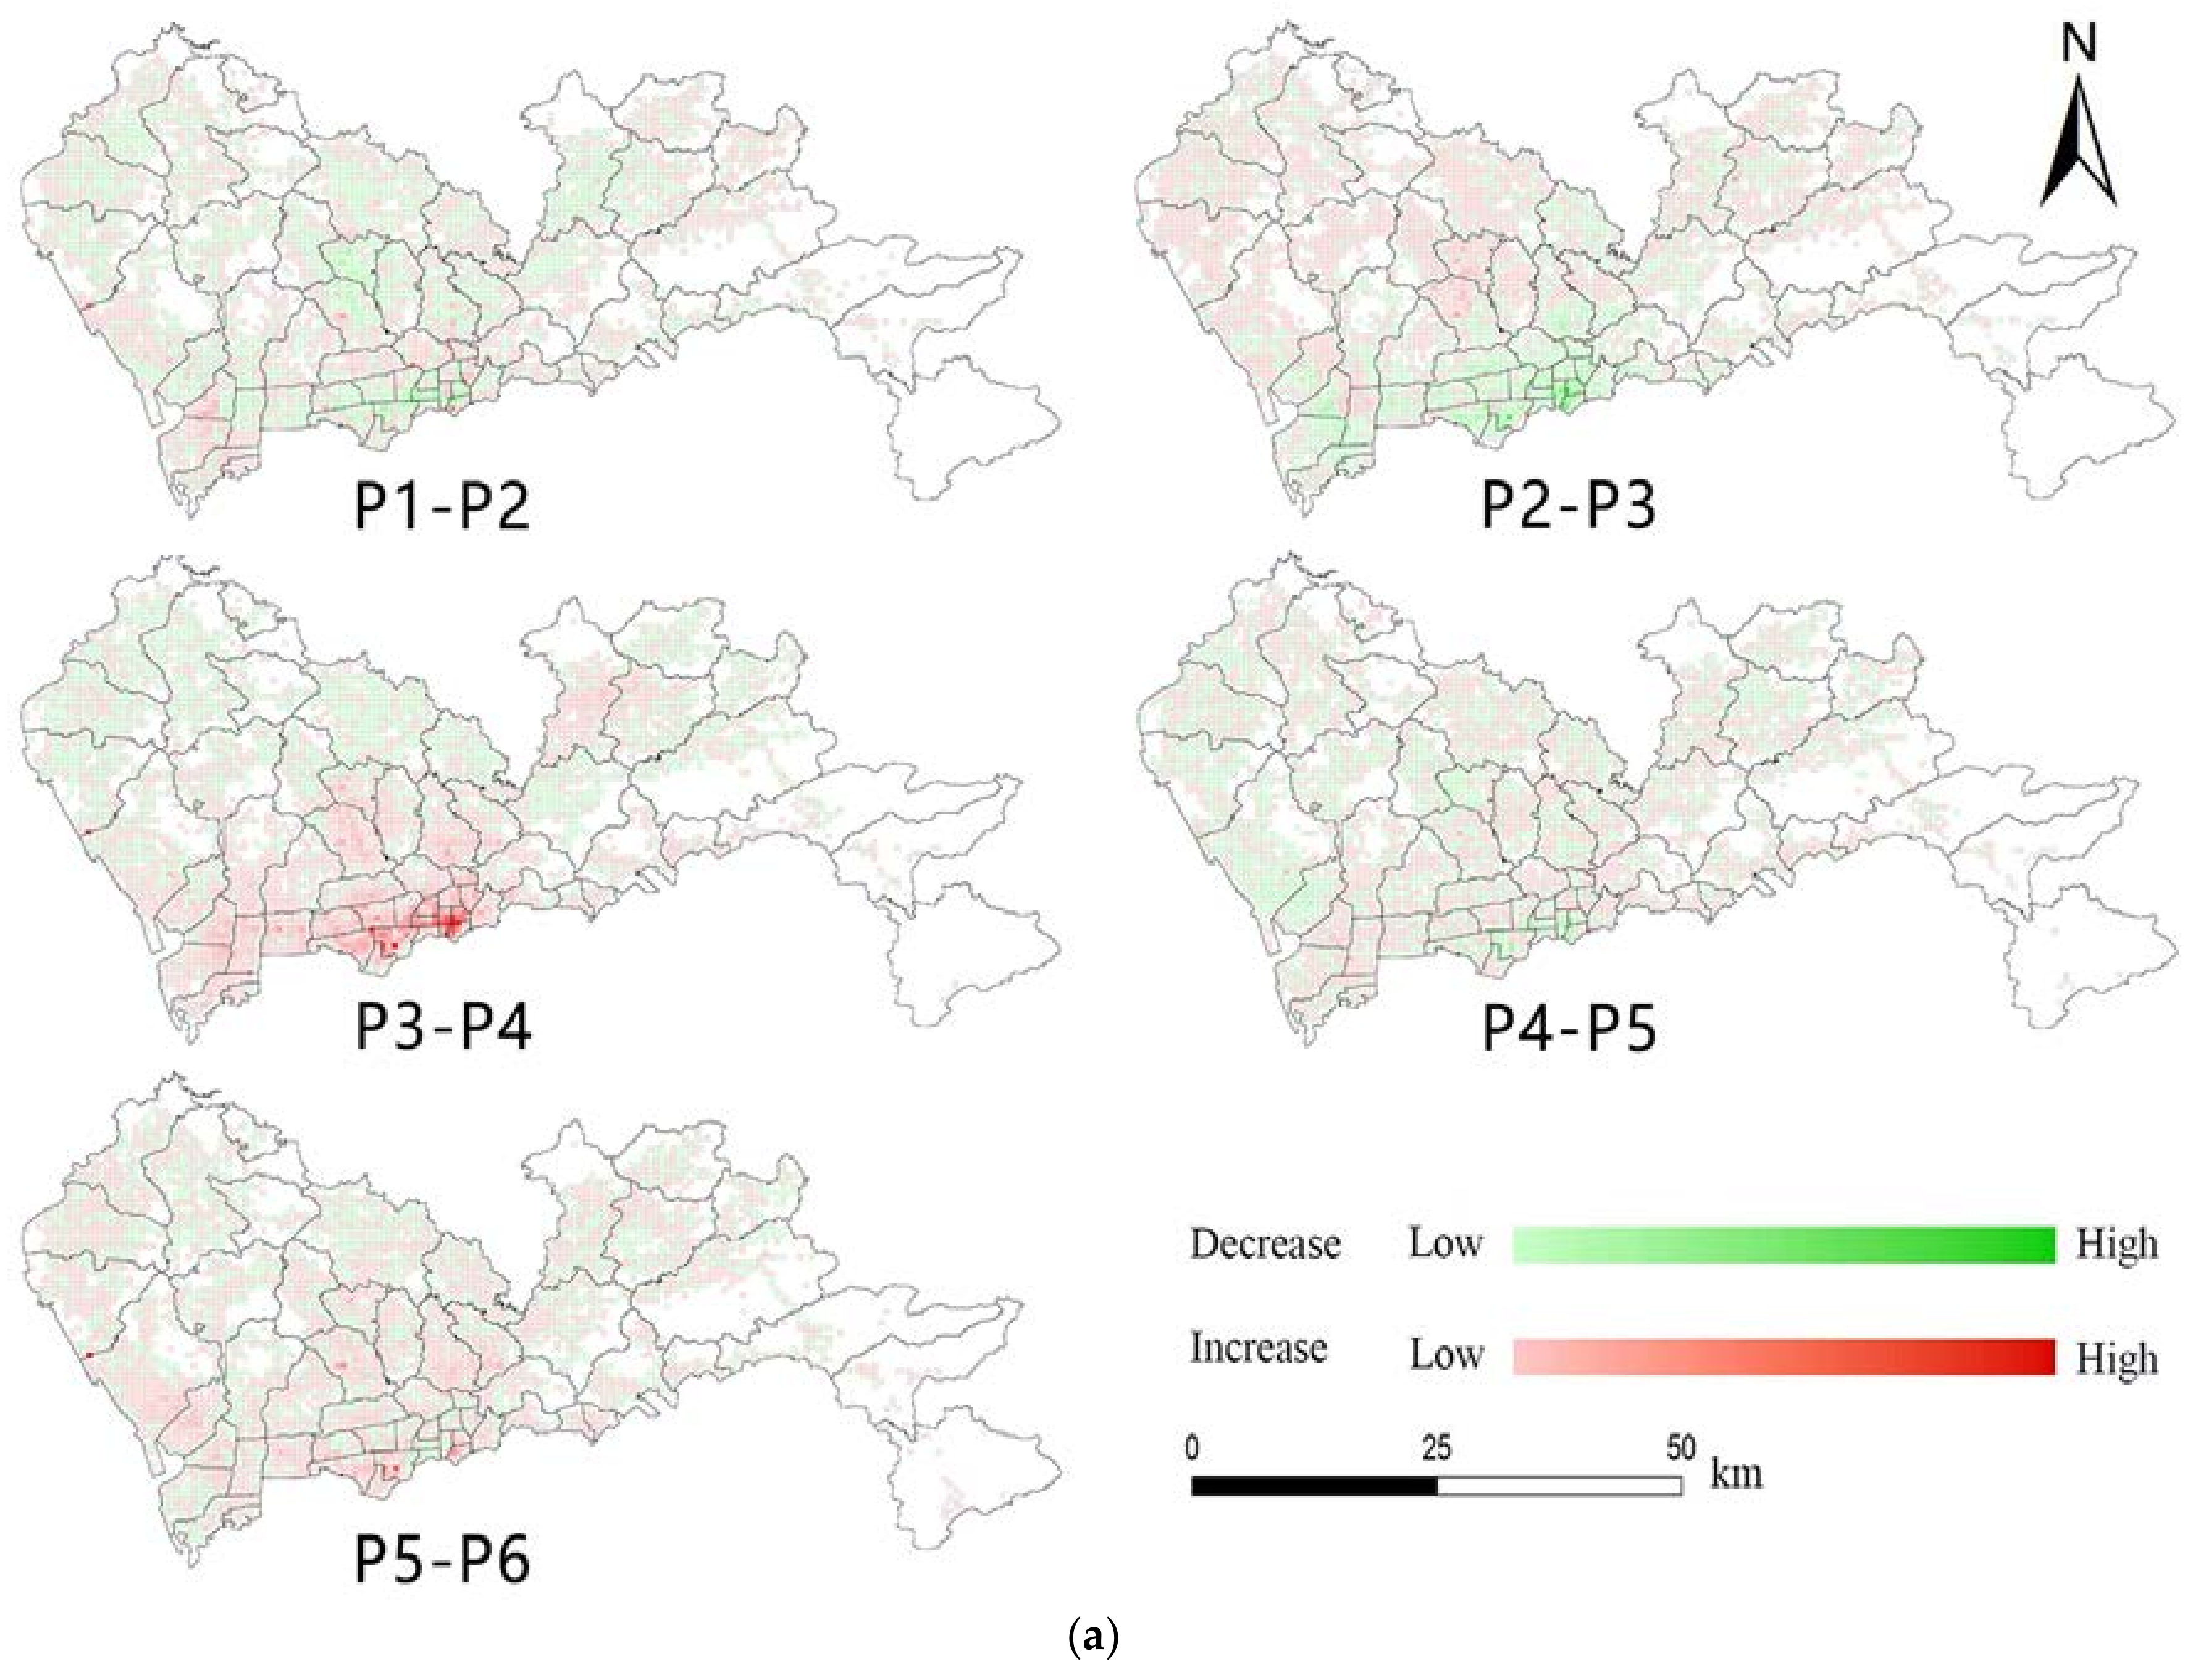
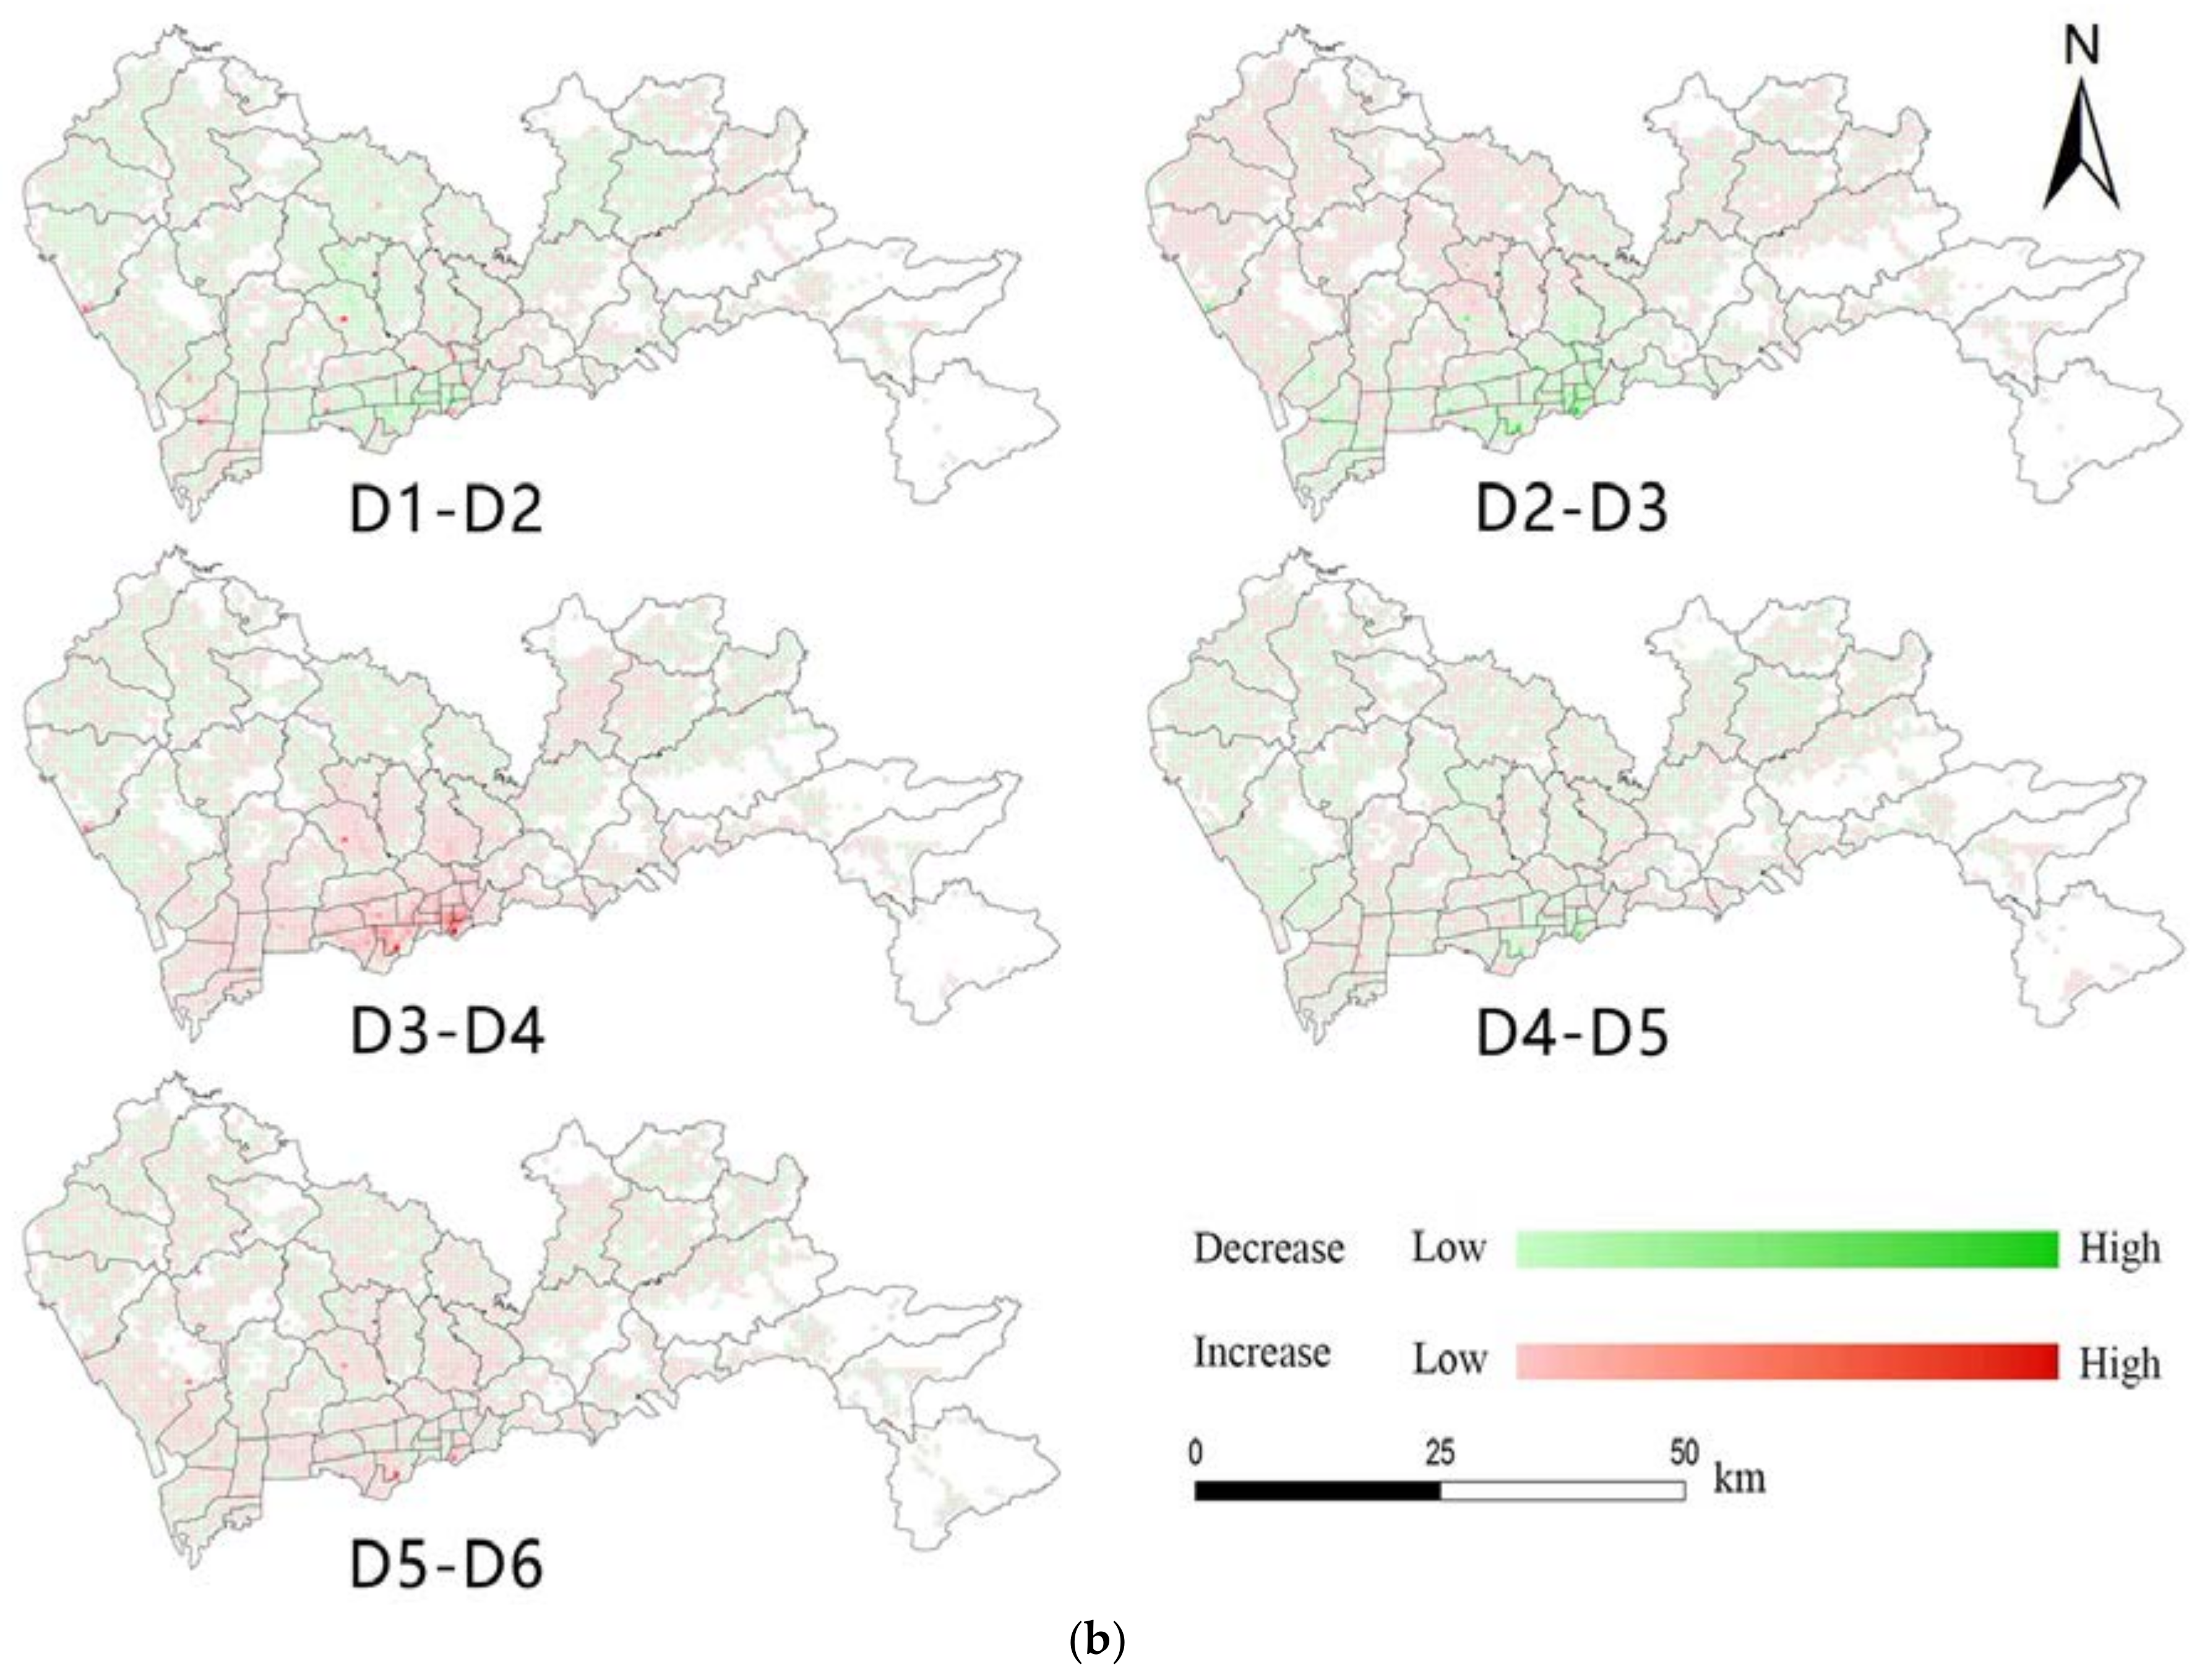
- When comparing pick-up and drop-off locations between all neighboring periods, this study shows that the predominant patterns displayed by the sub-districts within this study area are “increase- decrease- increase- increase- increase”, “decrease- decrease- increase- decrease- increase”, and “decrease- decrease- increase- increase- increase”. Nearly half of the subdistricts display these three patterns. Figure 5 displays the spatial distributions of these three predominant patterns. In Figure 5a, the subdistricts displaying Pattern 1 in pick-up number are mainly tourist spots, green areas and recreation spaces. The pick-up numbers of these subdistricts decline only in Period 3 when the subsidy war was white hot. Pattern 2 is distributed mainly over the central business districts which have the two major entry–exit ports in Shenzhen city and an important railway station. Unlike Pattern 1, the pick-up numbers of these sub-districts decline when the subsidy war just began. In addition, when the two companies cancelled the subsidy on passengers, the numbers of pick-ups decline. The sub-districts showing Pattern 3 are mainly industrial parks, hi-tech parks and recreation spaces. The only difference between Pattern 3 and Pattern 1 is that the number of pick-ups declines when the subsidy war had just begun in Pattern 3. As for the patterns of drop-off numbers, as shown in Figure 5b Pattern 1 is distributed mainly over the Luohu and Futian districts which are both central business districts in Shenzhen city. The sub-districts showing Pattern 2 are mainly tourism area, ports and hi-tech parks. In addition, Pattern 3 is distributed mainly over hi-tech parks and the tourism area.
- (2)
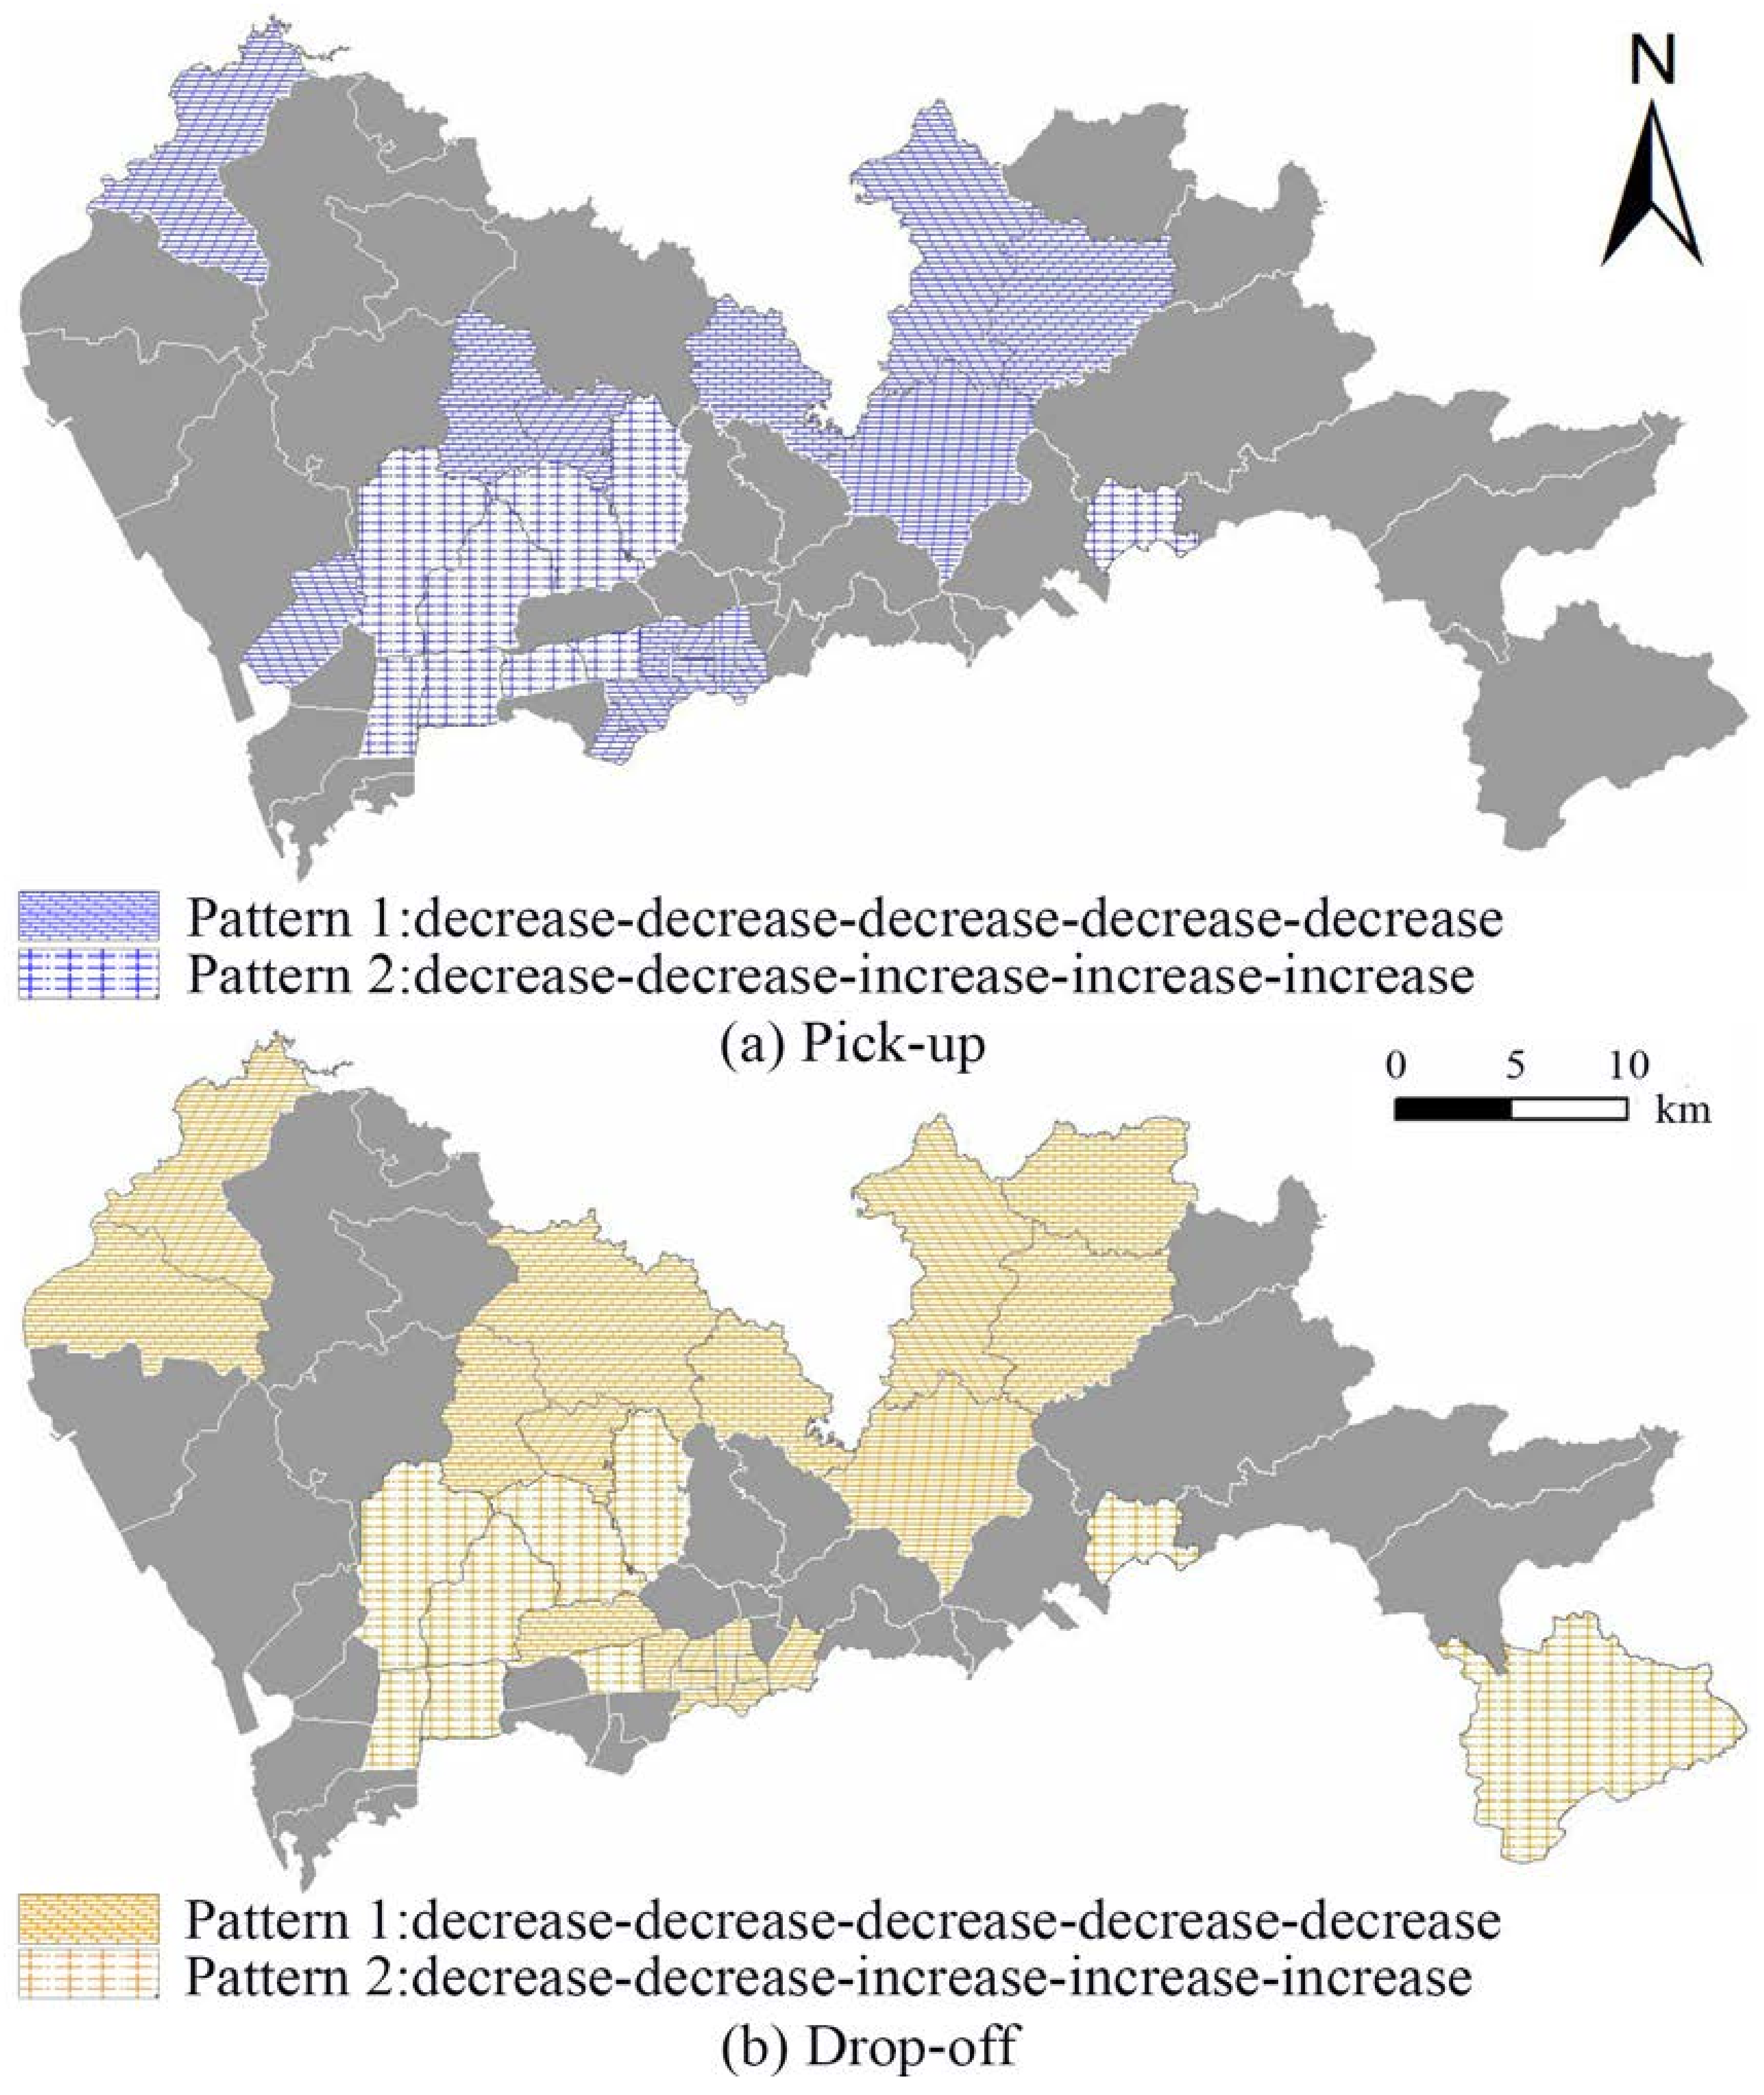
- When comparing the pick-up and drop-off locations in Period n with Period 1, this study shows that the first two predominant patterns that accounted for about half of the sub-districts are “decrease- decrease- decrease- decrease- decrease” pattern and “decrease- decrease- increase- increase- increase” patterns. Figure 6 shows the spatial distributions of these two predominant patterns. The southern sub-districts displaying Pattern 1 are the downtown area of Shenzhen city. The northern sub-districts showing Pattern 1 are mainly industrial parks. The numbers of pick ups and drop offs always decrease compared with Period 1 when the subsidy war had not begun. Pattern 2 is distributed over hi-tech parks, green spaces and tourism places. Their numbers of pick ups and drop offs decline in Period 2 and Period 3 when compared with Period 1. However, after Period 3, their numbers always increase.
- (3)
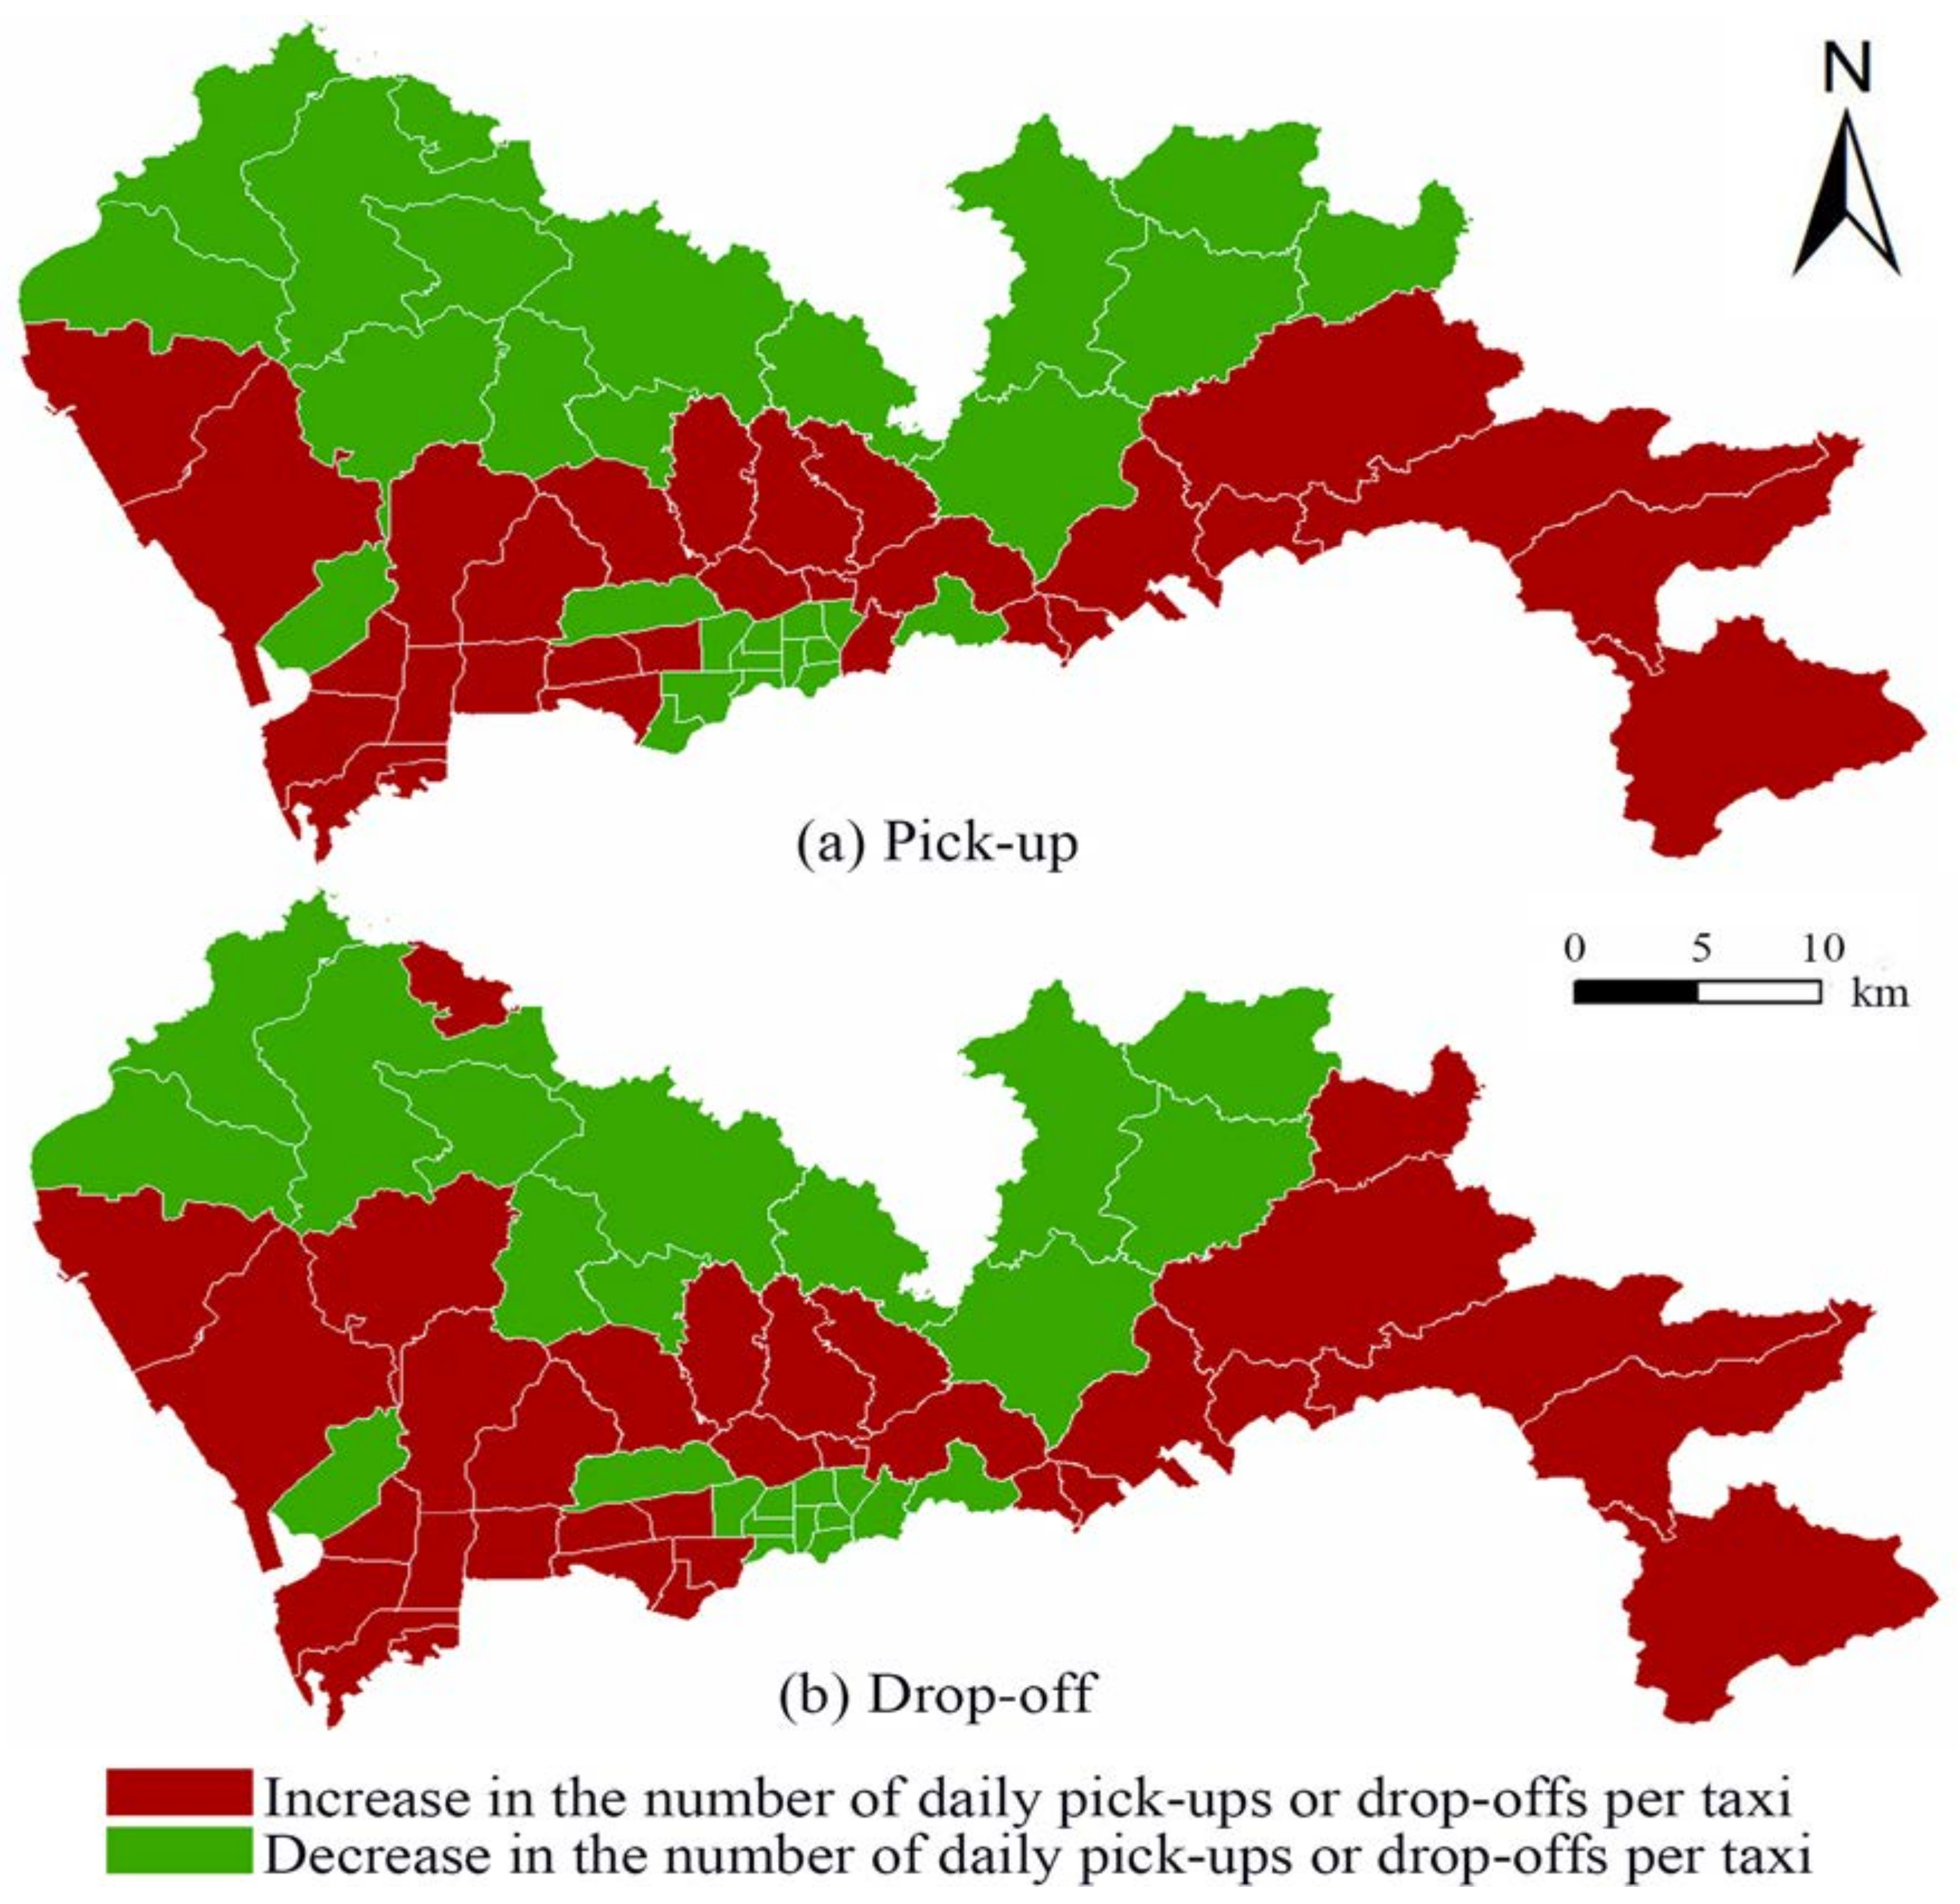
- Figure 7 shows the spatial distributions of the sub-districts with increases or decreases in the number of daily pick ups and drop offs per taxi when comparing pick-up and drop-off locations in Period 6 with Period 1. The sub-districts with an increase in the number of daily pick ups and drop offs per taxi are mainly distributed in the south with the exception of several sub-districts in the Luohu and Futian districts which are both the central business districts (CBDs) of Shenzhen city, and of Xin’an sub-district which is the political, economic, and cultural center of Baoan district. In addition, the sub-districts with a decrease in the number of daily pick ups and drop offs per taxi are mainly distributed in the north. These results indicate that the subsidy war eventually inspired travel demand mainly in the south area of Shenzhen city but does not include some downtown areas.
4.3. Stability of Spatial Distribution
4.4. Spatial Dispersion Patterns
- (1)
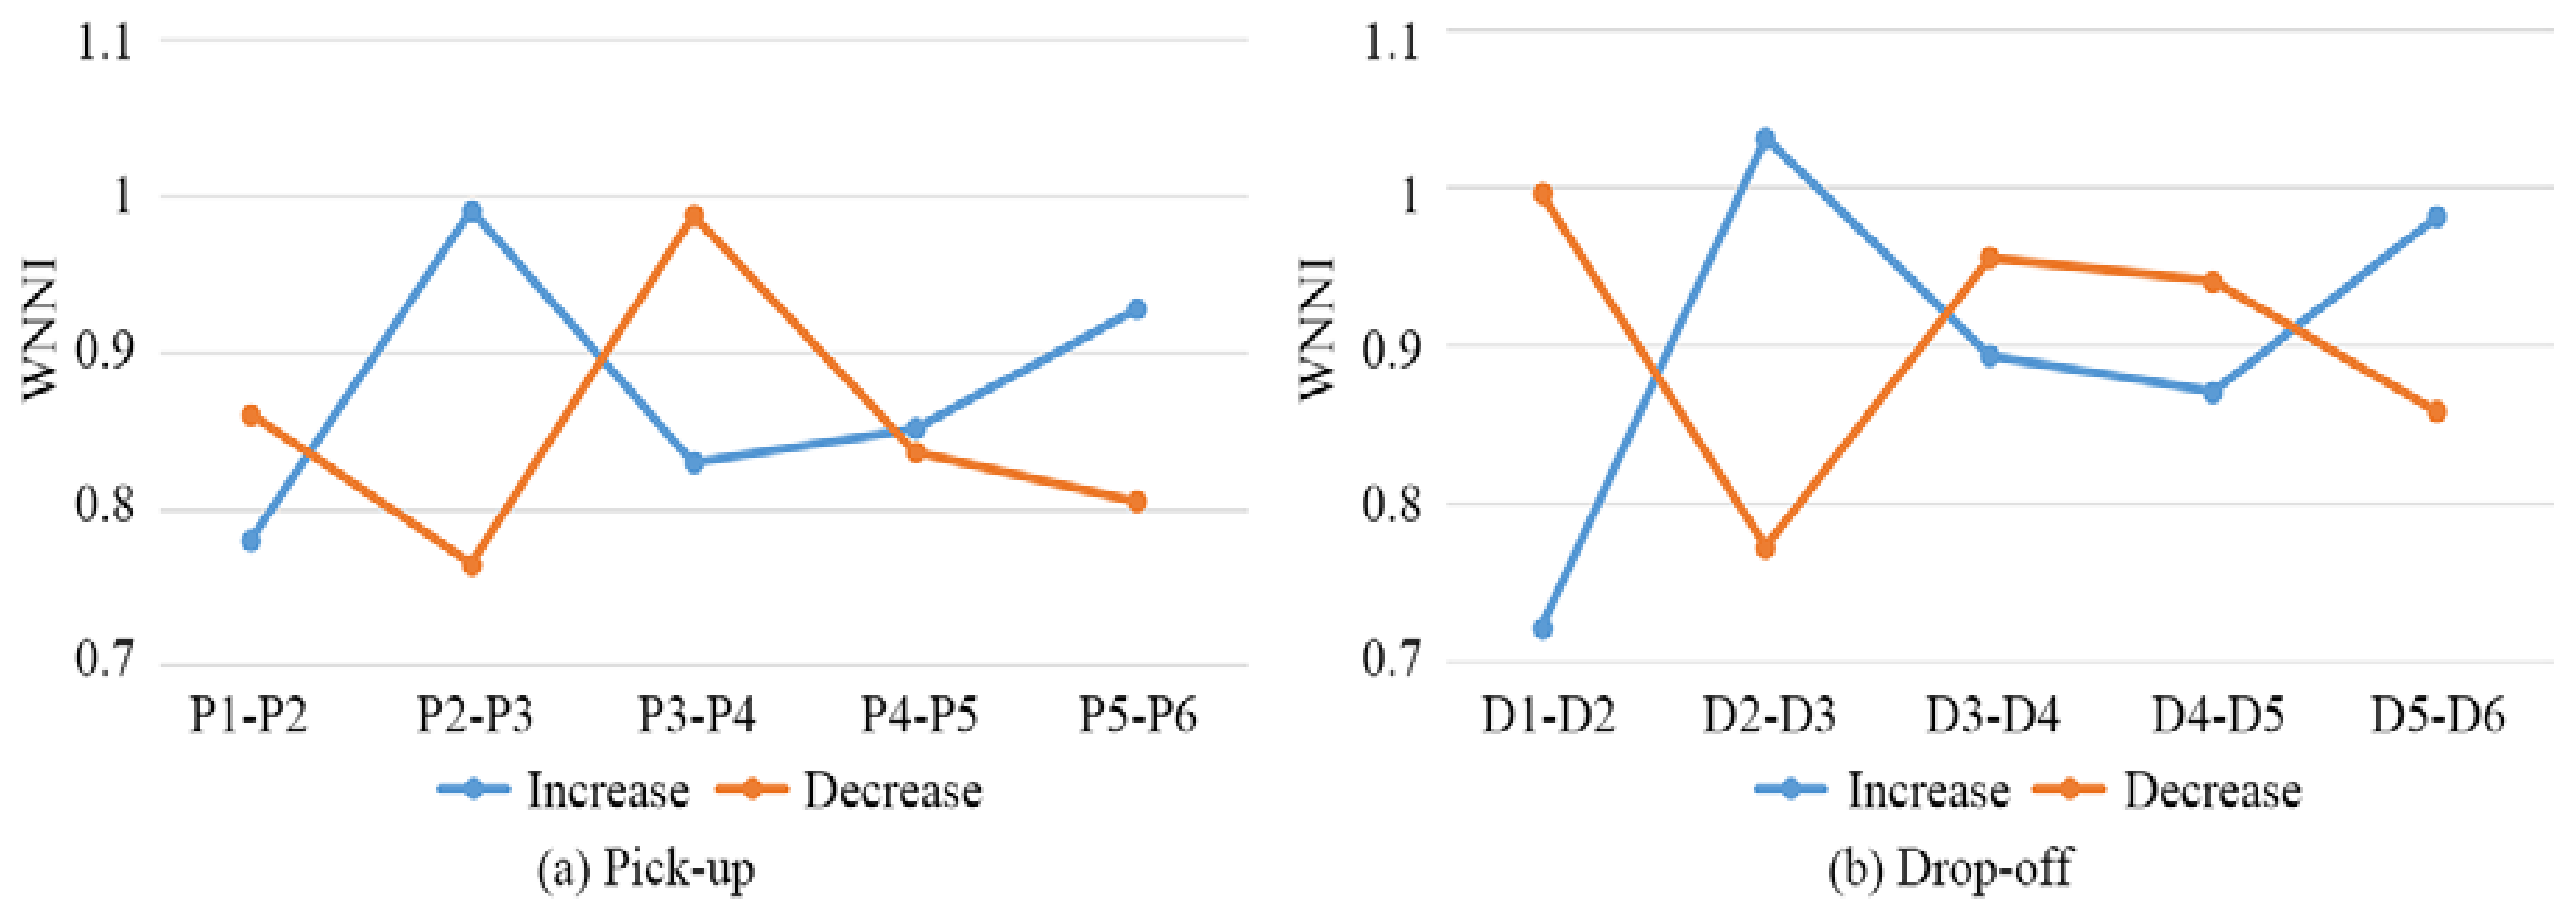
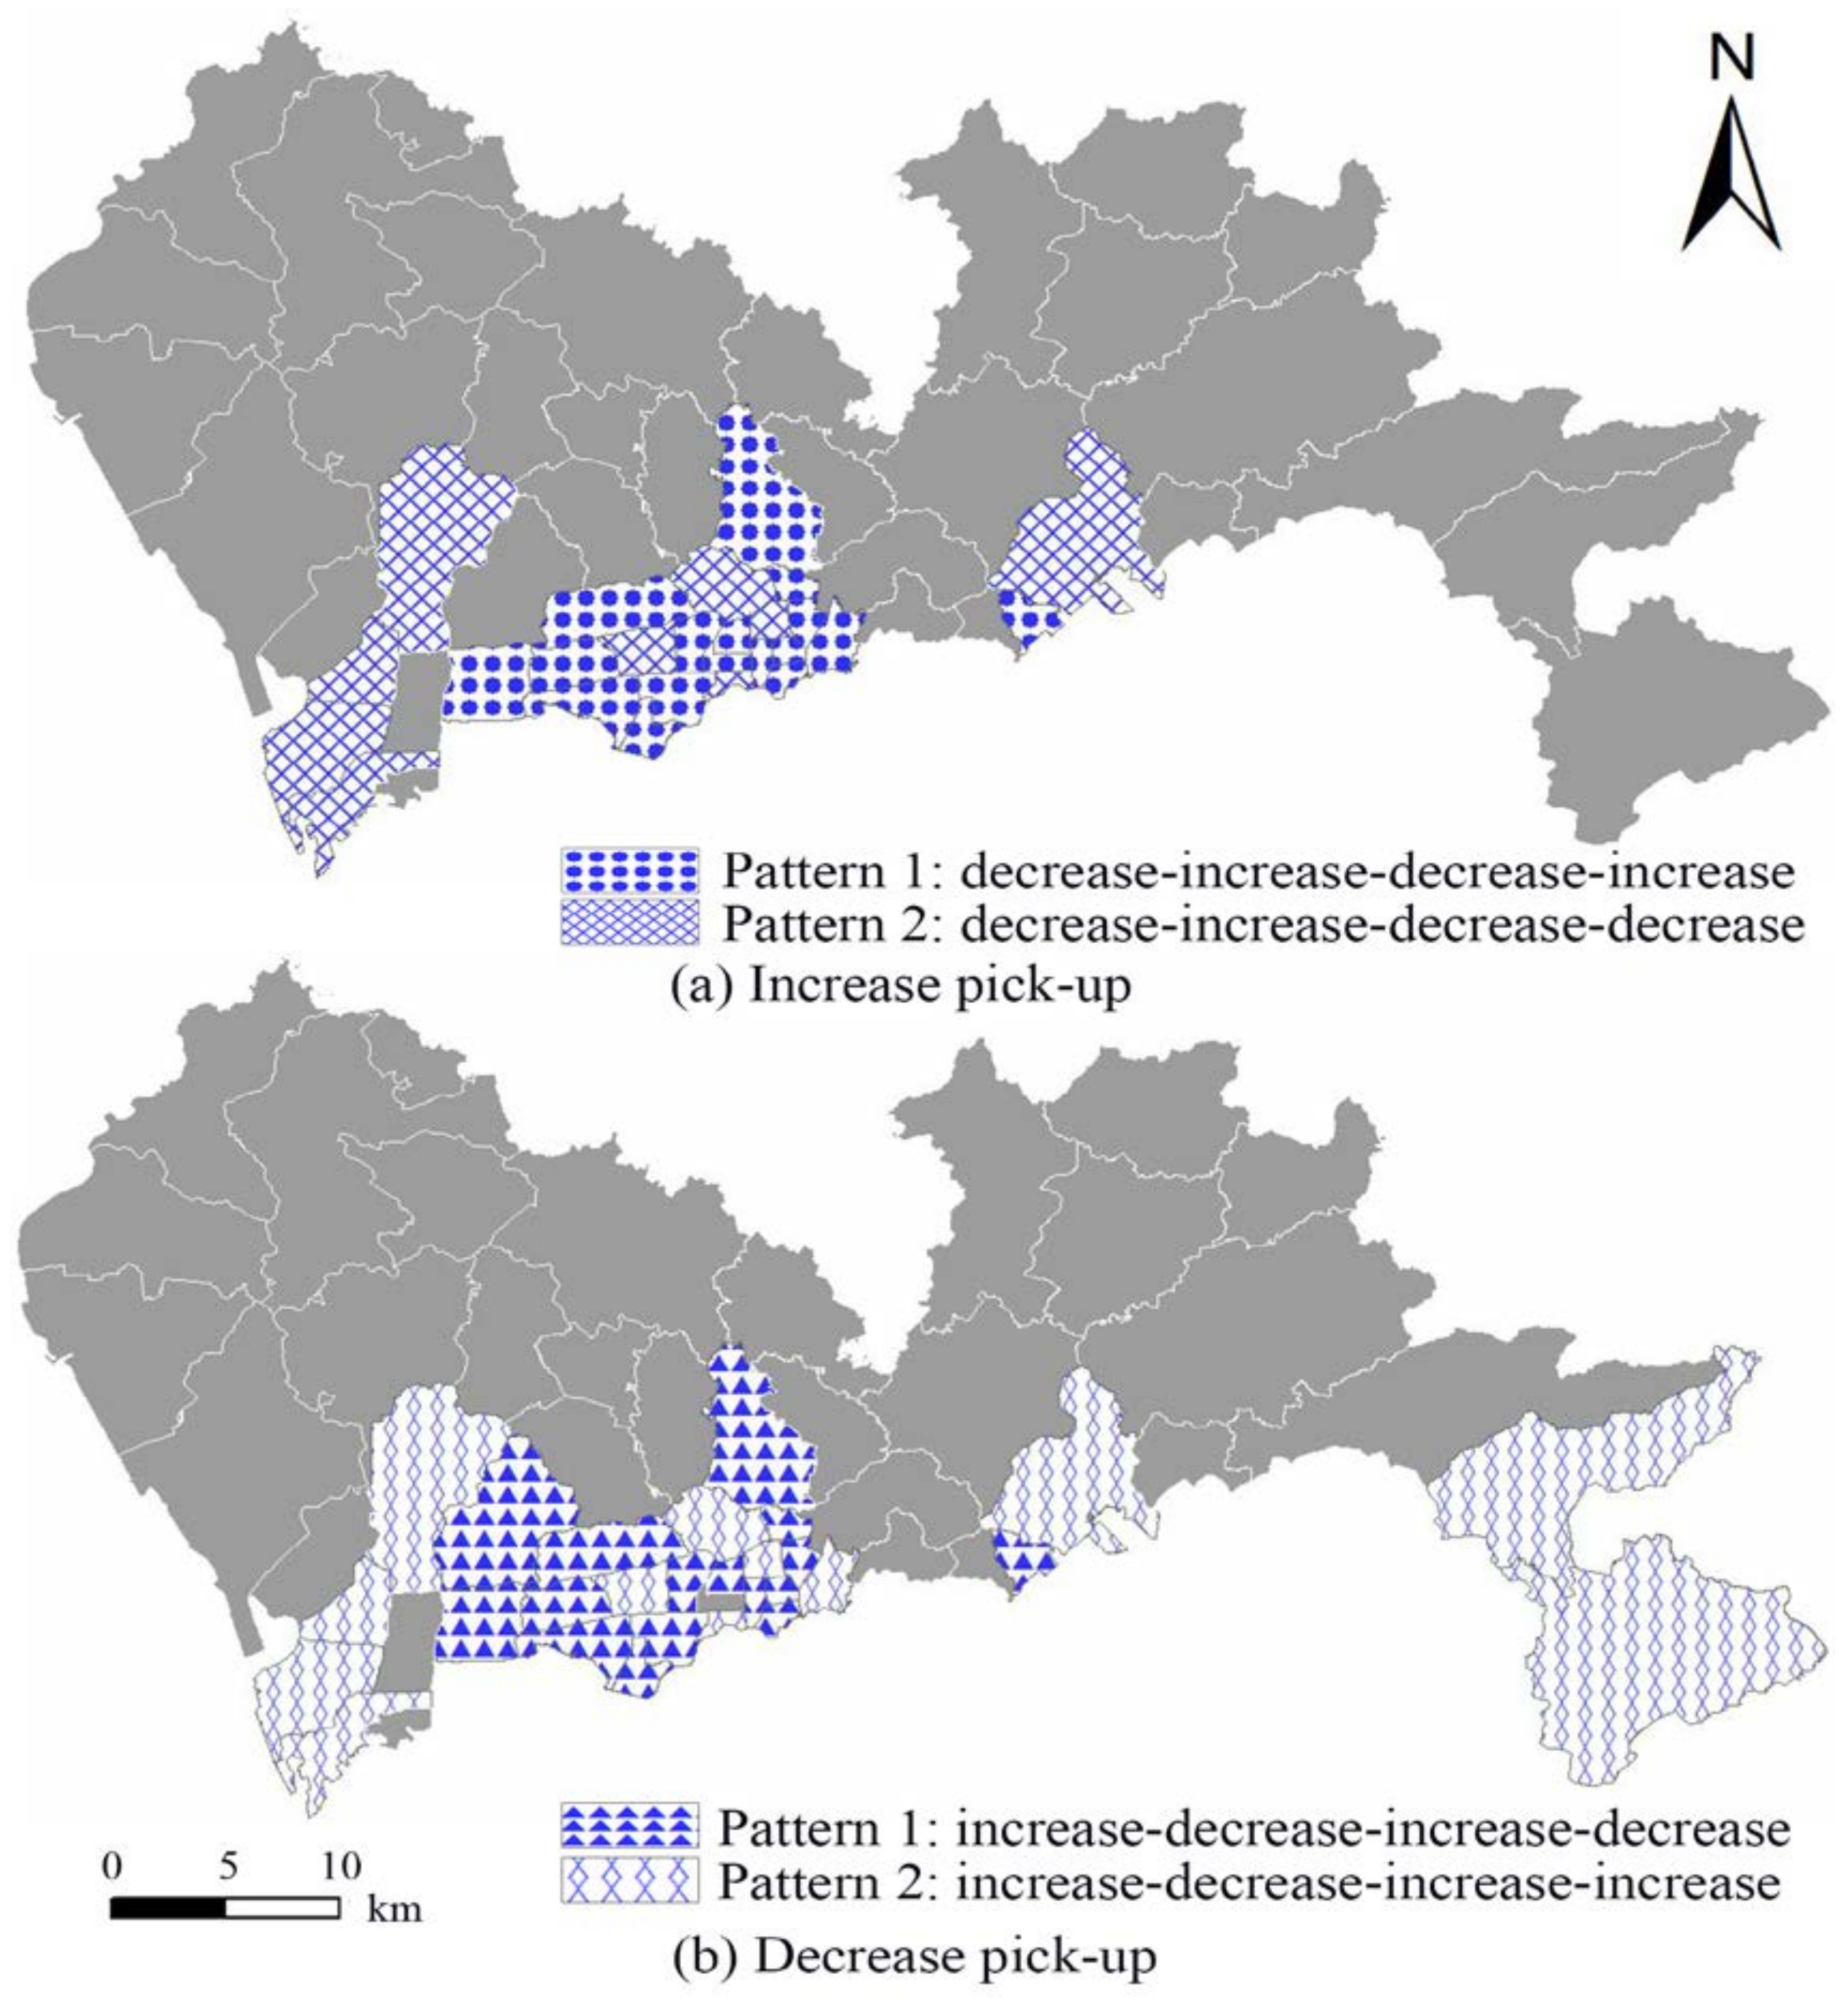
- The first two predominant patterns associated with increases in the number of pick ups in the sub-districts are “decrease- increase- decrease- increase” and “decrease- increase- decrease- decrease”, whereas the predominant patterns associated with decreases in the number of pick-ups in the sub-districts are “increase- decrease- increase- decrease” and “increase- decrease- increase- increase”. Nearly half of the sub-districts show these predominant patterns. The difference of the first two predominant patterns associated with increases or decreases in the number of pick ups lies in the last change. The last change of the first predominant pattern is an increase in WNNI, but the last change of the second predominant pattern is a decrease. Figure 9 shows the spatial distributions of sub-districts displaying predominant patterns for the increase (Figure 9a) and decrease (Figure 9b) in pick ups. Pattern 1 denotes the first predominant pattern and Pattern 2 denotes the second predominant pattern. There are both 16 sub-districts showing Pattern 1 of the WNNI in increases and decreases in the number of pick ups and 9 sub-districts showing Pattern 2 of WNNI in increases and decreases in the number of pick ups. Pattern 1 is mainly distributed over the downtown area of Shenzhen city and sub-districts with important transportation hubs such as Shenzhen railway station, Shenzhen east railway station, Luohu and Futian entry–exit ports. In addition, the sub-districts showing Pattern 2 are mainly tourism areas, hi-tech parks, and recreational places. In short, in most cases sub-districts showing the first or second predominant pattern of WNNI associated with increases in the number of pick ups will also display the first or second predominant pattern of WNNI associated with decreases in the number of pick ups.
- (2)
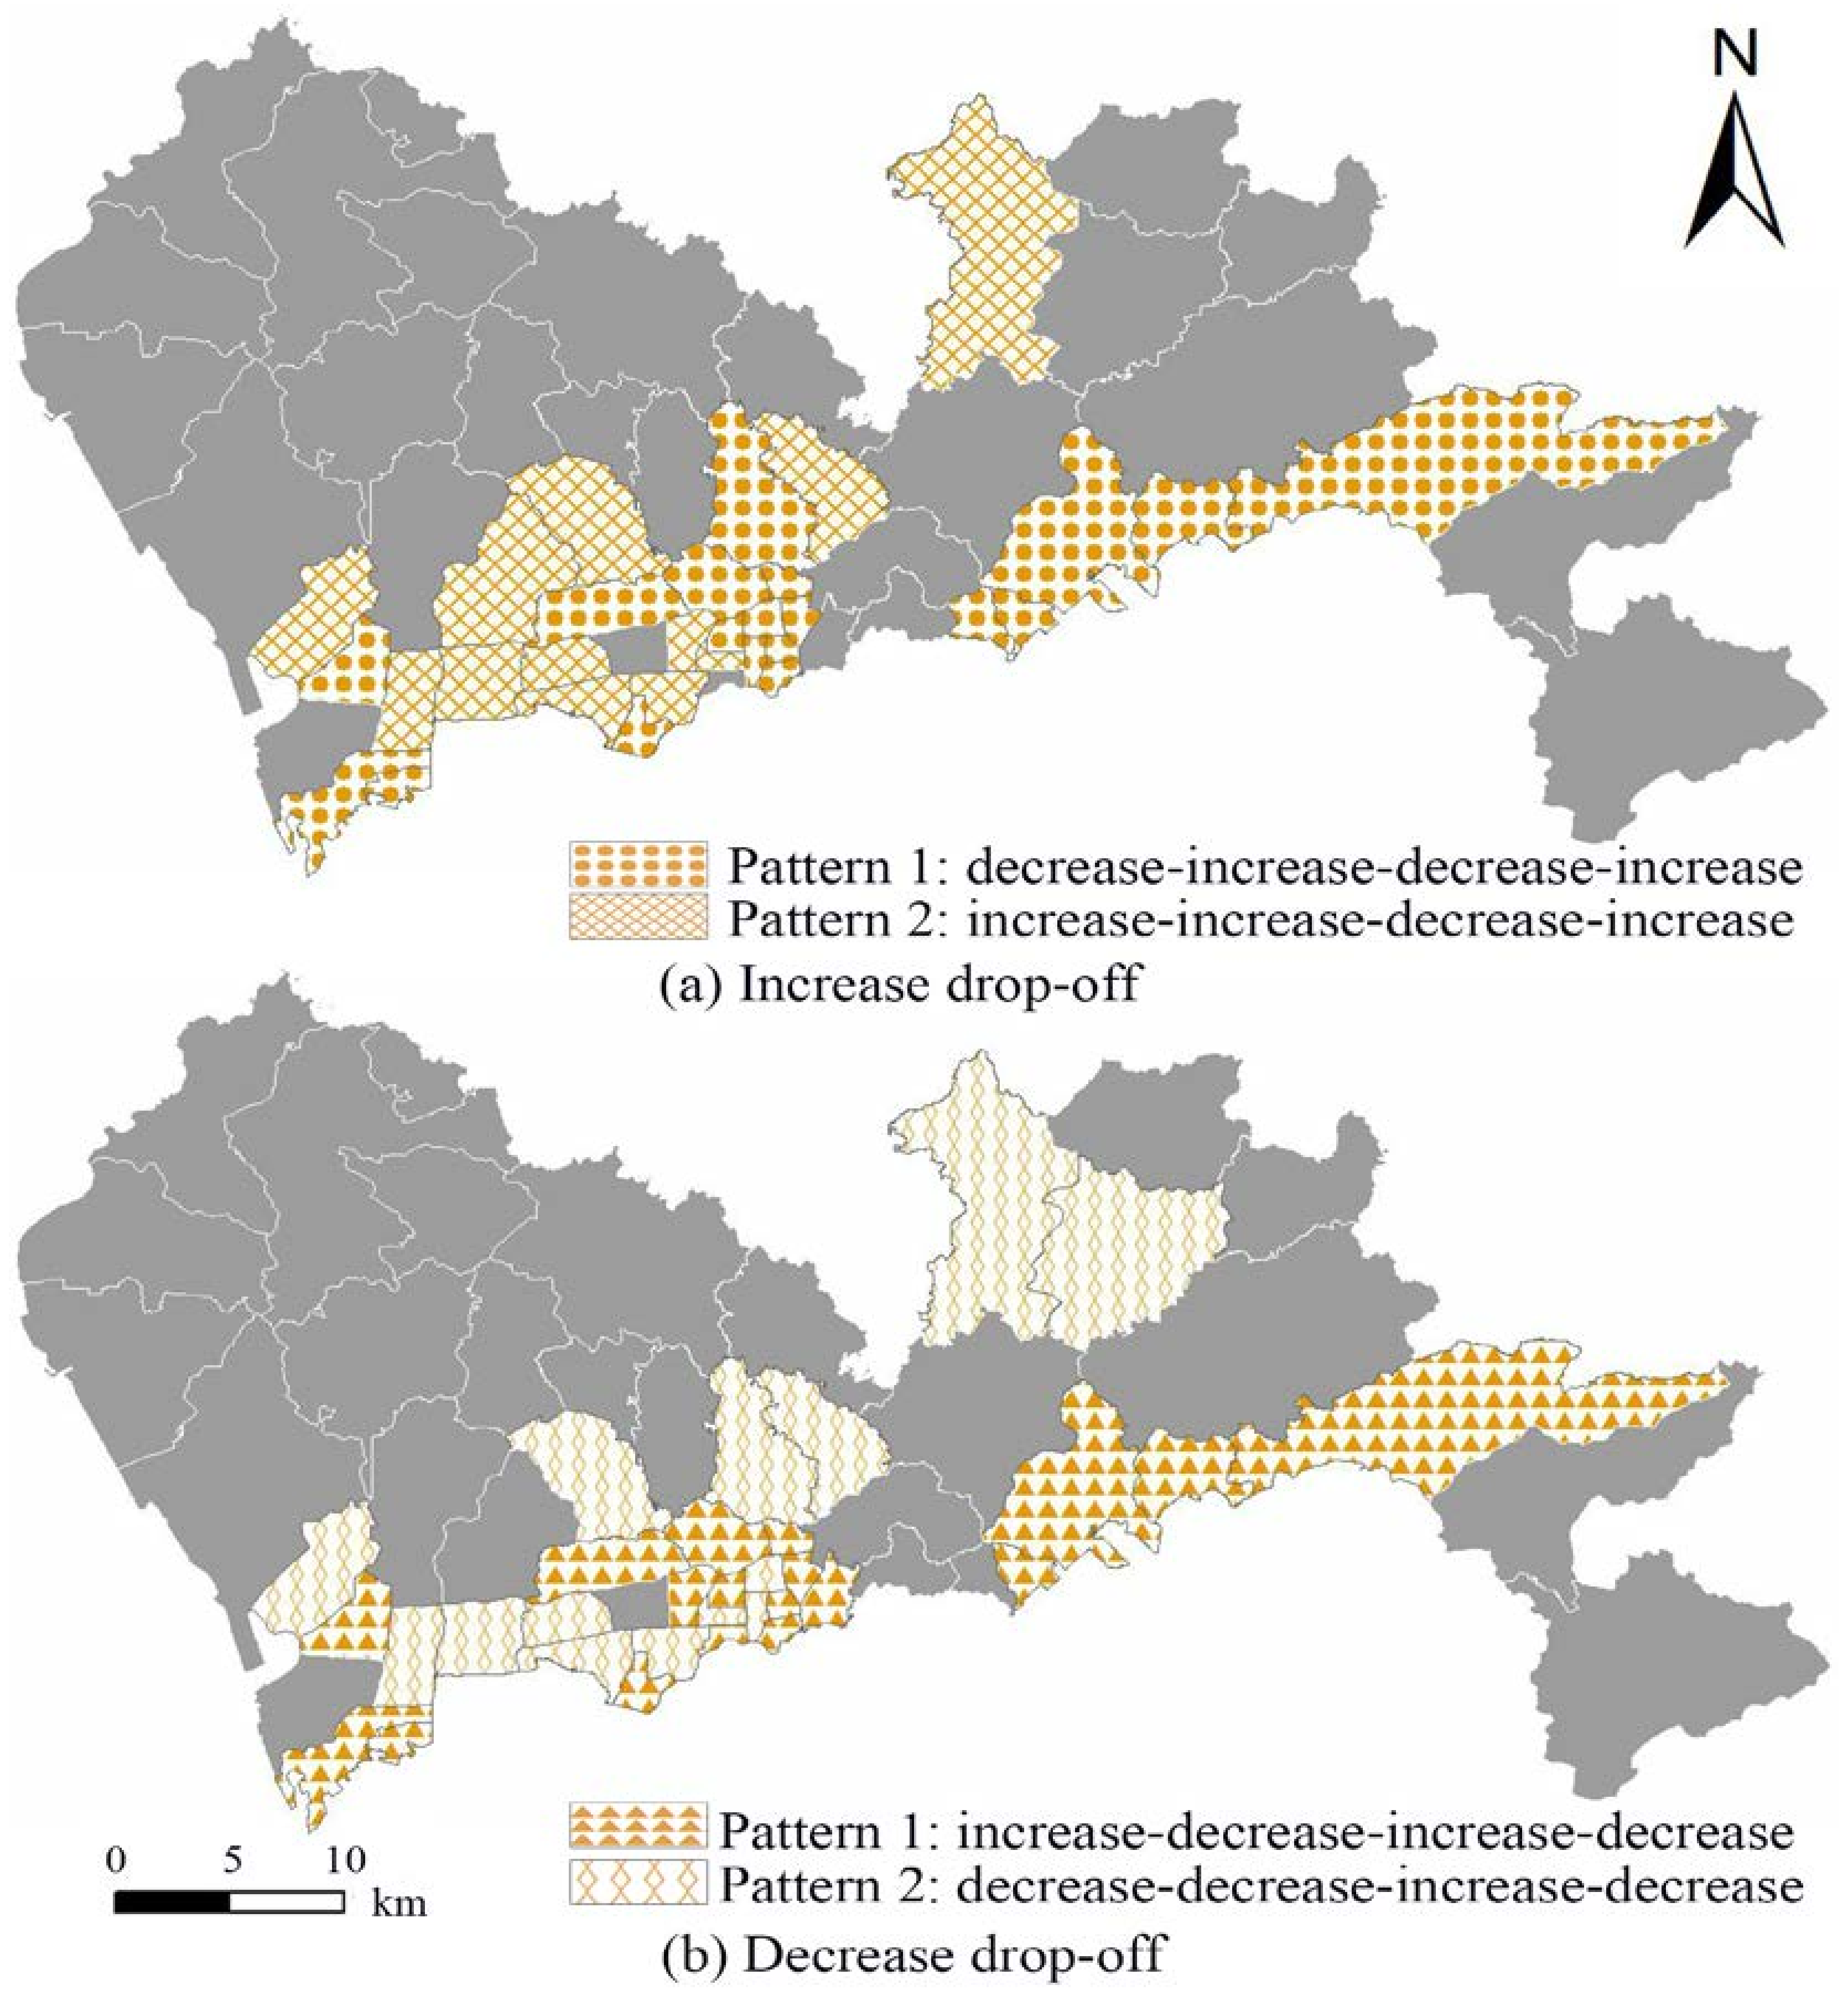
- Similarly, the first two predominant patterns for the increase in drop offs in the sub-districts are “decrease- increase- decrease- increase” and “increase- increase- decrease- increase”, whereas the predominant patterns for the decrease in drop offs in the sub-districts are “increase - decrease- increase- decrease” and “decrease- decrease- increase- decrease”. The difference of the first two predominant patterns associated with increases or decreases in the number of drop offs lies in the first change. For example, the first change of Pattern 1 of increases in the number of drop offs is a decrease in WNNI; however, the first change of Pattern 2 is an increase in WNNI. For the predominant patterns of WNNI for the decrease in drop offs, the first change of Pattern 1 is an increase in WNNI, and of Pattern 2 is a decrease in WNNI. Figure 10 shows the spatial distributions of sub-districts showing predominant patterns of WNNI for the increase (Figure 10a) and decrease (Figure 10b) in drop offs. This shows that most of the sub-districts displaying Pattern 1 (Pattern 2) in Figure 10a exhibit Pattern 1 (Pattern 2) in Figure 10b correspondingly. Specifically, there are 15 sub-districts both showing Pattern 1 of WNNI in increases and decreases in the number of drop offs and 10 sub-districts both showing Pattern 2 of WNNI in increases and decreases in the number of drop offs. Pattern 1 is mainly distributed over Luohu district which is one of the main downtown districts of Shenzhen city, sub-districts with important ports and railway stations, and recreational places. In addition, the sub-districts showing Pattern 2 are mainly hi-tech parks, industrial parks and recreational places. Besides, several sub-districts in Futian district, which is one of the main downtown districts, also present Pattern 2. Similarly, in most cases, sub-districts showing the first or second predominant pattern of WNNI associated with increases in the number of drop offs will also display the first or second predominant pattern of WNNI associated with decreases in the number of drop offs.
5. Conclusions
- (1)
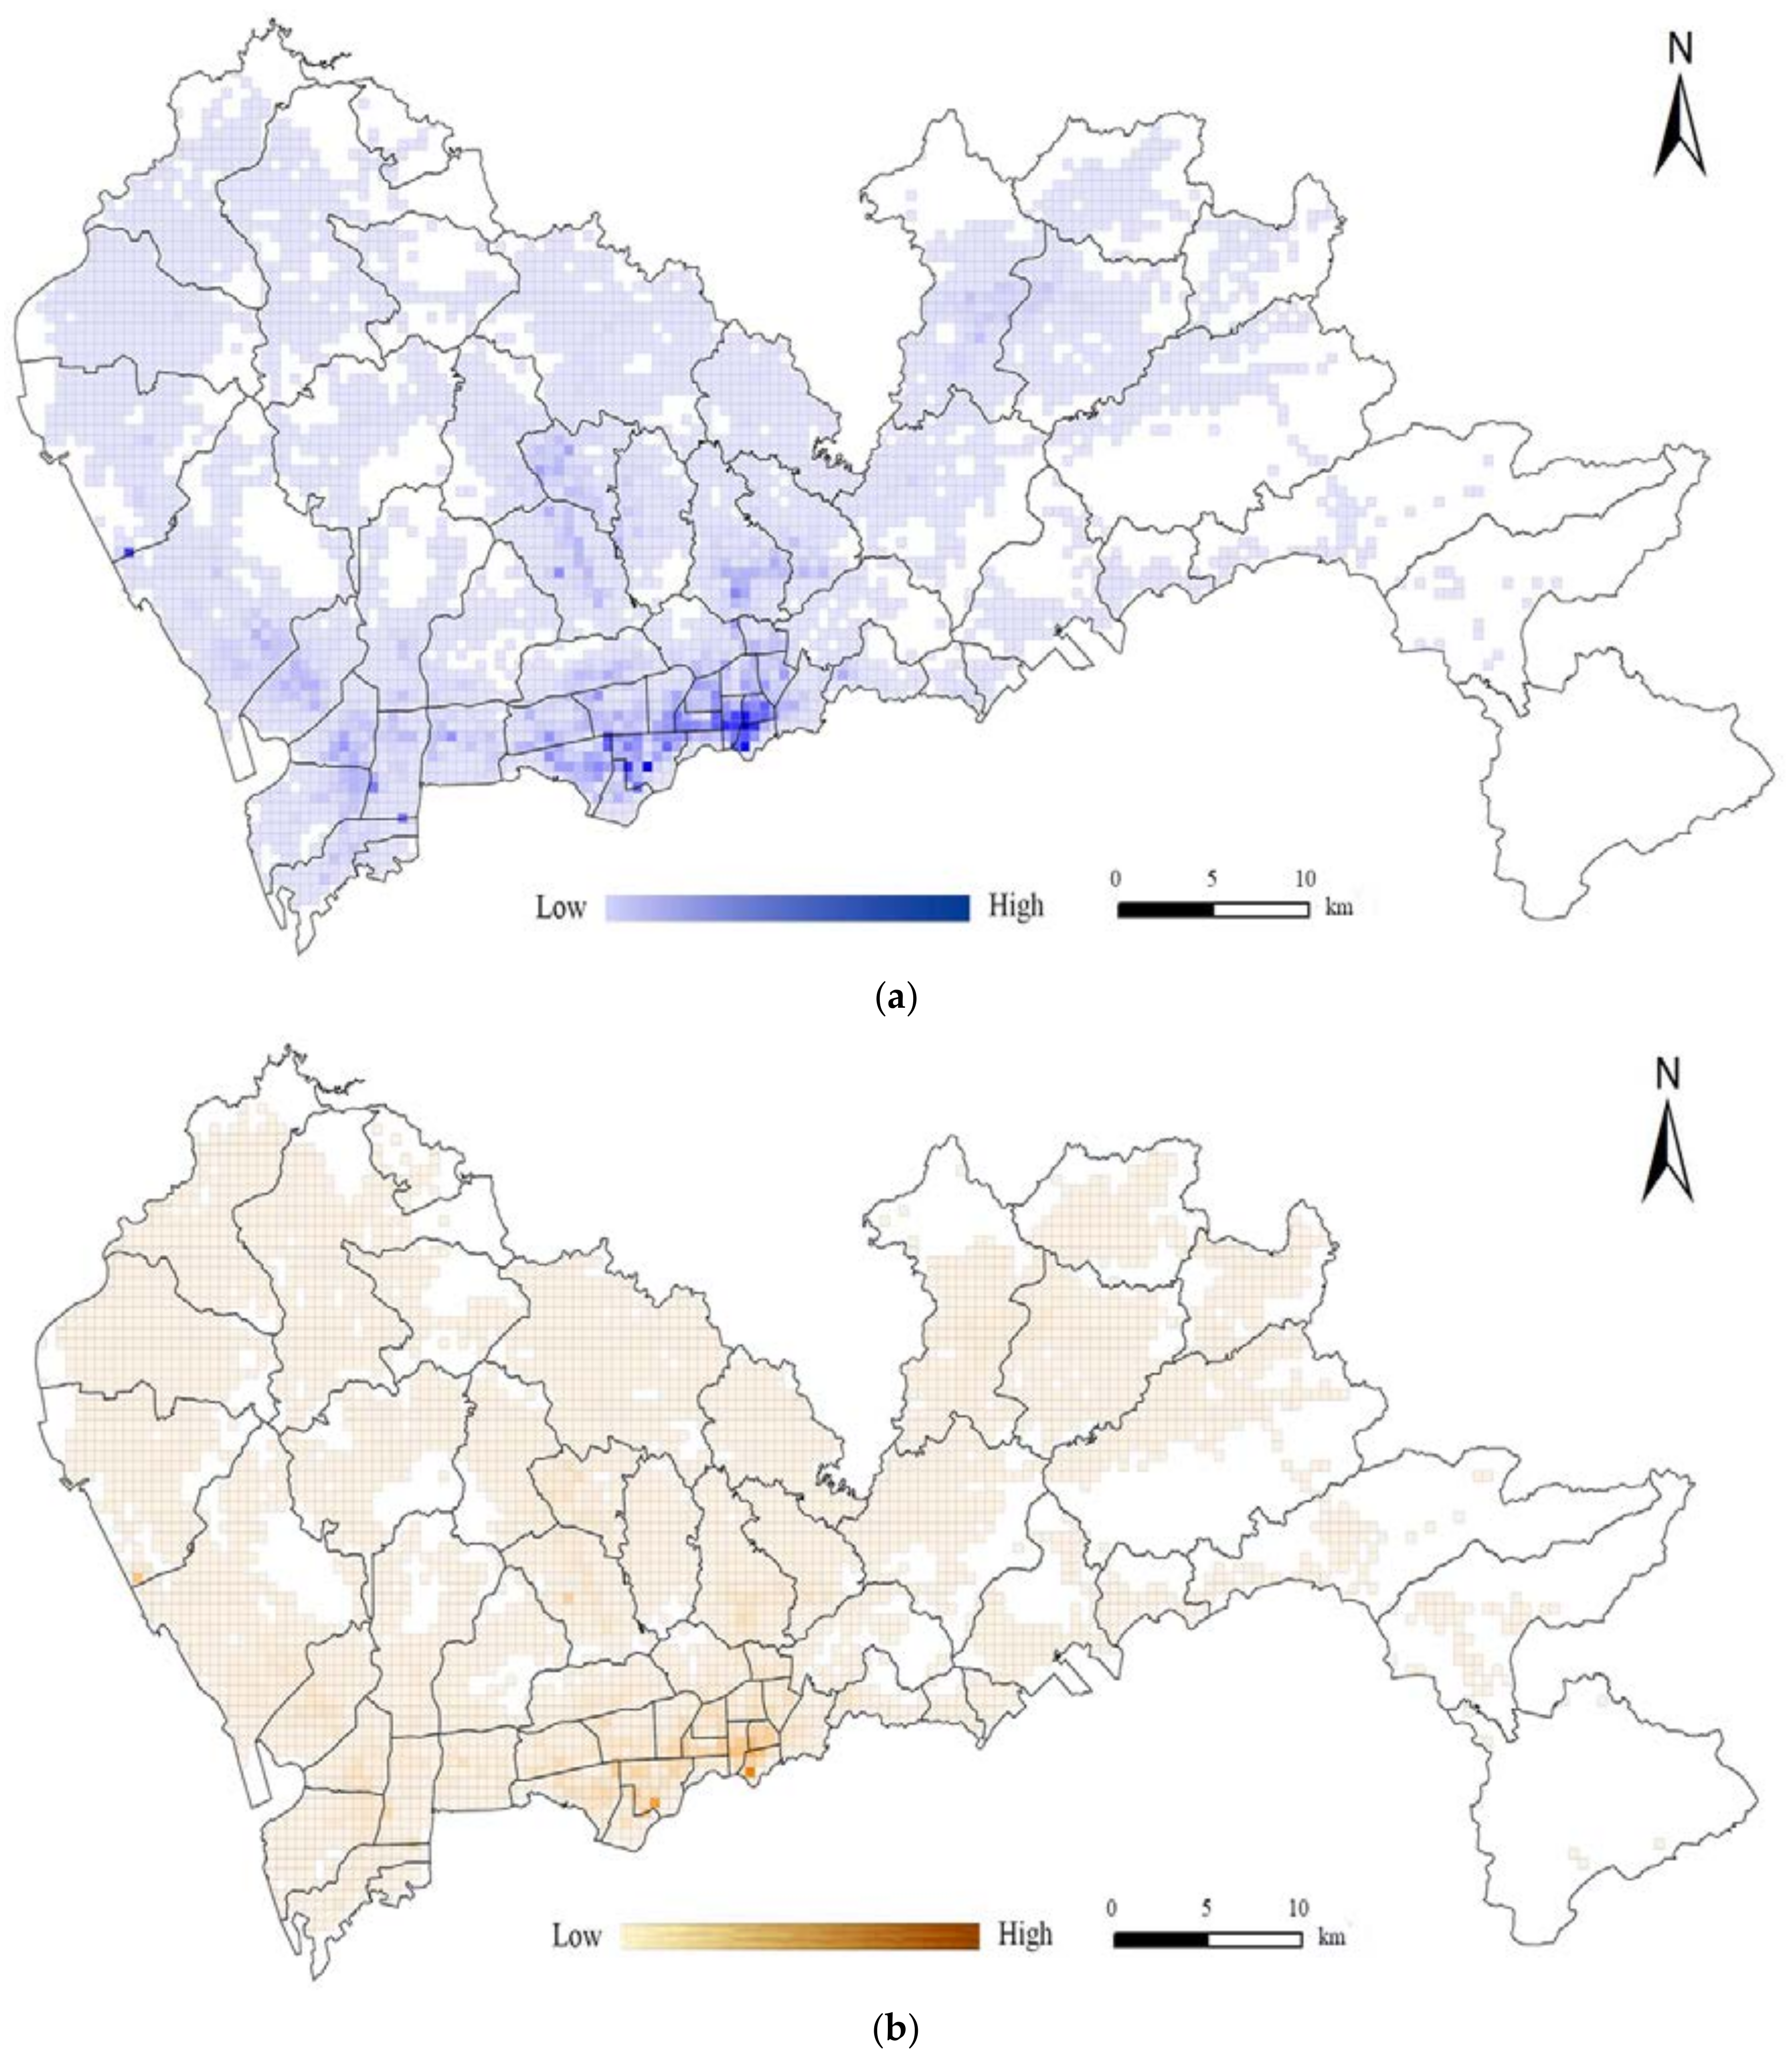
- Heatmaps displaying the spatial patterns of the total numbers of pick-up and drop-off locations indicate that the hotspot area of taxi trip demand was not significantly influenced by the subsidy war. However, the subsidy war did cause people to choose to use taxi services in greater numbers, and the increases and decreases in the numbers of drop offs and pick ups varied greatly in spatial distribution among the different periods studied. This finding demonstrates that the subsidy policies did play a role in attracting passengers to take taxi trips. Another significant finding is that the subsidy war eventually inspired travel demand mainly in the south area of Shenzhen city but not some downtown areas.
- (2)
- The spatial distribution of cells in the sub-districts that displayed decreases in the number of pick ups and drop offs appeared to be more stable, whereas the spatial distribution of areas that displayed increases in these numbers appeared to be more unstable. This finding indicates that the attracted passengers present a relatively unstable spatial pattern influenced by these subsidy policies.
- (3)
- At the city scale, the spatial dispersion of cells in the different periods showed opposite tendencies between the cells with increases in drop offs and pick ups compared with the cells with decreases. On the other hand, the pattern of change in the spatial distribution of the increases and decreases in pick ups and drop offs at the sub-district scale was inconsistent with that at the city scale. This finding indicates the local effectiveness dynamics by subsidy policies is opposite between areas with increases in drop offs and pick ups and that with decreases.
Acknowledgments
Author Contributions
Conflicts of Interest
References
- Qian, X.; Ukkusuri, S.V. Spatial variation of the urban taxi ridership using gps data. Appl. Geogr. 2015, 59, 31–42. [Google Scholar] [CrossRef]
- Litman, T. Understanding Transport Demands and Elasticities: How Prices and Other Factors Affect Travel Behavior. Available online: http://www.vtpi.org/elasticities.pdf (accessed on 22 November 2013).
- Alfred, M. Elements of Economics of Industry; Macmillan: London, UK, 1892; pp. 77–79. [Google Scholar]
- Sootoo Institute. China E-Hailing Service Market Research Report in 2017. Available online: http://www.sootoo.com/content/675157.shtml (accessed on 23 March 2018).
- González, M.C.; Hidalgo, C.A.; Barabási, A.L. Understanding individual human mobility patterns. Nature 2008, 453, 779. [Google Scholar] [CrossRef] [PubMed]
- Liu, Y.; Kang, C.; Gao, S.; Xiao, Y.; Tian, Y. Understanding intra-urban trip patterns from taxi trajectory data. J. Geogr. Syst. 2012, 14, 463–483. [Google Scholar] [CrossRef]
- Liang, X.; Zheng, X.; Lv, W.; Zhu, T.; Xu, K. The scaling of human mobility by taxis is exponential. Physica A 2012, 391, 2135–2144. [Google Scholar] [CrossRef]
- Peng, C.; Jin, X.; Wong, K.C.; Shi, M.; Liò, P. Collective human mobility pattern from taxi trips in urban area. PLoS ONE 2012, 7, e34487. [Google Scholar]
- Kang, C.; Ma, X.; Tong, D.; Liu, Y. Intra-urban human mobility patterns: An urban morphology perspective. Physica A 2012, 391, 1702–1717. [Google Scholar] [CrossRef]
- Wang, W.; Pan, L.; Yuan, N.; Zhang, S.; Liu, D. A comparative analysis of intra-city human mobility by taxi. Physica A 2015, 420, 134–147. [Google Scholar] [CrossRef]
- Chen, G.; Jin, X.; Yang, J. Study on spatial and temporal mobility pattern of urban taxi services. In Proceedings of the International Conference on Intelligent Systems and Knowledge Engineering, Hangzhou, China, 15–16 November 2011; pp. 422–425. [Google Scholar]
- Yao, C.Z.; Lin, J.N. A study of human mobility behavior dynamics: A perspective of a single vehicle with taxi. Transp. Res. Part A Policy Pract. 2016, 87, 51–58. [Google Scholar] [CrossRef]
- Zheng, Z.; Rasouli, S.; Timmermans, H. Two-regime Pattern in Human Mobility: Evidence from GPS Taxi Trajectory Data. Geogr. Anal. 2016, 48, 157–175. [Google Scholar] [CrossRef]
- Kang, C.; Qin, K. Understanding operation behaviors of taxicabs in cities by matrix factorization. Comput. Environ. Urban Syst. 2016, 60, 79–88. [Google Scholar] [CrossRef]
- Zhang, S.; Tang, J.; Wang, H.; Wang, Y.; An, S. Revealing intra-urban travel patterns and service ranges from taxi trajectories. J. Transp. Geogr. 2017, 61, 72–86. [Google Scholar] [CrossRef]
- Ganti, R.; Mohomed, I.; Raghavendra, R.; Ranganathan, A. Analysis of Data from a Taxi Cab Participatory Sensor Network. Mob. Ubiquitous Syst. 2011, 104, 197–208. [Google Scholar]
- Pei, T.; Wang, W.; Zhang, H.; Ma, T.; Du, Y.; Zhou, C. Density-based clustering for data containing two types of points. Int. J. Geogr. Inf. Sci. 2015, 29, 175–193. [Google Scholar] [CrossRef]
- Qian, X.; Zhan, X.; Ukkusuri, S.V. Characterizing Urban Dynamics Using Large Scale Taxicab Data. In Engineering and Applied Sciences Optimization; Springer: Berlin, Germany, 2015; pp. 17–32. [Google Scholar]
- Hoque, M.A.; Hong, X.; Dixon, B. Analysis of mobility patterns for urban taxi cabs. In Proceedings of the International Conference on Computing, Networking and Communications, Maui, HI, USA, 30 January–2 February 2012; pp. 756–760. [Google Scholar]
- Li, X.; Pan, G.; Wu, Z.; Qi, G.; Li, S.; Zhang, D.; Wang, Z. Prediction of urban human mobility using large-scale taxi traces and its applications. Front. Comput. Sci. 2012, 6, 111–121. [Google Scholar]
- Liu, Y.; Wang, F.; Xiao, Y.; Gao, S. Urban land uses and traffic ‘source-sink areas’: Evidence from gps-enabled taxi data in shanghai. Landsc. Urban Plan. 2012, 106, 73–87. [Google Scholar] [CrossRef]
- Zhang, D.; Huang, J.; Li, Y.; Zhang, F.; Xu, C.; He, T. Exploring human mobility with multi-source data at extremely large metropolitan scales. In Proceedings of the International Conference on Mobile Computing and Networking, Maui, HI, USA, 7–11 September 2014; pp. 201–212. [Google Scholar]
- Momtazpour, M.; Ramakrishnan, N. Characterizing taxi flows in New York City. In Proceedings of the International Workshop on Urban Computing, Sydney, Australia, 10 August 2015. [Google Scholar]
- Scholz, R.W.; Lu, Y. Detection of dynamic activity patterns at a collective level from large-volume trajectory data. Int. J. Geogr. Inf. Sci. 2014, 28, 946–963. [Google Scholar] [CrossRef]
- Liu, L.; Andris, C.; Ratti, C. Uncovering cabdrivers’ behavior patterns from their digital traces. Comput. Environ. Urban Syst. 2010, 34, 541–548. [Google Scholar] [CrossRef]
- Doraiswamy, H.; Ferreira, N.; Damoulas, T.; Freire, J.; Silva, C.T. Using topological analysis to support event-guided exploration in urban data. IEEE Trans. Vis. Comput. Gr. 2014, 20, 2634–2643. [Google Scholar] [CrossRef] [PubMed]
- Li, Q.; Zhang, T.; Wang, H.; Zeng, Z. Dynamic accessibility mapping using floating car data: A network-constrained density estimation approach. J. Transp. Geogr. 2011, 19, 379–393. [Google Scholar] [CrossRef]
- Cui, J.X.; Liu, F.; Hu, J.; Janssens, D.; Wets, G.; Cools, M. Identifying mismatch between urban travel demand and transport network services using gps data. Neurocomputing 2016, 181, 4–18. [Google Scholar] [CrossRef]
- Fang, Z.; Shaw, S.L.; Tu, W.; Li, Q.; Li, Y. Spatiotemporal analysis of critical transportation links based on time geographic concepts: A case study of critical bridges in Wuhan, China. J. Transp. Geogr. 2012, 23, 44–59. [Google Scholar] [CrossRef]
- Chu, D.; Sheets, D.A.; Zhao, Y.; Wu, Y.; Yang, J.; Zheng, M.; Chen, G. Visualizing Hidden Themes of Taxi Movement with Semantic Transformation. In Proceedings of the Visualization Symposium, Yokohama, Japan, 4–7 March 2014; pp. 137–144. [Google Scholar]
- Hu, Y.; Miller, H.J.; Li, X. Detecting and analyzing mobility hotspots using surface networks. Trans. GIS 2015, 18, 911–935. [Google Scholar] [CrossRef]
- Zhao, P.X.; Qin, K.; Zhou, Q.; Liu, C.K.; Chen, Y.X. Detecting hotspots from taxi trajectory data using spatial cluster analysis. In Proceedings of the International Workshop on Spatioltemporal Computing, Fairfax, VR, USA, 13–15 July 2015; pp. 131–135. [Google Scholar]
- Yue, Y.; Wang, H.D.; Hu, B.; Li, Q.Q. Identifying shopping center attractiveness using taxi trajectory data. In Proceedings of the International Workshop on Trajectory Data Mining and Analysis, Beijing, China, 18 September 2011; pp. 31–36. [Google Scholar]
- Hochmair, H.H. Spatiotemporal pattern analysis of taxi trips in New York City. Transp. Res. Rec. J. Transp. Res. Board 2016, 2542, 45–56. [Google Scholar] [CrossRef]
- Qi, G.; Li, X.; Li, S.; Pan, G.; Wang, Z.; Zhang, D. Measuring social functions of city regions from large-scale taxi behaviors. In Proceedings of the IEEE International Conference on Pervasive Computing and Communications Workshops, Seattle, WA, USA, 21–25 March 2011; pp. 384–388. [Google Scholar]
- Yuan, J.; Zheng, Y.; Xie, X. Discovering regions of different functions in a city using human mobility and POIs. In Proceedings of the ACM SIGKDD International Conference on Knowledge Discovery and Data Mining, Beijing, China, 12–16 August 2012; pp. 186–194. [Google Scholar]
- Mazimpaka, J.D.; Timpf, S. Exploring the Potential of Combining Taxi GPS and Flickr Data for Discovering Functional Regions; AGILE 2015; Springer: Berlin, Germany, 2015; pp. 3–18. [Google Scholar]
- Pan, G.; Qi, G.; Zhang, D.; Zhang, D.; Li, S. Land-use classification using taxi gps traces. IEEE Trans. Intell. Transp. Syst. 2013, 14, 113–123. [Google Scholar] [CrossRef]
- Liu, X.; Kang, C.; Gong, L.; Liu, Y. Incorporating spatial interaction patterns in classifying and understanding urban land use. Int. J. Geogr. Inf. Sci. 2016, 30, 334–350. [Google Scholar] [CrossRef]
- Demsar, U.; Reades, J.; Manley, E.; Batty, J. Edge-based communities for identification of functional regions in a taxi flow network. Am. J. Ophthalmol. 2014, 83, 267–271. [Google Scholar]
- Zhong, C.; Arisona, S.M.; Huang, X.; Batty, M.; Schmitt, G. Detecting the dynamics of urban structure through spatial network analysis. Int. J. Geogr. Inf. Sci. 2014, 28, 2178–2199. [Google Scholar] [CrossRef]
- Liu, X.; Gong, L.; Gong, Y.; Liu, Y. Revealing travel patterns and city structure with taxi trip data. J. Transp. Geogr. 2015, 43, 78–90. [Google Scholar] [CrossRef]
- Long, Y.; Han, H.; Tu, Y.; Shu, X. Evaluating the effectiveness of urban growth boundaries using human mobility and activity records. Cities 2015, 46, 76–84. [Google Scholar] [CrossRef]
- Veloso, M.; Phithakkitnukoon, S.; Bento, C. Urban mobility study using taxi traces. In Proceedings of the International Workshop on Trajectory Data Mining and Analysis, Beijing, China, 18 September 2011; pp. 23–30. [Google Scholar]
- Zheng, Y.; Liu, Y.; Yuan, J.; Xie, X. Urban computing with taxicabs. In Proceedings of the International Conference on Ubiquitous Computing, Beijing, China, 17–21 September 2011; pp. 89–98. [Google Scholar]
- Zhou, Y.; Fang, Z.; Thill, J.C.; Li, Q.; Li, Y. Functionally critical locations in an urban transportation network: Identification and space–time analysis using taxi trajectories. Comput. Environ. Urban Syst. 2015, 52, 34–47. [Google Scholar] [CrossRef]
- Mittal, Y.; Naik, V.; Gunturi, V. Finding optimal locations for taxi stands on city map. Ph.D. Thesis, Indraprastha Institute of Information Technology, Delhi, India, 2016. [Google Scholar]
- Wen, J.; Zou, M.; Ma, Y.; Luo, H. Evaluating the influence of taxi subsidy programs on mitigating difficulty getting a taxi in basis of taxi empty-loaded rate. Int. J. Stat. Probab. 2017, 6, 9–20. [Google Scholar] [CrossRef]
- Cramer, J.; Krueger, A.B. Disruptive change in the taxi business: The case of Uber. Am. Econ. Rev. 2015, 106, 177–182. [Google Scholar] [CrossRef]
- Hall, J.V.; Krueger, A.B. An Analysis of the Labor Market for Uber’s Driver-Partners in the United States; Technical Report; National Bureau of Economic Research: Cambridge, MA, USA, 2016. [Google Scholar]
- Rayle, L.; Dai, D.; Chan, N.; Cervero, R.; Shaheen, S. Just a better taxi? A survey-based comparison of taxis, transit, and ridesourcing services in San Francisco. Transp. Policy 2016, 45, 168–178. [Google Scholar] [CrossRef]
- Wong, R.C.P.; Szeto, W.Y.; Wong, S.C. Bi-level decisions of vacant taxi drivers traveling towards taxi stands in customer-search: Modeling methodology and policy implications. Transp. Policy 2014, 33, 73–81. [Google Scholar] [CrossRef] [Green Version]
- Cheng, S.F.; Santani, D.; Woodard, C.J. Optimal Routing Policy for Taxi Queuing. In Proceedings of the INFORMS Annual Meeting, Washington, DC, USA, 12–15 October 2008. [Google Scholar]
- Kim, Y.J.; Hwang, H. Incremental discount policy for taxi fare with price-sensitive demand. Int. J. Prod. Econ. 2008, 112, 895–902. [Google Scholar] [CrossRef]
- Sharaby, N.; Shiftan, Y. The impact of fare integration on travel behavior and transit ridership. Transp. Policy 2012, 21, 63–70. [Google Scholar] [CrossRef]
- Schaller, B. Issues in fare policy: Case of the New York taxi industry. Transp. Res. Rec. J. Transp. Res. Board 1998, 1618, 139–142. [Google Scholar] [CrossRef]
- Çetin, T.; Eryigit, K.Y. The economic effects of government regulation: Evidence from the New York taxicab market. Transp. Policy 2013, 25, 169–177. [Google Scholar] [CrossRef]
- Khalilikhah, M.; Habibian, M.; Heaslip, K. Acceptability of increasing petrol price as a tdm pricing policy: A case study in tehran. Transp. Policy 2016, 45, 136–144. [Google Scholar] [CrossRef]
- Gärling, T.; Laitila, T.; Marell, A.; Westin, K. A note on the short-term effects of deregulation of the Swedish taxi-cab industry. J. Transp. Econ. Policy 1995, 29, 209–214. [Google Scholar]
- Cascajo, R.; Olvera, L.D.; Monzon, A.; Plat, D.; Ray, J.B. Impacts of the economic crisis on household transport expenditure and public transport policy: Evidence from the Spanish case. Transp. Policy 2018, 65, 40–50. [Google Scholar] [CrossRef]
- Schwarz-Miller, A.; Talley, W.K. Effects of public transit policies on taxi drivers’ wages. J. Labor Res. 2003, 24, 131–142. [Google Scholar] [CrossRef]
- Chang, T. Optimal taxi market control operated with a flexible initial fare policy. In Proceedings of the International Conference on Networking Sensing & Control, Taipei, China, 21–23 March 2004; pp. 1335–1340. [Google Scholar]
- Gunning, R. National competition policy and the Australian taxi industry. Aust. J. Publ. Adm. 2010, 55, 94–96. [Google Scholar] [CrossRef]
- Barrett, S.D. Regulatory capture, property rights and taxi deregulation: A case study. Econ. Aff. 2003, 23, 34–40. [Google Scholar] [CrossRef]
- Leng, B.; Du, H.; Wang, J.; Li, L.; Xiong, Z. Analysis of taxi drivers’ behaviors within a battle between two taxi apps. IEEE Trans. Intell. Transp. Syst. 2015, 17, 296–300. [Google Scholar] [CrossRef]
- Clark, P.J.; Evans, F.C. Distance to nearest neighbor as a measure of spatial relationships in populations. Ecology 1954, 35, 445–453. [Google Scholar] [CrossRef]


| Period | Duration | Didi | Kuaidi | ||
|---|---|---|---|---|---|
| Driver | Passenger | Driver | Passenger | ||
| 1 | Before 9 January | 0 | 0 | 0 | 0 |
| 2 | 10 January–16 February | 10 | 10 | 10 | 10 |
| 3 | 17 February–4 March | 10 (50 for new user) | 10–20 | 5–11 | 10–13 |
| 4 | 22 March–16 May | 10 | 3–5 | 5–11 | 3–5 |
| 5 | 17 May–8 July | 10 | 0 | 5–11 | 0 |
| 6 | After 10 August | 0 | 0 | 0 | 0 |
| Pick-up/Drop-off | Increase/Decrease | Neighboring Periods | ||||
|---|---|---|---|---|---|---|
| 1–2 | 2–3 | 3–4 | 4–5 | 5–6 | ||
| Pick-up | Increase | 2171 (26.37%) | 2535 (30.79%) | 2574 (31.27%) | 2263 (27.49%) | 2689 (32.67%) |
| Decrease | 2552 (31.00%) | 2201 (26.74%) | 2146 (26.07%) | 2451 (29.77%) | 2063 (25.06%) | |
| Drop-off | Increase | 1885 (22.90%) | 2914 (35.40%) | 2898 (35.20%) | 2332 (28.33%) | 2964 (36.01%) |
| Decrease | 3294 (40.01%) | 2245 (27.27%) | 2295 (27.88%) | 2858 (34.72%) | 2247 (27.30%) | |
| Period | Pick up/Drop off | Pattern | Count |
|---|---|---|---|
| n→n + 1 | Pick up | increase- decrease- increase- increase- increase | 15 |
| decrease- decrease- increase- decrease- increase | 10 | ||
| decrease- decrease- increase- increase- increase | 7 | ||
| decrease- increase- decrease- decrease- increase | 5 | ||
| decrease- increase- increase- increase- increase | 4 | ||
| decrease- increase- increase- decrease- increase | 4 | ||
| n→n + 1 | Drop off | decrease- decrease- increase- decrease- increase | 15 |
| increase- decrease- increase- increase- increase | 9 | ||
| decrease- decrease- increase- increase- increase | 7 | ||
| decrease- increase- decrease- decrease- increase | 5 | ||
| decrease- increase- increase- decrease- increase | 5 | ||
| 1→n | Pick up | decrease- decrease- decrease- decrease- decrease | 18 |
| decrease- decrease- increase- increase- increase | 9 | ||
| increase- increase- increase- increase- increase | 4 | ||
| increase- decrease- increase- increase- increase | 4 | ||
| decrease- increase- decrease- decrease- decrease | 4 | ||
| decrease- decrease- decrease- decrease- increase | 4 | ||
| 1→n | Drop off | decrease- decrease- decrease- decrease- decrease | 20 |
| decrease- decrease- increase- increase- increase | 9 | ||
| increase- increase- increase- increase- increase | 6 | ||
| increase- decrease- increase- increase- increase | 5 |
| Type | Mean | Standard Deviation |
|---|---|---|
| Increased pick up | 79.67 | 91.13 |
| Decreased pick up | 69.47 | 75.53 |
| Increased drop off | 74.52 | 94.63 |
| Decreased drop off | 68.75 | 75.48 |
| Type | Pattern | Count |
|---|---|---|
| Increased pick ups | decrease- increase- decrease- increase | 17 |
| decrease- increase- decrease- decrease | 9 | |
| decrease- increase- increase- decrease | 7 | |
| increase- decrease- decrease- increase | 6 | |
| increase- increase- decrease- increase | 6 | |
| increase- decrease- increase- increase | 5 | |
| Decreased pick ups | increase- decrease- increase- decrease | 16 |
| increase- decrease- increase- increase | 12 | |
| decrease- increase- decrease- decrease | 6 | |
| decrease- decrease- increase- decrease | 5 | |
| Increased drop offs | decrease- increase- decrease- increase | 19 |
| increase- increase- decrease- increase | 12 | |
| increase- decrease- decrease- increase | 7 | |
| increase- decrease- increase- increase | 5 | |
| decrease- increase- decrease- decrease | 5 | |
| Decreased drop offs | increase- decrease- increase- decrease | 18 |
| decrease- decrease- increase- decrease | 14 | |
| decrease- increase- increase- decrease | 7 |
© 2018 by the authors. Licensee MDPI, Basel, Switzerland. This article is an open access article distributed under the terms and conditions of the Creative Commons Attribution (CC BY) license (http://creativecommons.org/licenses/by/4.0/).
Share and Cite
Su, R.; Fang, Z.; Luo, N.; Zhu, J. Understanding the Dynamics of the Pick-Up and Drop-Off Locations of Taxicabs in the Context of a Subsidy War among E-Hailing Apps. Sustainability 2018, 10, 1256. https://doi.org/10.3390/su10041256
Su R, Fang Z, Luo N, Zhu J. Understanding the Dynamics of the Pick-Up and Drop-Off Locations of Taxicabs in the Context of a Subsidy War among E-Hailing Apps. Sustainability. 2018; 10(4):1256. https://doi.org/10.3390/su10041256
Chicago/Turabian StyleSu, Rongxiang, Zhixiang Fang, Ningxin Luo, and Jingwei Zhu. 2018. "Understanding the Dynamics of the Pick-Up and Drop-Off Locations of Taxicabs in the Context of a Subsidy War among E-Hailing Apps" Sustainability 10, no. 4: 1256. https://doi.org/10.3390/su10041256
APA StyleSu, R., Fang, Z., Luo, N., & Zhu, J. (2018). Understanding the Dynamics of the Pick-Up and Drop-Off Locations of Taxicabs in the Context of a Subsidy War among E-Hailing Apps. Sustainability, 10(4), 1256. https://doi.org/10.3390/su10041256