Provincial Carbon Emissions Reduction Allocation Plan in China Based on Consumption Perspective


Abstract
:1. Introduction
2. Literature Review
2.1. Previous Carbon Emission Reduction Task Allocation Research
2.2. Carbon Emission Allocation Plan Based on a Consumption-Based Perspective
3. Methodology and Data
3.1. Methodology
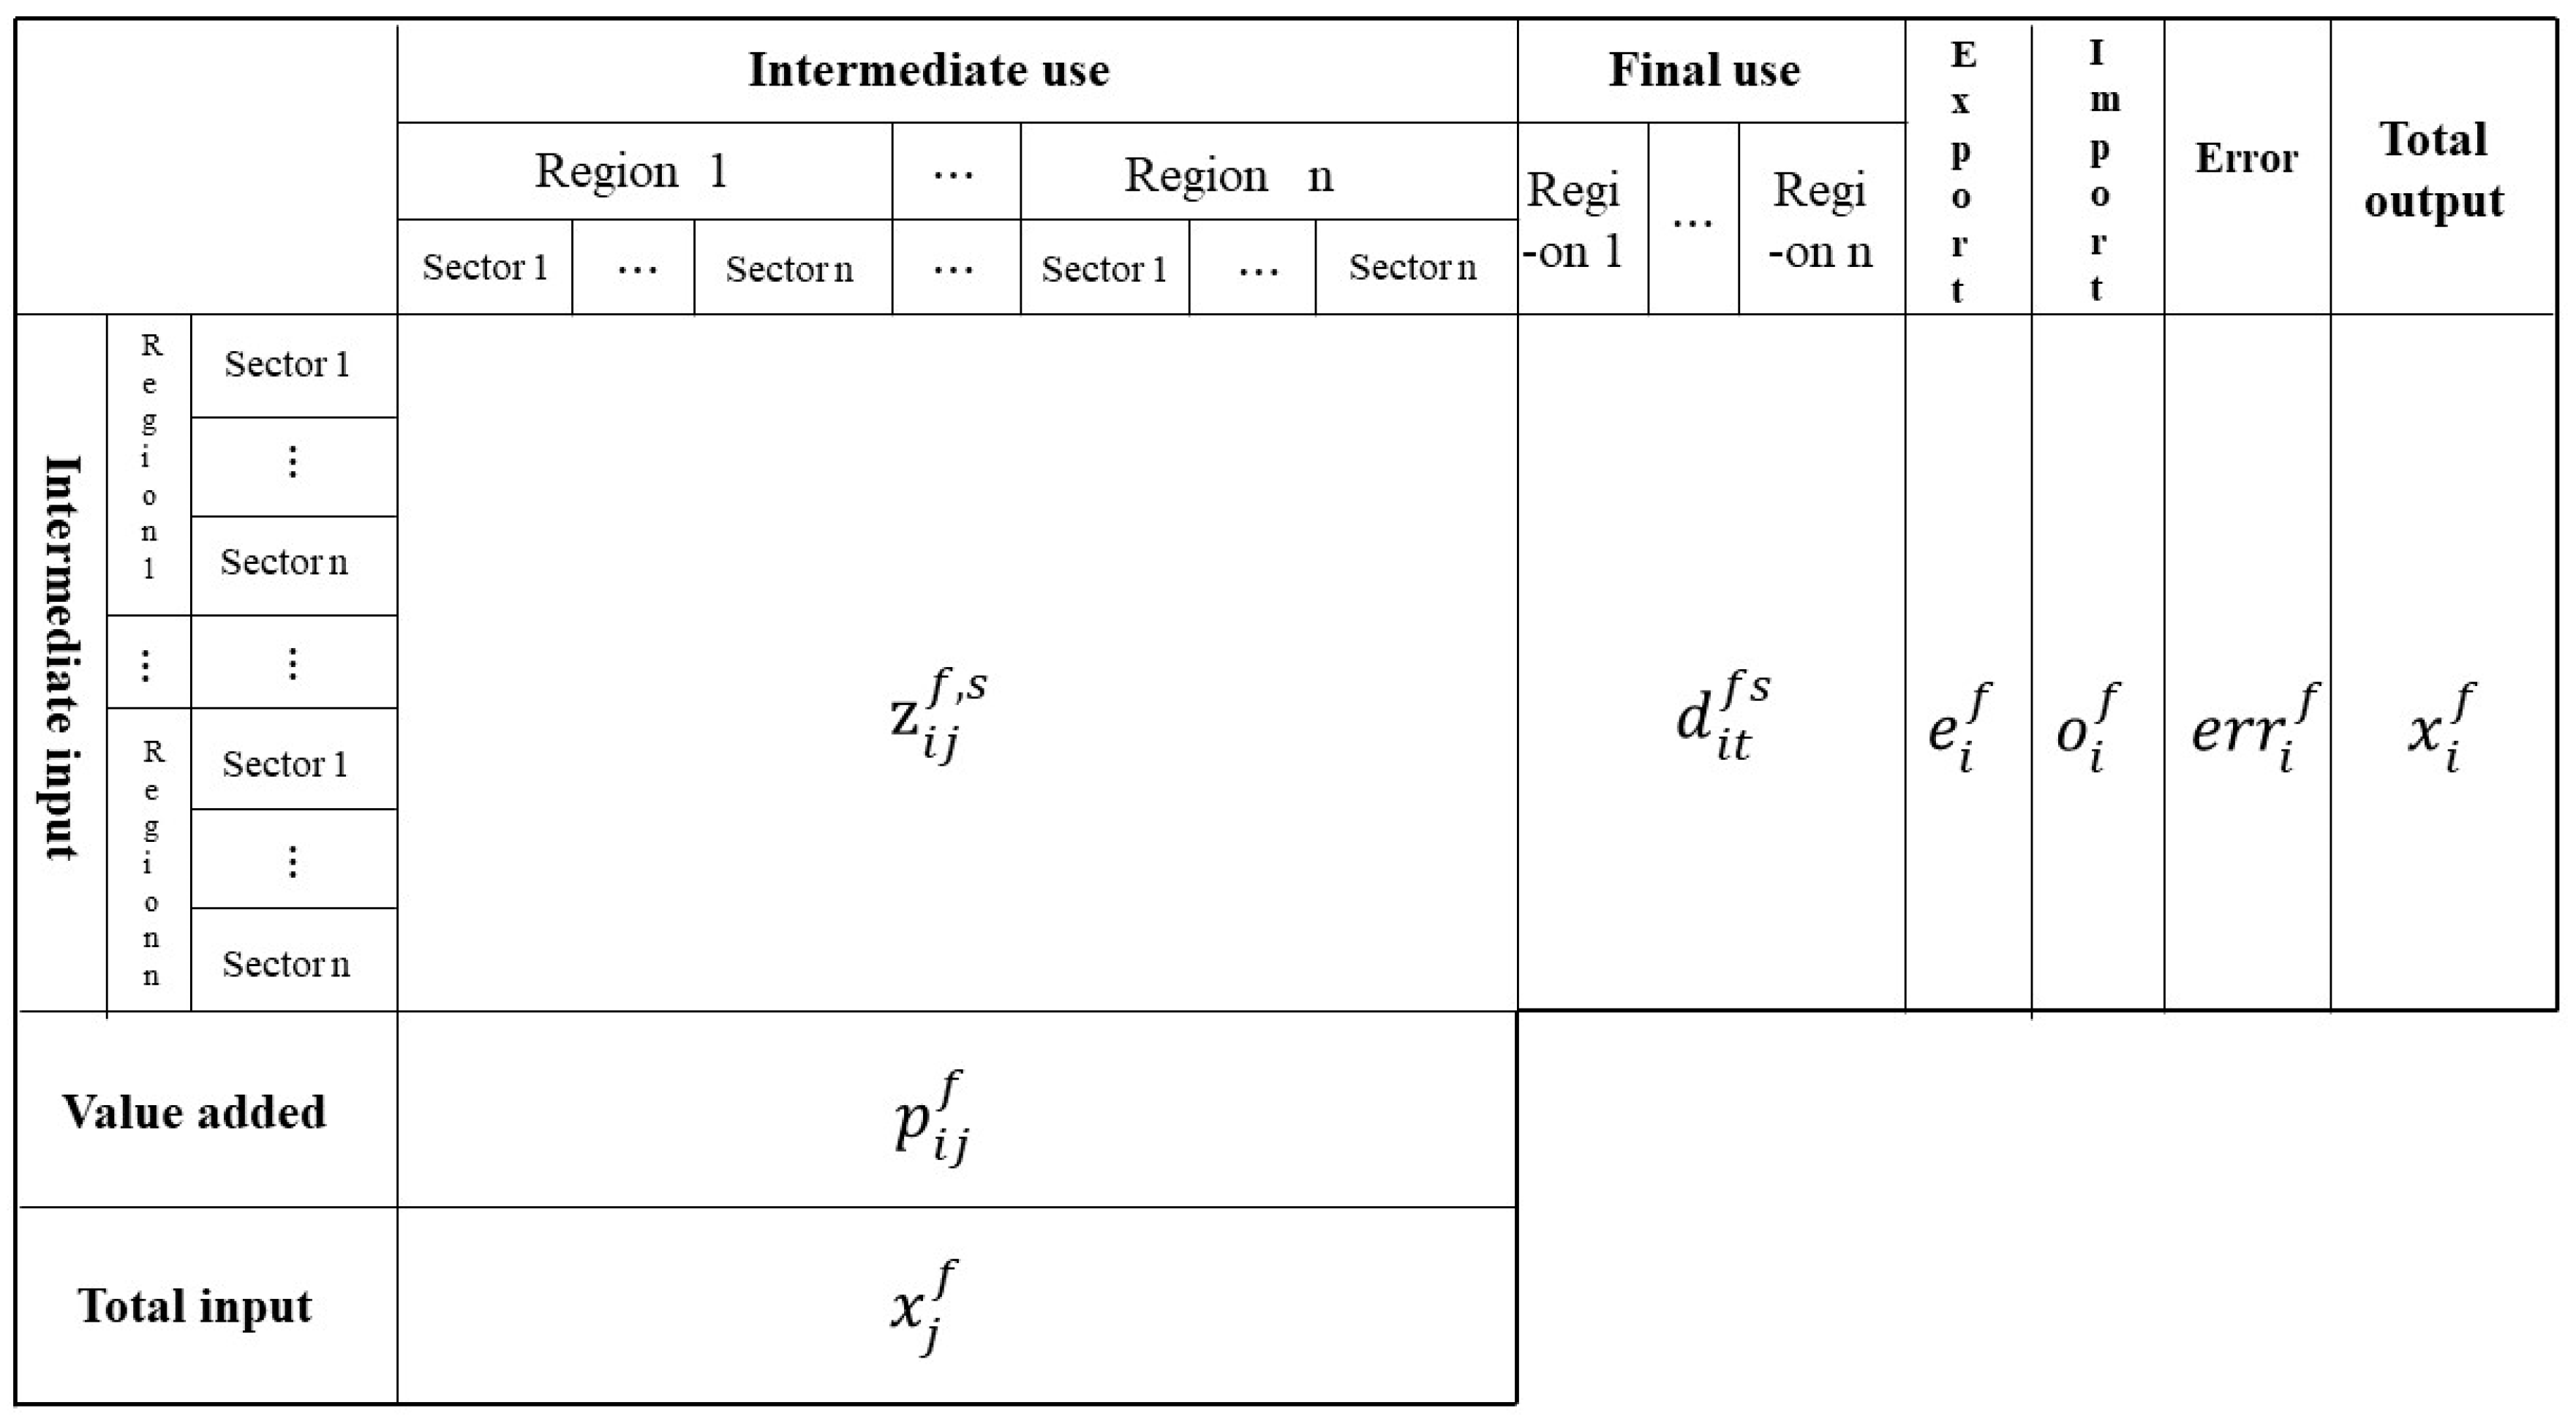
3.1.1. Multi-Regional Input-Output Model
3.1.2. Ecological Network Analysis
3.1.3. Carbon Emission Reduction Allocation Principle
3.2. Data
4. Results
4.1. The Characteristics of Energy Consumption and Carbon Emissions in Different Provinces of China
4.2. Emission Transfer Embodied in Provincial Trade
4.3. The Relationships among China’s 30 Provinces
4.4. A Carbon Emissions Reduction Allocation Plan Based on a Consumer Perspective
5. Discussion
5.1. Comparison between the Allocation Plan Proposed in This Paper and Previous Allocation Plan
5.2. The Challenges for Carrying out This Fair Carbon Emission Reduction Allocation Plan
6. Conclusions
- (1)
- There is a very large difference between China’s provinces when examining the data of direct energy consumption, direct carbon emission, and embodied carbon emissions. Owing to these differences, it is unreasonable to put some provinces with different carbon emission features in the same class, as shown in the China’s 13th Five-Year plan.
- (2)
- There are large ECE flows between China’s 30 different provinces, which reflects the causes of unfairness in the CER task allocation. The underdeveloped provinces, such as resource provinces (Shanxi, Inner Mongolia, etc.) and heavy industrial provinces (Liaoning, Hebei, etc.), tend to export larger amounts of ECE to developed regions than the volume of their imports, while developed provinces continue to take advantage from the interprovincial trade with less developed provinces by importing a large amount of ECE.
- (3)
- Control and exploitation relationships are the major relationships existing among China’s 30 provinces. For the developed provinces, the major relationship between them and other provinces is exploitation, which means they should take responsibility for this ecological relationship. The underdeveloped provinces, however, have the opposite situation. Therefore, developed provinces will undertake more responsibility for CER tasks and underdeveloped provinces will decrease part of the CER tasks in the new CER allocation plan.
Supplementary Materials
Author Contributions
Acknowledgments
Conflicts of Interest
Appendix A

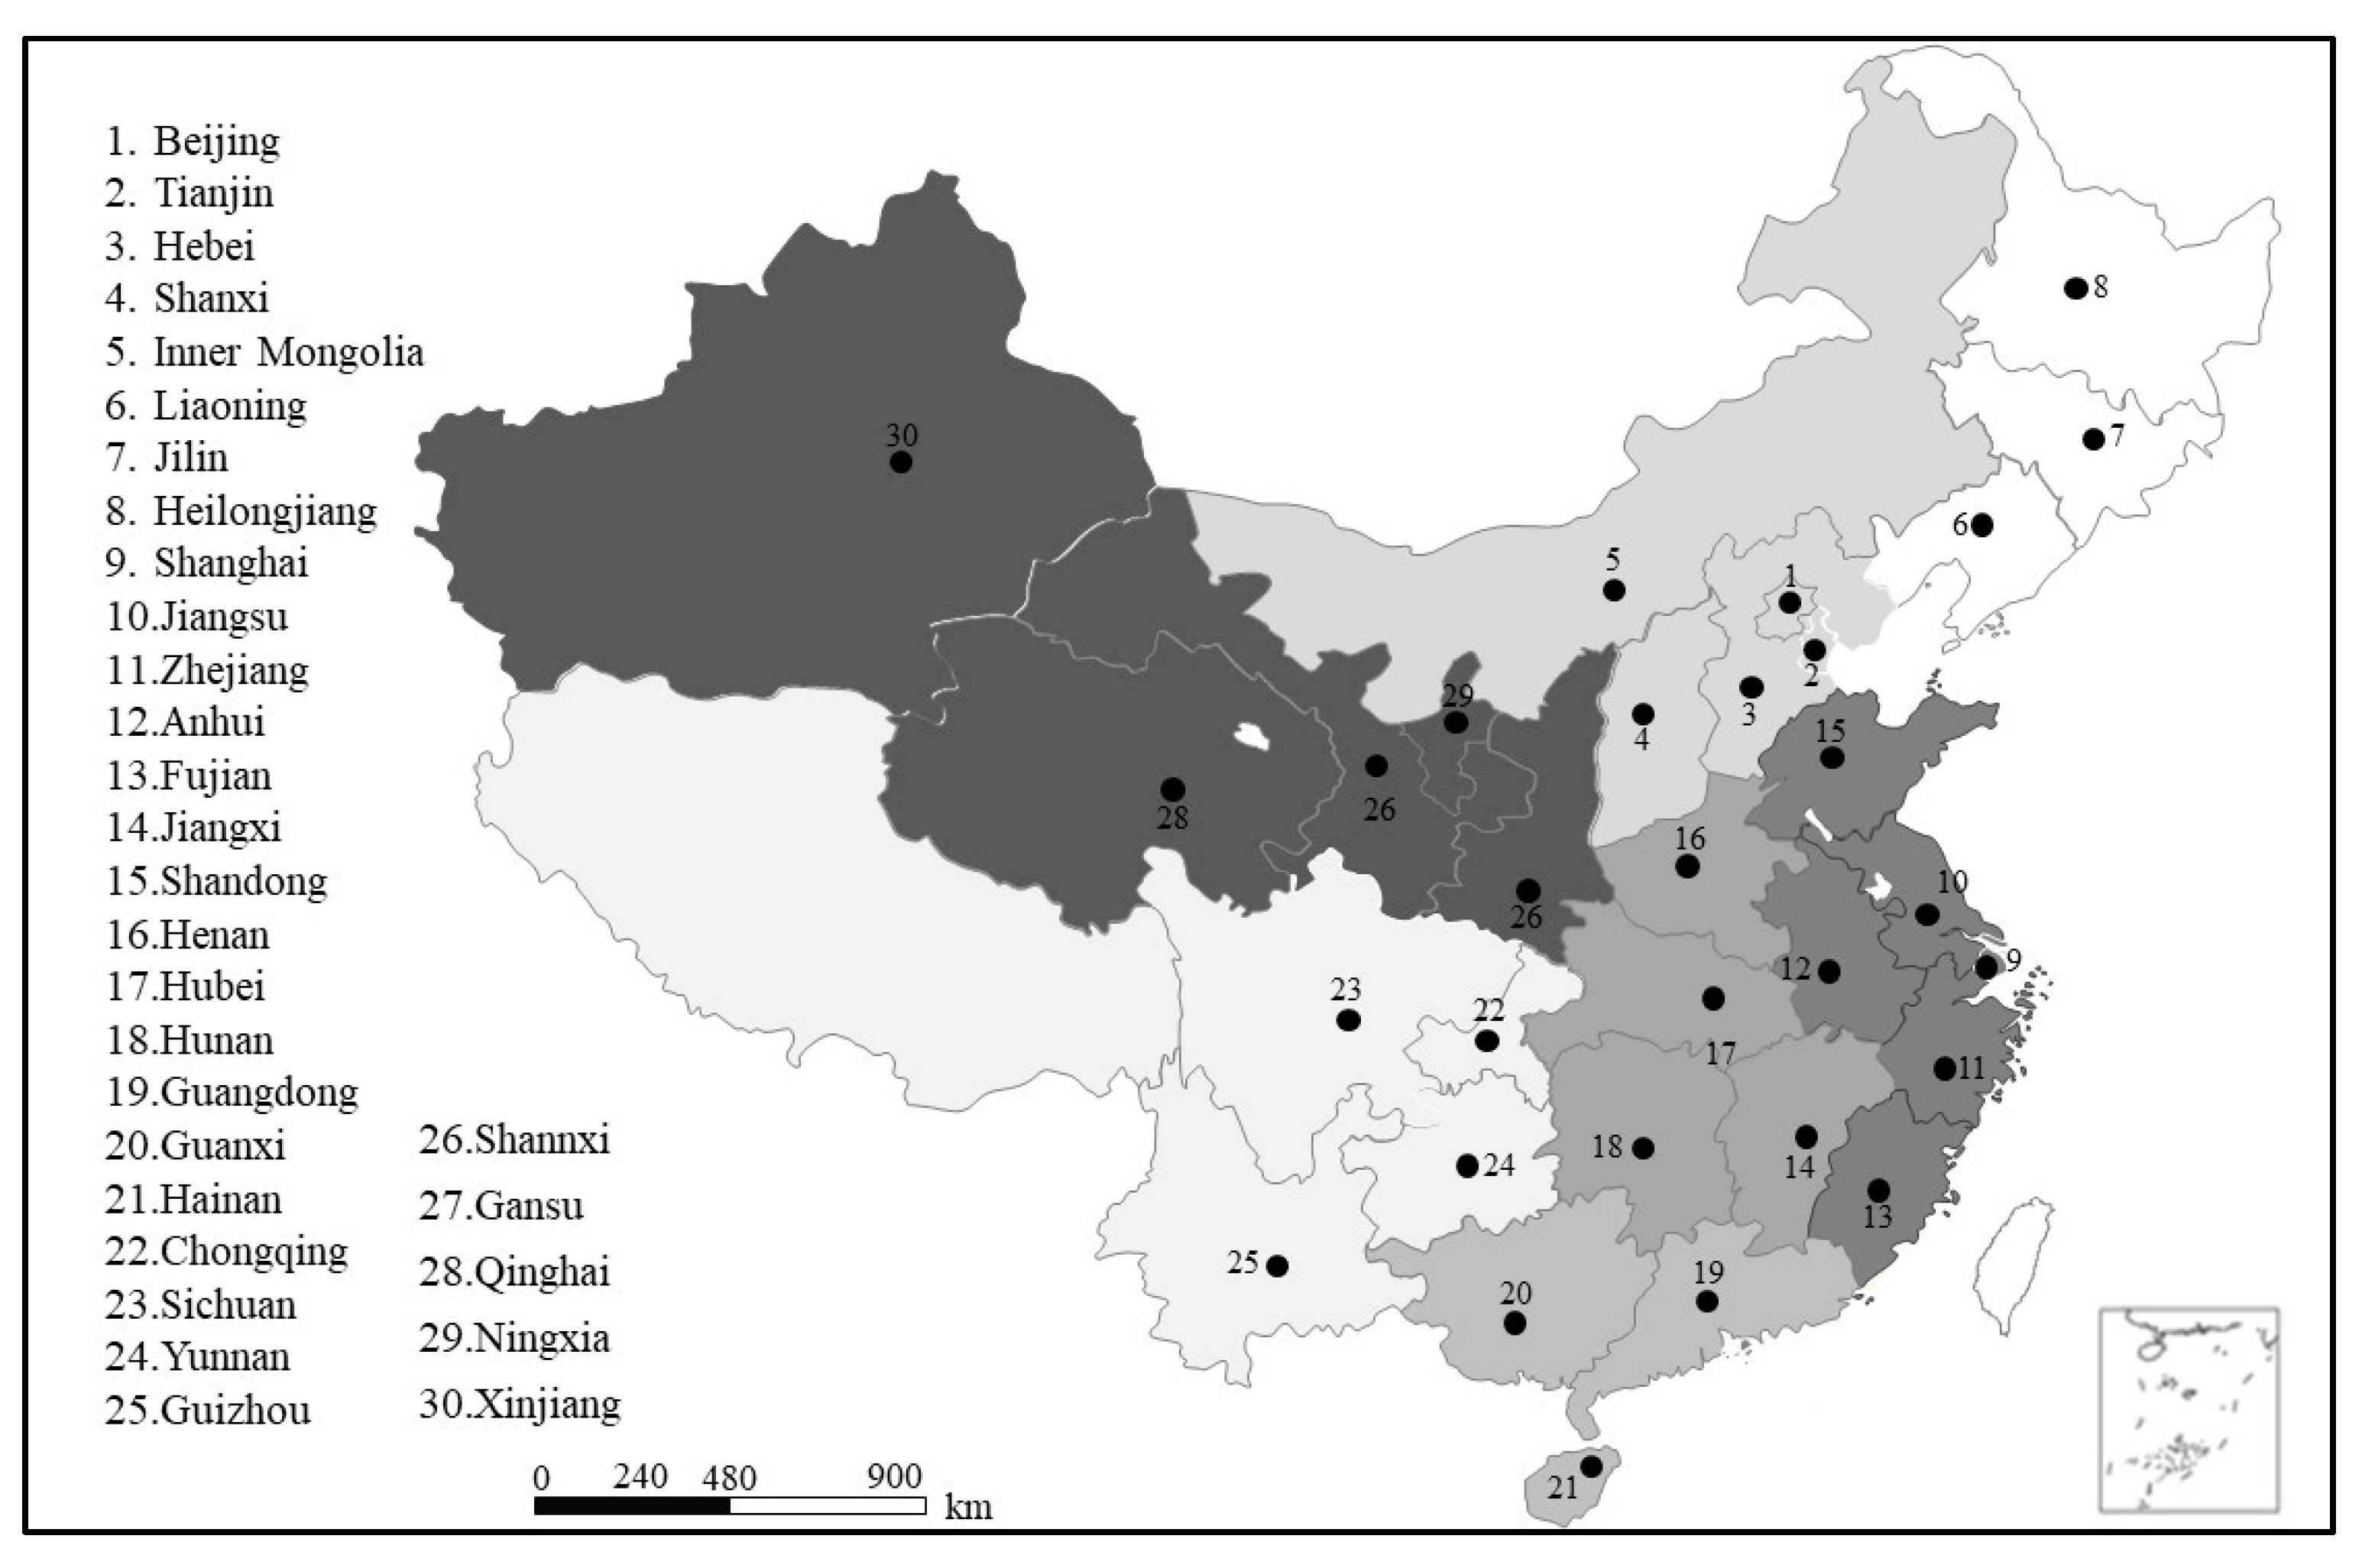
| Code | Province | Code | Province | Code | Province |
|---|---|---|---|---|---|
| 1 | Beijing | 11 | Zhejiang | 21 | Hainan |
| 2 | Tianjin | 12 | Anhui | 22 | Chongqing |
| 3 | Hebei | 13 | Fujian | 23 | Sichuan |
| 4 | Shanxi | 14 | Jiangxi | 24 | Guizhou |
| 5 | Inner mongolia | 15 | Shandong | 25 | Yunnan |
| 6 | Liaoning | 16 | Henan | 26 | Shannxi |
| 7 | Jilin | 17 | Hubei | 27 | Gansu |
| 8 | Heilongjiang | 18 | Hunan | 28 | Qinghai |
| 9 | Shanghai | 19 | Guangdong | 29 | Ningxia |
| 10 | Jiangsu | 20 | Guangxi | 30 | Xinjiang |
References
- Streck, C.; Unger, M.V.; Keenlyside, P. The Paris Agreement: A New Beginning. J. Eur. Environ. Plan. Law 2016, 13, 3–29. [Google Scholar] [CrossRef]
- Rogelj, J.; Den, E.M.; Höhne, N.; Fransen, T.; Fekete, H.; Winkler, H.; Schaeffer, R.; Sha, F.; Riahi, K.; Meinshausen, M. Paris Agreement climate proposals need a boost to keep warming well below 2 °C. Nature 2016, 534, 631–639. [Google Scholar] [CrossRef] [PubMed] [Green Version]
- World Bank. CO2 Emissions[EB/OL]; World Bank: Washington, DC, USA, 2017; Available online: https://data.worldbank.org/indicator/EN.ATM.CO2E.KT (accessed on 14 October 2017).
- Schreurs, M.A. The Paris Climate Agreement and the Three Largest Emitters: China, the United States, and the European Union. Politics Gov. 2016, 4, 219–223. [Google Scholar] [CrossRef]
- Liu, Z.; Davis, S.J.; Feng, K.; Hubacek, K.; Liang, S.; Anadon, L.D.; Chen, B.; Liu, J.; Yan, J.; Guan, D. Targeted opportunities to address the climate-trade dilemma in China. Nat. Clim. Chang. 2016, 6, 201–206. [Google Scholar] [CrossRef] [Green Version]
- Green, F.; Stern, N. China’s changing economy: Implications for its carbon dioxide emissions. Clim. Policy 2017, 17, 423–442. [Google Scholar] [CrossRef] [Green Version]
- Li, A.; Zhang, Z.; Zhang, A. Why are there large differences in performances when the same carbon emission reductions are achieved in different countries? J. Clean. Prod. 2015, 103, 309–318. [Google Scholar] [CrossRef]
- Chen, S.; Chen, B. Network Environ Perspective for Urban Metabolism and Carbon Emissions: A Case Study of Vienna, Austria. Environ. Sci. Technol. 2012, 46, 4498–4506. [Google Scholar] [CrossRef] [PubMed]
- Chen, J.; Cheng, S.; Song, M.; Wu, Y. A carbon emissions reduction index: Integrating the volume and allocation of regional emissions. Appl. Energy 2016, 184, 1154–1164. [Google Scholar] [CrossRef]
- Mckinnon, C. Climate Change and Future Justice: Precaution, Compensation, and Triage; Routledge: London, UK; New York, NY, USA, 2011. [Google Scholar]
- Steininger, K.W.; Lininger, C.; Meyer, L.H.; Muñoz, P.; Schinko, T. Multiple carbon accounting to support just and effective climate policies. Nat. Clim. Chang. 2015, 6, 35–41. [Google Scholar] [CrossRef] [Green Version]
- Maltais, A. Radically Non-Ideal Climate Politics and the Obligation to at Least Vote Green. Environ. Values 2013, 22, 589–608. [Google Scholar] [CrossRef]
- Mellema, G. Collective responsibility and contributing to an outcome. Crim. Justice Ethics 2006, 25, 17–22. [Google Scholar] [CrossRef]
- Feng, K.; Davis, S.J.; Sun, L.; Li, X.; Guan, D.; Liu, W.; Liu, Z.; Hubacek, K. Outsourcing CO2 within China. Proc. Natl. Acad. Sci. USA 2013, 110, 11654. [Google Scholar] [CrossRef] [PubMed] [Green Version]
- Ye, B.; Jiang, J.J.; Li, C.; Miao, L.; Tang, J. Quantification and driving force analysis of provincial-level carbon emissions in China. Appl. Energy 2017, 198, 223–238. [Google Scholar] [CrossRef]
- Cantore, N.; Padilla, E. Equality and CO2, emissions distribution in climate change integrated assessment modelling. Energy 2010, 35, 298–313. [Google Scholar] [CrossRef]
- Zhou, P.; Zhang, L.; Zhou, D.Q.; Xia, W.J. Modeling economic performance of interprovincial CO2, emission reduction quota trading in China. Appl. Energy 2013, 112, 1518–1528. [Google Scholar] [CrossRef]
- Walther, G.R.; Post, E.; Convey, P.; Menzel, A.; Parmesan, C.; Beebee, T.J.C.; Fromentin, J.M.; Hoegh-Guldberg, O.; Bairlein, F. Ecological responses to recent climate change. Nature 2002, 416, 389–395. [Google Scholar] [CrossRef] [PubMed]
- Miketa, A.; Schrattenholzer, L. Equity implications of two burden-sharing rules for stabilizing greenhouse-gas concentrations. Energy Policy 2006, 34, 877–891. [Google Scholar] [CrossRef]
- Geng, S.; Xu, C.; Lin, L.; Shoucheng, Z.; Guihuan, Y. Evaluation Framework of City’s Carbon Emission Reduction Responsibility. Energy Procedia 2017, 105, 3629–3635. [Google Scholar]
- Sun, L.; Wang, Q.; Zhou, P.; Cheng, F. Effects of carbon emission transfer on economic spillover and carbon emission reduction in China. J. Clean. Prod. 2016, 112, 1432–1442. [Google Scholar] [CrossRef]
- Yang, L.; Wang, J.; Shi, J. Can China meet its 2020 economic growth and carbon emissions reduction targets? J. Clean. Prod. 2016, 142, 993–1001. [Google Scholar] [CrossRef]
- Zhao, R.; Min, N.; Geng, Y.; He, Y. Allocation of carbon emissions among industries/sectors: An emissions intensity reduction constrained approach. J. Clean. Prod. 2016, 142, 3083–3094. [Google Scholar] [CrossRef]
- Yang, L.; Zhang, Q.; Ji, J. Pricing and carbon emission reduction decisions in supply chains with vertical and horizontal cooperation. Int. J. Prod. Econ. 2017, 191, 286–297. [Google Scholar] [CrossRef]
- Munksgaard, J.; Pedersen, K.A. CO2, accounts for open economies: Producer or consumer responsibility? Energy Policy 2001, 29, 327–334. [Google Scholar] [CrossRef]
- Lenzen, M.; Murray, J.; Sack, F.; Wiedmann, T. Shared producer and consumer responsibility—Theory and practice. Ecol. Econ. 2007, 61, 27–42. [Google Scholar] [CrossRef]
- Weber, C.L.; Peters, G.P.; Guan, D.; Hubacek, K. The contribution of Chinese exports to climate change. Energy Policy 2008, 36, 3572–3577. [Google Scholar] [CrossRef]
- Guan, D.; Peters, G.P.; Weber, C.L.; Hubacek, K. Journey to world top emitter: An analysis of the driving forces of China’s recent CO2 emissions surge. Geophys. Res. Lett. 2009, 36. [Google Scholar] [CrossRef]
- Minx, J.C.; Baiocchi, G.; Peters, G.P.; Weber, C.L.; Guan, D.; Hubacek, K. A “carbonizing dragon”: China’s fast growing CO2 emissions revisited. Environ. Sci. Technol. 2011, 45, 9144–9153. [Google Scholar] [CrossRef] [PubMed]
- Liu, Z.; Geng, Y.; Lindner, S.; Guan, D. Uncovering China’s greenhouse gas emission from regional and sectoral perspectives. Energy 2012, 45, 1059–1068. [Google Scholar] [CrossRef]
- Feng, K.; Siu, Y.L.; Guan, D.; Hubacek, K. Analyzing Drivers of Regional Carbon Dioxide Emissions for China. J. Ind. Ecol. 2012, 16, 600–611. [Google Scholar] [CrossRef]
- Shan, Y.; Liu, J.; Liu, Z.; Xu, X.; Shao, S.; Wang, P.; Guan, D. New provincial CO2, emission inventories in China based on apparent energy consumption data and updated emission factors. Appl. Energy 2016, 184, 742–750. [Google Scholar] [CrossRef] [Green Version]
- Li, K.; Lin, B. Economic growth model, structural transformation, and green productivity in China. Appl. Energy 2017, 187, 489–500. [Google Scholar] [CrossRef]
- Xie, R.; Hu, G.; Zhang, Y.; Liu, Y. Provincial transfers of enabled carbon emissions in China: A supply-side perspective. Energy Policy 2017, 107, 688–697. [Google Scholar] [CrossRef]
- Jiang, J.; Ye, B.; Xie, D.; Tang, J. Provincial-level carbon emission drivers and emission reduction strategies in China: Combining multi-layer LMDI decomposition with hierarchical clustering. J. Clean. Prod. 2017, 169, 178–190. [Google Scholar] [CrossRef]
- Hannon, B. The structure of ecosystems. J. Theor. Biol. 1973, 41, 535–546. [Google Scholar] [CrossRef]
- Fath, B.D.; Patten, B.C. Network synergism: Emergence of positive relations in ecological systems. Ecol. Model. 1998, 107, 127–143. [Google Scholar] [CrossRef]
- Zhang, Y.; Liu, H.; Li, Y.; Yang, Z.; Li, S.; Yang, N. Ecological network analysis of China’s societal metabolism. J. Environ. Manag. 2012, 93, 254–263. [Google Scholar] [CrossRef] [PubMed]
- Zhang, Y.; Li, S.; Fath, B.D.; Yang, Z.; Yang, N. Analysis of an urban energy metabolic system: Comparison of simple and complex model results. Ecol. Model. 2011, 223, 14–19. [Google Scholar] [CrossRef]
- Zhang, Y.; Zheng, H.; Yang, Z.; Su, M.; Liu, G.; Li, Y. Multi-regional input–output model and ecological network analysis for regional embodied energy accounting in China. Energy Policy 2015, 86, 651–663. [Google Scholar] [CrossRef]
- Zhang, Y.; Zheng, H.; Fath, B.D.; Liu, H.; Yang, Z.; Liu, G.; Su, M. Ecological network analysis of an urban metabolic system based on input–output tables: Model development and case study for Beijing. Sci. Total Environ. 2014, 468–469, 642–653. [Google Scholar] [CrossRef] [PubMed]
- Yang, S.; Fath, B.; Chen, B. Ecological network analysis of embodied particulate matter 2.5—A case study of Beijing. Appl. Energy 2016, 184, 882–888. [Google Scholar] [CrossRef]
- Zhang, Y.; Zheng, H.; Fath, B.D. Analysis of the energy metabolism of urban socioeconomic sectors and the associated carbon footprints: Model development and a case study for Beijing. Energy Policy 2014, 73, 540–551. [Google Scholar] [CrossRef]
- Gugumus, F. Possibilities and limits of synergism with light stabilizers in polyolefins 2. UV absorbers in polyolefins. Polym. Degrad. Stab. 2002, 75, 295–308. [Google Scholar] [CrossRef]
- Deveci, M.; Demirel, N.C.; John, R.; Özcan, E. Fuzzy multi-criteria decision making for carbon dioxide geological storage in Turkey. J. Nat. Gas Sci. Eng. 2015, 27, 692–705. [Google Scholar] [CrossRef]
- Yang, Z.Y.; Dong, W.; Wei, T.; Fu, Y.; Cui, X.; Moore, J.; Chou, J. Constructing long-term (1948–2011) consumption-based emissions inventories. J. Clean. Prod. 2015, 103, 793–800. [Google Scholar] [CrossRef]
- Davis, S.J.; Caldeira, K. Consumption-based accounting of CO2 emissions. Proc. Natl. Acad. Sci. USA 2010, 107, 5687. [Google Scholar] [CrossRef] [PubMed]
- Fath, B.D.; Killian, M.C. The relevance of ecological pyramids in community assemblages. Ecol. Model. 2007, 208, 286–294. [Google Scholar] [CrossRef]
- Park, J.; Sarkis, J.; Wu, Z. Creating integrated business and environmental value within the context of China’s circular economy and ecological modernization. J. Clean. Prod. 2010, 18, 1494–1501. [Google Scholar] [CrossRef]
- Yuan, Z.; Bi, J.; Moriguichi, Y. The circular economy: A new development strategy in China. J. Ind. Ecol. 2006, 10, 4–8. [Google Scholar] [CrossRef]
- Mathews, J.A.; Tan, H. Progress toward a circular economy in China. J. Ind. Ecol. 2011, 15, 435–457. [Google Scholar] [CrossRef]
- Nation Bureau of Statistics of China. Chinese Energy Statistical Yearbook 2013; China Statistics Press: Beijing, China, 2013.
- Liu, W.; Chen, J.; Tang, Z.; Liu, H.; Han, D.; Li, F. Theories and Practice of Constructing China’s Interregional. InputOutput Tables between 30 Provinces in 2007; Chinese Statistics Press: Beijing, China, 2012.
- Liu, W. Theories and Practice of Constructing China's Interregional. InputOutput Tables between 30 Provinces in 2012; Chinese Statistics Press: Beijing, China, 2017.
- Wellman, B. Network analysis: Some basic principles. Sociol. Theory 1983, 1, 155–200. [Google Scholar] [CrossRef]
- Zhang, C.; Zhou, K.; Yang, S.; Shao, Z. On electricity consumption and economic growth in China. Renew. Sustain. Energy Rev. 2017, 76, 353–368. [Google Scholar] [CrossRef]
- Geng, A.; Zhang, H.; Yang, H. Greenhouse gas reduction and cost efficiency of using wood flooring as an alternative to ceramic tile: A case study in China. J. Clean. Prod. 2017, 166, 438–448. [Google Scholar] [CrossRef]
- Meng, M.; Mander, S.; Zhao, X.; Niu, D. Have market-oriented reforms improved the electricity generation efficiency of China’s thermal power industry? An empirical analysis. Energy 2016, 114, 734–741. [Google Scholar] [CrossRef]


© 2018 by the authors. Licensee MDPI, Basel, Switzerland. This article is an open access article distributed under the terms and conditions of the Creative Commons Attribution (CC BY) license (http://creativecommons.org/licenses/by/4.0/).
Share and Cite
Wang, X.; Tang, X.; Zhang, B.; McLellan, B.C.; Lv, Y. Provincial Carbon Emissions Reduction Allocation Plan in China Based on Consumption Perspective. Sustainability 2018, 10, 1342. https://doi.org/10.3390/su10051342
Wang X, Tang X, Zhang B, McLellan BC, Lv Y. Provincial Carbon Emissions Reduction Allocation Plan in China Based on Consumption Perspective. Sustainability. 2018; 10(5):1342. https://doi.org/10.3390/su10051342
Chicago/Turabian StyleWang, Xuecheng, Xu Tang, Baosheng Zhang, Benjamin C. McLellan, and Yang Lv. 2018. "Provincial Carbon Emissions Reduction Allocation Plan in China Based on Consumption Perspective" Sustainability 10, no. 5: 1342. https://doi.org/10.3390/su10051342
APA StyleWang, X., Tang, X., Zhang, B., McLellan, B. C., & Lv, Y. (2018). Provincial Carbon Emissions Reduction Allocation Plan in China Based on Consumption Perspective. Sustainability, 10(5), 1342. https://doi.org/10.3390/su10051342